
Abstract
For the last four decades, policymakers have attempted to control the United States's high health care costs by reducing patients’ demand for care (e.g., by imposing managed-care restrictions or high costs on patients at the time of use). Yet studies based mostly on data from the public Medicare program, which covers mostly elderly Americans, suggest that supply (e.g., number of physicians or hospital beds) rather than demand drives aggregate service use and, hence, costs. Using variation between U.S. states in per enrollee Medicare spending versus per capita spending of all other (non-Medicare) individuals, we find that greater supply boosts costs for the entire population. Furthermore, we find that factors that suppress demand in the non-Medicare population do reduce non-Medicare health care spending, but simultaneously increase Medicare spending. This suggests that for a given supply of medical resources, suppressing demand for one group of patients may produce a compensatory increase in provision of care to those whose demand has not been suppressed. Health planning to assure adequate medical resources where they are needed while preventing excess supply where it is duplicative and wasteful is likely a more effective cost control strategy than the imposition of managed-care restrictions or imposing higher costs onto patients seeking care.
The relative roles of patients’ demand for care and the supply of medical resources (e.g., of hospital beds and physicians) in determining health care use has been long debated, including in the United States. Medical need (e.g., the prevalence of chronic disease) and individuals’ ability to pay for care (shaped by their health coverage and income, at least in nations without universal health care access) are the primary determinates of demand for medical services. Influential U.S. health economists have long stressed demand factors to argue for interventions that increase patient cost-sharing (and thereby curtail demand) like high deductible health plans, and managed care-style restrictions that constrain utilization, policies that have been emulated in some other nations.1–4 However, while patients’ illnesses and ability to pay for care affect care utilization at the individual level, neither generous health coverage (nor poor population health) can explain the United States’ extraordinarily high health spending.
Studies stretching back decades—primarily using Medicare data—have linked the regional supply of care (e.g., the number of hospital beds or physician density) with the utilization of care,5–11 a phenomenon sometimes termed “Roemer's law,” a label that stems from Milton Roemer's observation in the 1950s that “a hospital bed built is a hospital bed filled,” 8 at least when much of the population has health coverage. In the United States in the 1970s, concern that a burgeoning supply of medical resources would drive excessive use of medical services motivated health planning efforts, such as “certificate of need” (CON) laws that required demonstration of population health needs prior to approval of new investments in hospitals and other health care infrastructure. 12 A federal requirement that states have CON processes was repealed during the Reagan administration, however, and many states have since dropped their CON laws; those remaining have had limited potency and impact. 12
The fact that the United States does not have a larger supply of facilities or personnel (compared to peer nations) argues that supply may not be an important explanation of its high health expenditures. Yet differences in health financing mechanisms, wage levels, and other structural factors limit the inferences that can be drawn from transnational comparisons about the relationships between supply and demand and health care use (or spending). In contrast, analyses of regional variation in health spending within nations may yield more useful insights into the relative role of demand and supply factors10,11,13–16—and their interplay—in explaining medical care use and spending.
The United States has a multi-payer health care system, with both private health insurers (that cover much of the working-age population) and public programs (Medicare, which covers almost all Americans ages 65 and older, and Medicaid, which covers many low-income Americans) playing large roles in financing care. Much previous research has examined the drivers of regional variation in Medicare spending,10,11 although more recent research suggests that high regional spending for the Medicare population may not correlate with high spending by other payers.17–19
This lack of correlation in costs among populations could have several possible explanations. While supply factors (such as the regional availability of beds) may increase health care use among populations with different insurance types, demand factors (such as health coverage) might have opposing impacts in different populations. For instance, coverage loss is expected to reduce demand for care among the newly uninsured but may cause physicians and hospitals to increase the provision of services to those who remain insured.20,21 Indeed, a growing body of literature has shown that policies that increase (or reduce) demand for the non-elderly population by reducing (or increasing) the size of the uninsured population can shift care toward (or away from) the stably-insured Medicare population,21–23 presumably due to health care supply constraints and “induced demand”. 24 This work has led to the hypothesis that aggregate service utilization (i.e., how many services are “produced” society-wide) is determined predominantly by supply, whereas demand plays a larger role in determining the distribution of utilization (i.e., who receives the services),21,24 a thesis that requires further study.
In this study, we use comprehensive U.S. state-level health expenditure data to assess trends in the correlation between Medicare spending and all other U.S. health spending over the past three decades, and their respective drivers. Specifically, we explore whether factors that affect demand for care (e.g., health coverage and unemployment rates, and income levels) and supply factors (e.g., bed and physician supply) believed to be predictive of health care use and spending5,6,25–27 affect Medicare and total non-Medicare spending differently across states and within states over time.
Methods
Data
Our primary data source is the 1991–2020 State Health Expenditure Accounts (SHEA), 28 produced by the Center for Medicare and Medicaid Services’ (CMS) Office of the Actuary. The SHEA is updated intermittently (most recently in August 2022), and is described in depth elsewhere. 29 In brief, CMS actuaries calculate health expenditures disaggregated by payer and type of expenditure for each of the fifty states and the District of Columbia (hereinafter “states”) using data sources and methods similar to those used to generate the National Health Expenditure Accounts (NHEA). The SHEA provide both state-of-provider and state-of-residence estimates; we used the latter, which detail spending by where care recipients lived. The SHEA data only includes “personal health consumption” expenditures (PHC), that is, care provided to individual patients, excluding expenditures not assignable to individuals, such as those for insurers’ administrative costs, capital investments, and public health activities. We excluded calendar year 2020 given well-described anomalies in expenditures due to the COVID-19 pandemic.
We linked the SHEA with multiple data sources to examine the correlates of Medicare and non-Medicare health spending over time. We describe these sources in detail in the Appendix (Appendix eMethods). In brief, we estimated the state uninsurance rate for 1991–2007 by analyzing microdata from the Current Population Survey (CPS) Annual Social and Economic Supplement (ASEC) (n = 2,968,965 person-level records); for more recent years (2008–2019), we analyzed the larger American Community Survey (ACS), which first included health insurance questions in 2008 (n = 37,531,153 person-level records). We also analyzed the CPS ASEC (1991–2020) to calculate population-share by age group and unemployment rate, again by state and year (n = 5,224,205 person-level records). We gleaned data on median household income by state and year from the U.S. Census Bureau. 30 For data on hospital supply, we analyzed American Hospital Association (AHA) Annual Hospital Survey microdata (n = 172,321 hospital-year level records). We used data from the American Medical Association Master File (via the Human Resource and Service Administration's [HRSA] Area Health Resource Files [AHRF]) on active MDs (hereinafter “physicians”). To calculate nursing facility beds per capita, we analyzed Medicare provider-of-service (POS) microdata (n = 3,297,564 provider-level records). Finally, we used the Centers for Disease Control and Prevention's (CDC) WONDER database to extract state- and year-specific all-cause mortality, age-adjusted by the CDC using the 2000 U.S. census.
Measures
Our two major outcomes are Medicare's annual spending per enrollee (hereinafter “Medicare spending”) and health spending for all other individuals, defined as annual non-Medicare spending (including out-of-pocket spending) per non-Medicare-enrolled state resident (hereinafter “non-Medicare spending”). Medicare spending includes all Medicare-financed care, including traditional Medicare and Medicare Advantage. To calculate non-Medicare spending, we subtracted Medicare expenditures from total health expenditures (overall PHC and by category), which we divided by the number of state residents not enrolled in Medicare (calculated by subtracting state Medicare enrollment from the total state population, each provided in the SHEA). While most analyses examined overall PHC, some focused on hospital, physician, and nursing facility expenditures. We adjusted all cost figures to 2020 dollars using the Consumer Price Index for Urban Consumers (CPI-U).
In addition to overall non-Medicare spending, for sensitivity analyses we examined its two major components: per enrollee Medicaid and private health insurance (PHI) spending. PHI spending was available from 2001 onward and for overall PHC only, that is, not by category of care.
We examined six measures previously identified as correlates of state and national health spending,25,26,31,32 which we categorized as “demand” or “supply” variables. Our three demand variables were factors likely to affect patients’ ability to pay for, and hence demand, care, including median household income, the unemployment rate, and the uninsurance rate. Our three supply variables were physicians, hospital beds, and nursing facility beds, all per 1,000 population.
Analysis
To explore the relationship between Medicare and non-Medicare spending over the past 30 years, we examined scatter plots and bivariate linear regressions, calculated correlation coefficients (for 1991 and 2019), and drew maps showing states by quartile of Medicare and non-Medicare spending.
To examine whether demand and supply factors affect Medicare and non-Medicare spending differently, we performed separate multivariable linear regressions for each spending outcome and each demand-affecting and supply variable. We performed these regressions for 1991, for 2019, and then across the full 1991–2019 dataset with inclusion of year-fixed effects (FE) to account for secular trends in spending and with standard errors clustered at the state level. For the demand variables, we examined associations with total spending for either Medicare spending or all other (i.e., non-Medicare) spending; for supply variables, we examined associations only with the spending outcomes corresponding to the supply factor (i.e., the association between hospital spending and hospital bed supply; between physician spending and physician supply; and between nursing facility spending and nursing home bed supply). For all models, we included covariates to control for differences in underlying population health needs, including year- and state-specific population age (percent population aged 18–39, 40–64, 65–74, and 75 + years) and age-adjusted mortality rate per 100,000 population.
As a sensitivity analysis, we additionally examined within-state associations between Medicare and non-Medicare spending and demand factors (which may exhibit abrupt year-to-year changes) using multivariable linear regressions that included state-FE in addition to time-FE (“two-way” fixed effects), age, and mortality. This approach allowed for control of time-invariant differences between states that could affect health spending (we opted not to use two-way FE models for supply variables because a state's supply of inpatient beds and physicians changes little year to year). We further performed the state-FE regressions using three alternate model specifications. First, in addition to state FE, we clustered standard errors (SE) at the state level, a conservative statistical approach that can lead to “severely inflated” standard errors in some contexts. 33 Next, we dropped the year FE for our demand factor models (given recent work recommending against two-way FE models in most scenarios; 34 ), but added a continuous time-trend term, and performed regressions both with and without state-clustered SE.
Finally, for additional sensitivity analyses, we examined correlations between Medicaid, Medicare, and PHI per enrollee spending for the first and last year of available data, and repeated the regressions, examining demand and supply correlates of Medicaid and PHI spending per enrollee.
We used Stata SE 18 for all analyses and the spmap package 35 to produce maps. Analyses of CPS and ACS microdata used sampling weights provided by the Census Bureau that allow nationally representative estimates. The Institutional Review Board of the authors’ institutions do not consider analysis of de-identified, publicly available data to be human subject research.
Results
Our final dataset included data on 50 states plus the District of Columbia across 29 years (n = 1,479 state-year observations). Appendix Figure 1 provides trends in non-Medicare and Medicare per person spending (in 2020 U.S. dollars) from 1991 to 2019 for each state, and the median across states. Median non-Medicare spending rose steadily from $4,621 in 1991 to $9,316 in 2019, while median Medicare spending rose steeply from $5,944 in 1991 to $11,659 in 2010, and thereafter dipped and then rose slowly (to $11,964 in 2019).
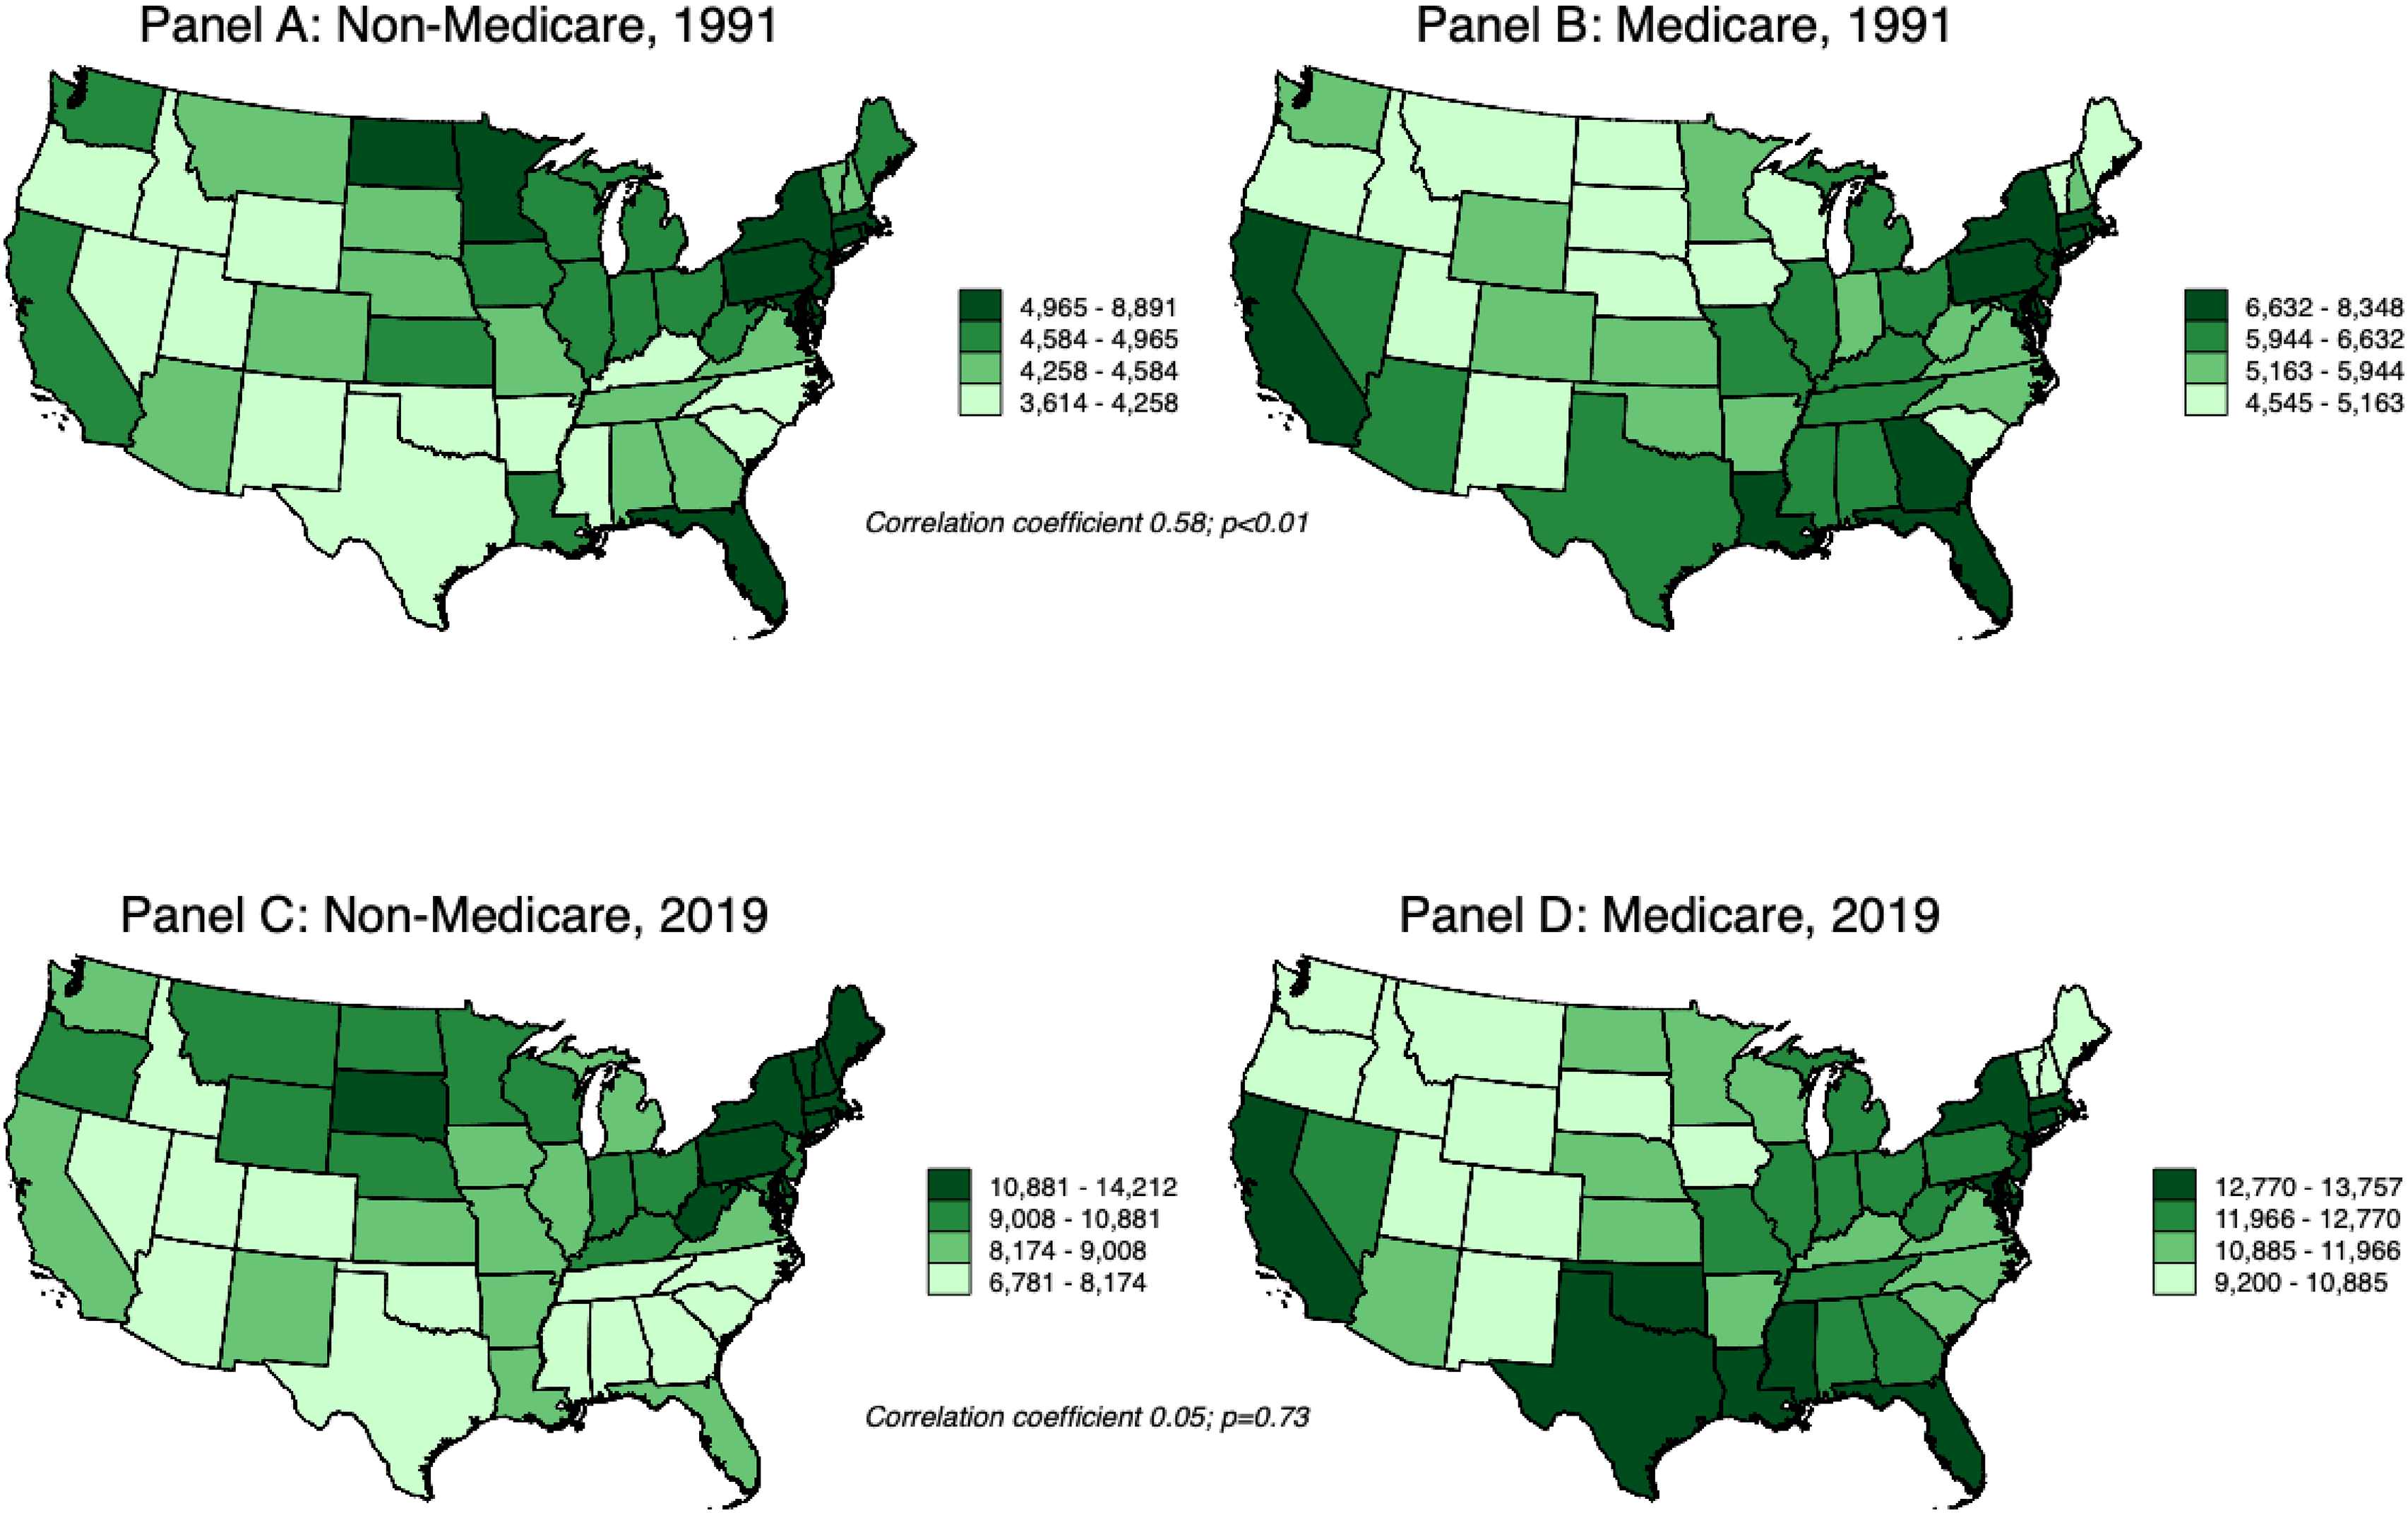
U.S. States by Medicare and Non-Medicare Personal Health Consumption (PHC) Expenditures per Person, 1991 and 2019. Notes: Spending is expressed in 2020 U.S. dollars, adjusted for inflation using the Consumer Price Index for Urban Consumers (CPI-U). Medicare Spending is per Medicare Enrollee; non-Medicare spending is per person not enrolled in Medicare. Maps exclude Alaska and Hawaii for purposes of presentation.
Figure 1 contains a map showing states by Medicare and non-Medicare spending quartile in 1991 and 2019 along with corresponding correlation coefficients (comparing spending for Medicare and non-Medicare enrollees) in those two years; Figure 2 shows scatter plots and linear regression lines illustrating the association between Medicare and non-Medicare spending for all states for each year. In 1991, Medicare and non-Medicare expenditures were strongly correlated (correlation coefficient 0.58; p < 0.05); of the 12 states in the top quartile of Medicare spending, nine were also in the top quartile of non-Medicare spending. This correlation weakened over time, and by 2019 was absent (correlation coefficient 0.05; p = 0.73). Of the 12 states in the top quartile of Medicare spending in 2019, half were below the median of non-Medicare spending.
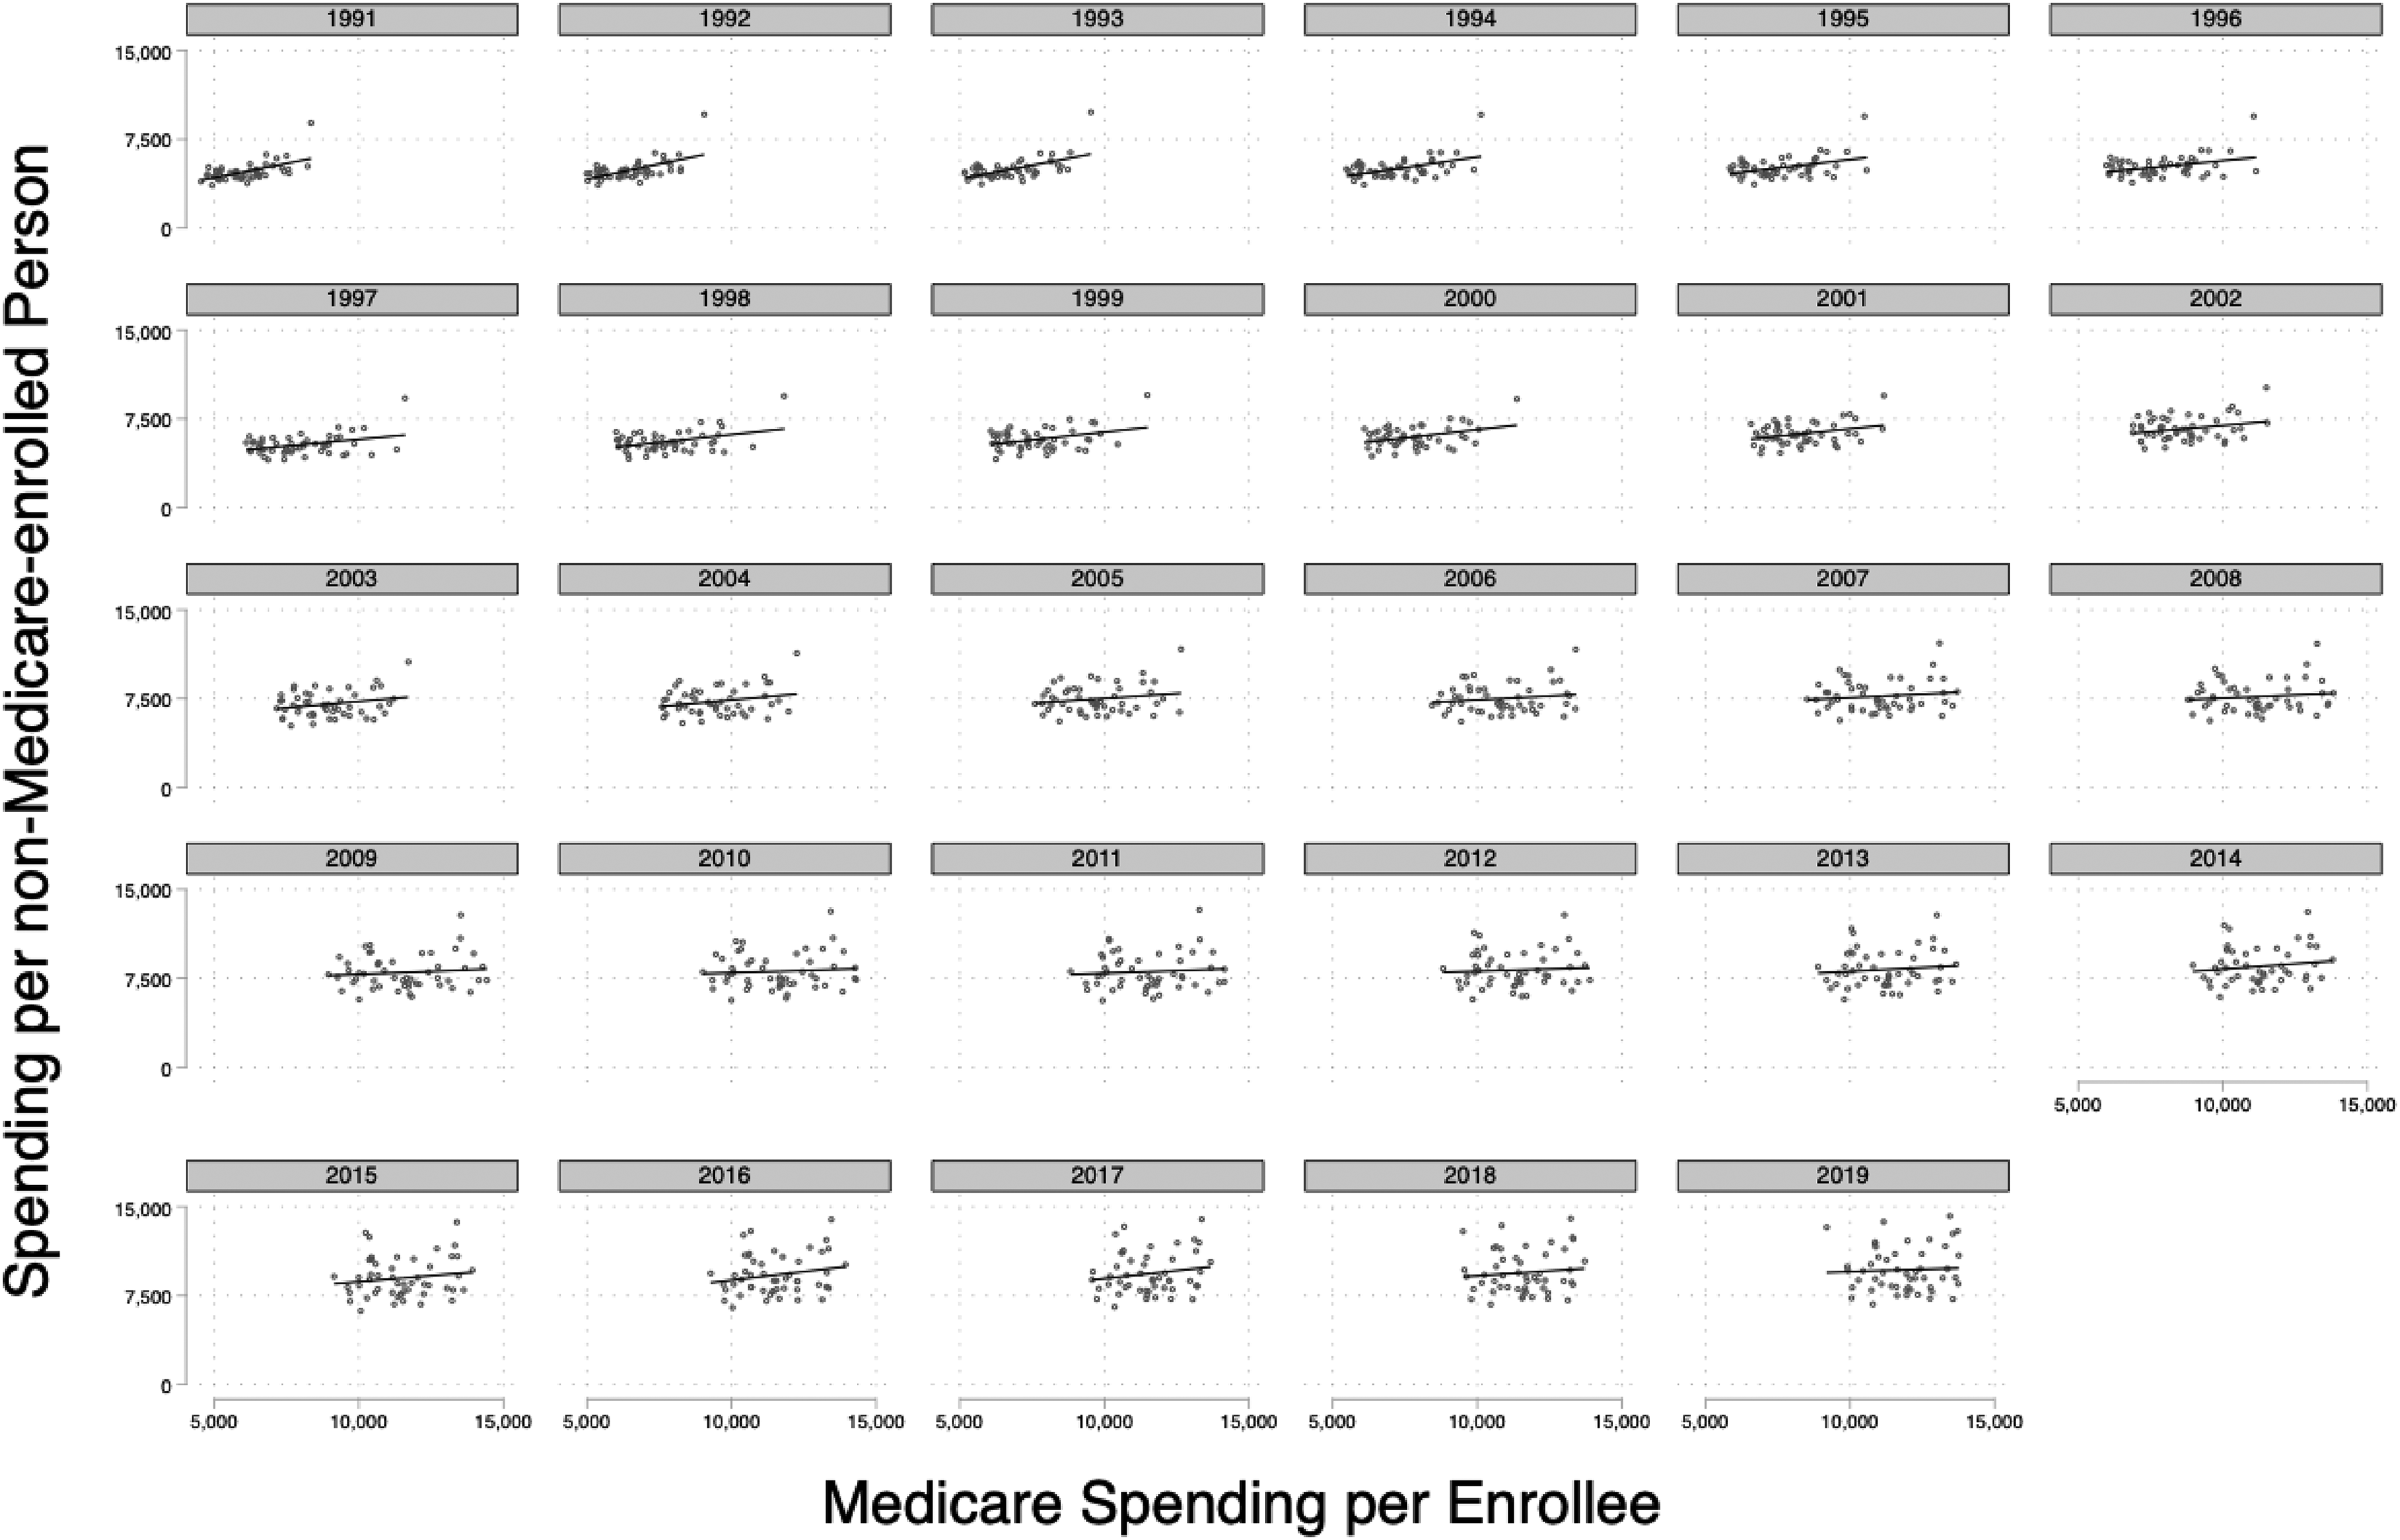
Univariate Association between Medicare Spending per Enrollee and non-Medicare Spending per non-Medicare enrolled Person for all Personal Health Consumption (PHC), 1991–2019. Notes: Spending is expressed in 2020 U. S. dollars, adjusted for inflation using the Consumer Price Index for Urban Consumers (CPI-U). Medicare Spending is per Medicare Enrollee; non-Medicare spending is per person not enrolled in Medicare.
Medicaid and Medicare spending per enrollee was not correlated in 1991 (correlation coefficient −0.07; p = 0.61) or 2019 (correlation coefficient −0.06, p = 0.66). A correlation between Medicare and PHI spending in 2001 (correlation coefficient = 0.46; p < 0.001) persisted but weakened over time (2019 correlation coefficient 0.32; p = 0.02).
Table 1 presents the results of multivariable regressions examining cross-sectional associations of demand and supply factors with Medicare, and (separately) non-Medicare spending for 1991, 2019, and repeat cross-section associations for 1991–2019 with time FE; Appendix Figures 3–7 provide scatter plots with univariate linear regression lines; and Appendix Table 1 provides the results of the two-way FE models with alternative specifications. In 1991, the uninsurance rate was not correlated with non-Medicare or Medicare spending. In contrast, by 2019, a one percentage point increase in the uninsurance rate was associated with a $224 decrease (95% CI -$392, -$55) in non-Medicare spending and a $139 increase (95% CI $33, $246) in Medicare spending per person. Similarly, across all years, the uninsurance rate was negatively associated with non-Medicare spending in both time FE and two-way FE models (p < 0.01), but positively associated with Medicare spending in the two-way FE model. Results were directionally consistent across alternative specifications of state FE models, but some coefficients were not significant.
Multivariable Regressions Examining Association of Demand and Supply Variables with Medicare and non-Medicare Spending, 1991 and 2019.
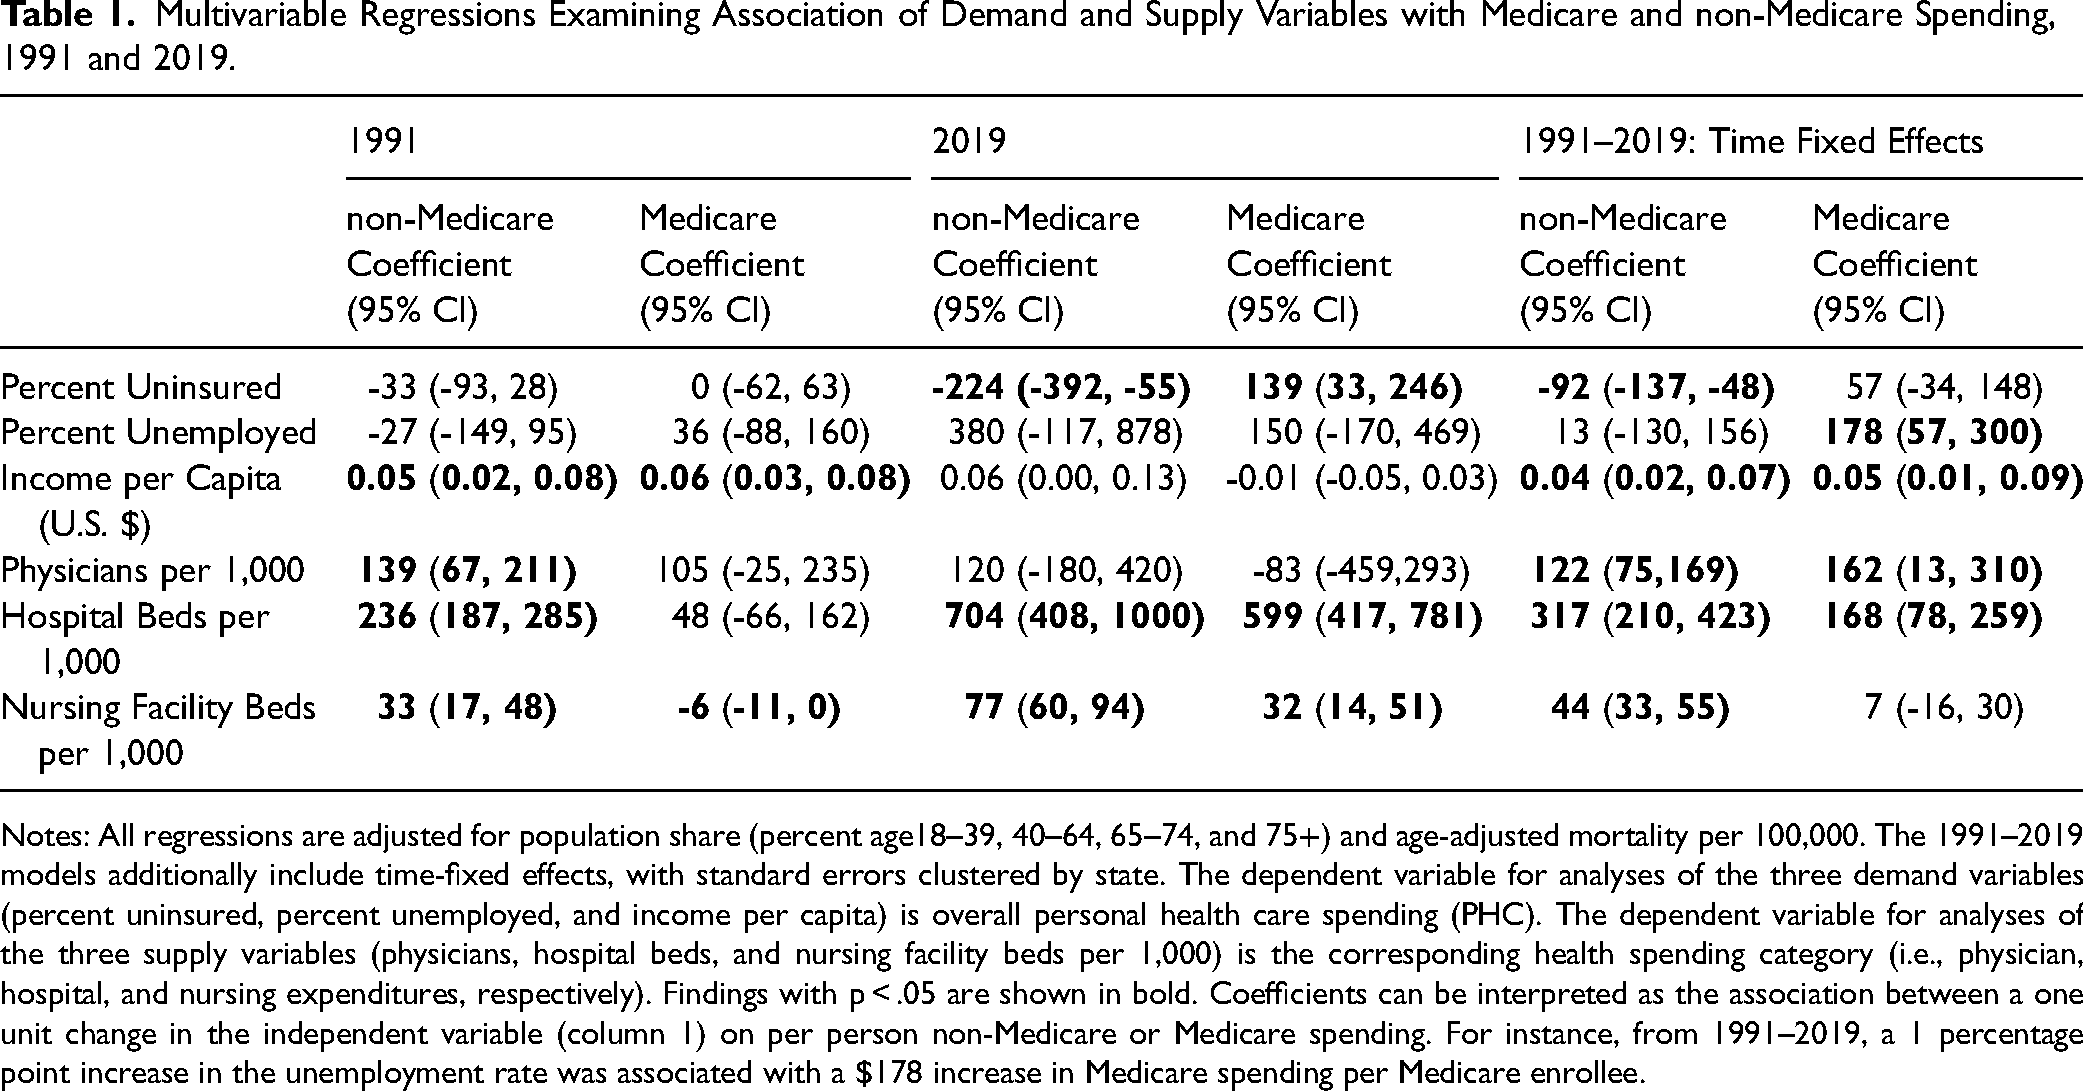
Notes: All regressions are adjusted for population share (percent age18–39, 40–64, 65–74, and 75+) and age-adjusted mortality per 100,000. The 1991–2019 models additionally include time-fixed effects, with standard errors clustered by state. The dependent variable for analyses of the three demand variables (percent uninsured, percent unemployed, and income per capita) is overall personal health care spending (PHC). The dependent variable for analyses of the three supply variables (physicians, hospital beds, and nursing facility beds per 1,000) is the corresponding health spending category (i.e., physician, hospital, and nursing expenditures, respectively). Findings with p < .05 are shown in bold. Coefficients can be interpreted as the association between a one unit change in the independent variable (column 1) on per person non-Medicare or Medicare spending. For instance, from 1991–2019, a 1 percentage point increase in the unemployment rate was associated with a $178 increase in Medicare spending per Medicare enrollee.
The unemployment rate was not associated with either spending outcome in 1991 or in 2019. However, across all years combined there was a positive and significant association between unemployment and Medicare spending in both time FE and two-way FE models. In the time FE model, for instance, a one percentage point increase in the unemployment rate was associated with a $178 increase in Medicare spending per capita (95% CI 57, 300). Conversely, unemployment was significantly associated with lower non-Medicare spending in the two-way FE model and all alternative state FE model specifications.
Higher income was associated with higher non-Medicare spending in both cross-sectional and state fixed effects models; in the 2019 model; however, the difference did not reach statistical significance. The association between income and Medicare spending was positive in 1991 and in the time FE model encompassing 1991–2019, but negative in most state FE models.
Supply variables were, as expected, mostly associated with higher spending both for the Medicare and non-Medicare population. For example, across 1991–2019, an increase of one physician per 1,000 population was associated with a $122 (95% CI 75, 169) increase in non-Medicare physician spending and a $162 (95% CI 13, 310) increase in Medicare physician spending per person. Similarly, an increase of one hospital bed per 1,000 population was associated with a $317 (95% CI 210, 423) increase in non-Medicare hospital spending and a $168 (95% CI 78, 259) increase in Medicare hospital spending. Nursing home supply was consistently positively associated with non-Medicare spending, but the relationship with Medicare spending was inconsistent.
Appendix Tables 2 and 3 provide data on the demand and supply correlates of Medicaid per enrollee expenditures. Medicaid spending on hospital and nursing home care was significantly associated with the supply of beds. Medicaid spending was negatively associated with uninsurance in 1991–2019, but otherwise was not associated with uninsurance or unemployment in cross-sectional models; in two-way fixed effects models, uninsurance was positively associated, and unemployment negatively associated with Medicaid per enrollee spending, in some but not all specifications.
Appendix Tables 4 and 5 show results from analyses examining correlates of per enrollee PHI spending. Physician and hospital supply was significantly associated with PHI PHC spending in 2001 and 2019, and for physician supply across 2001–2019. Unemployment appeared positively correlated with PHI per enrollee spending, but the association was significant in only some models. Median income was associated with PHI spending in some but not all models. There was an inconsistent relationship between uninsurance and PHI spending across models.
Discussion
Our analysis has two principal findings. First, the regional correlation between Medicare and total non-Medicare spending present thirty years ago is no longer apparent, suggesting that spending on the two populations have at least some distinct drivers today; however, Medicare spending remained moderately correlated with PHI (but not Medicaid) spending. Second, whereas health care supply (i.e., beds and physicians) had a generally positive correlation with both Medicare and non-Medicare spending, two “demand” factors (unemployment and uninsurance) showed opposite associations with Medicare and non-Medicare spending. These findings support the conclusion that a more ample supply of medical resources leads to increased health care costs, while factors that affect the demand for care shift spending between populations. That is, when one segment of the population becomes less able to afford care because their coverage or income declines, utilization of care increases among those not affected by such declines.
Regional differences in health care use and spending have been described in diverse contexts since at least the 1930s. 36 In the United States, Dartmouth researchers (initially led by John Wennberg) described substantial small area variation in Medicare spending without apparent effects on population health.11,16 A recent analysis of the SHEA similarly described large variations in per capita health spending among U.S. states. 25 One interpretation of this literature suggests that medical practice styles and medical culture are primary drivers of high regional health care spending. 37
However, our study and others indicate that the definition of a high-cost region depends on the payer; we found that at present, states in the top quartile of Medicare spending are as likely to be below as above the median in non-Medicare spending. That finding is consistent with two analyses by Cooper and colleagues encompassing spending for persons with private insurance as well as those with Medicare.17,19 A distinctive feature of our analysis, however, is that it encompasses total non-Medicare spending—not solely spending for individuals with specific types of health coverage—an approach that may avoid bias arising from state-based differences in the affordability of private coverage or the breadth of eligibility for Medicaid that affects the average health of enrollees (and consequently per enrollee spending) but that does not reflect local medical culture or other delivery factors. Consequently, the inconsistent associations we observed between demand factors and PHI and Medicaid spending (per enrollee) may reflect the fact that these factors affect not only demand for care by these populations but also who is covered by these programs and, hence, their average level of illness and need for care.
Structural economic factors may have important effects on the volume and cost of medical services. Our finding that higher uninsurance and unemployment rates are correlated with lower non-Medicare spending is in keeping with previous findings that insurance coverage27,38 and income31,39 are linked to higher health care use; when care is more affordable, individuals tend to use more of it. While it is less intuitive as to why, as our findings suggest, higher rates of uninsurance and unemployment might increase Medicare spending, those findings are also consistent with previous analyses. Glied and Hong found that pre-ACA state Medicaid expansions (which reduced uninsurance) led to reductions in health care utilization by the Medicare population 21 ; another analysis found that state Medicaid expansions were associated with reduced (low value) Medicare spending. 22 Two studies23,32 found that higher unemployment rates were associated with increased provision of care to Medicare beneficiaries. The investigators in each of these studies suggested that increased health care use by the non-Medicare population due to coverage expansion may lead physicians (whose supply is constrained) to provide slightly less care to their stably insured Medicare populations, and that shrinking non-Medicare coverage would have the opposite effect. 24 It also seems possible that deferred care in middle age due to lack of access could lead to greater illness burden and care use, or at least acute care use, among those who survive to become eligible for Medicare at age 65.
While demand factors appeared to have slightly different effects on Medicare and non-Medicare spending, a greater supply of beds and doctors was, in most instances, correlated with increased spending by both Medicare and other payers. John Wennberg described this phenomena as the “dominating importance of supply characteristics in explaining between-market variations”. 10 Although our study was not designed to examine whether residents of states with greater supply receive more useful, high-value care, or merely more unnecessary, low-value care, previous analyses suggest that they probably receive more of both. 40
Our study has limitations. While SHEA estimates utilize standard methods and numerous data sources, uncertainty in such estimates is inevitable. To estimate state-level uninsurance rate, we used two different Census Bureau surveys, which provide the most reliable data available for each year but used slightly different measures of coverage; these two measures, however, have been found to track closely at the national level. 41 Our study was not designed to explore why the correlation of Medicare spending with non-Medicare spending diminished over time. The issue of changing payment rates (or prices), which we did not study, may be relevant. Recent decades have seen growing divergence in payment rates between public and private payers 42 ; differential changes in private insurance prices in response to regionally variant provider consolidation could be one factor at play. (Consolidation would not likely affect Medicare prices, which are regulated by the federal government.) Finally, some of the spending categorized as “non-Medicare” includes spending by or on behalf of Medicare-enrolled individuals (i.e., out-of-pocket spending or spending by supplemental “Medigap” plans). However, these sums likely account for a small portion of non-Medicare spending. While we considered median household income a determinant of demand for care, it likely has other effects on health care spending via its effect on health care workers’ wages. Finally, by focusing on states, we were able to leverage longitudinal SHEA data on total regional population health expenditures; additional insights, however, might be garnered from analyses at smaller geographical levels.
In summary, U.S. Medicare and non-Medicare costs are no longer correlated at the regional level; consequently, policies focused on reducing Medicare spending may have a limited impact on non-Medicare spending and vice versa. More broadly, our findings suggest that while a larger supply of hospital beds and physicians likely increase both types of spending, fluctuations in demand (e.g., due to coverage contraction or expansion) may cause redistributions of care between stably insured (i.e., Medicare) and less stably insured (i.e., non-Medicare) populations. Consequently, policies designed to produce savings by reducing demand for care for one subpopulation (e.g., high-deductible health plans or utilization controls such as those imposed by managed care plans) may result in offsetting increases in care use by others, and hence yield little savings system-wide due. Our results therefore underscore the primacy of supply as a driver of aggregate health care utilization and of demand as a determinant of the distribution of utilization, with implications for insurance design and cost containment efforts in many nations. Health planning—not efforts to restrict patients’ demand for care by imposing financial or other barriers to access—may be the more effective, and just, health care cost policy lever.
Supplemental Material
sj-docx-1-joh-10.1177_27551938241258399 - Supplemental material for Demand and Supply Drivers of Medicare and Non-Medicare Health Spending: An Analysis of U.S. States, 1991–2019
Supplemental material, sj-docx-1-joh-10.1177_27551938241258399 for Demand and Supply Drivers of Medicare and Non-Medicare Health Spending: An Analysis of U.S. States, 1991–2019 by Adam Gaffney, Danny McCormick, Gracie Himmelstein, Steffie Woolhandler and David U. Himmelstein in International Journal of Social Determinants of Health and Health Services
Footnotes
Declaration of Conflicting Interests
The authors declared the following potential conflicts of interest with respect to the research, authorship, and/or publication of this article: Dr. Gaffney is a former president Physicians for a National Health Program (PNHP), a non-profit organization that favors coverage expansion through a single payer program. Adam Gaffney's spouse is an employee of Treatment Action Group (TAG), a non-profit research and policy think tank focused on HIV, TB, and hepatitis C treatment.
Funding
The authors received no financial support for the research, authorship, and/or publication of this article.
Supplemental Material
Supplemental material for this article is available online.
Author Biographies
References
Supplementary Material
Please find the following supplemental material available below.
For Open Access articles published under a Creative Commons License, all supplemental material carries the same license as the article it is associated with.
For non-Open Access articles published, all supplemental material carries a non-exclusive license, and permission requests for re-use of supplemental material or any part of supplemental material shall be sent directly to the copyright owner as specified in the copyright notice associated with the article.