
Abstract
We use staggered difference-in-differences and panel data methods to study the factors that predict medical malpractice (“med mal”) insurance premia, using national data on three specialties (internal medicine, general surgery, ob-gyn) from Medical Liability Monitor over 1992 to 2017. A difference-in-differences analysis of states that adopted caps during our sample period provides evidence supporting a causal link between cap adoption and higher premia, lower direct costs (payouts plus defense costs), and thus much higher profitability (proxied by the premium-to-direct-cost ratio). The savings to insurers from lower direct costs, following damage cap adoption, are at most partially reflected in premia even over long time periods. Instead, insurers in new-cap states have been able to charge apparently supra-competitive prices for a sustained period. In the panel data analysis, we estimate long run elasticities of premia to direct cost, allowing for lags of up to four years, of only around +0.40, when one might expect elasticities near one. Also, the premium-to-cost ratio, which one might expect in competitive markets to be fairly constant over time, varies widely both across states at a given time and within states across time.
1. Introduction
This paper raises puzzles with regard to the operation of the market for medical malpractice (“med mal”) insurance, but does not find convincing answers for them. We study how insurers price med mal insurance sold to physicians, using both: (i) staggered difference-in-differences (DiD) analysis of the states that adopt caps on non-economic damages (“damage caps”); and (ii) panel data analysis of the factors that predict med mal premia, using data on premia over 1992-2017 from Medical Liability Monitor (MLM). In the DiD analysis, cap adoption predicts higher premia, substantially lower insurer costs, and thus a much higher ratio of premia to direct cost (“Premium/Cost Ratio”). In the panel data analysis, we assess the extent to which damage caps are associated with premia for the three specialties for which MLM collects data: general surgery, internal medicine, and obstetrics and gynecology (ob-gyn).
We report a number of results that are in tension with standard economic theory for how med mal insurance should be priced in the long run, in reasonably competitive markets. First, premia are higher in states with damage caps, controlling for costs, in both the DiD and panel data analyses. Yet in a competitive market, damage caps should affect premia principally through their effect on costs, and should have little or no additional predictive effect. Second, premia are only loosely connected to insurer costs direct costs (measured at the state*year level as the sum of payouts and defense costs), even over long periods. In the DiD analysis, premia do not meaningfully decline over a 10-year period after cap adoption, despite large post-adoption drops in insurers’ direct costs. In the panel data analysis, we estimate long run elasticities of premia to insurers’ direct costs, allowing for lags of up to four years, of only around +0.40, when one might expect elasticities near one.
Third, one might expect the Premium/Cost Ratio to be fairly constant over time. Insurers need to charge enough to cover their direct costs, plus administrative costs (which should be predictable and slowly varying), and earn a normal return on capital. Competition, including both new entry and the threat of entry, should constrain the return on capital to a normal level, at least over time. In the DiD analysis, however, we find that the Premium/Cost ratio rises substantially after cap adoption and remains elevated 10 years after cap adoption. In the panel data analysis, the Premium/Cost Ratio varies widely both across states at a given time and within states across time and can be much higher in some states than others for sustained periods, even in larger states with a reasonable number of competitors.
As background, there have been three periods since 1970 in which med mal premia have risen sharply – the mid-1970s, the mid-1980s, and the early 2000s (see the overviews in Baker, 2005a; Black et al., 2021). Physicians and insurers have blamed each spike on rising payouts (not always accurately) and have persuaded many state legislatures to limit med mal lawsuits in various ways. Damage caps are the most important but not the only such reform.
Much research has focused on how malpractice liability and damage caps affect healthcare markets, including physicians’ clinical decisions (defensive medicine), practice location decisions, and patient health outcomes. A separate strand of literature, to which we contribute, has examined the factors that predict med mal premia with mixed findings. Our results also contribute to the debate on med mal reform, which often proceeds on the assumption that fewer lawsuits and smaller payouts will lead directly to lower med mal insurance premia.
We measure premia relying on MLM, and measure direct costs as the sum of payouts on claims reported to the National Practitioner Data Bank (NPDB), plus defense costs reported to the National Association of Insurance Commissioners (NAIC). By drawing on MLM for premia and NPDB for payouts, we depart from much of the prior literature on med mal insurance, which generally relies on NAIC data on premia written (instead of our measure of per-physician premia), and on incurred losses as the cost measure (rather than our NPDB-based measure of payouts). We choose this approach for several reasons. First, MLM, although it covers only three specialties, is the only available source for per-policy premia. Insurers report gross premia to NAIC, but do not report information from which per-policy premia can be determined. Second, the prior literature relies on NAIC data for losses, but reports incurred losses, which reflect both payouts and the insurer’s judgmental decision on how much to add or subtract from reserves for future payouts. The connection between payouts and losses reported to NAIC is further complicated because some losses will be paid by reinsurance. We prefer to rely on actual payout data, which is available only from NPDB. NPDB data is available only at the state-level, but we view it as likely that loss trends are similar across insurers. Loss adjustment expense is from NAIC. We also use data aggregated to the state level because the payout data is at the state level. However, loss adjustment expense is only a small fraction of the sum of (payouts plus defense costs), so it would not affect our main conclusions if we relied only on NPDB payouts or used insurer-specific information on defense costs.
Our priors were that insurer direct costs would strongly drive premia, perhaps with a lag. We expected damage caps to affect premia primarily through their effect on direct costs, and to otherwise have limited long-term effects on premia or on the Premium/Cost Ratio.
Our results depart from these priors in important respects. In DiD analysis of damage cap adoptions during our sample period, damage caps causally predict a higher future Premium/Cost Ratio. The Premium/Cost Ratio rises in cap-adopting states beginning two years before cap adoption. The pre-adoption rise in premia, beyond the amount that reflects rising payouts, is a plausible driver of legislative decisions to adopt damage caps. In contrast, prior work has found only weak evidence that changes in payouts predict cap adoptions (Paik et al., 2013b). Med mal insurer profitability, proxied by the Premium/Cost Ratio, is much higher since 2000 across all states. The rise is especially large in the “New Cap States,” which adopted damage caps during the third wave of damage cap adoption in the early 2000s. 1 Assuming that time trends in premia for the three MLM specialties are representative of trends for other specialties, the Premium/Cost Ratio should capture the two principal time-varying components of insurer cost. We cannot measure the third major cost category -- insurer administrative costs (including marketing costs) – but these costs should be slowly time-varying and reasonably consistent across insurers, as a percentage of premia. Thus, the Premium/Cost Ratio should provide a respectable measure of the relative profitability of the med mal insurance business, across states and time.
We view as reasonable the assumption that trends in the MLM specialties are representative of trends for other specialties. MLM reports premia for these three specialties because they view them as representative, taken together, of broad trends in med mal premia. We confirm the strong correlation in time trends for premia across these three specialties below, but lack a source of data with which to assess correlations with premia for other specialties.
We find that the Premium/Cost Ratio is highly variable within states over time, nationally over time, and across states at similar times. For example, the univariate state-level correlation between premium per physician (averaged over the three MLM specialties) and direct cost per physician, over our 28-year sample period, is only 0.38. Using lags of direct costs up to four years improves power to predict current premia, but only modestly. However, even with these lags, long-run elasticities for the response of premia to costs are around 0.40, when naïve theory would predict elasticities close to 1.
We also expected that competitive pressure, including new entry, would predict lower prices and thus a lower Premium/Cost Ratio, but found no evidence for this. The number of insurers for whom MLM reports premia (our crude but best available proxy for level of competition) is statistically insignificant as a predictor of premia or the Premium/Cost Ratio, with a positive sign (opposite from naïve expectation).
We expected insurers to respond to each other: changes in one insurer’s pricing should predict changes by other insurers in the same market. We find supporting evidence. Cross-elasticities are near 0.3 for premia charged by one firm versus those charged by other firms in the same county. These cross-elasticities may reflect common responses of all insurers to unobserved shocks to expected cost.
Our long sample period lets us examine determinants of premia both during years when premia are changing rapidly, including the national spike in med mal premia from 2000-2005, and when they are in steady decline (2005-2017), and to examine both the period from 1992-2000, with roughly stable payout/physician, and the period from 2001-2017, with steadily declining payout/physician.
Many med mal insurers operate in multiple states; no prior study examines how these insurers behave across different states. We find evidence that premia charged by a parent insurer in one state predict the premia that this insurer charges in another state. These spillovers could reflect the parent’s actuaries applying common views of the mal liability environment across states, national factors such as reinsurance rates (both factors predict a positive association), or cross-subsidization across states within the same parent company. We find some evidence of cross-subsidization, with higher premia in other states predicting lower in-state premia.
We found only one prior study of med mal insurance pricing using a DiD design. Born and Karl (2016) use NAIC data over 1997-2010 to study third-wave cap adoptions. Following cap adoption, they find a substantial drop in the present value of future losses, a smaller and more gradual decline in premia, and an overall decline in the ratio of losses to premia.
A number of prior studies use panel data without an explicit DiD design, some using MLM data and some using NAIC data. The prior studies using MLM data that are most similar to our panel data analysis are Danzon et al. (2004) and Kilgore et al. (2006). Both use MLM data on premia as we do; however, neither combines the MLM data with NPDB data on payouts. Danzon et al. (2004) use state-level data over 1994-2002 on premia from MLM, and on incurred losses (expected payout plus expected defense costs) from NAIC. 2 They find that state tort reforms and year-specific influences on all firms have greater predictive power for changes in premia than most firm-specific covariates, including insurers’ expected losses. However, incurred losses combine changes in actual payouts with changes in insurers’ estimates of future payouts on claims already made (Baker, 2005a). Historically, when premia rise in so-called “hard insurance markets”, loss estimates often rise as well. Conversely, when premia fall or remain flat in “soft markets”, loss estimates often fall (Baker, 2005b). Changes in these estimates can be far larger than changes in actual paid losses, as Danzon et al. (2004) show for their sample period. 3
Kilgore et al. (2006) use panel data over 1991-2004, with state and year fixed effects and standard errors clustered on state, to estimate the impacts of damage caps, other tort reforms, and investment returns on malpractice premia; they do not study the extent to which actual costs predict premia, nor whether damage caps predict premia after controlling for costs. They find that damage cap adoption predicts 17-25% lower premia, depending on physician specialty; in contrast we find in our DiD analysis that cap adoption predicts higher premia.
Grace and Leverty (2013) rely on NAIC data over 1985-2005 on premia written and incurred losses, to study damage caps adopted during this period. They find a substantial post-reform drop in incurred losses, and a much smaller drop in premia, leading to higher post-reform profitability. Note that premia written reflect a combination of changes in premia for the same policy, changes in the number of policyholders, and typical policy limits purchased. Neale et al. (2009) report substantial variation over time in the number of firms writing policies in each state and in firms’ market shares (based on direct premia written). Silver et al. (2015), in a case study of Texas, find large variation over time in the typical policy limits that physicians purchase.
Born and Viscusi (1994) and Viscusi and Born (2005) use NAIC data on incurred losses for 1985-1991, and study tort reforms over 1985-1987. They report a post-reform drop in the incurred loss ratio, and thus higher profitability. Born et al. (2018) study the period from 1994-2010 and report that incurred loss ratios dropped in New-Cap States relative to other states following cap adoption.
This paper proceeds as follows. Part 2 presents a conceptual model. Part 3 describes our data sources; Part 4 describes out empirical modeling approach. Part 5 provides initial evidence on the pricing puzzle, from summary statistics and univariate graphs. Part 6 reports DiD results. Part 7 reports panel data results. Part 8 discusses additional results and limitations. Part 9 discusses our findings and possible explanations.
2. Conceptual Model of Med Mal Insurance Pricing
We provide here a simple conceptual model of how we expect insurers to price insurance in a competitive market. We treat insurance companies as profit-maximizing firms whose profits depend primarily on the balance between the premium charged, plus investment income on float, and the cost of providing insurance (payouts, defense costs, and administrative costs). Medical malpractice insurance has a relatively long “tail” – the time gap between when premia are received and payouts are made; prices should reflect expected income from investing “float” (premia received, but not yet paid out on claims). Payouts should be a key driver of malpractice insurer costs, and changes in payouts should be a principal driver of changes in premia. Defense costs are a second important driver and show a gradually rising trend as a fraction of payouts over our sample period (see Appendix Figure A1); this has been observed in prior work (Black et al., 2008; Carroll et al., 2012). However, defense costs are reasonably predictable and are unlikely to explain large swings in premia or the Premium/Cost Ratio. Defense costs and payouts are also correlated at the claim level, since in cases where liability is contested, defense costs often reflect insurers’ efforts to limit payouts (Black et al., 2008). 4 Administrative costs and float (and thus expected income on float) should also vary slowly over time, and thus should not be strong drivers of premium changes.
Firms may set premia either in response to past payouts or based on private knowledge of expected future payouts. Insurance companies have knowledge of claims filed but not yet paid out, so it is possible for premia to increase before costs if the insurers respond to anticipated higher future payouts or other costs by increasing premia today. Insurance companies may also be surprised by the magnitude of payouts for themselves or competitors and change premia to respond to the implications of those unexpected past payouts for expected future payouts. Premia can also change if insurers respond to competitors’ premia, both for competitive reasons and because Insurer A’s prices may reflect changes in Insurer A’s estimate of its expected costs, which could lead other insurers to infer similar changes in their own expected costs.
In our panel data models, we seek to capture insurers’ expected revenue and costs other than payouts and defense costs, including administrative costs and income on float, via firm*county*specialty and year fixed effects (FE). The firm*county*specialty FE should capture firm-specific cost structures that may be slow to change over time, as well as time-invariant county, state, or specialty-specific factors affecting premia. The year FE should control for national changes in investment returns, reinsurance rates, or the med mal liability environment. We expect state damage caps to affect both claim rates and payout per claim (Paik et al., 2013b) and therefore affect costs. However, we expect caps to affect premia principally through their effect on costs.
In our main DiD models, reported in the text, we aggregate to the state level, and use state FE, but use the finer-grained firm*county*specialty FE in robustness checks in the Appendix (in each case together with year FE).
Insurers operate in markets with various degrees of competition and in less competitive markets may act as monopolistic competitors. Naïve theory would predict that firms in more competitive markets will charge prices close to marginal cost and will therefore pass on changes in direct costs to physicians at close to dollar-for-dollar, while firms in less competitive markets will charge higher prices (reflected in a higher Premium/Cost Ratio, and may change premia in response to changes in direct cost at higher or lower rates, depending on how their power to charge prices above marginal cost varies with changes in cost. In our panel data models, we use the number of firms that provide premia to MLM in each county as a measure of competition; this measure is crude but we lack a better one. 5 We then estimate the association between firm premia and the mean of competitor premia as a measure of how competition affects prices.
3. Data and Data Sources
We rely on a combination of data on medical malpractice premia from MLM, NPDB, and NAIC, over 1992-2017.
We obtain annual data on medical malpractice premia from annual MLM surveys over this period. We rely on a cleaned version of the MLM dataset prepared by Black et al. (2017) from the raw MLM data. MLM is the only source of national, longitudinal data on med mal insurance rates. It covers all 50 states (plus D.C.). In each state, it reports premia for the companies with the largest market shares for physician med mal insurance, but not for companies with smaller market shares. The combined market shares of the insurers whose premia are reported in MLM averages around 70%. Most companies report their rates to MLM; for the few that do not, MLM obtains rates from insurer filings with state insurance regulators. MLM covers three specialties: internists, general surgeons, and obstetricians-gynecologists. Two of these are high-med-mal-risk: general surgery and ob-gyn. The third, internal medicine, is a moderate risk specialty (Jena et al., 2011).
Reform Status and Premium/Payout Ratios by State
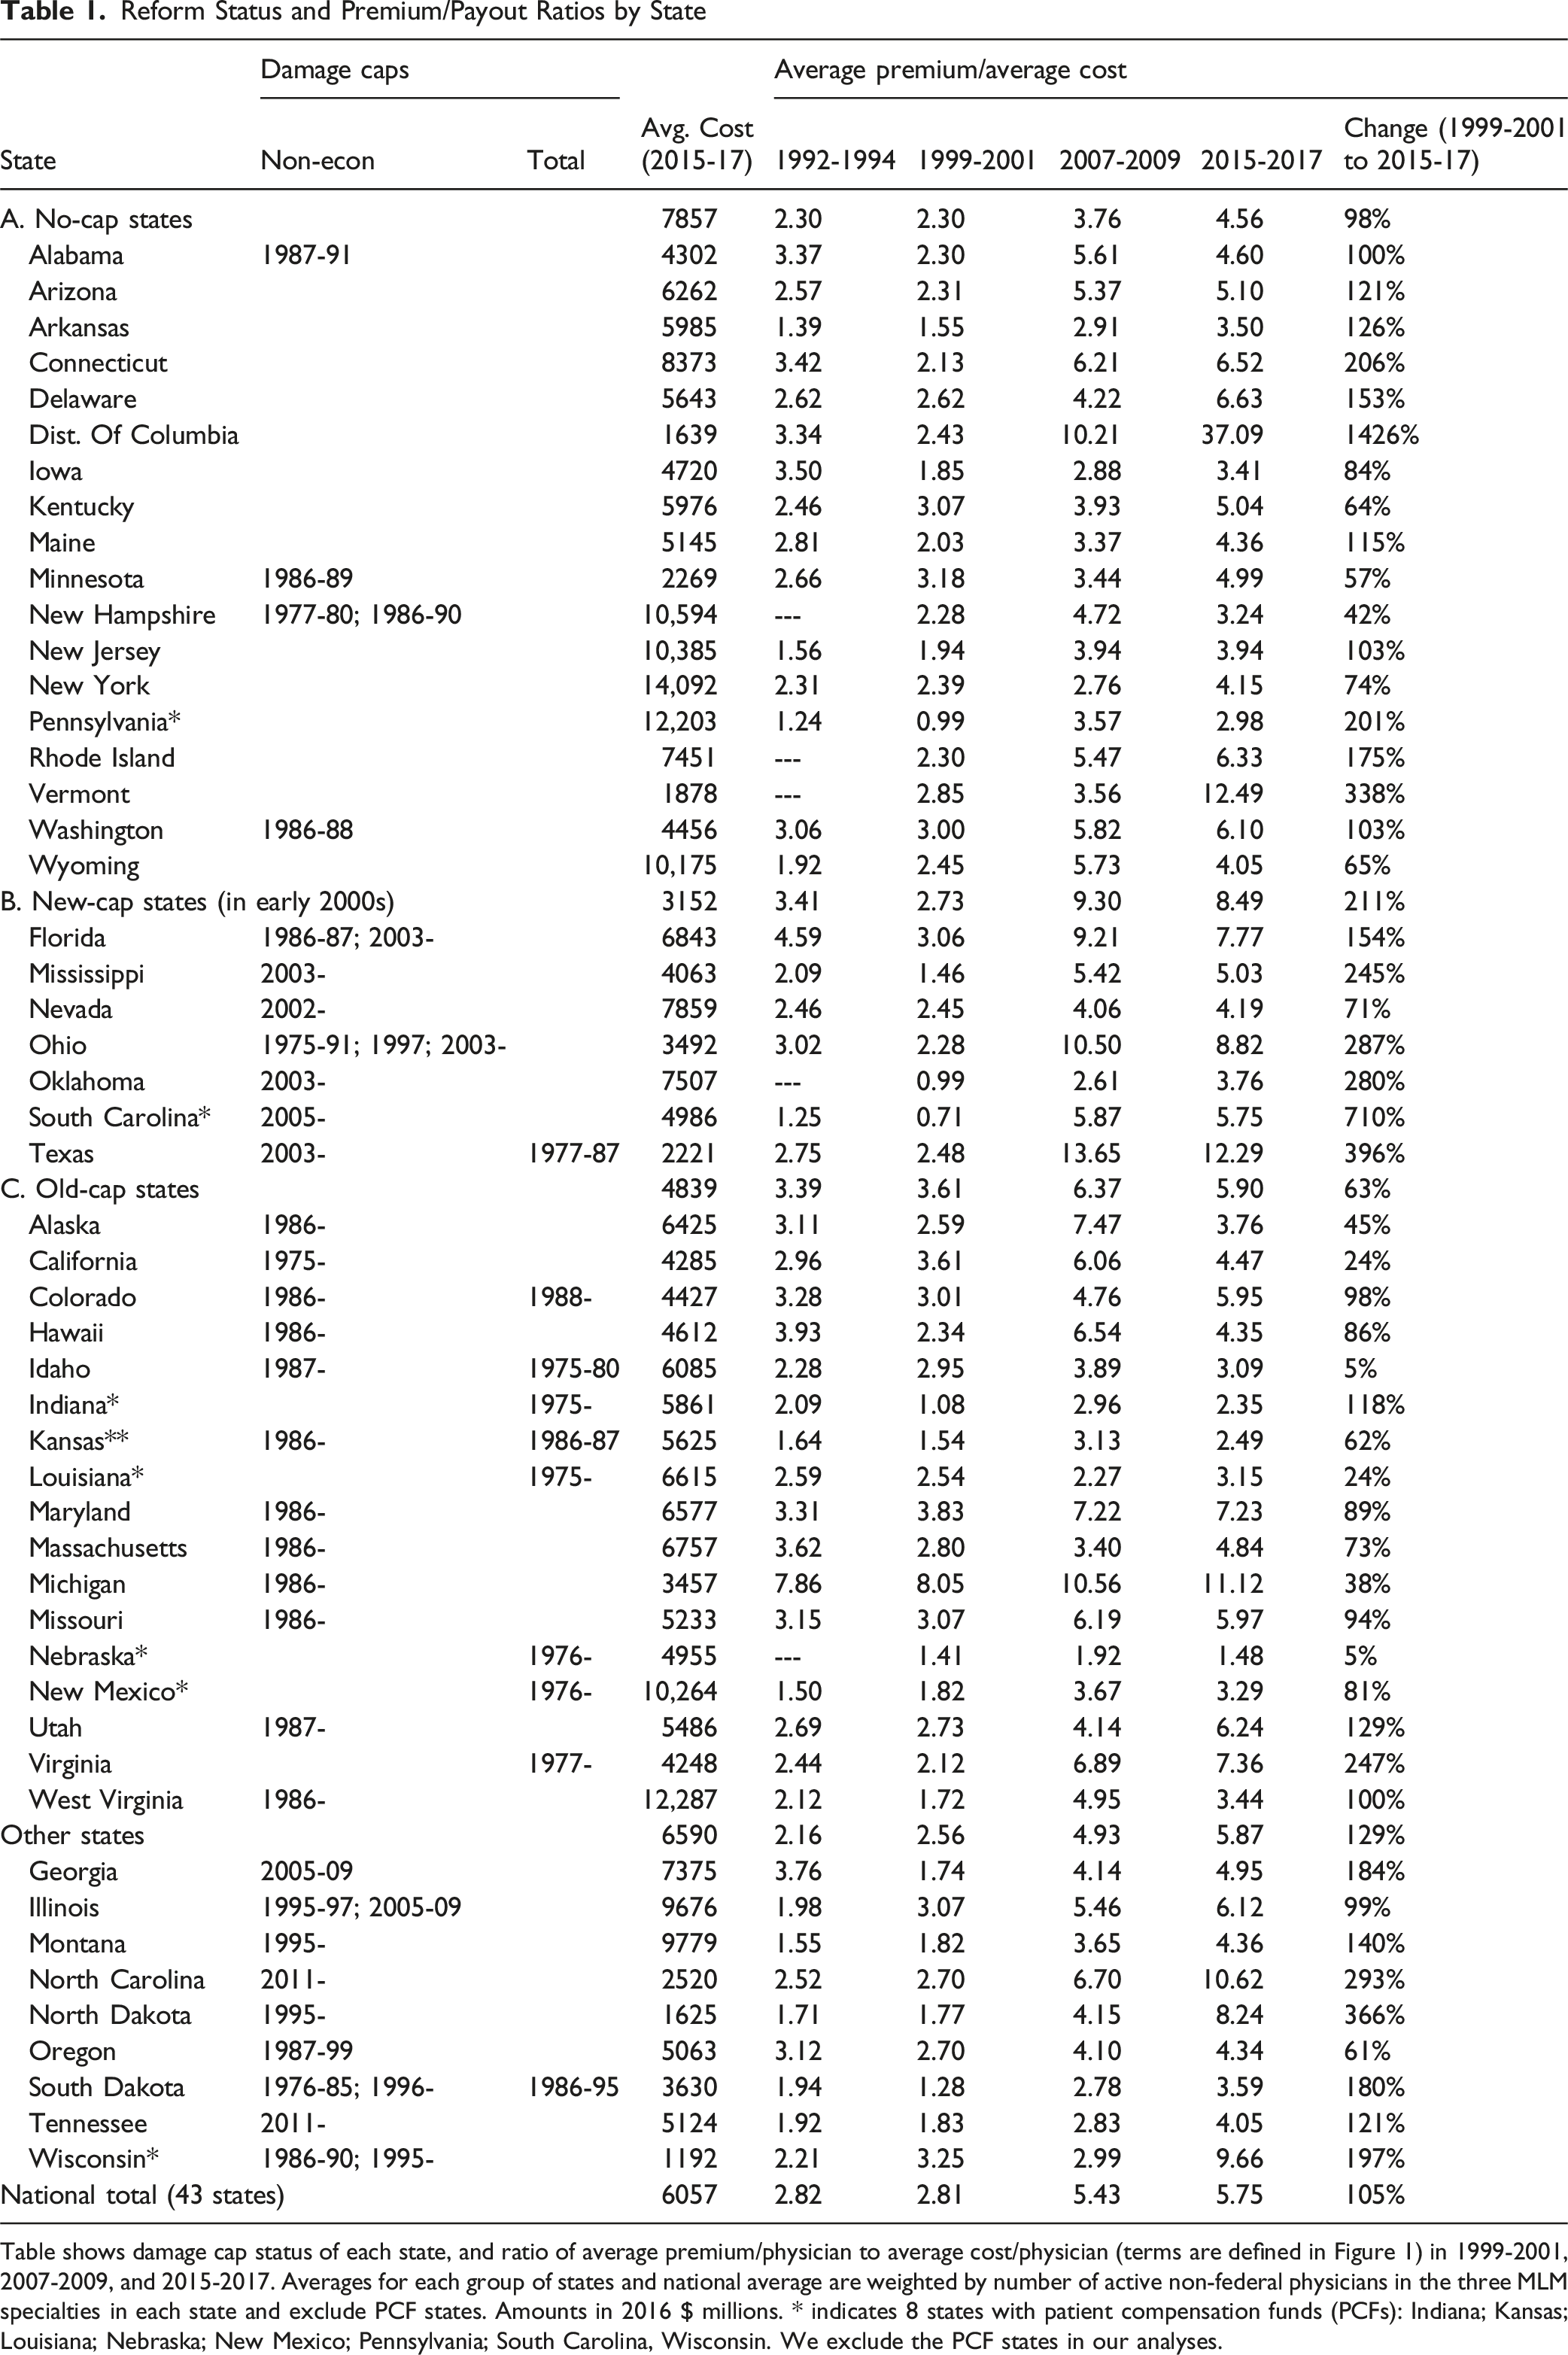
Table shows damage cap status of each state, and ratio of average premium/physician to average cost/physician (terms are defined in Figure 1) in 1999-2001, 2007-2009, and 2015-2017. Averages for each group of states and national average are weighted by number of active non-federal physicians in the three MLM specialties in each state and exclude PCF states. Amounts in 2016 $ millions. * indicates 8 states with patient compensation funds (PCFs): Indiana; Kansas; Louisiana; Nebraska; New Mexico; Pennsylvania; South Carolina, Wisconsin. We exclude the PCF states in our analyses.
We obtain annual data on insurer paid defense costs from NAIC, at the state*firm level through 2004, and at the state level after 2004. We aggregate firm-level data to the state level. NAIC reports insurer direct allocated loss adjustment expenses from 1992-1998 and direct defense and cost containment expenses from 1999-2018. This measure includes all fees paid to defense counsel, or expected at that time to be paid, in specific cases but omits expenses that are not allocated to particular cases. 7 In a small number of instances, defense cost is negative, because a downward adjustment to allocated cost exceeds actual cost for the year; we convert negative values to zero.
We obtain annual state-level data on paid med mal claims against physicians (only M.D.’s, not D.O.’s) over 1992-2017 from the NPDB Public Use Data File. 8 NPDB reports payouts in the year a claim is paid. Average lags from injury to payout are around 4 years, and from claim to payout are about 2 years (Paik et al., 2013a).
The NPDB relies on voluntary reporting by physicians and insurers and may not be complete. However, prior research comparing NPDB claims to other sources for Illinois provides evidence that NPDB captures a large percentage of all paid claims and that the percentage captured is consistent over time (Hyman, Rahmati, & Black, 2021; Appendix). Prior research also finds that trends in NPDB payouts are consistent with other sources for states where other sources are available (Paik et al., 2013b). We have no reason to believe that any changes over time in NPDB completeness might vary across states in a way that would bias our results. Because the NPDB data on payouts is at the state level, and the NAIC data on defense costs is also at the state level from 2004 on, we can measure direct cost only at the state level. Thus, the Premium/Cost Ratio involves a mix of firm*county level data in the numerator and less granular state level in the denominator. For our DiD model, we aggregate data on premia to the state level and run regressions at the state*year level.
We obtain counts of active practicing non-federal physicians (below, simply “physicians”) by county and specialty from the Area Health Resource File (AHRF). 9 We combine the NPDB, NAIC, and AHRF data to construct state*year data on direct cost per physician.
The MLM data lets us assess how competitive interaction between insurers may affect premia. We construct a “Competitor Premium” in a county*specialty*year as the simple average of the premia for that specialty offered by all other firms in that county*year. We also consider whether premia charged by subsidiaries of multistate insurers are influenced by events at the parent company level. To do so, we compute a “Group Premium” for each firm*county*specialty*year as the average premium offered in other states by the out-of-state members of the same parent group, weighted by the number of physicians practicing in each out-of-state county*specialty*year.
As a robustness check for our use of NPDB data for payouts and MLM data for premia, we use state-level NAIC data on
4. Empirical Models
We use both DiD and panel data models to evaluate the predictors of med mal premia. For the DiD analysis, we drop companies in the New-Cap States that appear in the data only before cap adoption (last appearance is cap adoption year or earlier) or after cap adoption (first appearance is cap-adoption year or later). Our first DiD model is a classic two-way fixed effects (TWFE) model, specified in event time relative to each state’s cap adoption year, which we denote as year 0:
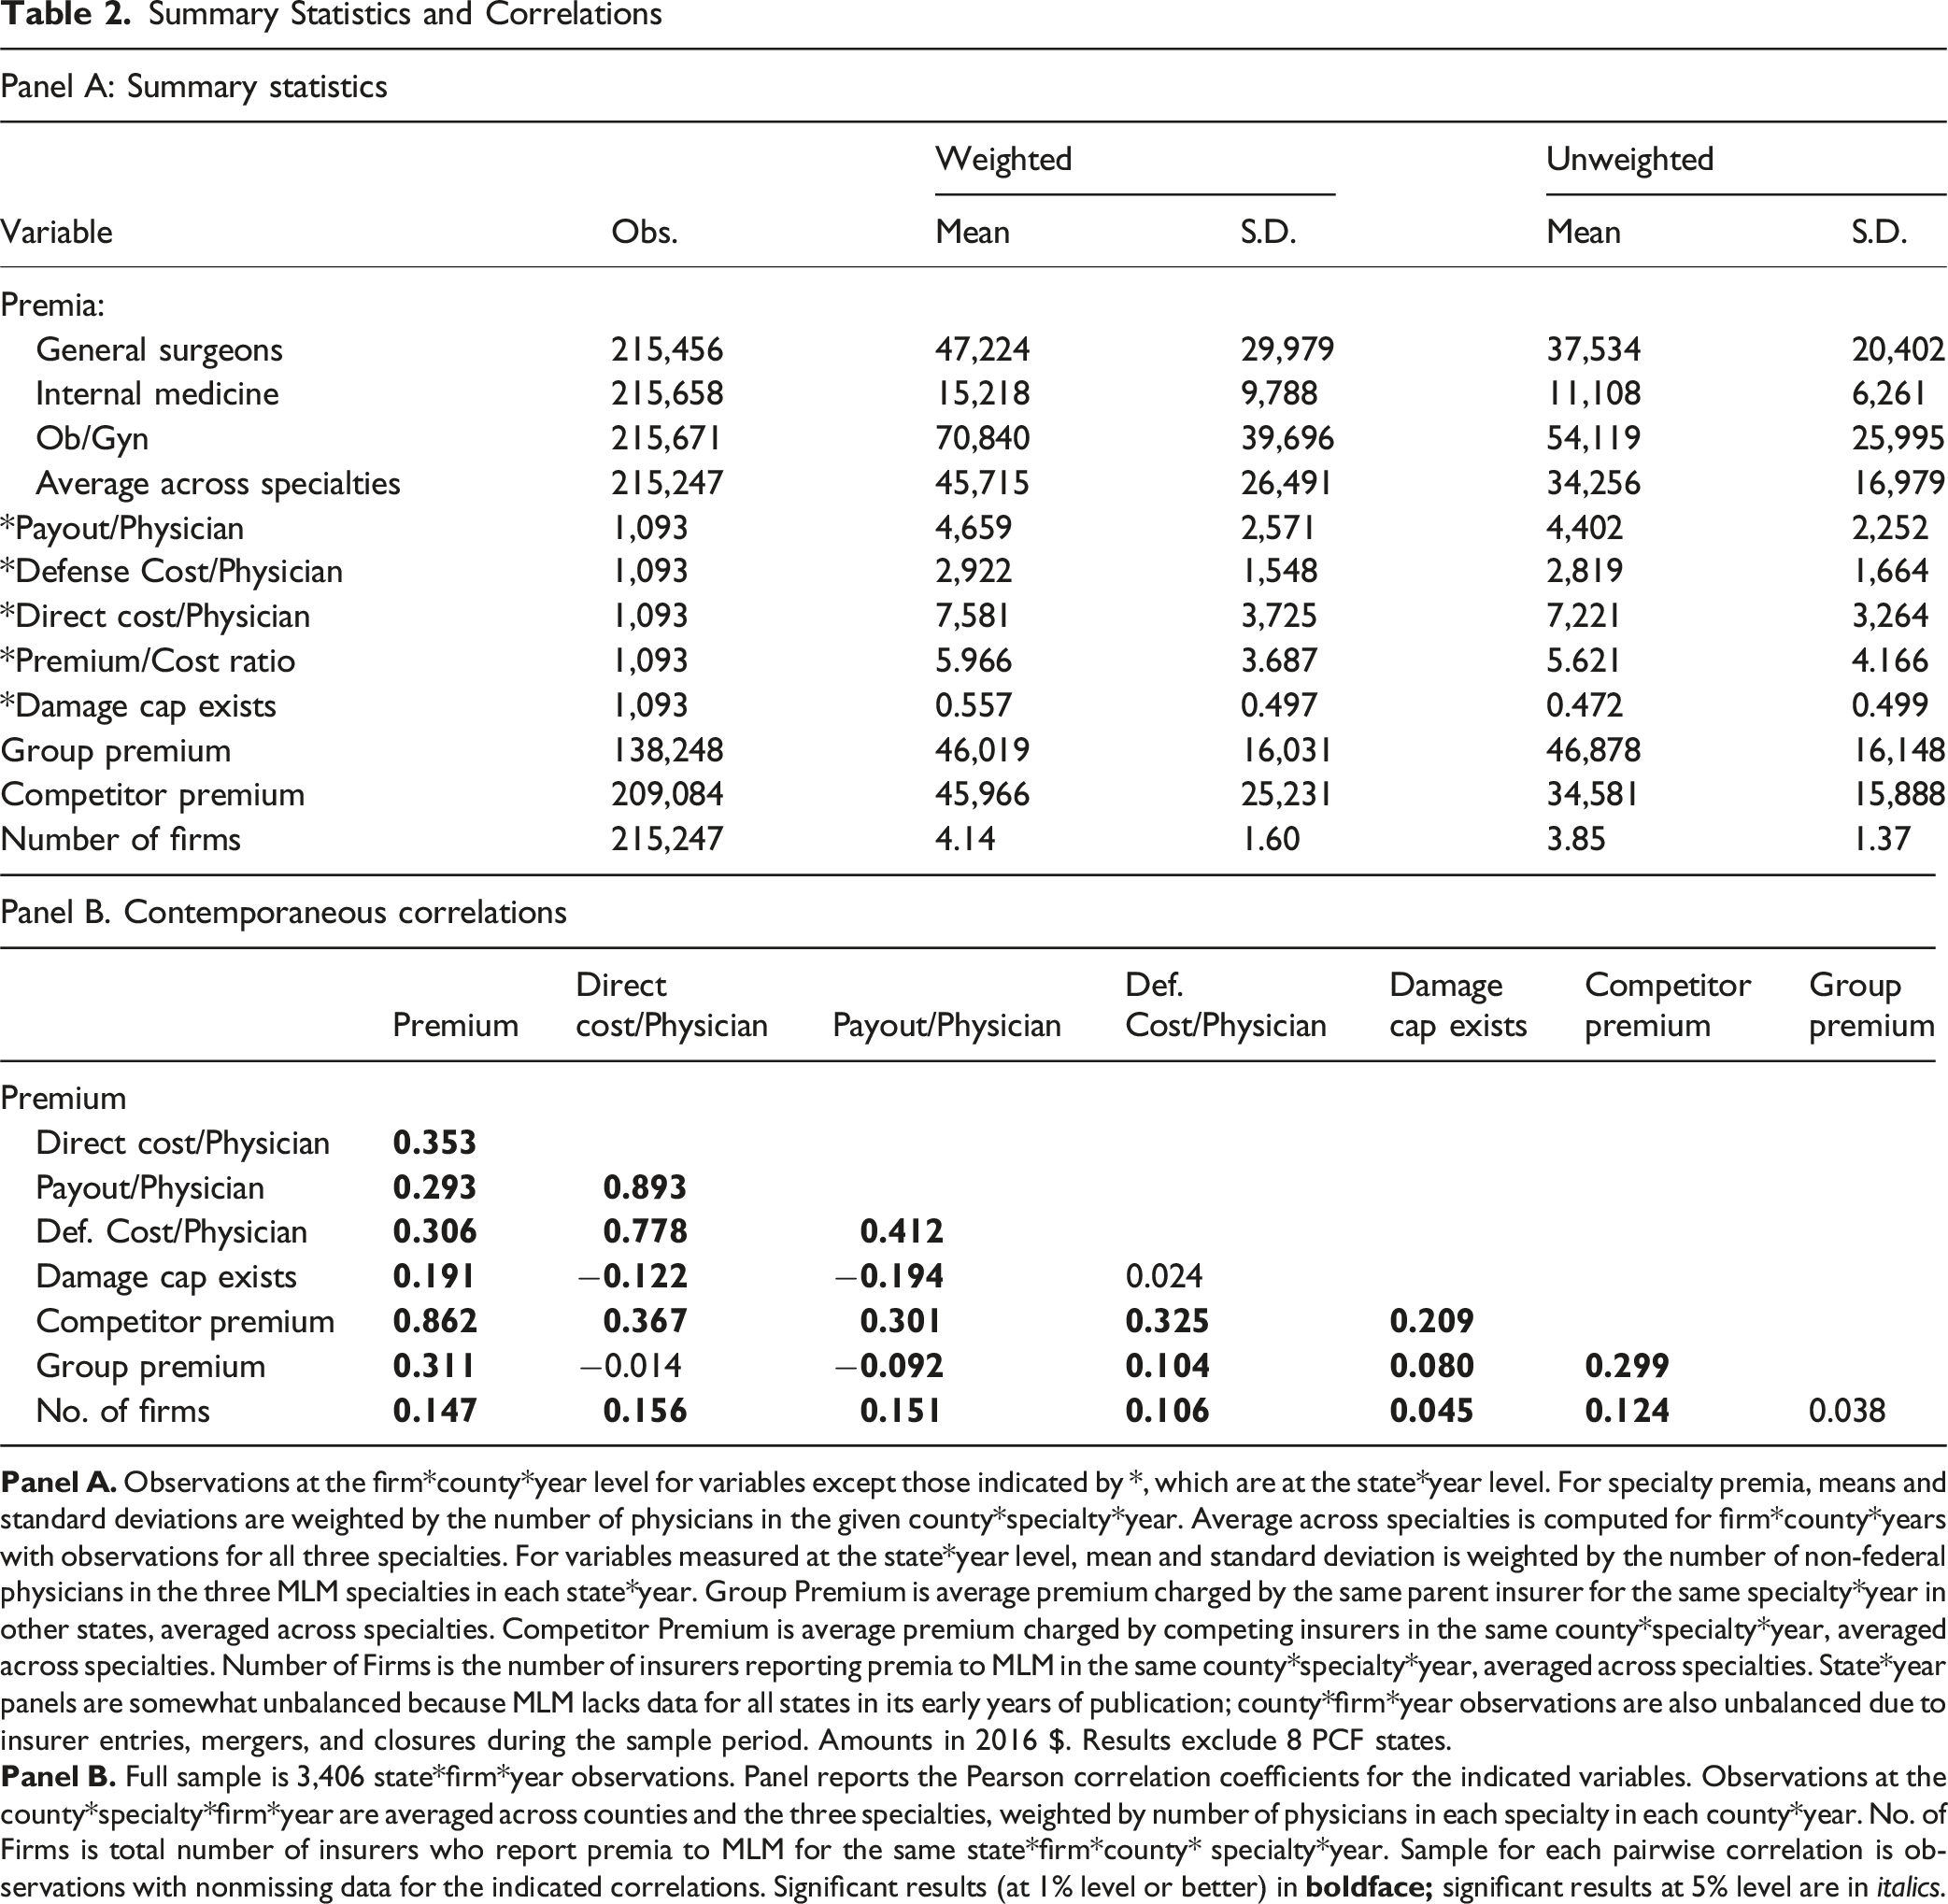
The coefficients from the TWFE model will generally be biased downward if the treatment effect phases in over time. This is likely for damage caps, which typically apply only to cases brought after the cap is adopted. We therefore also report results for a distributed lag specification, which compares the treatment effect as it evolves during the treatment period to an average over the pre-treatment period:
Recent research shows that the TWFE model can generate unreliable estimates when there are multiple treated units, treated at different times. Estimates using the TWFE model are weighted averages of the average treatment effect for each treated unit (e.g., De Chaisemartin and Haultfoeuille (2020); Goodman-Bacon (2021)). We therefore implement several of the new staggered DiD methods, which attempt in different ways to address the potential for bias in a TWFE model. We report both overall DiD regression estimates and event-time graphs for two additional methods in the text, Sun & Abraham (2021) and Wooldridge (2025); we also report regression estimates for the Liu et al. (2024) and Borusyak et al. (2024) approaches. 11 We report results from DiD regressions at the firm*county*specialty level in the Appendix (Appendix Figure A2 and Appendix Table A1).
We specify panel data models at the more granular firm*county*specialty level. Our main panel data fixed effects specification is: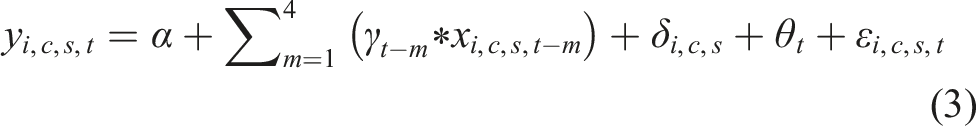
We use lagged values of covariates to study the time structure of insurer responses to the predictor variables. 14 We use the natural logarithm of all variables, so that coefficient estimates represent elasticities, except for Number of Firms and Damage Cap Exists. Given the fixed effects included in the model, the effect of Damage Cap Exists on outcomes is identified by state adoption or repeal of caps; the effect of Number of Firms on outcomes is identified by firm entry and exit, which occurs at the state level; and the elasticities are estimated within firm*county*specialty.
5. Initial Evidence
5.1. Summary Statistics and Correlations
We exclude 8 PCF states from our sample because we could not develop a clean way to handle changes over time in the levels above which the state fund covers payments. We divide the remaining 43 states into four groups: 6 New-Cap States which adopted damage caps in the early 2000’s; 12 states which had a cap on non-economic or total damages adopted before our sample period (“Old-Cap States”), 17 states that had no damage cap in effect during our sample period (“No-Cap States”), and 8 states with a more complex damage cap pattern, including two states that adopted damage caps in the 1990s, two (Georgia and Illinois) which had caps in place from 2005-2009, and two that adopted caps after 2010 (“Other States”). In DiD analyses, we exclude Georgia and Illinois from the sample starting in 2010. 15 Damage caps are the most important med mal reform and the only reforms that predict lower claim rates and payouts (Paik et al., 2013b). They are often adopted together with other reforms; we treat damage cap adoption as an imperfect proxy for serious reform, which includes a damage cap and may include other elements.
Table 1 summarizes, by state and for our four state groups defined by tort-reform status (no-cap, new-cap, old-cap, and other), the “Premium/Cost Ratio”, defined as the ratio of the average premium per physician in each state to the average of direct cost (payout plus defense cost) per physician in that state, and how that ratio has changed over time. 16 The table shows the average Premium/Cost Ratio over four three-year periods – 1992-1994, 1999-2001, 2007-2009, and 2015-2017. During the first two periods, the national average is around 2.8. The ratio is somewhat higher in the Old-Cap states than in the other three state groups.
A ratio well above one is expected, for two principal reasons. First, payouts and defense costs represent only part, albeit a large part, of total insurer cost. As mentioned above, our cost measure omits insurer administrative costs that the company does not allocate to particular claims. Second, two of the three specialties covered by MLM (general surgery and ob-gyn) are high med-mal risk, and the third (internal medicine) has roughly average risk (Jena et al., 2011; Studdert et al., 2006). Thus, premia averaged across these three specialties will exceed the average across all specialties. Payout and defense cost, in contrast, are averaged across all specialties. Thus, the observed Premium/Cost Ratio will exceed the unobserved average ratio across all specialties.
Several features of the columns in Table 1 for 2005-2007 and 2015-2017 are striking and provide a first look at the puzzles explored by this paper. First, the Premium/Cost Ratio is far higher in 2015-2017 than in 1999-2001 in almost all states. The national average, after remaining roughly stable at around 2.8 during the 1990s, rose to 5.43 in 2005-2007 and 5.75 over 2015-2017. It is difficult to explain 1990s levels and more recent levels as consistent with competitive pricing in both periods. We do not measure insurer administrative cost but know of no reason to believe that insurers nationwide became dramatically less efficient in processing claims over time. Other evidence indicates that the period beginning around 2005 was highly profitable for med mal insurers, with combined ratios below 100% and favorable reserve development (e.g., Wunder & Parker, 2019).
Second, the Premium/Cost Ratio varies widely across states, and within states across time. For example, the change in this ratio from 1999-2001 to 2015-2017 includes increases of 24% in California (3.61 to 4.47), 38% in Michigan (8.05 to 11.12), 74% in New York (2.39 to 4.15), 287% in Ohio (2.28 to 8.82), and 396% in Texas (2.48 to 12.29). 17 It is hard to explain these large variations as consistent with long-run competitive markets.
Third, both the Premium/Cost Ratio and the change in the ratio from 1999-2001 to 2015-2017 vary substantially across the four groups of states. In 1999-2001, the New-Cap States had an average ratio of 2.73, in between the 2.30 average for the No-Cap States and the 3.61 average for the Old-Cap States. By 2015-2017, in contrast, the New-Cap State average ratio had risen by 211% to 8.49; versus a 63% rise in the Old-Cap States (to 5.90) and a 98% rise in No-Cap States (to 4.56). Thus, damage cap adoption, and damage cap status more broadly, is capturing something important about med mal premia that is not captured by direct cost. States with caps have higher ratios than states without caps, and cap adoption, in the New-Cap States, predicts a surge in this ratio. Here too, this variation seems inconsistent with long-run competitive markets.
Summary Statistics and Correlations
The next set of rows report per-physician payout, defense cost, direct cost, Premium/Cost Ratio, and whether a damage cap exists. This data comes from NPDB and NAIC and is available at the state*year level. About half of the state*year observations in our sample have a damage cap in place (“Damage Cap Exists”). 18 There is enough variation over time in which states have caps to let us study the association among damage caps, premia, and costs using both a DiD design for adoptions by the New-Cap States and a panel data framework. The final rows report data for Group Premium for firms that belong to a multistate group, Competitor Premium, and the number of insurers with prices reported in MLM (“Number of Firms”). Sample size is smaller for Group Premium (and thus, later on, for regressions that include Group Premium) because some firms are not part of larger multistate groups.
Table 2, Panel B reports contemporaneous correlations between variables. These correlations illustrate several puzzles that we explore in this paper. Payout, defense cost, and direct cost per physician all correlate positively and strongly. However, premia correlate with direct costs at only 0.353. Premia also correlate positively with damage caps (r = 0.191), even though we would expect a negative correlation because damage caps predict lower direct costs, as both we and Paik et al. (2013b) find. In competitive markets, those lower costs should be reflected in lower premia, at least in the long run. The positive correlation between premia and Damage Cap Exists conflicts with the Kilgore et al. (2006) finding that damage caps predict lower premia over 1991-2004.
Premia correlate strongly with Competitor Premia (r = 0.862) and to a lesser degree with the rates charged by other firms in the same group in other states (r = 0.311). Basic microeconomic theory predicts a strong correlation in prices charged by different competitors. But market theory also predicts that prices should correlate strongly with costs. We find that med mal premia correlate much more strongly with competitor premia than with state-level costs.
5.2. Univariate Graphical Evidence
We turn in this section to graphical evidence, which confirms the puzzles suggested by the summary statistics discussed above. Figure 1 shows, for our sample period, national average cost, weighted by the number of physicians in each state (multiplied by 3 for graphical presentation) and average MLM premia across our three specialties, weighted by the number of physicians in each specialty in each county. Panel A shows levels; Panel B shows annual changes; Panel C shows the Premium/Cost Ratio. National trends in med mal premia and cost/physician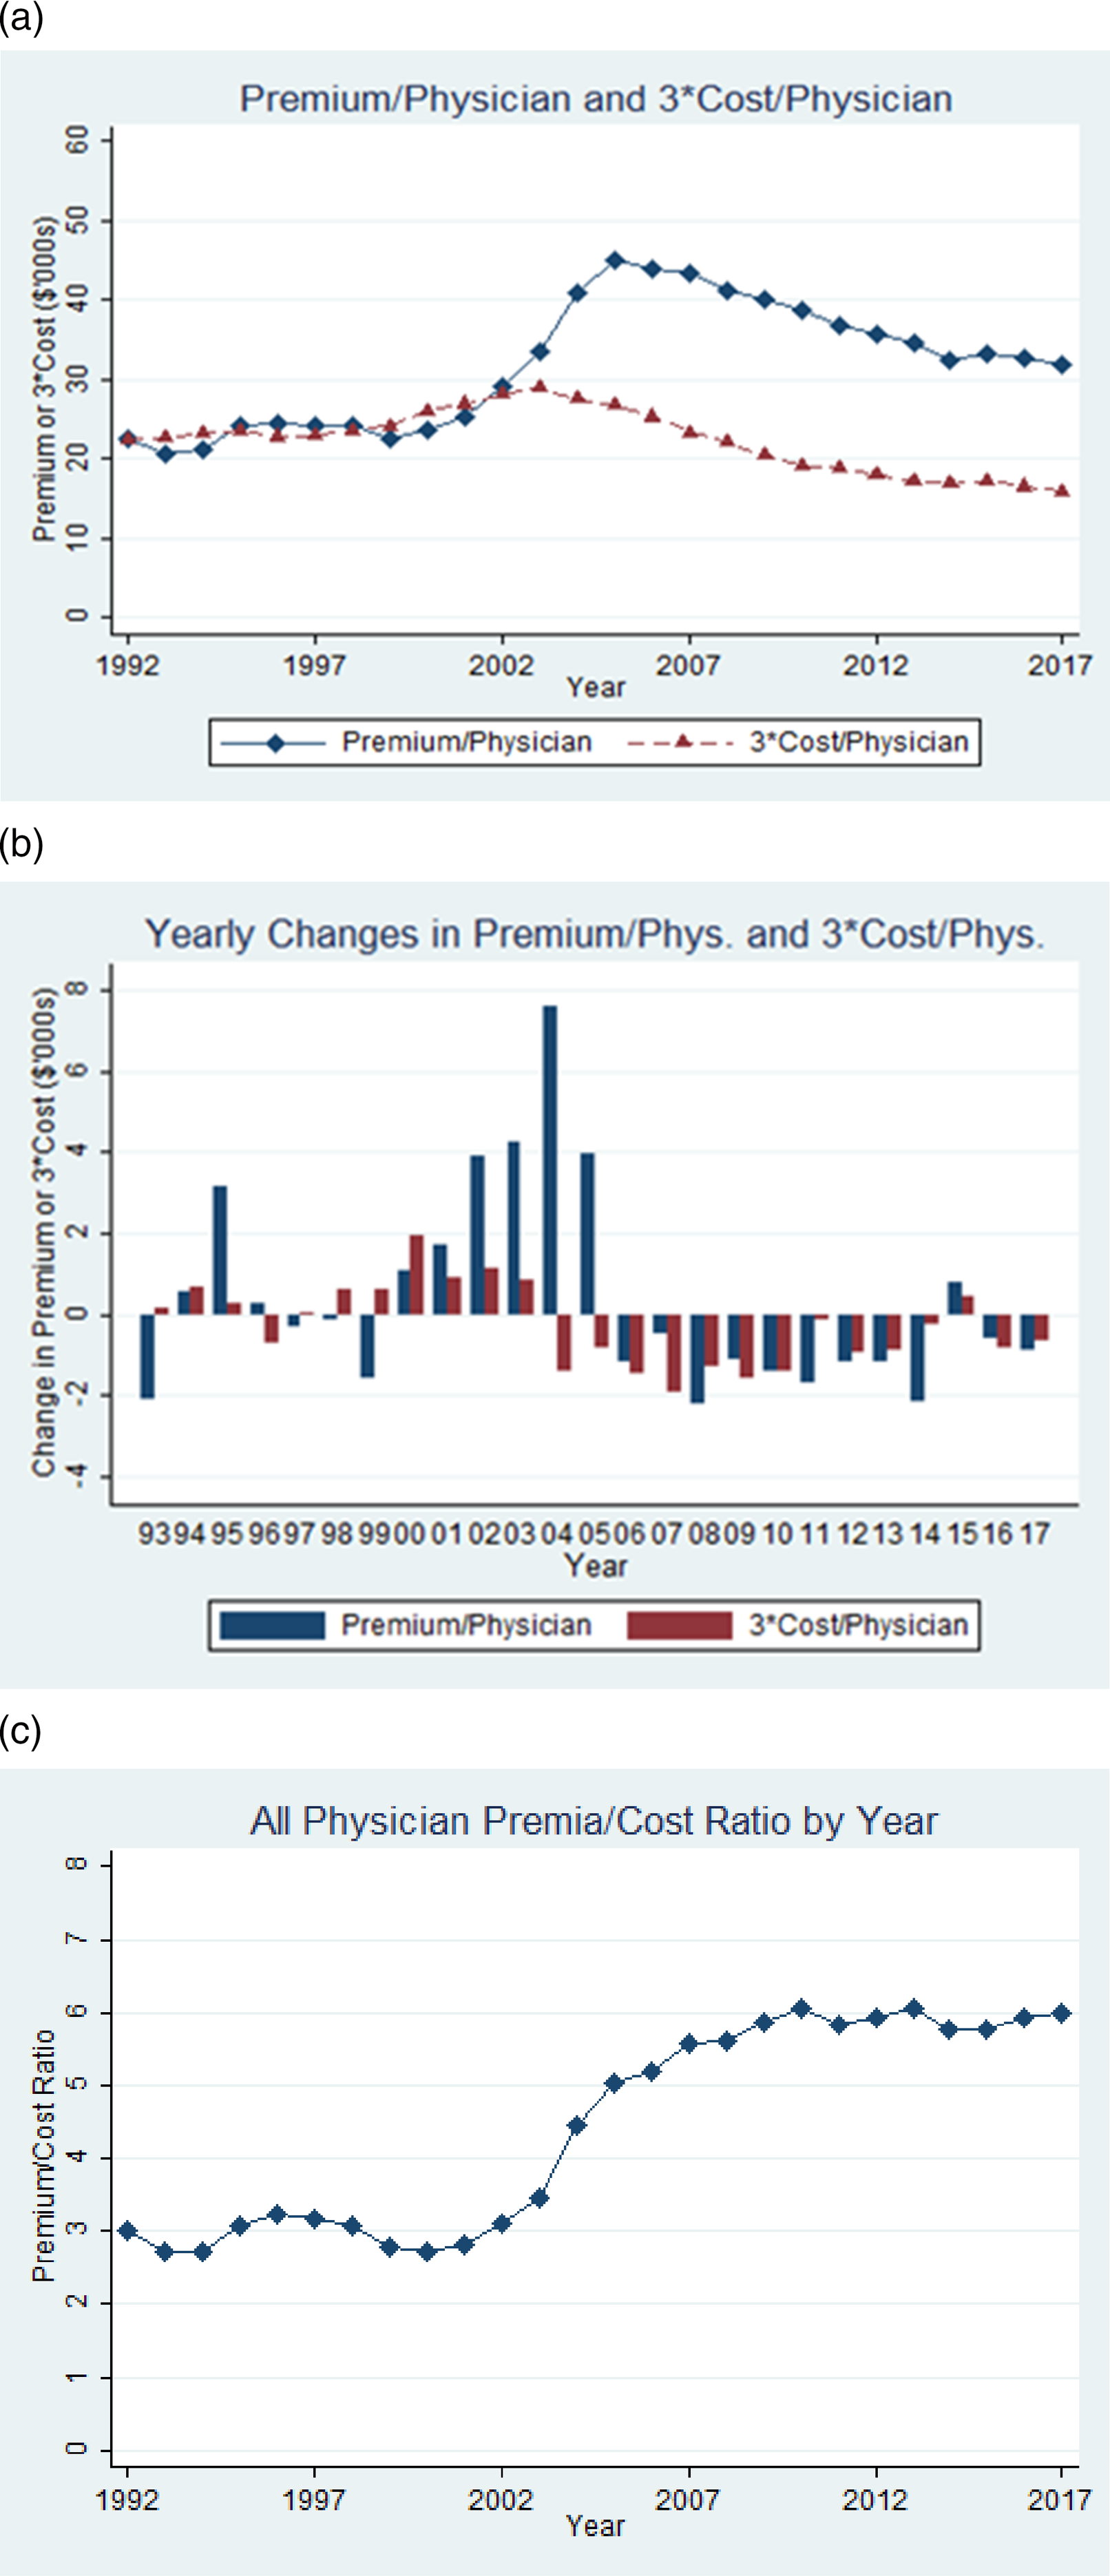
In a competitive market, costs and premia should generally move in parallel, perhaps with a modest lag between costs and premia. This is observed for both the “Early Period” of 1992-2000 (when cost/physician is gradually rising) and the “Late Period” of 2006-2017 (when cost/physician is falling). But in the “Middle Period” of 2001-2005, the two series diverge. Average premia nearly doubled from 2000 to 2005 (to $45,000 in 2005 versus $23,600 in 2000). In contrast, cost rises modestly over 1998-2003, before beginning to fall.
We assessed whether the rise in premia in the Middle Period could reflect insurers expecting rapidly rising costs at the time. This seems unlikely, for several reasons. First, premia rose strongly in 2004 and 2005, even though insurer costs were falling. Second, the largest component of cost is payout. If claim rates fall, payouts should follow with a lag for the time needed for filed claims to be resolved. However, claim rates per physician began to fall starting in 1999 based on plaintiff injury date, and in 2001 based on when lawsuits were filed (Paik et al., 2013a). This gave insurers reason to expect costs to decline with a lag, as indeed they did. Third, in Appendix Table A12, we assess whether insurers’ private information about claims that were made but not yet resolved are important predictors of premia. We find that future costs predict current premia less well than contemporaneous or lagged costs.
Consistent with prior work (e.g., Black et al., 2005), we find no evidence for a rise in cost sufficient to explain the very large rise in premia over 2000-2005. Average premia fell over 1997-1999 (see Panel B). This suggests that at the Premium/Cost Ratio of around 3 – a typical level during the 1990s -- insurers were not facing strong cost-driven pressure on profitability. A partial explanation, which we cannot explore with our data, could come from the reinsurance market. Share prices in world markets peaked in 2000 and then fell. This could have reduced reinsurers’ return on float and thus the prices they charged to primary insurers.
The rise in premia over 2000-2005, at a time when costs were not changing rapidly, produced a corresponding increase in the Premium/Cost Ratio. In Figure 1, Panel C, the national Premium/Cost Ratio was around 3 over 1992-2000, rose to around 5 in 2005, to about 6 by 2009, and was stable thereafter. This pattern is consistent with factors other than loss experience having a first-order effect on premia.
In Figure 2, we further explore the relationship between premia and direct costs by showing separate graphs for No-Cap, Old-Cap, New-Cap, and Other States. Our discussion focuses on the first three groups. Figure 2 shows the same premium and 3*cost lines as Figure 1, Panel A, by state group. All four groups show a rise in premia over 2000-2005, but with important differences across groups. Consider first the Early Period (1992-1999). In the No-Cap States, the 3*cost/physician line is generally above the Premium line, reflecting an average Premium/Cost Ratio below 3. Premia/physician falls relative to direct cost in the late 1990s, but rises in the early 2000s; insurers emerged from this period with an average Premium/Cost Ratio around 4 (see Table 1). Trends in med mal premia and cost/physician by state damage cap status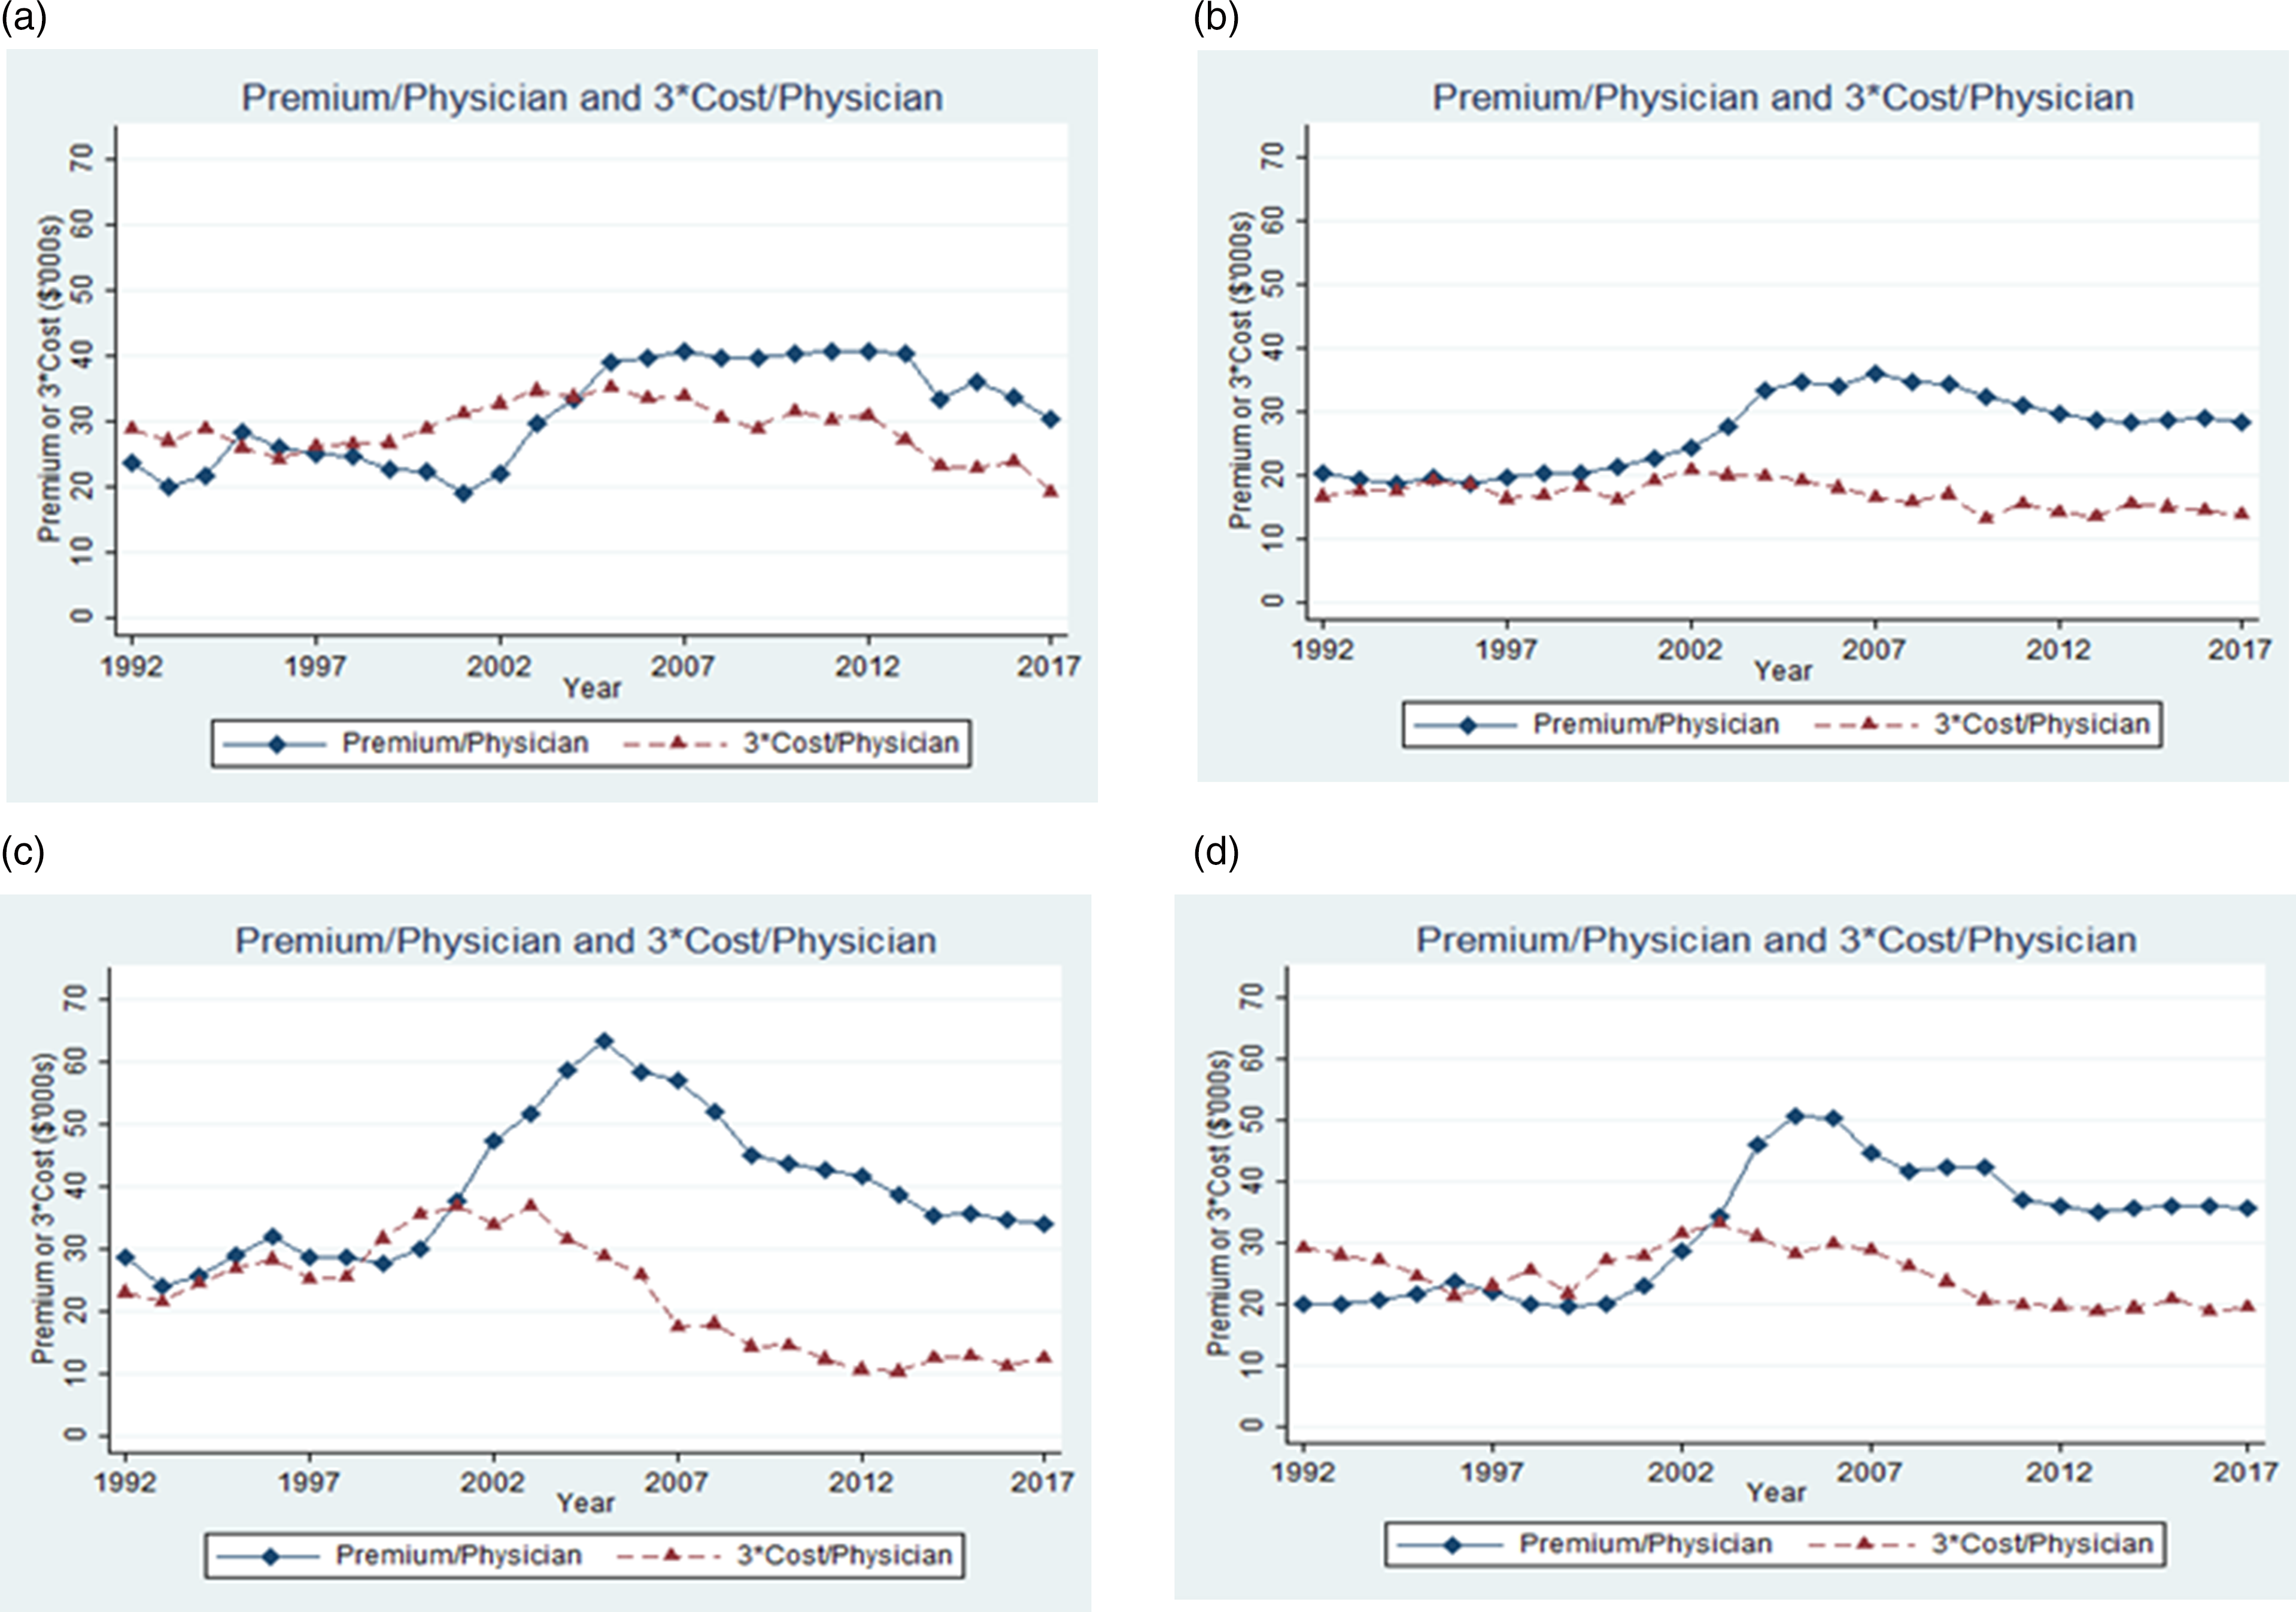
The New-Cap States show a pattern similar to the Old-Cap States prior to 2000. with gradually rising direct cost and flatter premia yielding a falling Premium/Cost Ratio. These states then experience a much greater rise in premia in the early 2000s than the other groups, leading to a Premium/Cost Ratio of around 9 over 2007-2009 (see Table 1).
In Old-Cap States, there is less evidence for rising costs in the late 1990s. This could reflect the effects of damage caps in constraining costs. Note that most caps are not adjusted for inflation, so become stricter over time in inflation-adjusted dollars. In the 1990s, the premium/physician line lies slightly above the direct cost line, indicating a Premium/Cost Ratio somewhat above 3. Premia in these states rise in the early 2000s, while costs do not, leading to an average Premium/Cost Ratio around 6 over 2007-2009 (see Table 1). Insurers charge similar premia in No-Cap and Old-Cap states despite higher costs in the No-Cap States.
During 2006-2017, time patterns are again different for the three groups of states. In No-Cap States, premia are flat through 2013 while direct cost decline, leading to a rising Premium/Cost Ratio. In contrast, in Old-Cap States, premia and direct cost decline at similar rates. In New-Cap States, premia and direct cost both decline, with costs dropping more sharply in percentage terms through 2012.
We would expect long-run competitive markets to generate roughly similar Premium/Cost Ratios across these three state groups. Figure 3 presents mean outcomes (premia, payout, defense cost, direct cost, and Premium/Cost Ratio) over time for the No-Cap, Old-Cap, and New-Cap states. Vertical lines indicate the start and end of the cap adoption period for the New-Cap States. In Figure 3, Panel A shows that ln(Premium) was similar across the three groups during 1992-2000 and then started rising sharply for New Cap States over 2000-2003. Premia also rose for No-Cap and Old-Cap States, but less sharply and later (most of the rise was from 2002-2005). After 2005, premia in New-Cap States gradually converge to premia for New-Cap States. Time trends by state damage cap status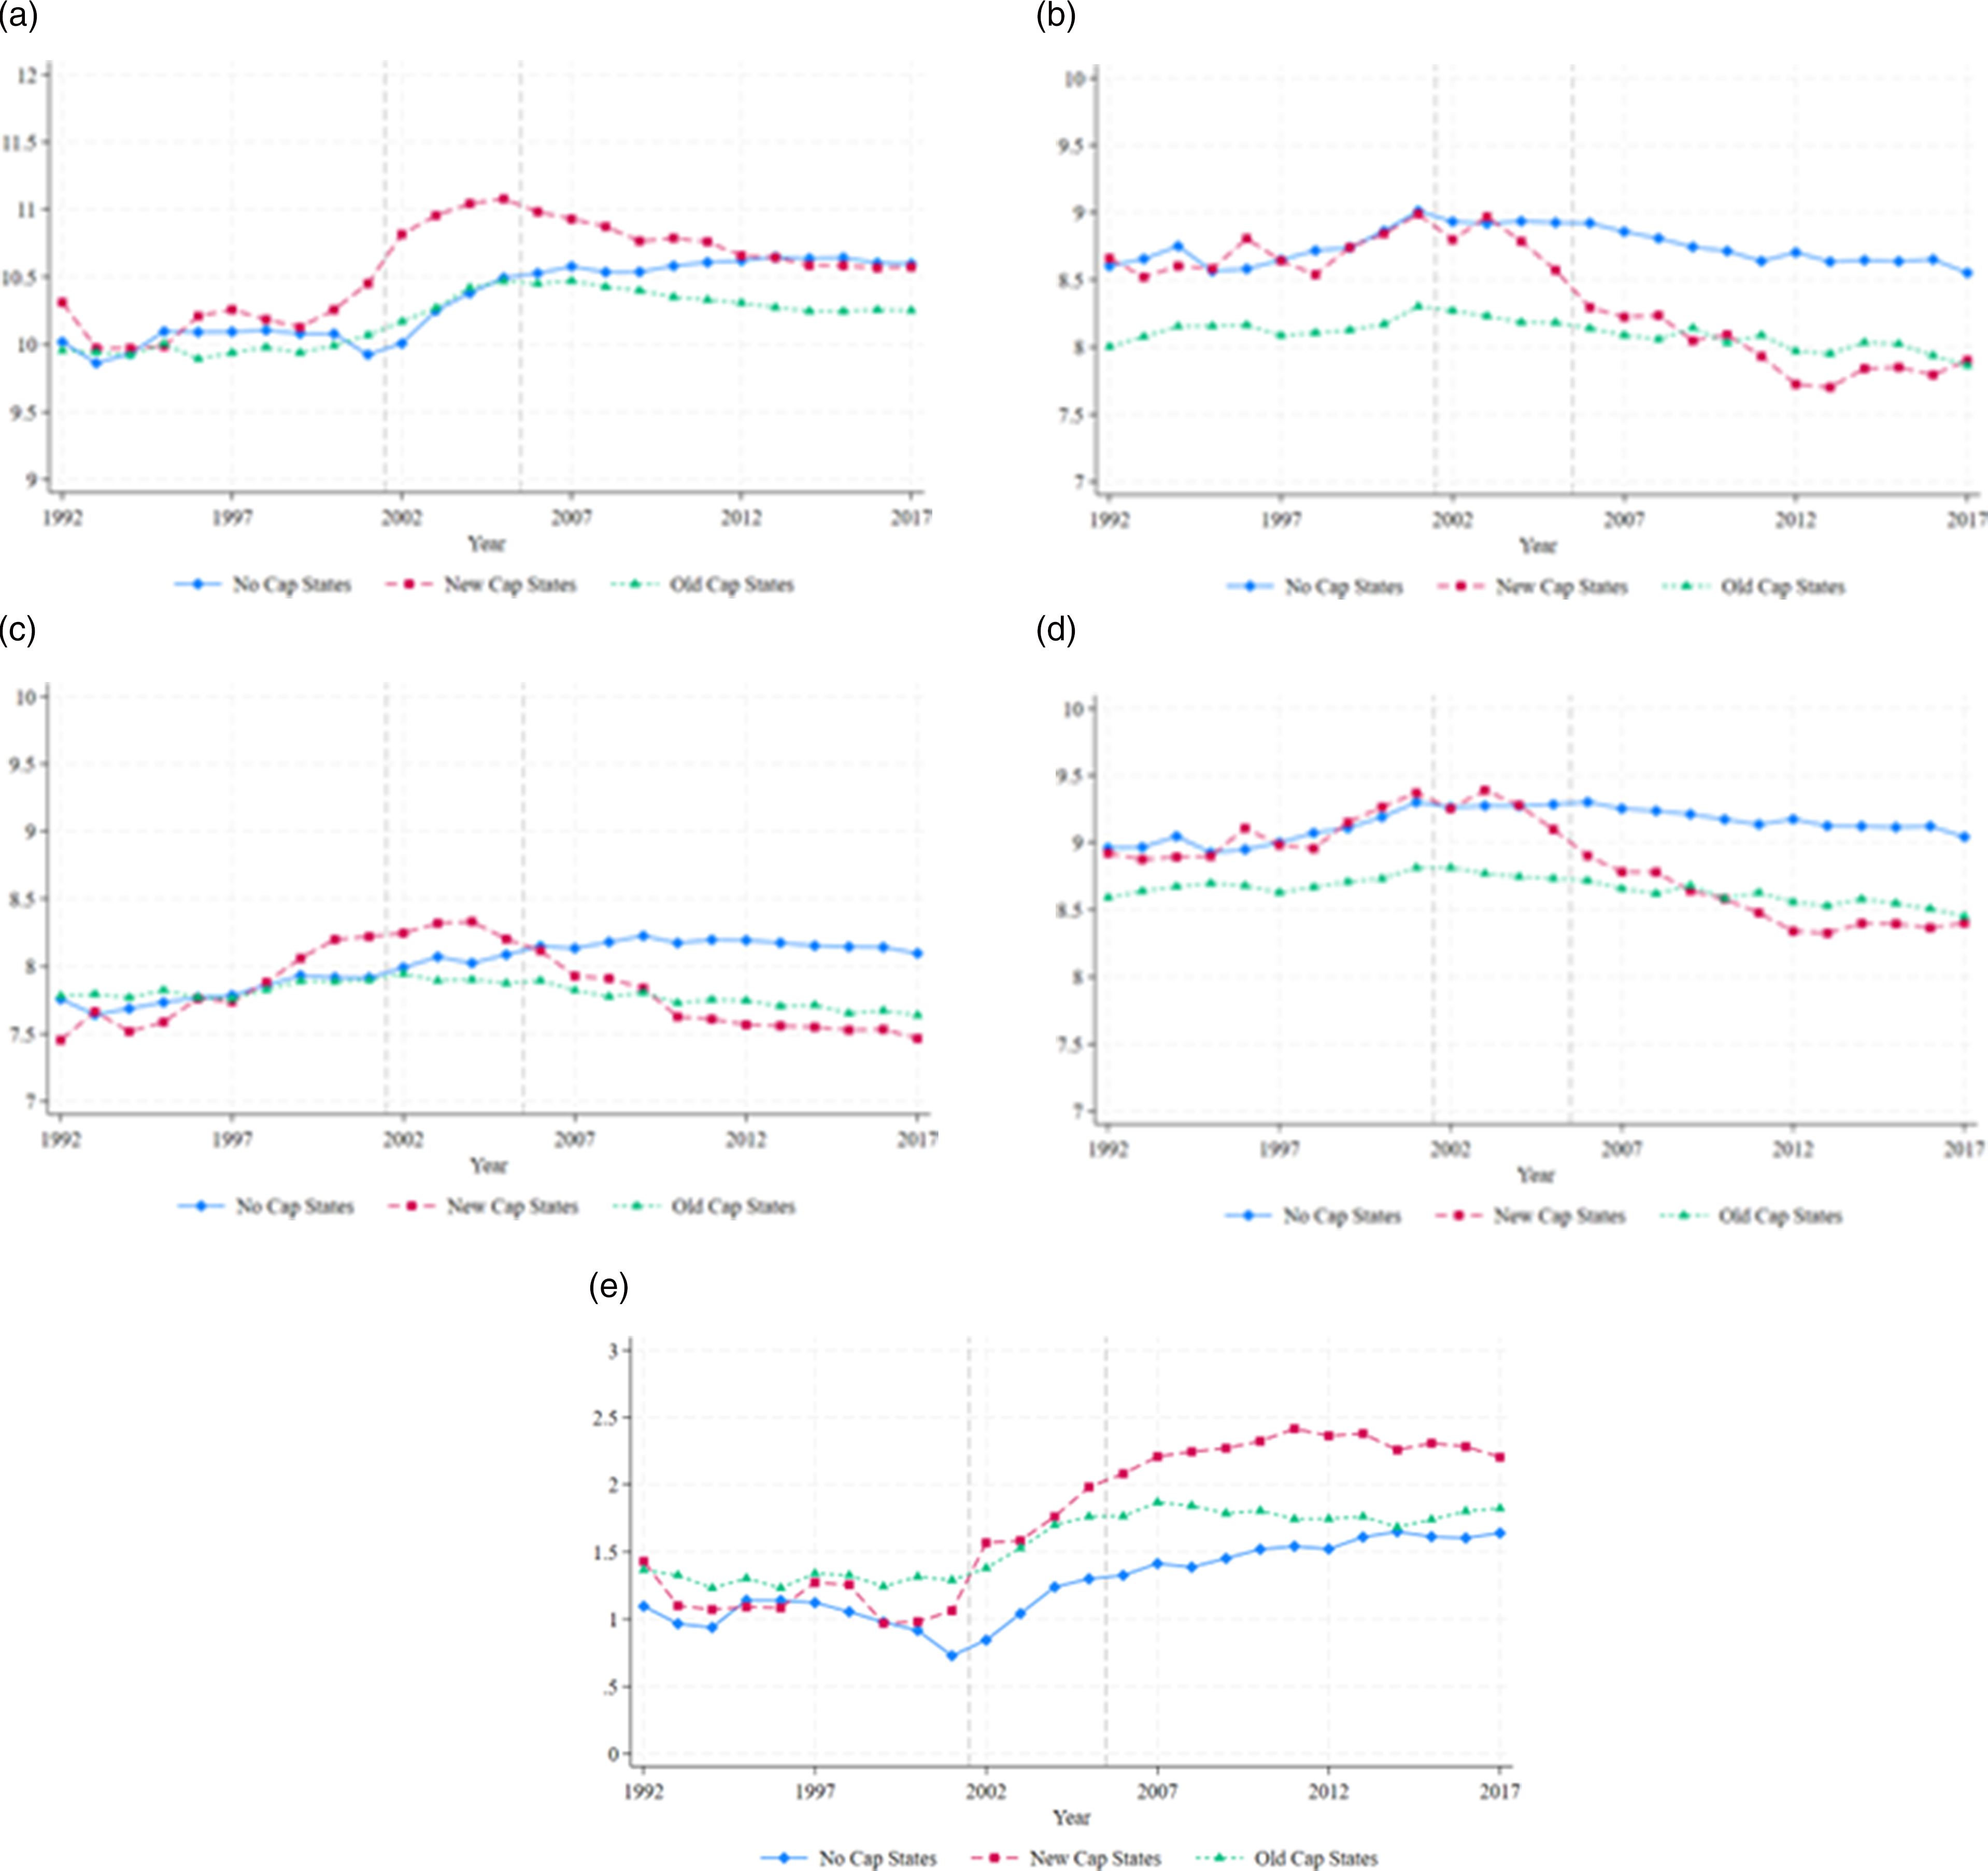
In Panel B, ln(payout) is similar for No-Cap and New-Cap states through 2003, and then begins to fall steadily for the New-Cap States. In Panel C, defense costs also fall more sharply in New-Cap States from a peak in 2004. The pattern for direct cost in Panel D is similar to that for payouts in Panel B. In Panel E, from 1992-2001, the three groups have broadly similar Premium/Cost Ratio, but these ratios diverge after that. The Premium/Cost Ratio for New Cap States rises strongly. By 2007, the ratio in New-Cap states is well above the ratios for the other groups; the gap to the other groups continues to rise through 2011.
In broad brush, Figure 3 suggests that there are three distinct subperiods, within our overall sample period: 1991-2001, when New-Cap States behave similarly to other states; 2002-2011, when the New-Cap Premium/Cost Ratio rises strongly, both in absolute terms and relative to Old-Cap and No-Cap states; and 2021-2017, when the ratios for the three groups again move in parallel.
6. DiD Regression Results
We used the DiD methods noted above to assess the effect of cap adoption on ln(premium), ln(defense cost), ln(payout) and ln(Premium/Cost Ratio). We studied, as treated states, the New-Cap states listed in Table 1, plus (i) Georgia and Illinois for the period through 2009 (both states adopted caps in 2005, which were judicially invalidated in 2010); Montana and North Dakota (adopted caps in 1995); and (ii) North Carolina and Tennessee (adopted caps in 2011). 19 We did not study the remaining “Other States” group in Table 1 (Oregon, South Dakota), which have more complex cap adoption patterns. We report results in text using a “broad” control group, consisting of all Old-Cap and No-Cap states, but in the Appendix find similar results with a “narrow” control group consisting of only No-Cap states (Appendix Table A2). We conduct our analysis in event time, relative to each state’s cap adoption year, using a sample period from year −10 to +10.
6.1. Leads-and-Lags Graphs
We begin with a graphical approach. We present leads-and-lags graphs in Figure 4, using the TWFE, Sun and Abraham and Wooldridge approaches. For all approaches we normalize the treatment effect to zero in year −3, three years before adoption. With this choice, the graphs will better depict the rise in premia that we observe in cap-adopting states in year −2 and more strongly in year −1 preceding cap adoption. A vertical line separates the pre-treatment and treatment periods. We provide annual point estimates; small vertical lines indicate 95% confidence intervals (CIs). We study five outcomes: ln(premia) (Panel A); ln(payout/physician) (Panel B); ln(defense cost/physician) (Panel C); ln(direct cost/physician) (Panel D); and ln(premium/cost) (Panel E). For all outcomes, annual coefficients are consistent across the three approaches. DiD leads-and-lags analysis: premia, costs, and cap adoption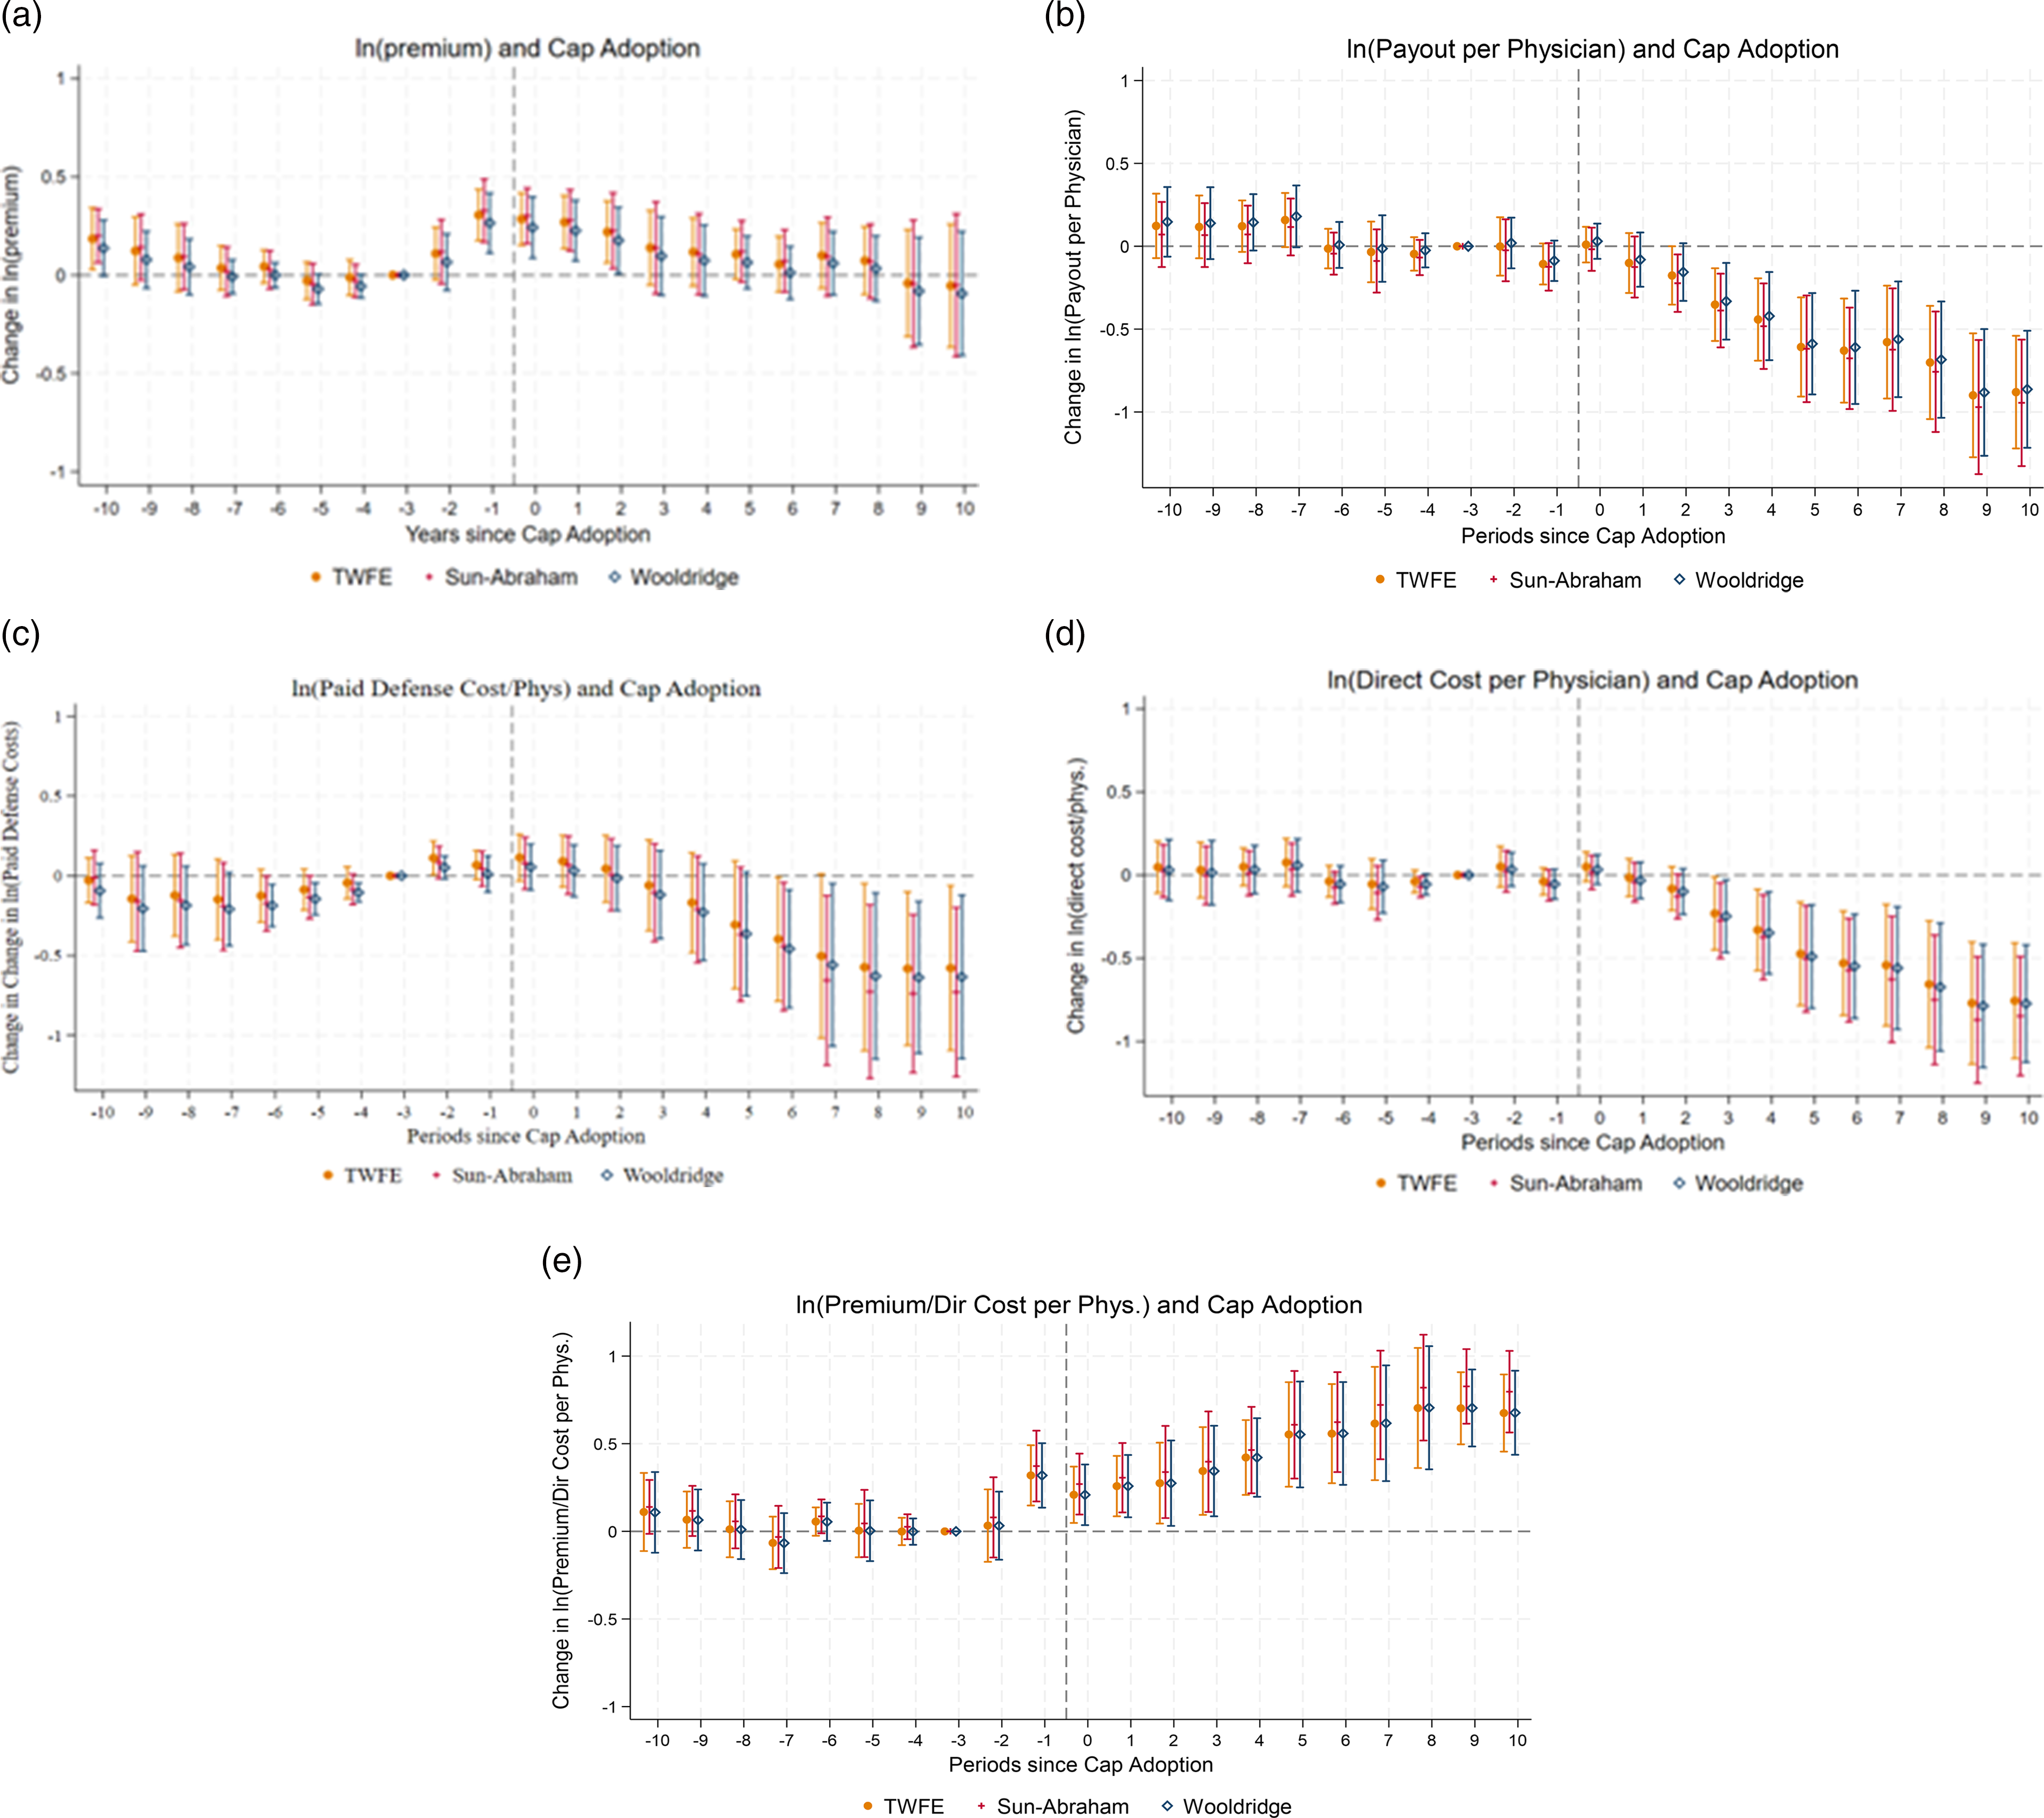
In Panel A, we study ln(premia). Pre-treatment trends are reasonably flat over years −7 to year −3. There is an uptick for future cap-adopting states in year −2, and a much sharper relative rise in year −1. Premia are then similar in years 0 and +1 before starting to fall. Cap adoptions do not appear to be caused by differential trends in insurer costs (Panel B and Panel C), but Panel A provides evidence that they are preceded by rises in premia. This association could well be causal. The public choice story is straightforward: med mal premia rise (for some reason), physicians then seek legislative relief. Physicians and insurers treat rising premia (the “smoke”) as evidence of an underlying “fire” (rising med mal costs) and in some states, succeed in obtaining a damage cap despite lack of an actual fire. Black et al. (2005) provide evidence supporting this smoke-without-fire story for Texas; here, we provide evidence consistent with this explanation, across the cap-adopting states. Relative premia do fall as one moves further into the treatment period, but only to roughly the level of years −7 to −3, despite a sharp fall in direct cost/physician in years +3 and beyond (Panel B).
In Panel B, ln(payout/physician) is the outcome. Pre-treatment trends are reasonably parallel. This provides evidence that caps do not appear to be adopted in response to rising insurer costs. After cap adoption, payout/physician is reasonably stable through year +2, a period dominated by older cases not subject to the cap (Paik et al., 2013b). After that, it trends strongly downward as the cap affects both the number of claims that are brought and payouts in those cases, consistent with prior work (id.). That decline levels off in years +8 to +10. The post-cap-adoption changes in ln(direct cost/physician) and in the Premium/Cost ratio are much larger in magnitude than the mild non-parallelism seen for these outcomes in the pre-treatment period.
In Panel C, we study ln(defense cost/physician). Pre-treatment coefficients are generally rising during much of the pre-adoption period, reasonably flat over years −2 to +2, and then decline after that. Similar to payout/physician, defense cost/physician starts declining around year +3.
In Panel D, we study the effect of cap adoption on ln(direct cost). Pre-treatment trends are reasonably flat, and do not change much through year +2. After that, direct cost falls sharply over years +3 to +8 and then levels off. The trend in direct cost is similar to the trend in payout, which is the main component of direct cost. The leads-and-lags graphs show that while direct cost falls to well below pre-treatment levels, premia only relax back to pre-treatment levels. These different trends are consistent with the univariate graphs (Figure 3).
In Panel E, we study the Premium/Direct Cost Ratio. Pre-treatment trends are reasonably flat through year −2. After that, the pre-cap-adoption rise in relative premia in Panel A, combined with flat relative direct cost/physician in Panel D, produces a rise in the Premium/Cost Ratio in year −1. The Premium/Cost Ratio then remains stable and perhaps declines slightly through year +3, but rises after that, as cost falls more sharply than premia.
Thus, the Premium/Cost Ratio rises for cap-adopting states relative to control states at two different times and for two different reasons. The ratio rises starting in year −1 because relative premia rise in cap-adopting even though relative costs are flat, and rises again starting in year +4 as relative costs fall much more sharply in the cap-adopting states than relative premia.
6.2. Regression Evidence
DiD Results for Effect of Cap Adoption
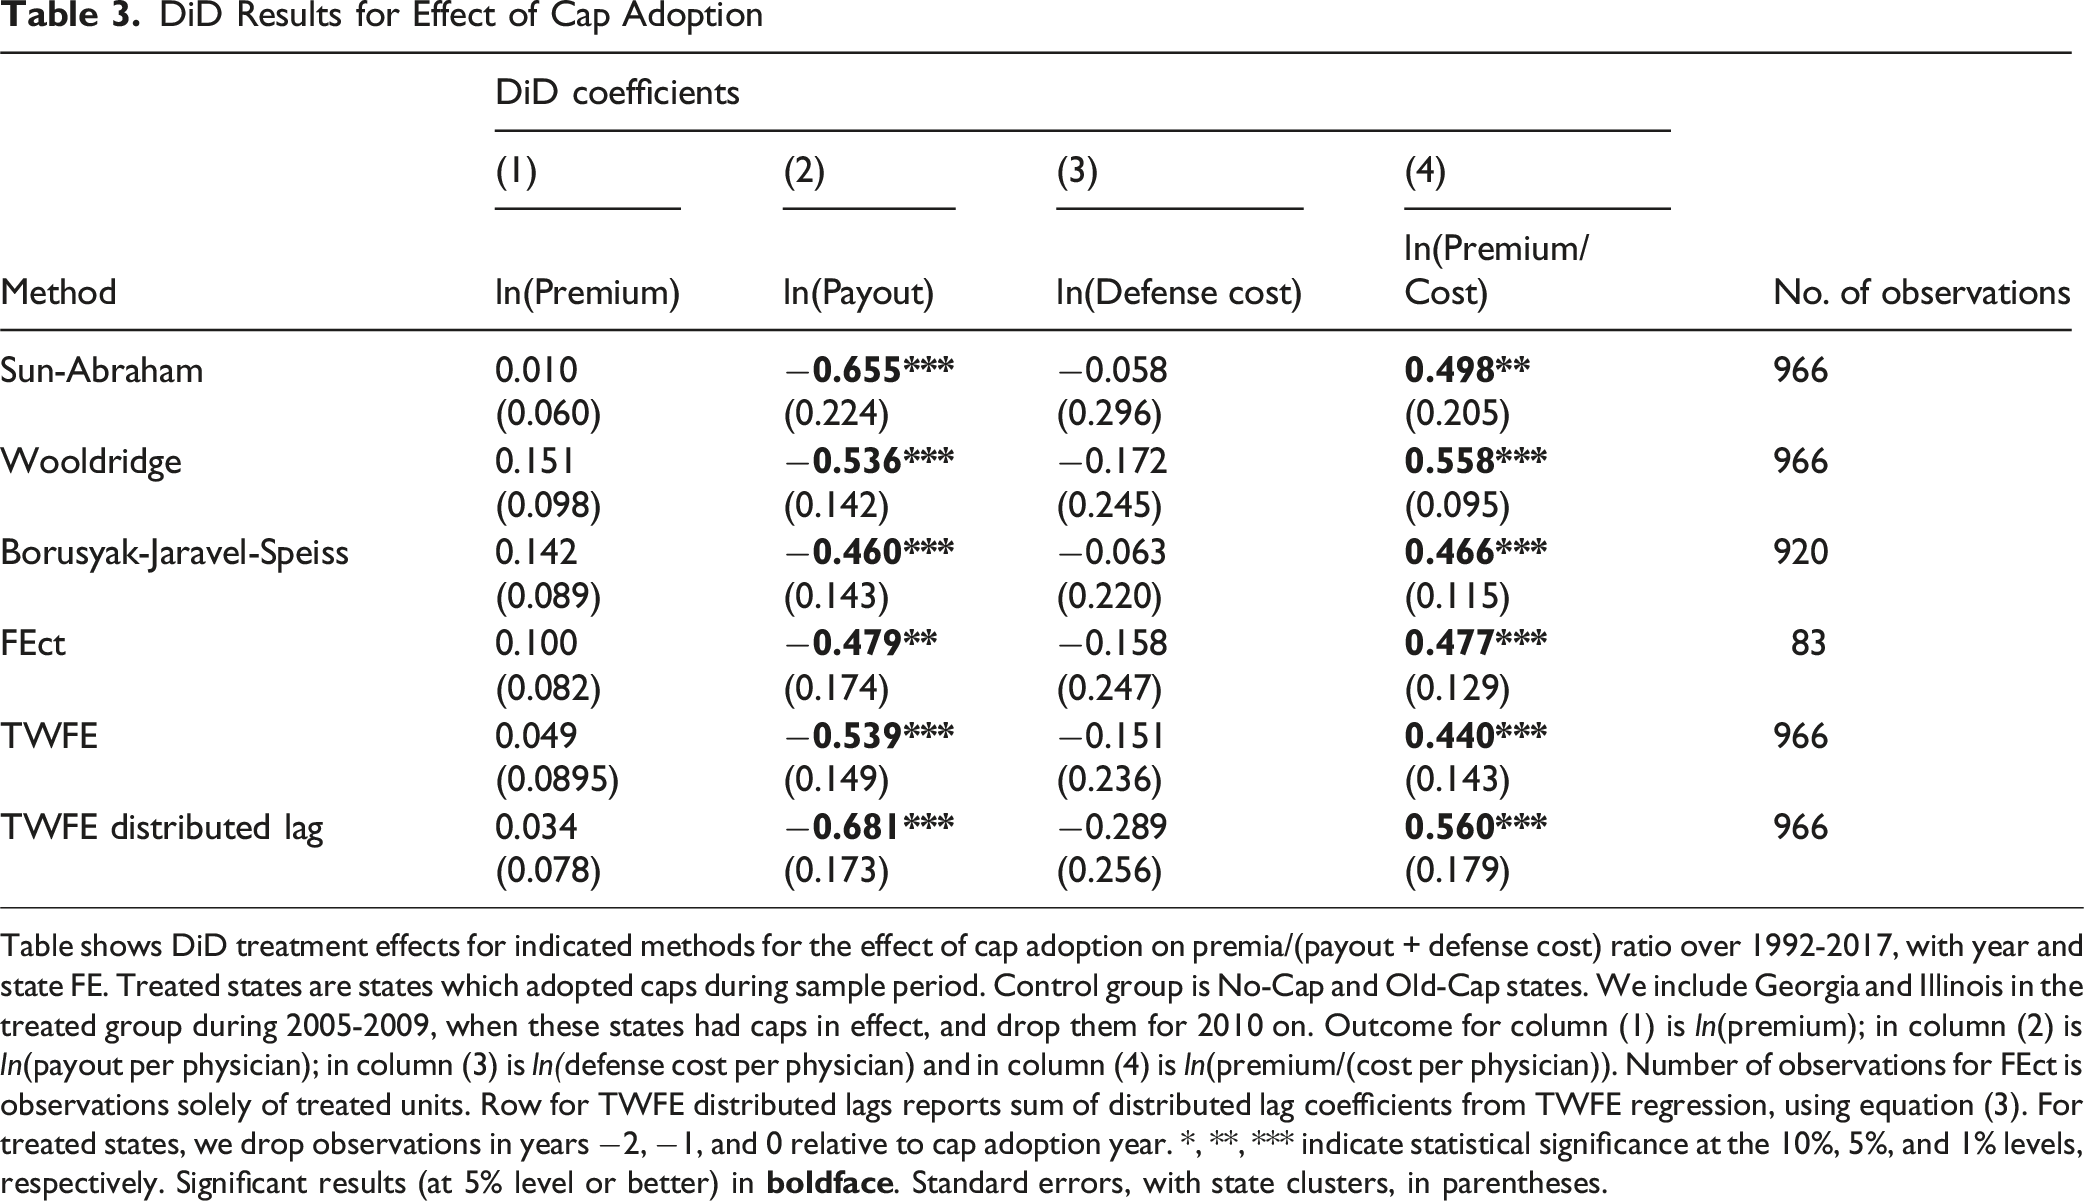
Table shows DiD treatment effects for indicated methods for the effect of cap adoption on premia/(payout + defense cost) ratio over 1992-2017, with year and state FE. Treated states are states which adopted caps during sample period. Control group is No-Cap and Old-Cap states. We include Georgia and Illinois in the treated group during 2005-2009, when these states had caps in effect, and drop them for 2010 on. Outcome for column (1) is ln(premium); in column (2) is ln(payout per physician); in column (3) is ln(defense cost per physician) and in column (4) is ln(premium/(cost per physician)). Number of observations for FEct is observations solely of treated units. Row for TWFE distributed lags reports sum of distributed lag coefficients from TWFE regression, using equation (3). For treated states, we drop observations in years −2, −1, and 0 relative to cap adoption year. *, **, *** indicate statistical significance at the 10%, 5%, and 1% levels, respectively. Significant results (at 5% level or better) in
Consider first the Premium/Cost Ratio (col. 4). There is a large, statistically significant rise across approaches. The coefficients from the staggered DiD approaches cluster in a fairly narrow range, between 0.466 (Borusyak-Jaravel-Speiss) and 0.558 (Wooldridge). The TWFE coefficient is lower, at 0.440 but will be downward biased given that the treatment effect phases in over time. The TWFE distributed lag coefficient of 0.560 is similar to the staggered DiD estimates. All estimates imply large percentage increases in the Premium/Cost Ratio, with estimated increases from 55% for TWFE to 75% for the distributed lag estimate.
Consider next ln(premium) (col. 1). All models show a positive but insignificant coefficient for ln(premium), ranging from 0.010 for Sun-Abraham to 0.151 for Wooldridge. Across methods, coefficients are not statistically significant. This is consistent with the leads-and-lags graphs (Figure 4, Panel A), where the annual coefficients are positive and statistically significant, relative to a base year of −3, only in years 0, 1, and 2.
Consider next ln(payout) (col. 2). All of the staggered DiD methods show a substantial post-cap decrease in ln(payout), ranging from −0.460 (58% decrease) for Borusyak, to −0.655 (92% decrease) for Sun-Abraham. The TWFE coefficient and the distributed lag sum of coefficients are similar. These results are consistent with the leads-and-lags graphs (Figure 4, Panel B).
Consider finally ln(defense cost) (col.3). All of the staggered DiD methods show negative, but not statistically significant coefficients, ranging from −0.058 (Sun-Abraham) to −0.172 (Wooldridge). These coefficients are again consistent with the leads-and-lags graphs (Figure 4, Panel C), which show gradually declining defense costs.
6.3. Results with NAIC Data
In the Appendix, we consider an alternative approach which relies more heavily on NAIC data (Appendix Table A5 and Figure A6). We replace NPDB data on payouts with NAIC data on direct paid losses, and replace MLM data on premia with NAIC data on direct premia written. Results with the NAIC data are generally similar to those in the text, except that: (i) there is a larger drop in NAIC direct premia written than in MLM per-physician premia; (ii) for our core outcome, ln(premium/cost), the event study graphs and long-term distributed lag coefficients are similar, although the increase in ln(premium/cost) in New-Cap States appears more gradually using the NAIC data.
The general correspondence between the results in text, based primarily on MLM and NPDB, and the NAIC-based results in the Appendix increases our confidence that cap adoption leads to a long-run increase in the premium/cost ratio, as insurer costs fall farther than premia.
6.4. Additional Robustness Checks
We conduct a number of additional robustness checks for the DiD results. First, we use a narrow control group, limited to No-Cap States. Second, we exclude Georgia and Illinois entirely from the set of treated states. Third, we conduct the DiD analysis at the more granular firm*county*specialty level, instead of at the state level. Results are similar to those in the text across these specifications.
7. Panel Data Regression Results
Determinants of Med Mal Premia and Costs
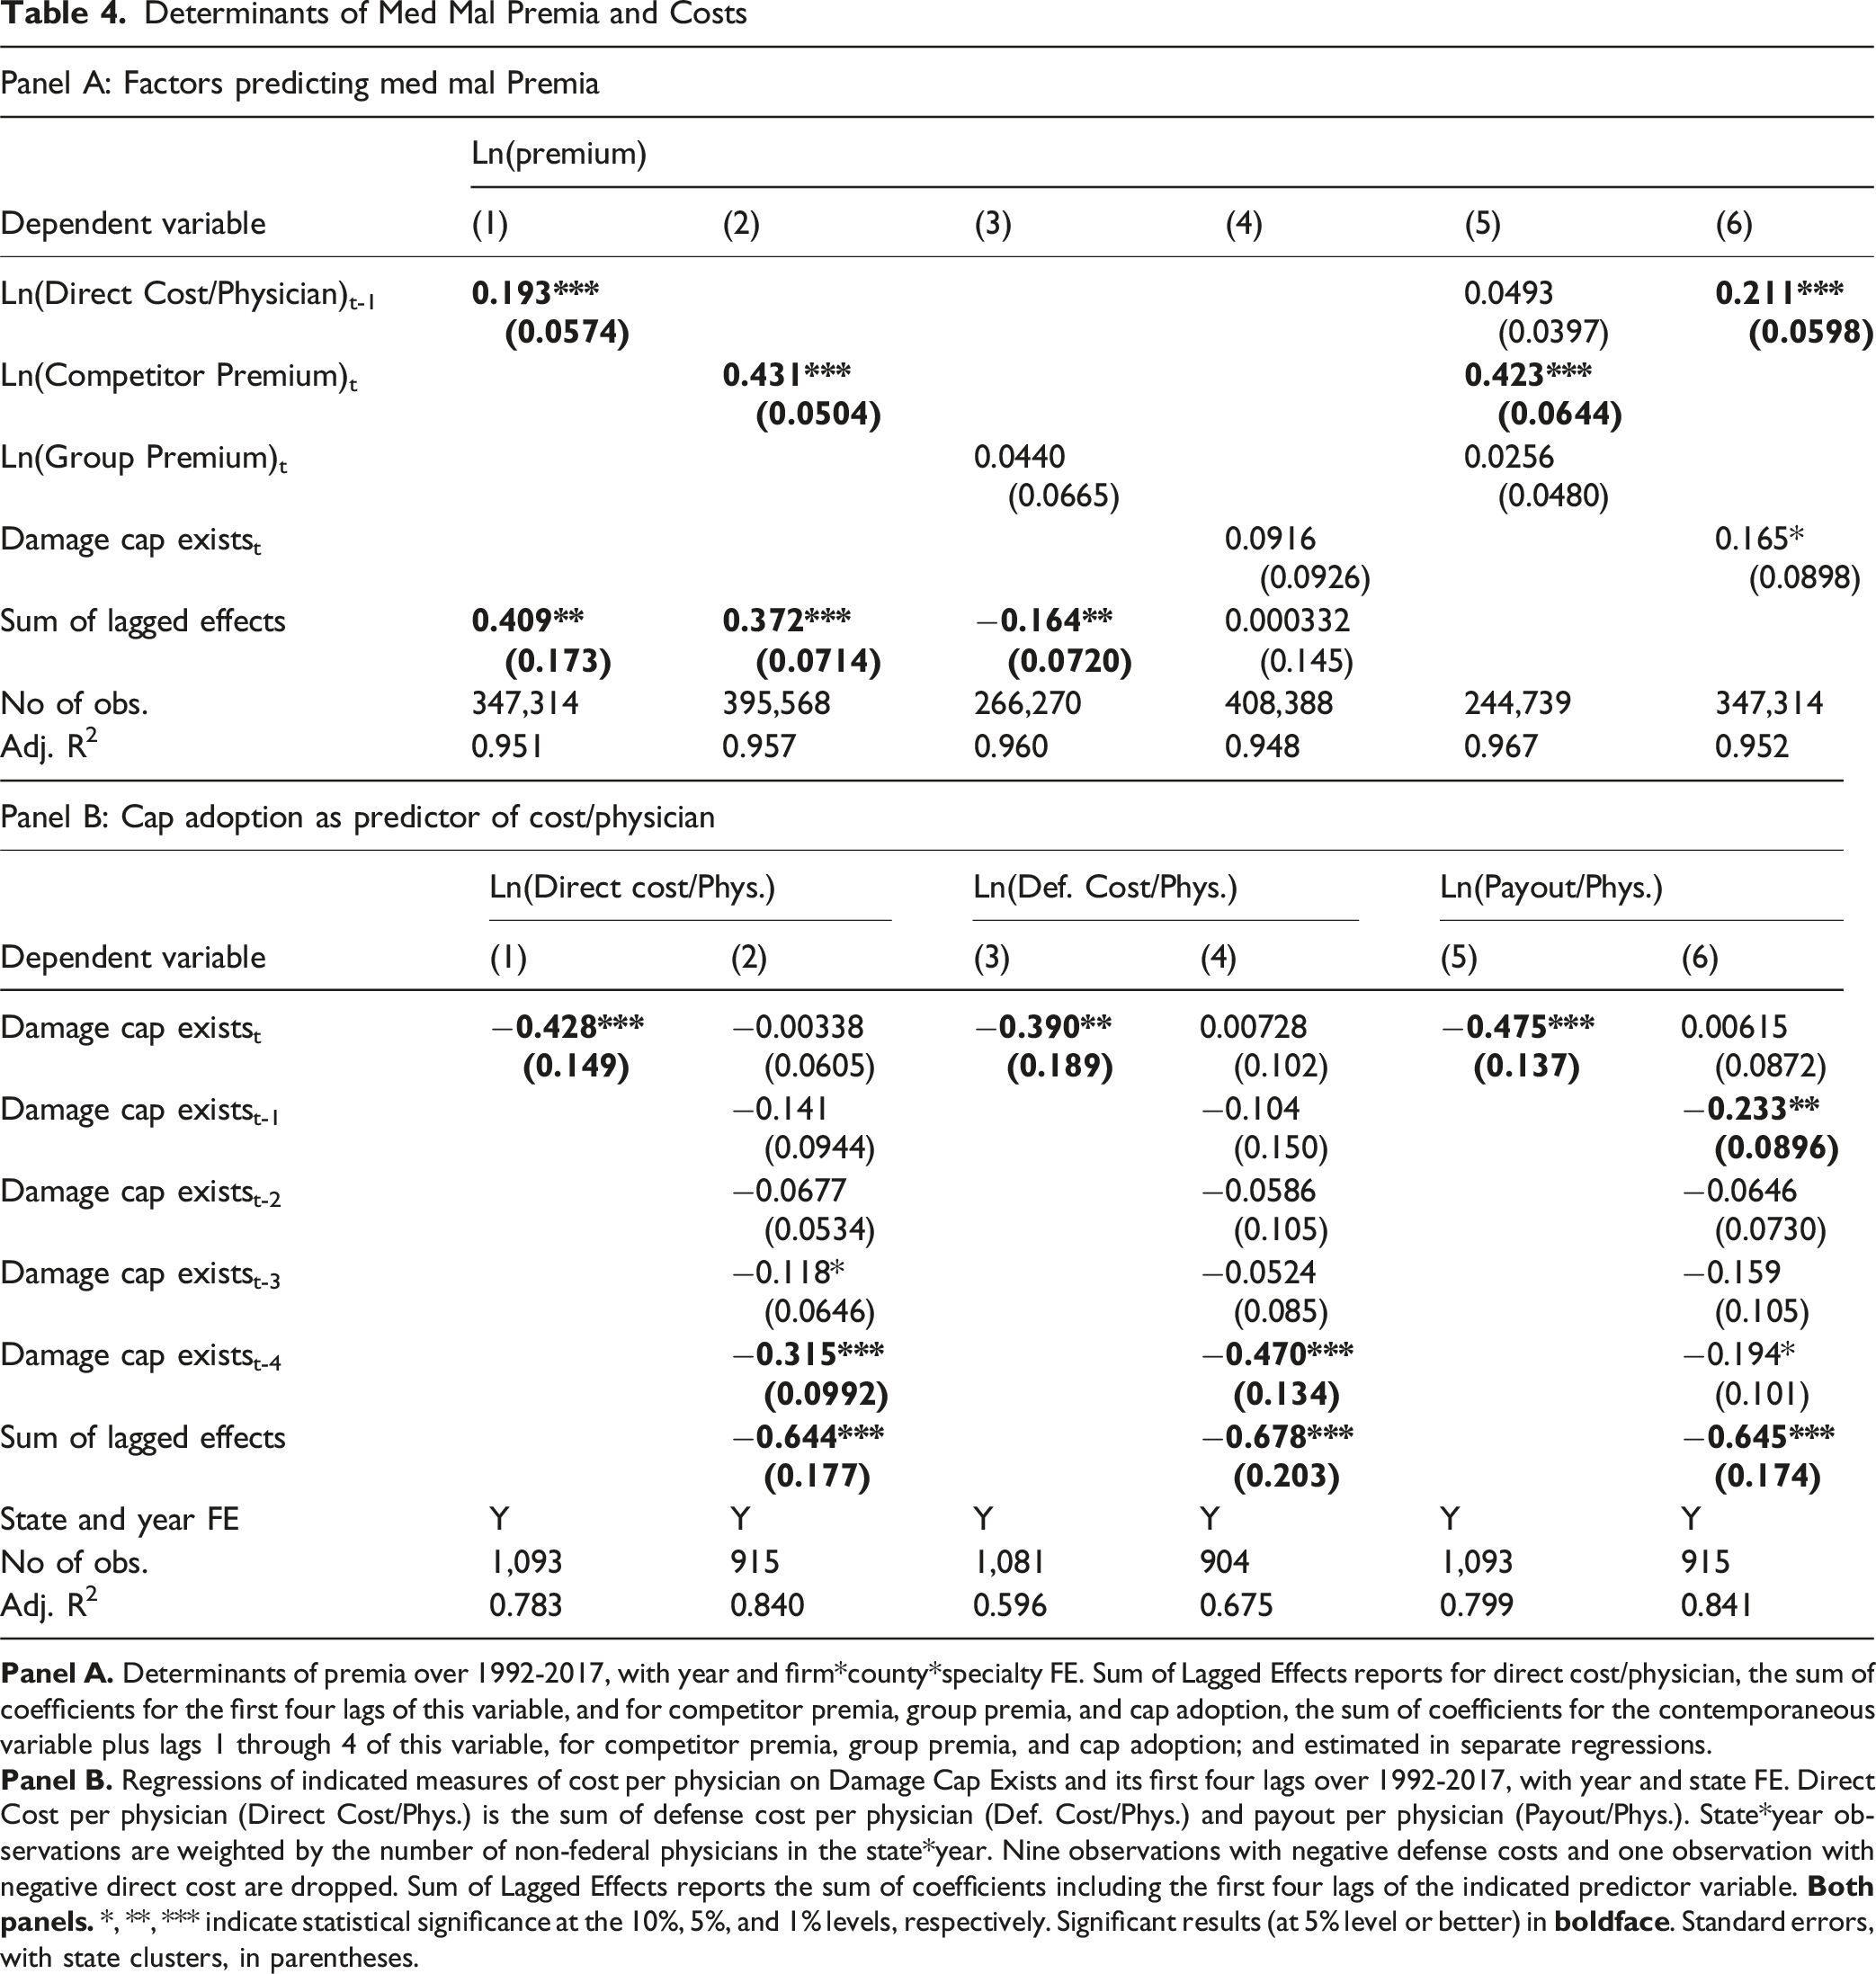
In column (4), the coefficient on cap adoption is positive (opposite from predicted), although insignificant. This is consistent with the DiD results, yet is not expected on economic grounds, since damage caps predict lower direct cost/physician, as seen in the DiD analysis.
We also run separate models in which we include the first four lags of each variable, and report results in a separate row of Table 4, Panel A, for the sum of the direct and lagged coefficients (see Appendix Table A6 for full year-by-year results). When we add lags, the responsiveness of premia to changes in direct cost/physician increases but remains well below 1: a 1% change in direct cost/physician predicts an 0.41% change in premia. A 1% change in competitor premia predicts a 0.37% change in an insurer’s own premium, close to the contemporaneous correlation and to the predictive effect of cost including lags. Long-term increases in the premia charged in other states by members of the same parent insurance group predict lower long-term in-state premia, consistent with cross-subsidization of firms within groups over time, in contrast to the near-zero same-year correlation in regression (3). The long-run elasticity of premia with cap adoption is close to zero, when we would expect it to be strongly negative given the long-run effect of caps on direct cost.
Columns (5) and (6) of Table 4, Panel A combine predictor variables in a single regression, to allow for possible colinearity. Column (5) includes cost/physician, competitor premia, and group premia. Competitor premia remains a strong predictor of a firm’s malpractice premium with a point estimate close to its value when used alone in column (1). However, the elasticity of premia with respect to direct cost/physician, now measured orthogonal to the effect of competitor premia, falls to around 0.05 (insignificant). This is consistent with insurers reacting more strongly to competitor prices than to their own costs.
In column (6), we include direct cost/physician and Damage Cap Exists in the same regression. On theoretical grounds, we expect damage caps to affect premia primarily indirectly through reducing direct cost/physician. Thus, including both variables in the same regression could potentially lead to the Damage Cap Exists variable capturing some of the effect of cost/physician. Instead, the predictive power of lagged cost is similar when Damage Cap Exists is included in the same regression. Meanwhile, the coefficient on Damage Cap Exists remains positive (opposite from predicted) and strengthens to marginal significance.
In Table 4, Panel B, we explore further the positive coefficient on Damage Cap Exists in Panel A by using Damage Cap Exists and its first four lags to predict direct cost/physician and its components, payout and defense cost. We estimate separate regressions for direct cost and for its components – payout and defense cost each cost measure of cost. In columns (1), (3), and (5), we use only a contemporaneous measure of whether a damage cap exists. Damage Cap Exists predicts sharply lower levels of both defense cost and payout, with a somewhat larger drop in payout. The −0.428 coefficient in column (1) implies 35% lower direct cost/physician in states with damage caps. In columns (2), (4), and (6), we include the first four lags of Damage Cap Exists and report the sum of the lagged effects as a separate row in the table. The coefficients on the lags of Damage Cap Exists are uniformly positive and provide evidence that the predicted effect of a damage cap on cost increases with time since adoption. In column (2), the −0.644 sum of coefficients indicates that, including lags, cap adoption predicts a 48% drop in direct cost/physician. These estimates are consistent with the DiD analysis above.
Determinants of Premium/Cost Ratio
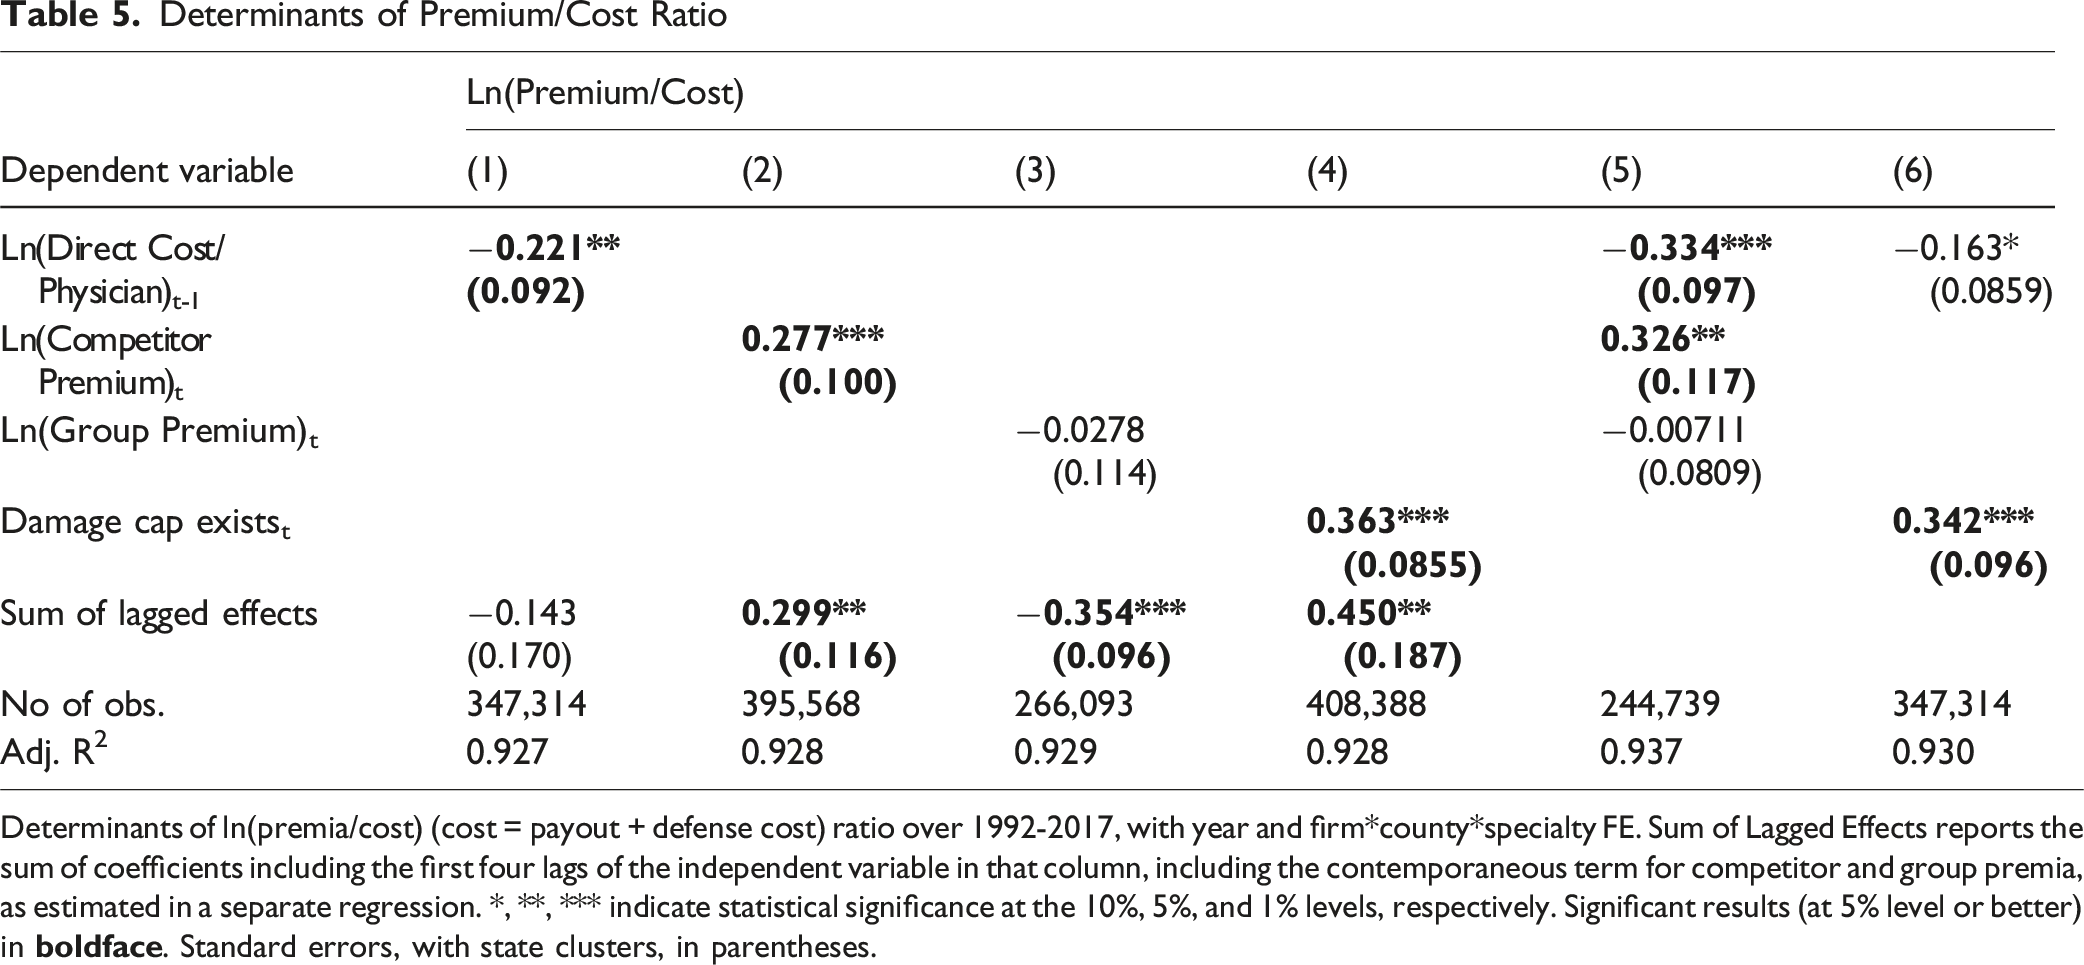
Determinants of ln(premia/cost) (cost = payout + defense cost) ratio over 1992-2017, with year and firm*county*specialty FE. Sum of Lagged Effects reports the sum of coefficients including the first four lags of the independent variable in that column, including the contemporaneous term for competitor and group premia, as estimated in a separate regression. *, **, *** indicate statistical significance at the 10%, 5%, and 1% levels, respectively. Significant results (at 5% level or better) in
In column (2), competitor premium is a strong predictor of the Premium/Cost Ratio. This is consistent with imperfect competition, in which insurers can charge higher premia relative to costs, as long as their competitors do likewise. In column (3), we find, similar to Table 4, a small, insignificant contemporaneous coefficient on group premium, but this coefficient becomes strongly negative when we include lags, suggesting cross-subsidization.
Damage Cap Exists strongly predicts higher Premium/Cost Ratio, with similar strength whether we do not (column (4)), or do (column (6)) control for direct cost/physician. The coefficients are similar to the DiD estimates in Table 3. In column (4), cap adoption predicts a 44% higher Premium/Cost Ratio, which rises to 58% if we allow for lagged effects. Yet in a fully competitive market, caps should affect premia only through their effect on cost and should not significantly affect the Premium/Cost Ratio. The positive coefficient is consistent with insurers being able to earn excess profits in states that adopt damage caps. These profits are not competed away even over the substantial post-cap adoption time period we study.
With state FE in the regression model, the coefficient on the Damage Cap Exists variable is identified based on states that adopt or rescind damage caps during our sample period. The result for cap adoption from our specification can be given a causal interpretation if cap adoption is exogenous, for which we found evidence above using the DiD specification.
8. Additional Panel Data Analyses and Limitations
8.1. Competition
In Appendix Table A5, we assess the predictive power of number of competitors for premia. In most markets, new entry should lead to lower prices at least in the medium term. Instead, the number of competitors with prices reported in MLM takes a positive but small and insignificant coefficient in predicting both premia and Premium/Cost ratio. When we include four lags of the number of companies, this coefficient strengthens and becomes statistically significant. Thus, new entry does not mitigate the effect of cap adoption on premia or the Premium/Cost Ratio.
8.2. Time Periods
Figure 1, Panels A and B, show that medical malpractice premia were stable in the 1990s, with a sharp increase in rates from 2001 to 2005 and gradually falling rates thereafter. Given this time pattern, we examined whether the determinants of premia and the Premium/Cost Ratio might be different in an early period from 1992-2000 versus a later period from 2001-2017. We present results in Appendix Table A10 using selected specifications from Table 4, Panel A, for premia and Table 5 for the Premium/Cost Ratio. Overall, our results for the weak effects of direct cost/physician on premia and the unexpected positive coefficients on Damage Cap Exists in predicting Premium/Cost Ratio are not driven by the early or later part of our sample period. At the same time, the variation between the early and late periods supports the importance of studying the med mal insurance market over an extended time period.
8.3. Specialty-Specific Results
MLM includes separate premium data for internists, general surgeons, and obstetricians-gynecologists. Above, we pool this data across specialties. In Appendix Table A9, we report selected results by specialty for ln(premium) and ln(premium/cost). The estimated coefficients are similar to the pooled results, shown in Tables 4 and 5. Thus, no single specialty drives our main results.
8.4. Correlations in Premia Across Specialties
Comparing Premia Across the MLM Specialties
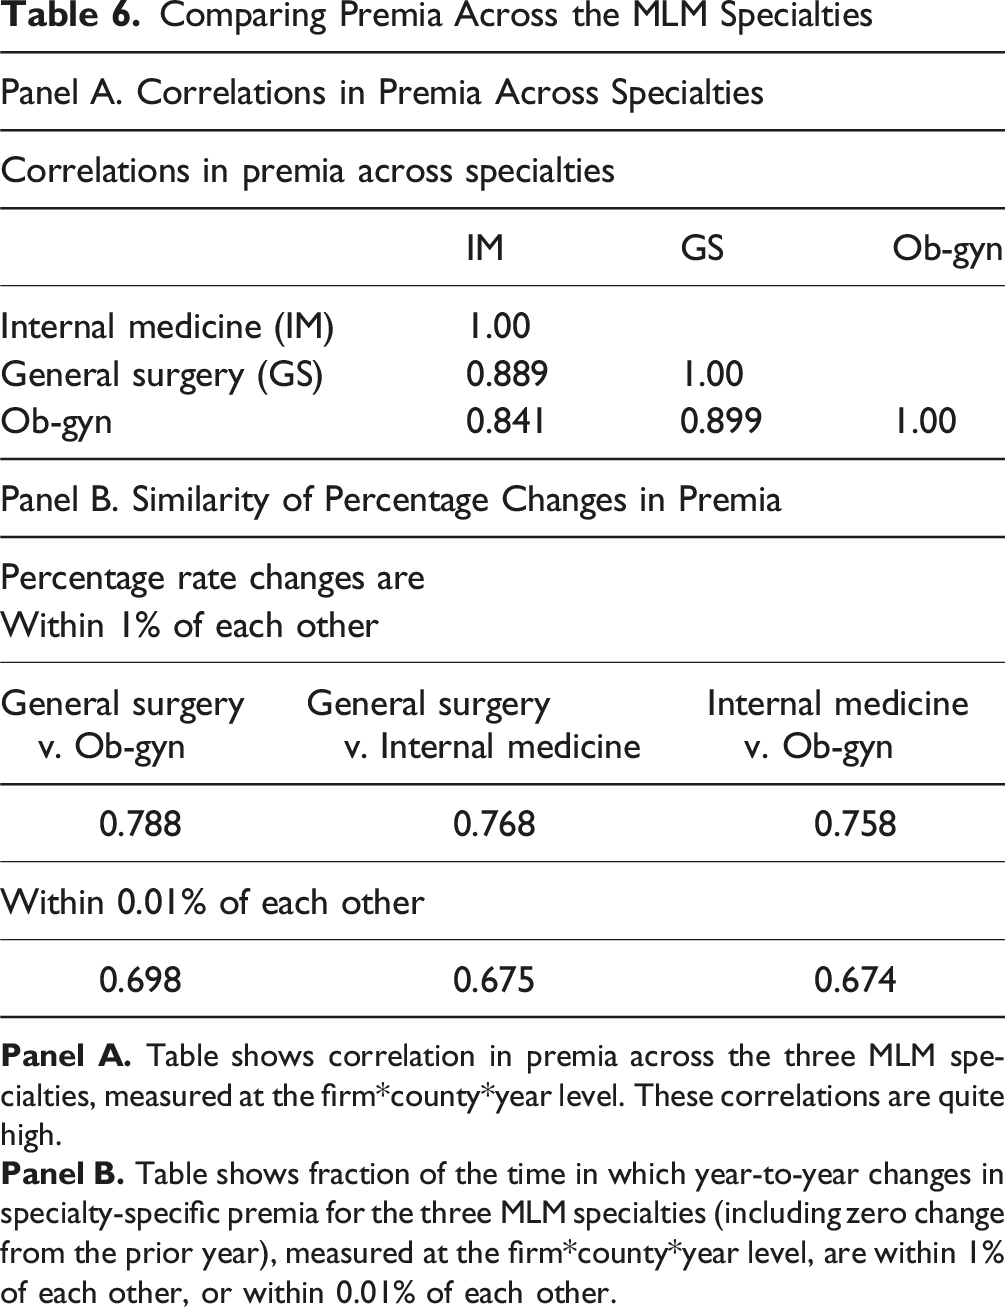
In Table 6, Panel B, we assess comovement in premia in a different way. We assess, at the firm*county*year level, what fraction of the time a percentage rate change for one specialty was within 1% (or within 0.01%) of the rate change for another specialty. Percentage changes are within 1% of each other around 76%-79% of the time. Most of these percentage rate changes are exact (within 0.01%). The likelihood of a similar percentage change is virtually the same if we compare a high-risk specialty (general surgery or ob-gyn) to a moderate-risk specialty (internal medicine), versus comparing the two high-risk specialties.
9. Limitations
We rely on data from three separate sources (MLM for premia, NPDB for payouts, NAIC for defense costs). This creates a risk of mismatch between the data sources.
Our data on payouts and defense costs is available only at the state*year level; we cannot assess to what extent time trends for these cost elements vary across specialties.
MLM provides data only for three specialties, internal medicine, general surgery, and ob-gyn. Our analysis assumes that time trends in premia for these three specialties are representative of time trends for all physicians. We confirmed above that the three specialties follow similar trends, but lack a way to assess whether this is true for other specialties.
Premia and the Premium/Cost Ratio are based on a standard $1M/$3M policy. We believe, from conversations with med mal lawyers, that most physicians purchase standard limits, but an unknown number purchase larger or smaller policies. Moreover, damage cap adoption may affect the policy limits physicians choose to purchase.
MLM relies on insurers to report premia, and does not audit the insurer reports. For two major national insurance groups, which do not provide data to MLM, MLM obtains premia from state insurance department filings. We see no reason why any reporting inaccuracies for individual insurers would bias our results.
We do not observe any rebates that insurers might offer to physicians off the “list” price that they report to MLM. It is possible that insurers in new-cap states might have responded to declining payouts by changing the discounted price more than the “list” price.
We lack data on some factors that will affect insurer costs and pricing, especially reinsurance availability and premia.
10. Discussion and Conclusion
10.1. Implications for Legal Policy
There is an ongoing legal debate in the United States over state-level medical malpractice reforms, of which caps on non-economic damages are the most important. Proponents assert that these reforms can reduce defensive medicine and thus healthcare costs, retain physicians in the state, and limit frivolous litigation. The empirical literature finds no evidence that damage caps reduce healthcare costs or attract physicians to reforming states (Black et al., 2021), and are associated with increases in adverse hospital safety events (Zabinski & Black, 2022). In this project we add to this evidence by showing that insurers retain much of the gains from smaller and less frequent payouts, with only partial passthrough if savings to physicians through lower premia. The cumulative body of empirical evidence suggests that cap adoption does not benefit patients, and may in large measure redistribute wealth from injured patients to med mal insurers, raising questions about the legal rationale and equity of state-level reform efforts.
10.2 Possible Mechanisms
We raise puzzles, but do not solve them. It is not clear why premia do not fully respond to changes in costs, nor why cap adoption predicts higher premia and, apparently, sustained supranormal profits.
We can offer some speculations as to why competitive pressures operate so slowly. First, physicians may have substantial switching costs. Physicians care intensely about an insurer’s reputation for defending claims and for maintaining coverage following a claim. A second potential factor is a type of anchoring. If premia remain constant or decrease slightly in nominal dollars, as was often the case in New Cap States following cap adoption, many physicians may not search for a possible lower price from another insurer. This could let insurers charge premia based largely on what their competitors charge rather than on their costs alone, without losing many customers. Third, med mal insurance prices are public (filed with state insurance commissioners), which could facilitate informal collusion in oligopolistic state insurance markets. Fourth, med mal premia are influenced by reinsurance markets, which are also imperfectly competitive.
10.3. Conclusions
We present here evidence on med mal premia over a 25-year period, and how damage caps affect premia. The data are, in important respects, in tension with a smoothly functioning, reasonably competitive market. The puzzles include: (i) insurer direct costs are a weaker than expected predictor of premia; (ii) damage caps predict a substantially higher Premium/Cost Ratio; (iii) competitor premia predict premia more strongly than measures of insurer cost; (iv) insurers earn consistently high profits, proxied by the Premium/Cost Ratio, from 2005 through the end of our sample period, in 2017, relative to earlier years; (v) there are large variations in the mean Premium/Cost Ratio across states at any point in time, and within states across time; (vi) states with more competing insurers have modestly higher premia in both the near and medium term; and (vii) premia respond to predictors, including insurer direct cost, with multiyear lags (we study lags up to four years). Using a DiD framework, we find evidence that the association between cap adoption and higher Premium/Cost Ratio is causal: caps drive down insurer costs, but premia do not fall nearly as far as costs, leading to rising premia/cost ratios. These persist through the end of our sample period, well over a decade after the early 2000s wave of cap adoptions. We also find evidence for reverse causality, with a rising Premium/Cost Ratio predicting cap adoption.
Future research into the determinants of medical malpractice premia is needed to better understand med mal insurance market dynamics. It is also not clear why med mal premia rose so sharply in the early 2000s, when little was happening in the tort system that should have led insurers to expect rapidly rising costs.
Supplemental Material
Supplemental Material - Some Puzzles in Medical Malpractice Insurance Pricing
Supplemental Material for Some Puzzles in Medical Malpractice Insurance Pricing by Bernard Black, Francesco Maria Rossi, Jeffrey Traczynski, Victoria Udalova in Journal of Law & Empirical Analysis.
Footnotes
Author’s Notes
Northwestern University School of Law, Law and Econ Research Paper Number 22-09, IZA Institute of Labor Economics, Discussion Paper No. 15,392.
Acknowledgements
We thank Tom Baker, Patricia Born, seminar participants at Hebrew University Business School, University of Haifa law faculty, and Tel Aviv University law faculty for comments. Any opinions and conclusions expressed herein are those of the authors and do not necessarily represent the views of the U.S. Census Bureau. The research in this paper does not use any confidential Census Bureau information.
Funding
The authors received no financial support for the research, authorship, and/or publication of this article.
Declaration of Conflicting Interests
The authors declared no potential conflicts of interest with respect to the research, authorship, and/or publication of this article.
Supplemental Material
Supplemental material for this article is available online.
Notes
References
Supplementary Material
Please find the following supplemental material available below.
For Open Access articles published under a Creative Commons License, all supplemental material carries the same license as the article it is associated with.
For non-Open Access articles published, all supplemental material carries a non-exclusive license, and permission requests for re-use of supplemental material or any part of supplemental material shall be sent directly to the copyright owner as specified in the copyright notice associated with the article.