
Abstract
As cities accelerate decarbonization through building electrification, the growing dependence on electrical systems introduces new vulnerabilities during power disruptions. While grid-level resilience has been widely studied, household-scale impacts of electrification remain poorly understood. In this study, we develop a vulnerability assessment framework that combines machine learning classification with high-resolution synthetic energy data from 129,000 U.S. single-family homes. Our two-stage approach first identifies household electrification levels with over 80% accuracy and then quantifies outage vulnerability using a composite risk index that incorporates electrification profiles, backup capabilities, and climate exposure. A simulated case study reveals that fully electrified households face significantly higher risks during winter storms, with a 60% greater vulnerability compared to mixed-energy homes. In contrast, solar-equipped electrified households exhibit enhanced resilience during heat waves, leveraging renewable energy resources to mitigate risks. By highlighting critical dependencies and adaptive capacities, our framework emphasizes the importance of energy diversity and distributed energy resources in reducing outage vulnerabilities. This scalable, non-intrusive methodology provides actionable insights for policymakers and urban planners to design climate-resilient urban energy systems.
Keywords
Introduction
As global efforts toward decarbonization accelerate (EIA, 2022; IEA, n.d.), cities are increasingly transitioning to electrified energy systems as a focus of climate mitigation. Electrification holds immense potential for reducing greenhouse gas emissions, with estimates suggesting an 85% reduction in building-sector emissions by 2050 (Sengupta, 2019). However, this rapid shift brings new challenges. The 2021 Texas power crisis illustrated the vulnerabilities of electrified systems, as widespread outages left millions without heat, water, and essential services, resulting in 57 fatalities and $195 billion in damages (T.U. of Texas at Austin Energy Institute, 2021; Busby et al., 2021). As cities become more reliant on uninterrupted electricity, the risks of power disruptions grow, exposing critical gaps in urban resilience planning (Marcotullio et al., 2023).
Resilience efforts to date have largely focused on grid-level interventions, such as improving infrastructure reliability and response mechanisms (Panteli and Mancarella, 2015; Gholami et al., 2018). While these measures are essential, they often fail to address household-level dynamics, where the impacts of outages are felt most acutely (Hasselqvist et al., 2022; Abi Ghanem et al., 2016). Socioeconomic disparities, varying levels of electrification, and uneven adoption of distributed energy resources (DERs) result in a complex and poorly understood landscape of vulnerability. Traditional methods, such as surveys or in-home monitoring, provide valuable insights but are limited in scalability and applicability for resilience planning in diverse urban contexts.
This study addresses these gaps by introducing a data-driven framework for assessing household vulnerability to power disruptions. Leveraging high-resolution synthetic energy data from 129,000 U.S. single-family homes across eight states (National Renewable Energy Laboratory, 2023), we develop a machine learning (ML)-based methodology that classifies household electrification levels with over 80% accuracy and evaluates vulnerability under varying climate and grid stress scenarios. We focus primarily on critical appliances including space heating and cooling appliances, cooking, water heating, and the presence of DERs, specifically solar photovoltaic (PV). By integrating synthetic data and ML, our approach overcomes privacy and data availability barriers, offering a scalable, non-intrusive tool for quantifying resilience at the household level.
The objectives of this research are threefold: (a) to quantify household electrification based on energy use patterns, (b) to develop a scalable framework for assessing vulnerability to power disruptions, and (c) to provide actionable insights for policymakers, urban planners, and utility providers to enhance urban resilience. These contributions aim to inform strategies for designing sustainable and resilient cities in the face of accelerating climate change and urbanization.
The paper is structured as follows: Section 2 reviews related work, highlighting the interplay between electrification, energy resilience, and equity. Section 3 details the methodology, including data processing, feature engineering, and classification models. Section 4 presents the results of the classification and vulnerability assessment frameworks, followed by a case study illustrating their application during extreme weather events. Section 5 discusses the theoretical and practical implications of the findings, and Section 6 concludes with recommendations for future research and policy interventions.
Related work
Theoretical frameworks for building electrification and resilience
Building electrification and household resilience are best understood through three intersecting theoretical lenses: socio-technical transitions, adaptive capacity, and energy justice. Together, these frameworks offer a comprehensive foundation for analyzing vulnerability in electrified urban environments. The socio-technical transitions framework situates building electrification as a systemic transformation where technological innovation interacts with social structures and institutional arrangements (Zhao et al., 2021; Bouckaert et al., 2021). This perspective highlights electrified buildings as more than a technological evolution, emphasizing their role in reorganizing urban energy systems. It highlights how existing infrastructure, social practices, and institutional arrangements can either enable or constrain the pace and equity of electrification.
The adaptive capacity framework extends concepts of climate resilience to energy systems, characterizing resilience as a synergy of technical, adaptive, and transformative capacities (Hasselqvist et al., 2022; Sharifi and Yamagata, 2015). For example, solar panels provide a technical means to maintain essential services during outages, but their effectiveness depends on complementary adaptive behaviors, such as load shifting. This framework suggests that resilience emerges from the interaction of these capacities rather than being defined by any single factor. The energy justice framework critiques how the vulnerabilities associated with electrification are distributed across society (Jessel et al., 2019; Calver and Simcock, 2021). It examines distributional equity in resilience capabilities, procedural equity in decision-making, and recognition equity in acknowledging diverse needs. Through this lens, electrification policies that overlook household adaptive capacities risk disproportionately burdening already vulnerable populations, reinforcing existing inequities.
Synthesizing these perspectives reveals that resilience is shaped by the interplay between technical systems, social behaviors, and institutional structures. Adaptive capacity is as critical as technological interventions, while the inequitable distribution of resilience capabilities highlights the need for socially inclusive electrification strategies. This synthesis informs our understanding of household vulnerability and resilience, emphasizing the integration of technical and social dimensions.
Empirical insights into electrification and vulnerability
Empirical research has illuminated the multifaceted impacts of building electrification on household vulnerability, offering insights across scales from individual households to citywide systems. At the household level, electrification has been shown to reduce greenhouse gas emissions significantly, with fully electrified homes achieving emission reductions of up to 78% compared to mixed-fuel alternatives (Langevin et al., 2019). However, these environmental gains often come with heightened exposure to outage risks. The 2021 Texas power crisis revealed how extreme weather events could expose vulnerabilities in electrified households, particularly those lacking sufficient backup power solutions (Busby et al., 2021).
Comparative studies highlight the role of regional strategies and resources in shaping resilience outcomes. Norway, for instance, has successfully leveraged abundant hydropower and supportive policies to maintain reliability alongside rapid electrification (Kirkerud et al., 2016), while Japan has balanced electrification with hydrogen integration to enhance energy security (Nagashima, 2018). Meanwhile, China’s large-scale electrification targets, which aim for 65% by 2060, underscore the challenges of achieving resilience in rapidly urbanizing contexts (Energy Foundation China, 2024). The integration of DERs, such as solar PV and battery storage, has emerged as a critical factor in household resilience. Studies demonstrate that these technologies can enhance reliability during outages, though their effectiveness varies with geographic location, climate, and system design (Hirsch et al., 2018; Chatterji and Bazilian, 2020). Seasonal dependency, particularly during winter storms, further complicates their implementation and underscores the importance of careful planning.
Socioeconomic factors significantly influence both the adoption of electrification technologies and the vulnerabilities they create. Low-income households face barriers to adopting resilience-enhancing technologies, such as battery storage, exacerbating disparities in vulnerability to power disruptions (Hernández et al., 2016). Community-level resilience, by contrast, is often bolstered by social networks and resource pooling, which amplify household adaptive capacities during crises (Klinenberg, 2018). These findings illustrate that the relationship between electrification and vulnerability is highly context-dependent. Effective resilience strategies must integrate technological and behavioral measures, with an acute awareness of socioeconomic inequities that shape access to adaptive resources.
Methodological approaches in vulnerability research
Methodological diversity has been a hallmark of research on household vulnerability in electrified urban settings, ranging from traditional data collection to advanced computational techniques. Surveys and in-home monitoring have long provided valuable insights into household energy consumption patterns but often fall short in capturing the dynamic and evolving nature of energy use (Klemenjak et al., 2020). Techniques such as non-intrusive load monitoring offer more granular data but face challenges related to privacy concerns and scalability (Li, 2019).
The rise of ML methods has enabled researchers to identify complex relationships in household energy data, offering a powerful tool for analyzing electrification patterns (Majowicz and Odonkor, 2023). However, the utility of ML models is often constrained by the availability of high-quality training data (Amasyali and El-Gohary, 2018). Synthetic data generation, exemplified by the National Renewable Energy Laboratory’s ResStock framework, has emerged as a promising solution, enabling detailed household-level analysis while preserving privacy (Wilson, 2017). Despite its potential, synthetic data require rigorous validation to ensure it accurately reflects real-world conditions.
Recent methodological advances have sought to bridge household-level vulnerability assessments with broader grid-level analyses. These integrated approaches aim to account for the interplay between individual household resilience and overarching infrastructure systems but face significant barriers in terms of data compatibility and computational requirements (Panteli and Mancarella, 2015). Additionally, composite indices that combine technical, socioeconomic, and climatic data have provided valuable insights into multidimensional vulnerability, though they often demand extensive datasets and advanced analytical tools (Cutter et al., 2010). Despite these advances, key challenges persist, including balancing analytical depth with scalability, addressing privacy concerns, and integrating diverse data sources. Innovations in ML and synthetic data generation hold promise for overcoming these limitations, enabling more comprehensive and scalable assessments of household vulnerability.
Critical gaps and research opportunities
Several critical gaps remain in understanding household vulnerability in electrified urban environments. Key challenges include the dynamic relationship between electrification and vulnerability, the integration of DERs, and the scalability of methodological approaches. These gaps underscore the need for new research that bridges technical, behavioral, and equity considerations, providing insights at household and urban scales. Existing studies have made substantial contributions to understanding these issues but often focus on narrower aspects, such as grid-level resilience or socioeconomic impacts, without fully integrating high-resolution household-level analyses. For instance, research on energy poverty highlights the socioeconomic dimensions of electrification but lacks the quantitative rigor needed to assess resilience outcomes systematically (Bardazzi and Pazienza, 2023). Conversely, ML applications for grid-level outage prediction provide robust technical insights but do not account for household-level vulnerabilities or adaptation strategies (Yang et al., 2020; Fatima et al., 2024).
To clarify how this paper differentiates itself, Table 1 synthesizes key elements of the current literature and positions our approach in relation to existing work. By leveraging high-resolution synthetic data and ML, our study provides a new perspective on household-level vulnerability, combining privacy-preserving techniques with actionable insights for vulnerability detection.
Comparison of related work in energy resilience and power outage analysis.
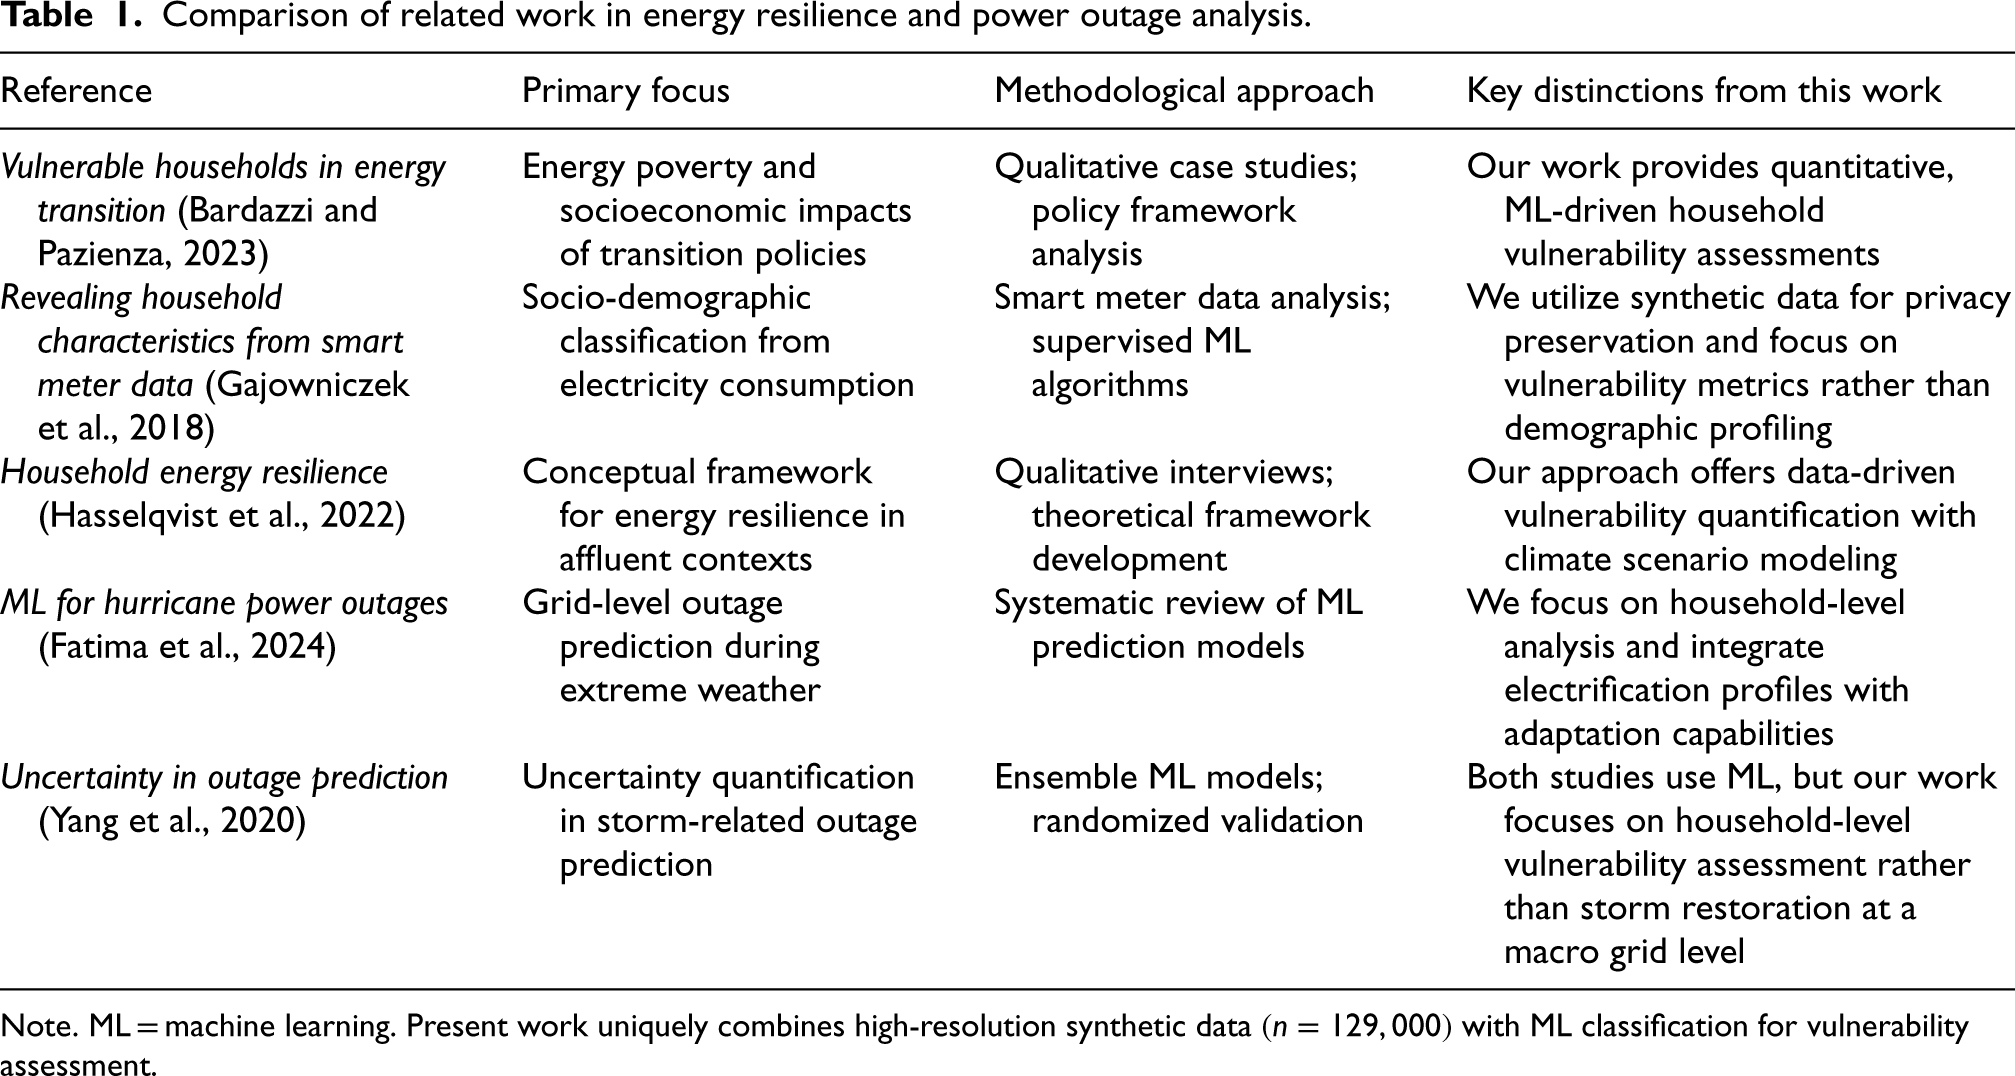
Comparison of related work in energy resilience and power outage analysis.
Note. ML = machine learning. Present work uniquely combines high-resolution synthetic data
By directly addressing critical gaps, including the integration of technical and adaptive resilience measures and the need for privacy-preserving data methodologies, this study advances the field. The combination of synthetic data and ML facilitates household-level vulnerability assessments that inform both academic and policy discourse, bridging a persistent divide in the current literature.
The increasing electrification of urban households offers significant opportunities for decarbonization but also raises critical challenges for resilience planning. These dual pressures drive the need for a systematic framework to assess household vulnerability to power disruptions. Our methodology integrates empirical insights and analytical techniques to develop a comprehensive approach for evaluating these vulnerabilities.
Research framework and objectives
The proposed framework (Figure 1) is designed to address three interconnected challenges: (a) identifying household electrification status from aggregate consumption data, (b) quantifying household-specific vulnerabilities to power disruptions, and (c) incorporating adaptation measures, such as DERs, into resilience assessments. By progressing through these stages, the framework supports the development of targeted resilience strategies while safeguarding privacy through non-intrusive load analysis.
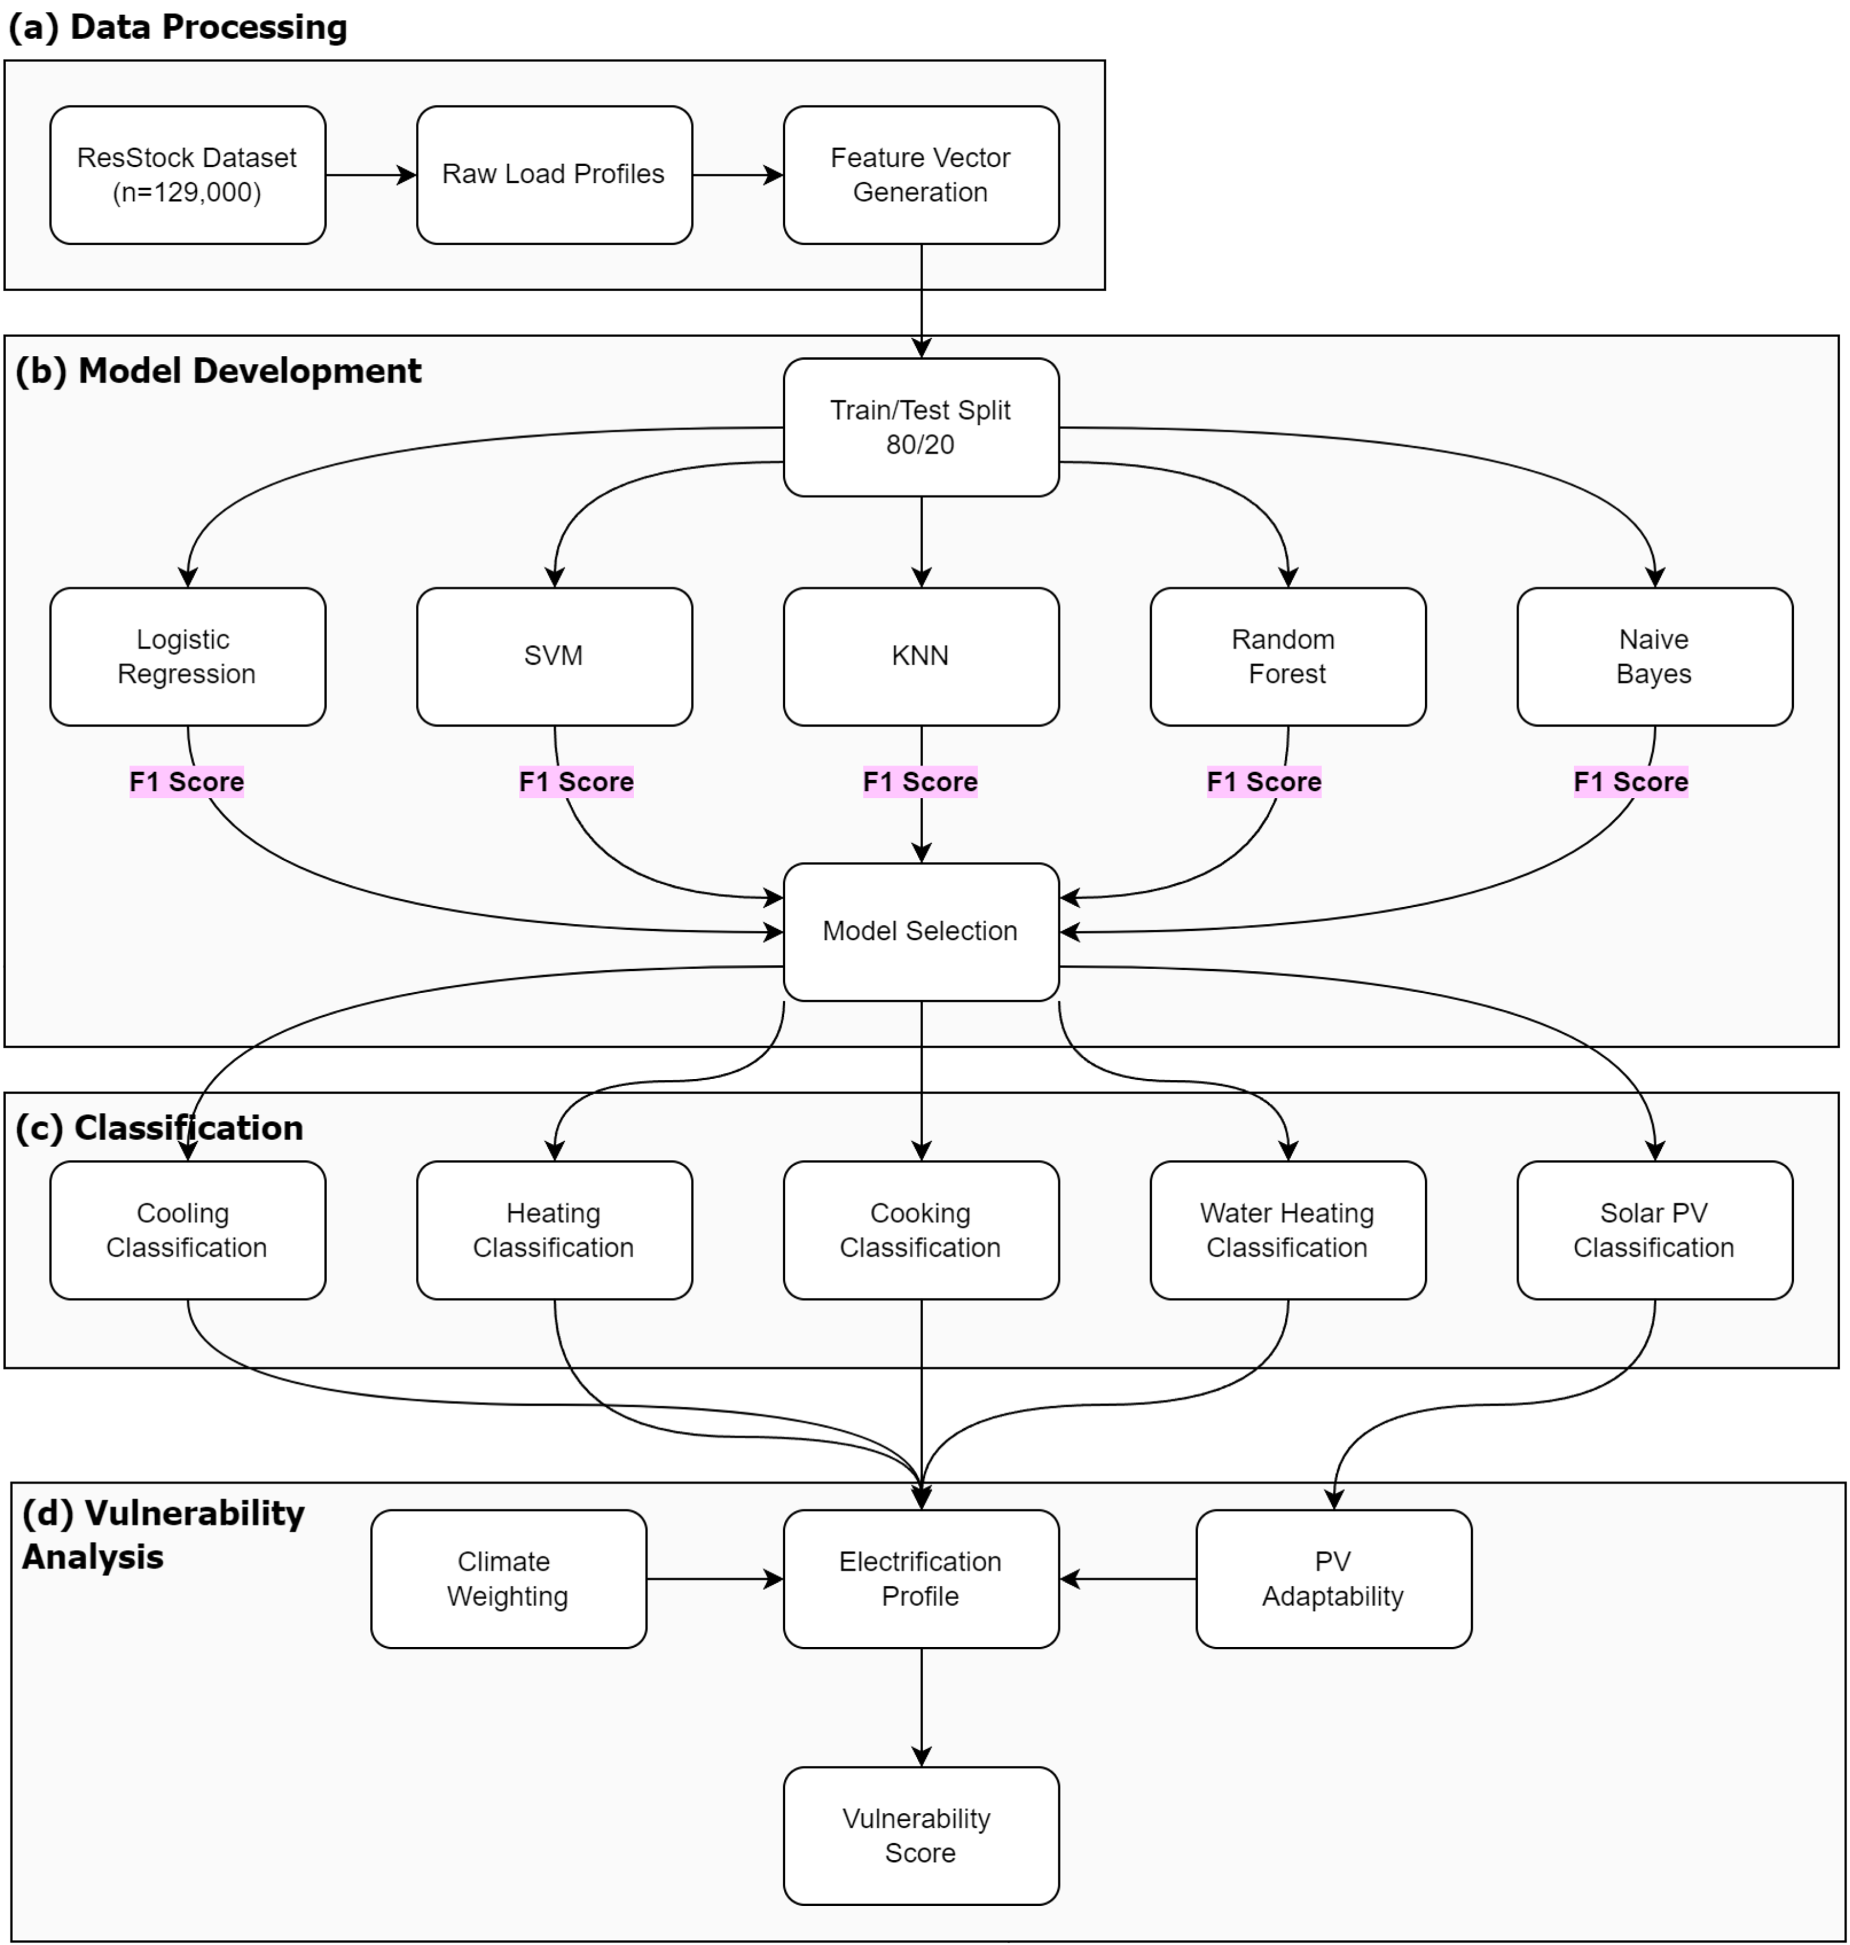
Framework overview: The pipeline progresses from data acquisition through vulnerability assessment, with each stage informed by empirical analysis of consumption patterns.
A central focus of this study is the electrification status of critical household appliances specifically space heating, cooling, water heating, cooking, and solar PV systems. These appliances were selected for their essential role in sustaining household services, particularly during extreme weather events. Heating and cooling systems are vital for maintaining occupant health and safety under temperature extremes, while water heating and cooking are fundamental to daily living and hygiene. Solar PV systems, as a DER, provide critical backup power during outages, enhancing resilience and reducing dependence on the grid.
These appliances also represent a significant portion of household energy consumption, making them key determinants of vulnerability profiles. Disruptions to any of these services can have severe consequences, especially in vulnerable communities or under extreme conditions. By centering our methodology on these systems, we target the elements most critical to household resilience, ensuring actionable insights for effective resilience planning and policy development.
Understanding household energy consumption is foundational to our methodology. We leverage the ResStock dataset (National Renewable Energy Laboratory, 2023), developed by National Renewable Energy Laboratory, which provided high-resolution, 15-minute interval synthetic energy data for over 129,000 single-family households across eight diverse U.S. states (CA, TX, FL, NY, GA, NJ, WA, and MA). Although synthetic data have inherent limitations, its systematic nature enables scalable exploration of energy consumption patterns that inform the development of our classification framework.
Our exploratory analysis of the dataset reveals two primary categories of electrical loads, each with distinct temporal signatures (Figure 2). Weather-dependent loads, such as heating and cooling systems, exhibit pronounced seasonal variations. Electric heating systems, for instance, show winter consumption peaks up to three times higher than non-electric alternatives, while cooling loads dominate during summer months. These seasonal trends provide strong, easily identifiable indicators of electrification status, offering clear distinctions between electric and non-electric systems during periods of peak demand.
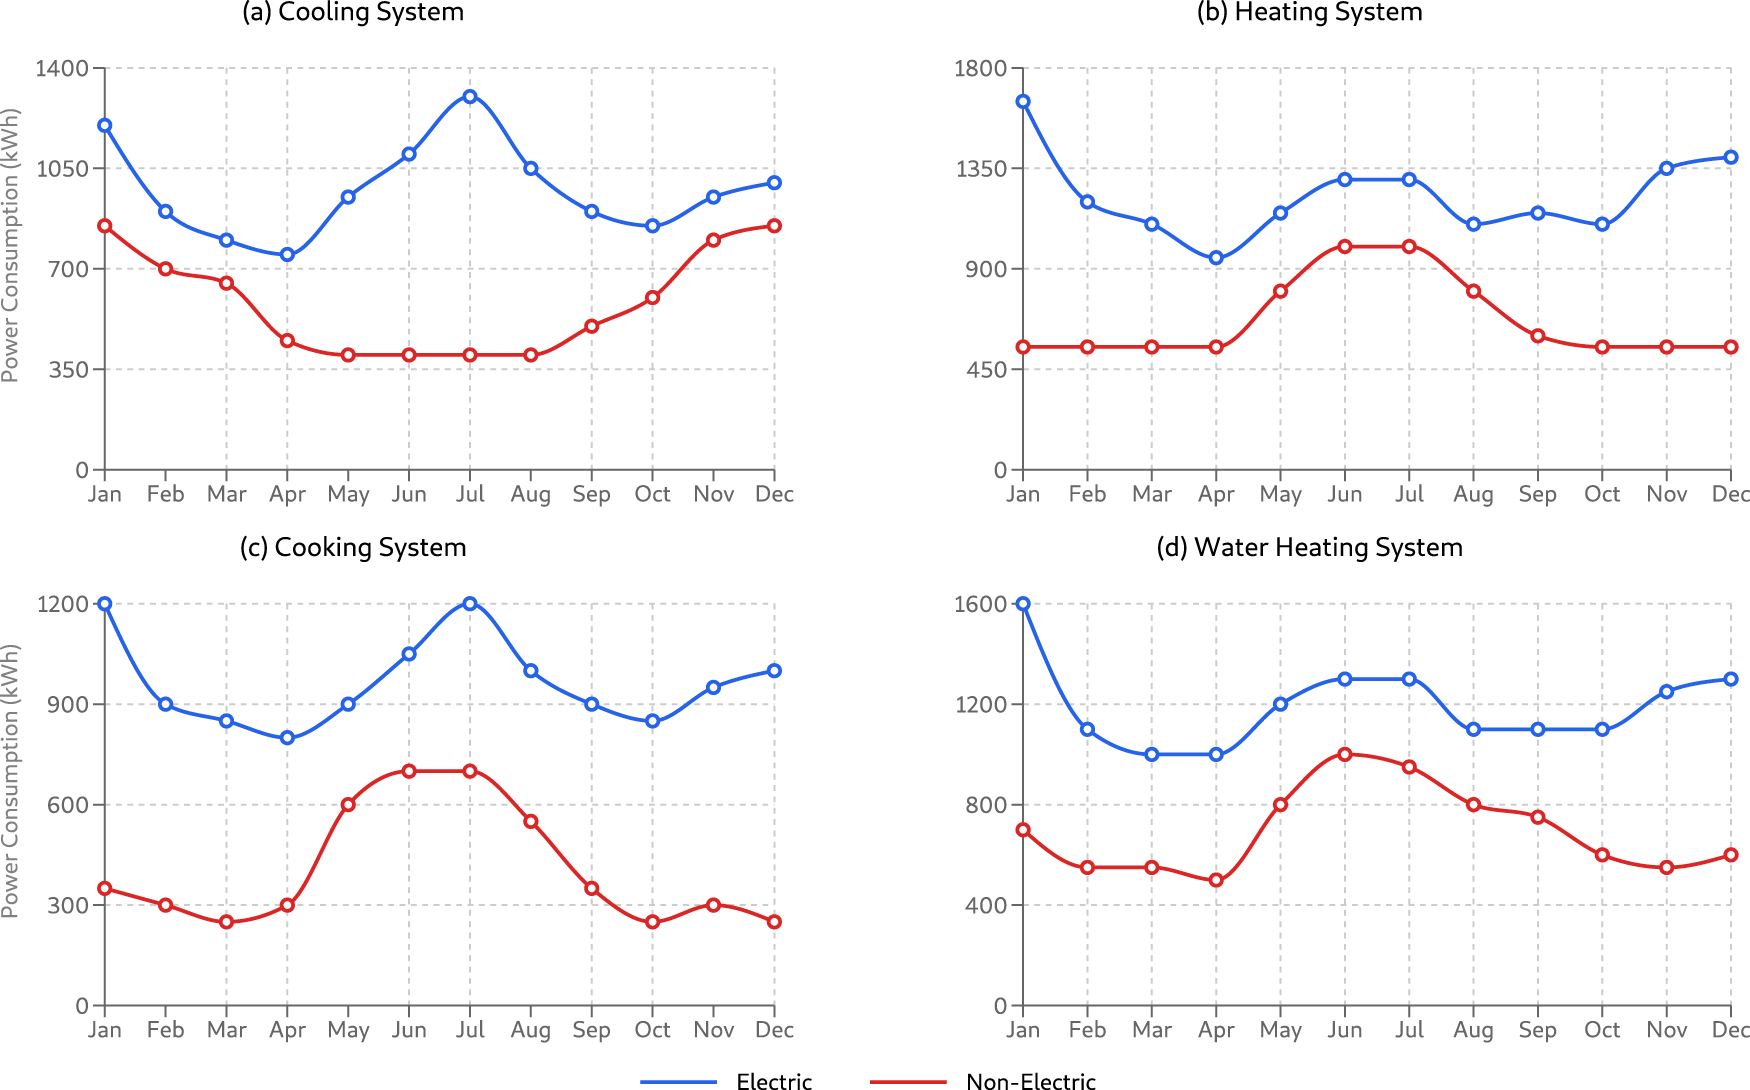
Temporal signatures of electric versus non-electric systems across major household appliances. Weather-dependent loads (heating, cooling) show pronounced seasonal variations, while behavioral loads (water heating, cooking) exhibit more subtle but consistent differences in consumption patterns.
Behavioral loads, including cooking and water heating, demonstrate subtler yet consistent patterns. Electric water heaters consume approximately 40% more energy during winter compared to non-electric systems, reflecting heightened demand for hot water in colder months. Cooking loads reveal distinct usage profiles based on electrification status, with observable differences in magnitude and variability. While these patterns are less pronounced than those of weather-dependent loads, their consistency provides critical discriminative features that can be systematically exploited for classification. These insights underpin the development of our ML framework, which is designed to recognize and classify electrification traits at scale. The observed temporal and seasonal load characteristics are distilled into engineered features that guide the identification of electrification status across households.
The observed temporal characteristics of household energy consumption—such as seasonal peaks for heating and cooling—are derived from the high-resolution, 15-minute interval data in the ResStock dataset. This granularity provides crucial insights, but analyzing such a large dataset at this resolution poses significant computational challenges. With over 129,000 households included in the study, each generating
To address this challenge, we developed an aggregation strategy to reduce data volume while preserving the temporal characteristics critical for classification. By aggregating consumption data into hourly intervals, we achieved a 75% reduction in data volume, enabling more tractable analysis. This aggregation level retains the seasonal variations of weather-dependent loads and the subtler patterns of behavioral loads, ensuring the integrity of features needed for electrification classification.
We validated the aggregation approach by comparing original and aggregated datasets using multiple quantitative metrics. The correlation coefficient of 0.995 between the two datasets (Figure 3) demonstrates a high degree of information preservation. Additional error metrics, including a mean absolute percentage error of 2.11%, a root mean square error of 0.008 kWh, and a mean absolute error of 0.006 kWh, confirm minimal information loss. These results highlight the effectiveness of the aggregation in maintaining the discriminative temporal features necessary for subsequent ML classification.

Comparison of original 15-minute and aggregated hourly consumption data over a representative 24-hour period. The high correlation and low error metrics demonstrate preservation of essential temporal patterns through aggregation.
The feature engineering strategy builds on these preserved load characteristics, incorporating both magnitude-based and pattern-based metrics to capture the operational dynamics of household energy systems. Seasonal variation ratios, peak demand characteristics, and measures of consumption stability (Table 2) are among the features designed to aid in classifying electrification status. For instance, seasonal ratios reflect climatic influences on energy use, while variability measures distinguish year-round usage from periodic patterns. Together, these features provide a robust foundation for scalable classification and resilience assessment.
Feature engineering framework: Derived metrics capture key temporal and magnitude characteristics identified in consumption pattern analysis.
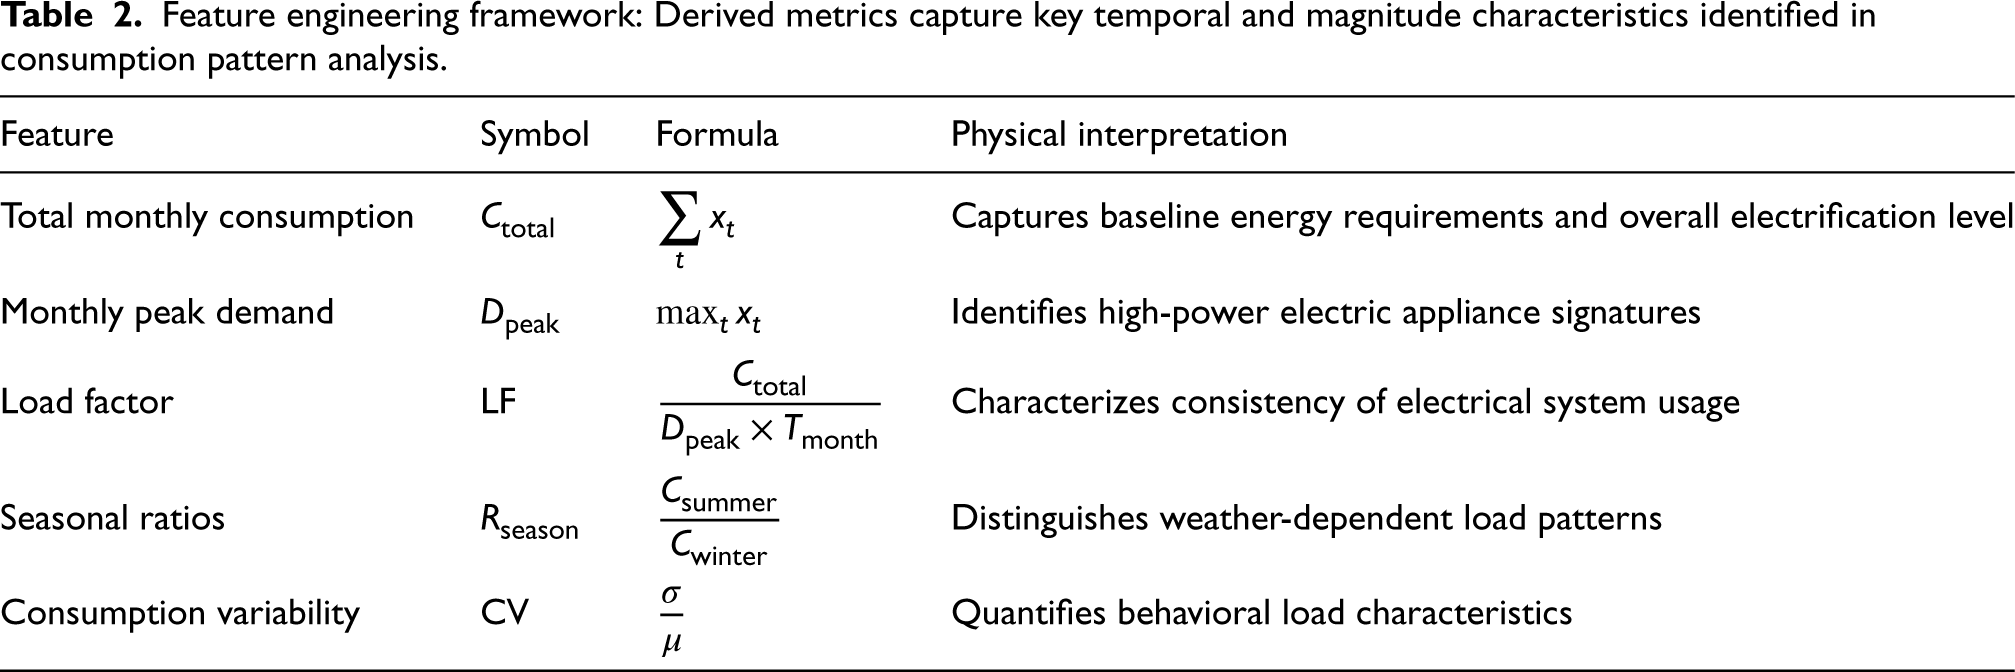
Here,
The temporal and seasonal load characteristics preserved through data aggregation form the inputs of our classification framework. These patterns provide key features that enable ML algorithms to differentiate electrification status across household appliances. To fully leverage these insights, we employ a suite of classical ML models, chosen for their complementary strengths and suitability for the problem domain. By collectively addressing distinct aspects of consumption patterns, this array of algorithms ensures accurate and scalable classification of appliance electrification.
We intentionally focus on classical ML models, such as logistic regression and random forests, rather than advanced approaches such as deep learning. This decision reflects the findings of our exploratory analysis, which indicated that the classification task could be effectively addressed without the added complexity of deep learning models. This choice also promotes interpretability and computational efficiency, aligning with the practical needs of large-scale resilience planning.
Logistic regression, one of the models developed, allows for effectively capturing clear threshold effects associated with household loads. The model’s linear decision boundary is well-suited for identifying the seasonal variations of electric heating and cooling systems, for example. To capture the subtler, non-linear patterns associated with loads, such as water heating and cooking, we include support vector machines (SVMs) with radial basis function kernels. SVMs transform consumption data into higher-dimensional spaces, allowing them to distinguish nuanced electrification patterns that would otherwise overlap in the original feature space.
The observed co-adoption trends between appliances, such as electric space and water heating, observed in Figure 2 motivate the inclusion of the k-nearest neighbors (k-NNs) classifier (
Finally, a Gaussian Naive Bayes classifier is included to provide utility in scenarios with limited training data. While its assumption of feature independence simplifies relationships among features, it provides valuable baseline insights for sparsely represented patterns, such as newer technologies like rooftop solar PV installations. By integrating these models into a unified framework, we leverage their complementary capabilities to achieve a comprehensive classification of appliance electrification. This multi-model approach balances accuracy, interpretability, and computational efficiency, ensuring that the framework is both practical and scalable for large-scale resilience assessments.
Model training and validation
The classification framework is designed to address several challenges uncovered in our preliminary analysis, ensuring reliable performance across all appliance categories. One key challenge is the imbalance in class distributions, particularly for solar PV installations, which are present in fewer than 5% of households. To address this, we employ an 80–20 train–test split with stratification, maintaining consistent class distributions in both datasets. This approach ensures that even minority classes are adequately represented during training and evaluation, enabling meaningful performance comparisons across appliances.
Model validation is conducted using fivefold stratified cross-validation, a technique that systematically assesses model performance while preserving class proportions across folds. This process not only enhances the reliability of our results but also mitigates overfitting by exposing models to diverse subsets of the data. To evaluate performance, we prioritize the F1 score as our primary metric. This decision reflects the critical need for balanced precision and recall in vulnerability assessment, where the costs of false negatives—such as failing to identify an electrified appliance—can significantly affect the accuracy of resilience planning. The importance of this metric is especially pronounced for behavioral loads, where classification errors could obscure critical consumption patterns.
While accurate classification of household electrification is a valuable outcome on its own, it is also a foundational step toward our broader goal: assessing household vulnerability to power disruptions. By ensuring reliable identification of appliance electrification, this framework provides the critical input needed for the vulnerability assessment detailed in the next section.
Vulnerability assessment framework
By accurately classifying the electrification status of key appliances, the ML models provide a valuable input for assessing household vulnerability to power disruptions. Integrating this information with climate-driven risk insights enables the creation of a quantitative vulnerability assessment framework. This approach directly links technical analysis to strategic decision-making by translating appliance-level electrification profiles into metrics quantifying household outage exposure.
Mathematical framework development
The basis of our vulnerability assessment lies in the electrification status vector derived from our classification models:
Our empirical observations of consumption patterns reveal that vulnerability varies significantly with climate conditions and adaptation measures. For instance, households with electric heating systems show threefold higher winter consumption, indicating heightened vulnerability during cold-weather events. Similarly, the presence of solar PV installations modifies vulnerability through generation potential during daylight hours. These observations motivate the development of a context-aware vulnerability function:

The event-specific weights,
Empirically derived system importance weights by climate scenario.
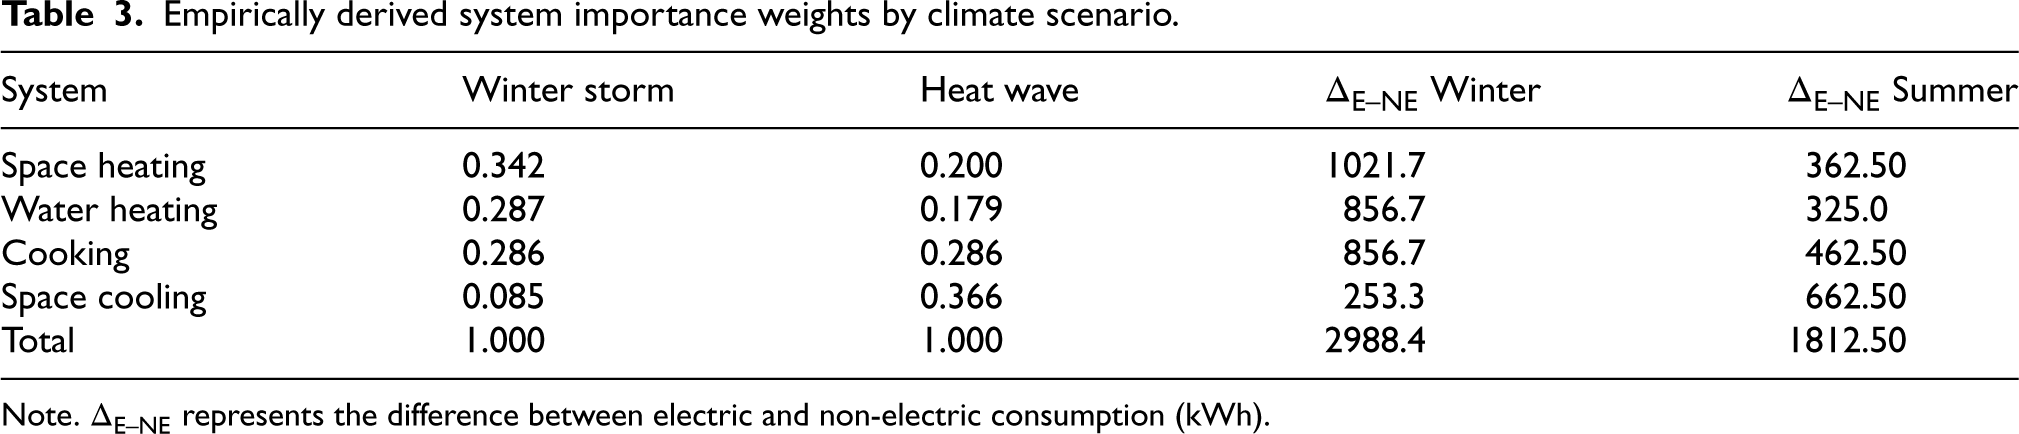
Note.
To ensure comparability across systems, the weights were normalized. Each system’s differential was divided by the total differential across all systems, yielding importance factors that sum to unity for each scenario. This normalization process provides a consistent basis for evaluating the relative importance of each system under different climatic conditions.
The adaptability factor
The multiplicative interaction between components in equation (1) creates an assessment that aligns with observed household behavior patterns. Consider a household with electric heating (
The implementation of our vulnerability assessment framework proceeds through several carefully designed stages:
First, we calibrate the event-specific weights using the magnitude of seasonal variations observed in our consumption data. The pronounced differences between electric and non-electric system consumption provide a quantitative basis for these weights. For instance, the observed threefold increase in winter consumption for electric heating systems directly informs the relative weighting of heating vulnerability during cold-weather events.
Second, we determine adaptability factors through analysis of consumption patterns in homes with DERs. The classification results for rooftop solar PV systems, combined with typical generation profiles, enable estimation of potential vulnerability reduction during different climate events. This approach acknowledges both the opportunities and limitations of solar generation, as evidenced by the temporal patterns in our data.
Finally, we aggregate these components to produce household-specific vulnerability scores that vary dynamically with climate conditions. This scoring system enables identification of particularly vulnerable households and informs targeted intervention strategies. The framework’s structure allows for regular updates as classification results improve and new adaptation measures emerge.
Methodological limitations
While our framework provides a comprehensive approach to assessing household vulnerability, several limitations warrant acknowledgment. These limitations, rather than undermining our approach, provide clear direction for future methodological enhancements.
First, the use of synthetic data from ResStock, while enabling privacy-preserving analysis and methodology development, may not fully capture real-world household behavior, particularly for behavioral loads. Second, our focus on single-family residential buildings, while significant, may not directly translate to other building types such as multi-family dwellings and commercial buildings, which could exhibit different consumption patterns and vulnerability characteristics. Third, relying on aggregate energy data, while enabling scalable analysis, might overlook crucial factors such as socioeconomic characteristics, building attributes, and occupancy patterns that could enhance vulnerability insights and prediction accuracy, especially for behavioral loads.
Regarding our vulnerability assessment framework, using consumption differentials as a proxy for importance might not always accurately reflect system criticality. Additionally, this method doesn’t account for non-linear relationships between consumption and vulnerability or potential cascade effects between systems. Nonetheless, this approach offers a fully empirical basis for vulnerability assessment, eliminating the need for subjective expert judgments. Moreover, it is readily adaptable to different regions and climate scenarios, requiring only local consumption data for recalibration. Further discussion of these limitations and their implications for future research appears in Section 5.
Results
Overview
This study evaluated six ML model types (8 models in total) to classify household electrification status across five key appliance categories. Model performance was assessed using stratified cross-validation, with Naive Bayes serving as a baseline for comparison.
The results highlight notable variations in model effectiveness, particularly in tasks presenting classification challenges. For appliances with high classification accuracy (>95%, such as heating and cooling systems), results are summarized concisely without extensive tabular analysis. However, for tasks with moderate or inconsistent accuracy, detailed analyses are presented to explore performance limitations and identify areas for improvement.
Classification of electric cooling systems
The study began by classifying households based on the presence of electric cooling systems. Due to a significant class imbalance, with fewer households equipped with such systems, an undersampling technique was employed to create a balanced dataset of 85,236 samples.
The analysis yielded several key insights. A baseline accuracy of 82.03% was achieved using the Naive Bayes model, highlighting the limitations of linear models for this specific classification task. In contrast, the support vector classifier emerged as the most accurate model, achieving an accuracy of 98.5%. Similarly, ensemble models such as random forest and bagged decision trees demonstrated exceptional performance, each achieving accuracy levels above 98%. These findings strongly suggest that non-linear models are particularly well-suited for classifying cooling systems.
Classification of electric heating systems
The classification of households based on the presence of electric heating systems posed a significant challenge due to a pronounced class imbalance, as fewer households relied on electric heating. To address this, random undersampling was employed, resulting in a balanced dataset of 97,440 samples.
The analysis revealed several key insights. The baseline Naive Bayes model achieved an accuracy of 77.51%, indicating its limitations in handling this specific classification task. In contrast, non-linear models demonstrated superior performance. Random forest emerged as the most robust model with an accuracy of 96%, closely followed by k-NNs at 95.8%. These findings highlight the effectiveness of tree-based and distance-based methods in capturing the distinct patterns of seasonal heating demand.
Classifying households with electric cooking systems
The classification based on the presence of electric cooking systems revealed subtle but discernible differences between electrified and non-electrified households. A dataset of 27,512 samples formed the basis of this analysis.
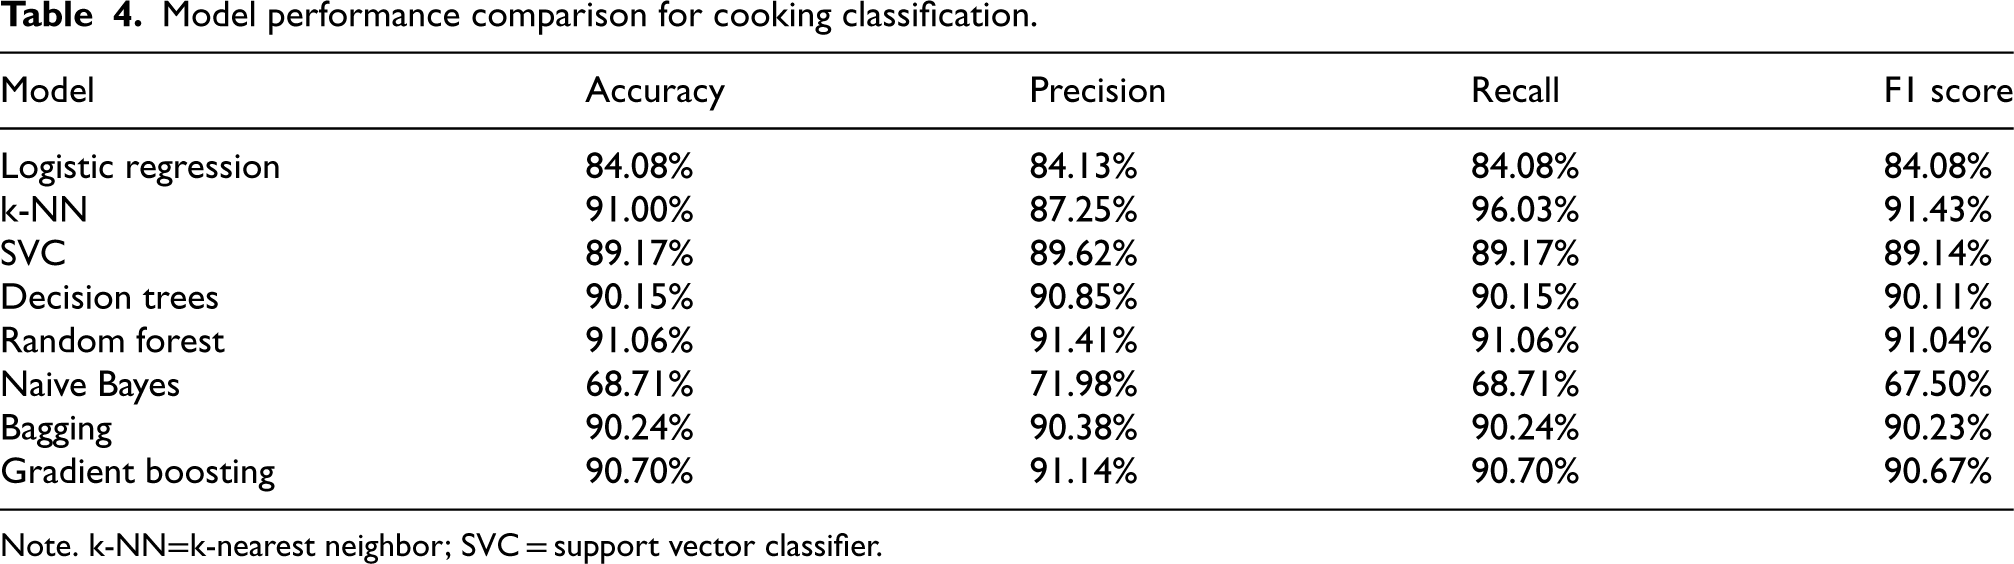
The findings demonstrated that advanced models excelled in this task (refer to Table 4). Gradient boosting and k-NNs both achieved high accuracy rates exceeding 91%, while Naive Bayes struggled to capture the nuanced patterns, attaining only 69% accuracy. Random forest delivered consistent performance with an accuracy of 91.06% and well-balanced precision-recall metrics. These results highlight the ability of non-linear and ensemble models to effectively differentiate between categories, even when the energy patterns associated with electric cooking are subtle.
Model performance comparison for cooking classification.
Model performance comparison for cooking classification.
Note. k-NN=k-nearest neighbor; SVC = support vector classifier.
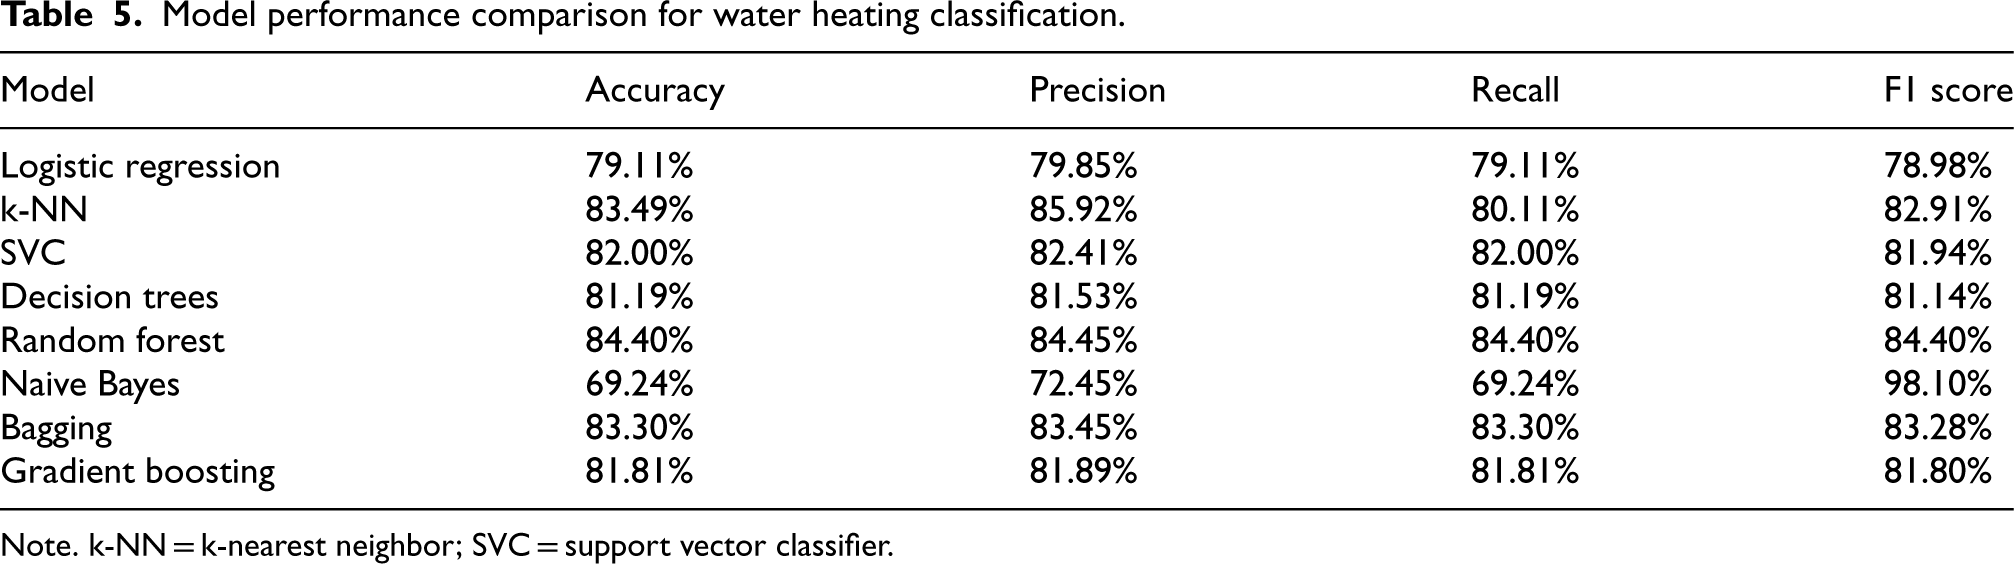
The classification of electric water heating systems posed moderate challenges, primarily due to the variability in water heating loads. To ensure balanced representation, a dataset of 102,008 samples was created for analysis.
The results indicated that random forest and k-NNs delivered comparable accuracies, both achieving 84% (Table 5). However, both models faced challenges with false negatives, highlighting areas for potential improvement. The bagging model also performed robustly, achieving an accuracy of 83%, demonstrating the effectiveness of ensemble techniques in this context.
Model performance comparison for water heating classification.
Model performance comparison for water heating classification.
Note. k-NN = k-nearest neighbor; SVC = support vector classifier.
While the models performed reasonably well, the moderate accuracy levels point to the need for more refined feature engineering or the inclusion of additional contextual data to better capture the differences between households.
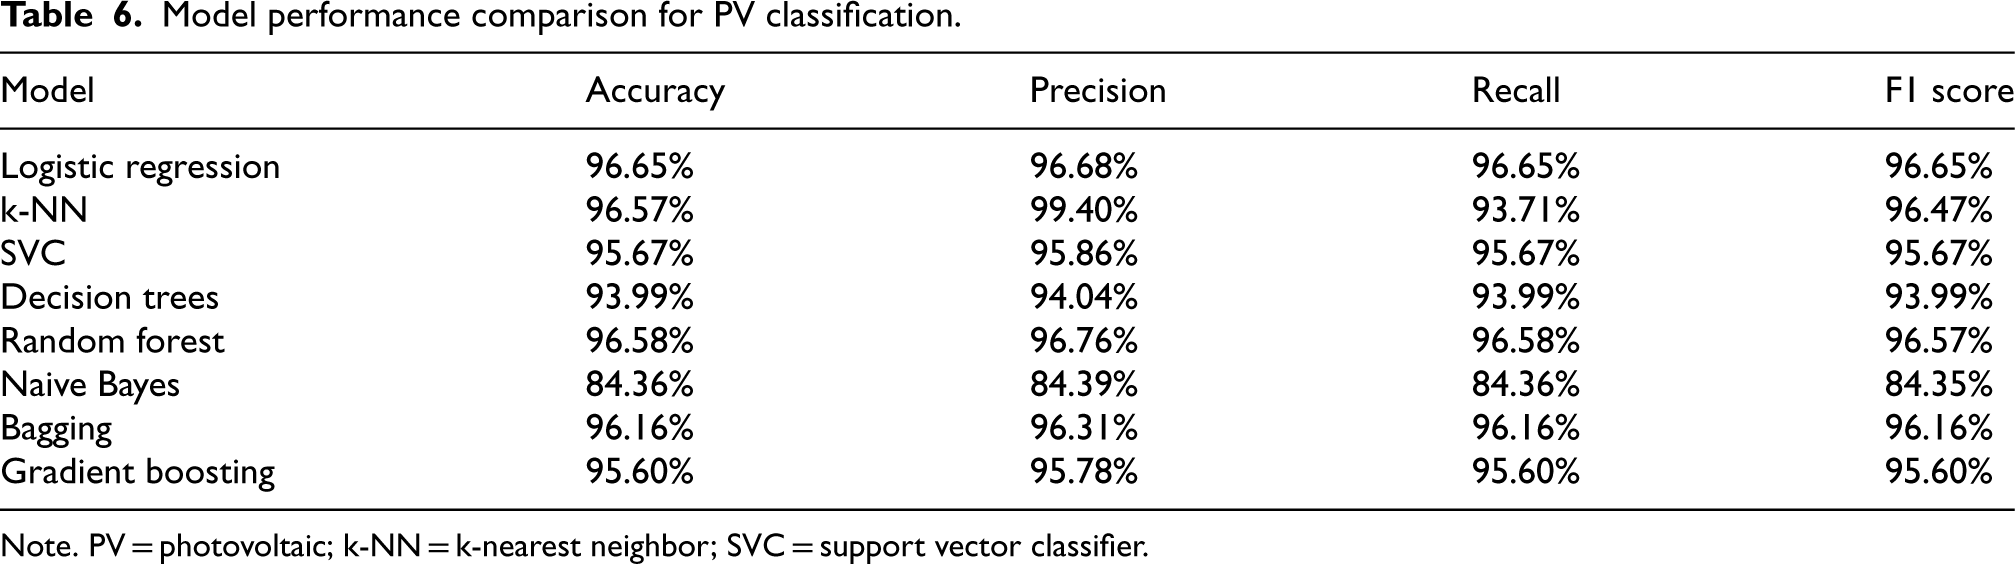
The classification of households based on the presence of PV systems was supported by a dataset of 7,160 samples, comprising both PV and non-PV households. Despite relatively low adoption rates, the task was aided by the distinct energy consumption patterns associated with these households.
The analysis revealed that both the SVC and random forest achieved near-perfect accuracies, with scores of 96% and 96.5%, respectively. By comparison, Naive Bayes, serving as a baseline, achieved 84% accuracy. These results demonstrate that the clear distinctions in energy consumption between households with and without PV systems enabled high classification accuracy. Table 6 provides a comprehensive comparison of all model performances for the PV classification task.
Model performance comparison for PV classification.
Model performance comparison for PV classification.
Note. PV = photovoltaic; k-NN = k-nearest neighbor; SVC = support vector classifier.
To illustrate the practical application of the proposed vulnerability framework (Section 3.5), we conducted a simple case study comparing the vulnerability of two representative households under extreme weather conditions: a winter storm and a heat wave. The households were selected to reflect contrasting energy system configurations:
These configurations allowed for a comparison of vulnerability under different climatic stressors. Vulnerability scores were calculated using the composite vulnerability function (equation (1)), which incorporates electrification status, system criticality, and adaptability factors such as solar generation.
During the winter storm scenario, Household A exhibited a significantly higher vulnerability score of 95.5%, reflecting its total reliance on electric systems for essential services such as heating (Figure 4). Limited solar PV generation during winter further exacerbated its risk, with PV output contributing <5% of its daily energy needs. In contrast, Household B, with its mixed-energy setup, achieved a substantially lower vulnerability score of 37.2%. Its reliance on gas for heating and cooking provided crucial resilience, highlighting the advantages of energy diversity during cold-weather outages.
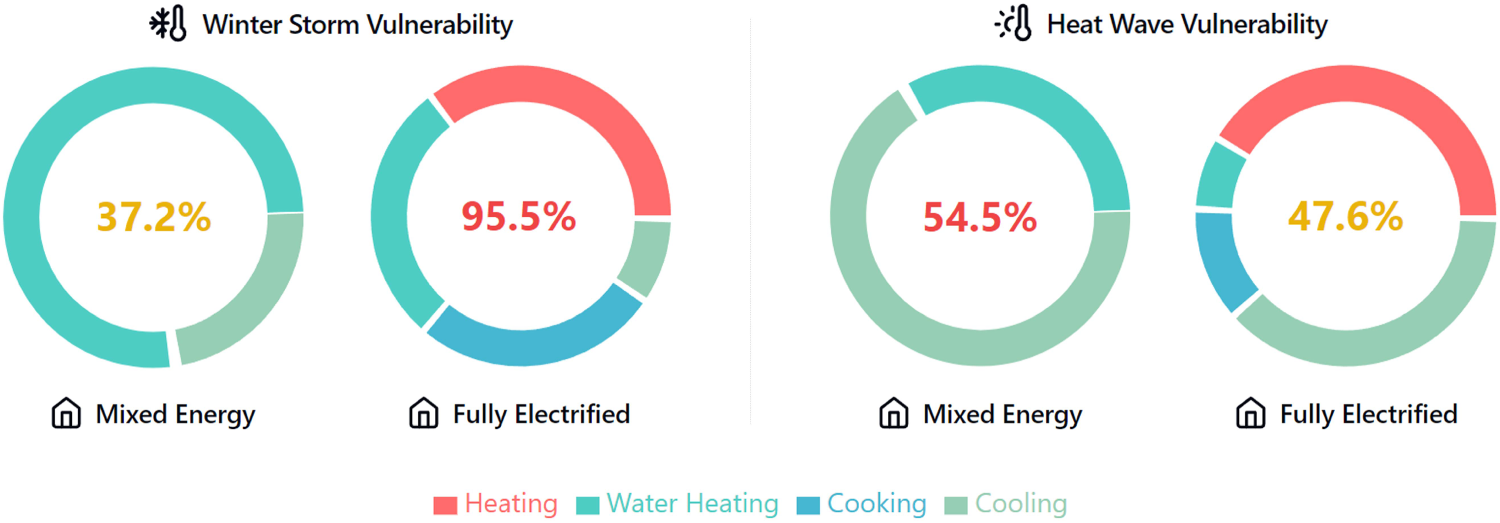
Differential vulnerability of residential homes to extreme weather events. Mixed-energy systems show markedly lower vulnerability during winter storms (37.2% vs. 95.5%) but slightly higher vulnerability during heat waves (54.5% vs. 47.6%).
Under heat wave conditions, the trend reversed. Household A benefited from its PV system, which mitigated grid dependency by offsetting cooling loads during daylight hours. As a result, its vulnerability score decreased to 47.6%, a near 10% improvement over Household B. Meanwhile, Household B’s reliance on grid electricity for cooling led to a higher vulnerability score of 54.5%. This demonstrates the adaptability advantages of DERs in offsetting summer energy demands.
The vulnerability score for Household A was still influenced by heating loads (Figure 4), despite heating being unnecessary during a heat wave. This artifact arises from the methodology’s reliance on aggregate load profiles, which do not fully differentiate seasonal energy requirements. A straightforward solution would be to assign a zero weight to heating during summer and cooling during winter. However, this adjustment was not implemented here to avoid introducing potential biases in the current analysis. Future work will focus on refining the framework to account for season-specific conditions, enhancing its accuracy and adaptability.
Discussion
Synthesis of technical findings
The integration of ML classification with vulnerability assessment provides comprehensive insights into household resilience in increasingly electrified urban environments. Our analysis reveals both technical capabilities and practical implications for understanding power outage risks in smart cities.
Key findings and context
The classification framework demonstrated robust performance across different appliance categories, with random forest and k-NN models consistently achieving superior results. As shown in Table 7, these models exhibited particular strength in identifying weather-dependent loads, achieving classification accuracies exceeding 95% for heating and cooling systems. The resulting vulnerability assessment framework provides actionable insights, revealing significant contrasts in resilience between fully electrified and mixed-energy households during extreme weather events.
Top-three performance distribution among classification approaches.
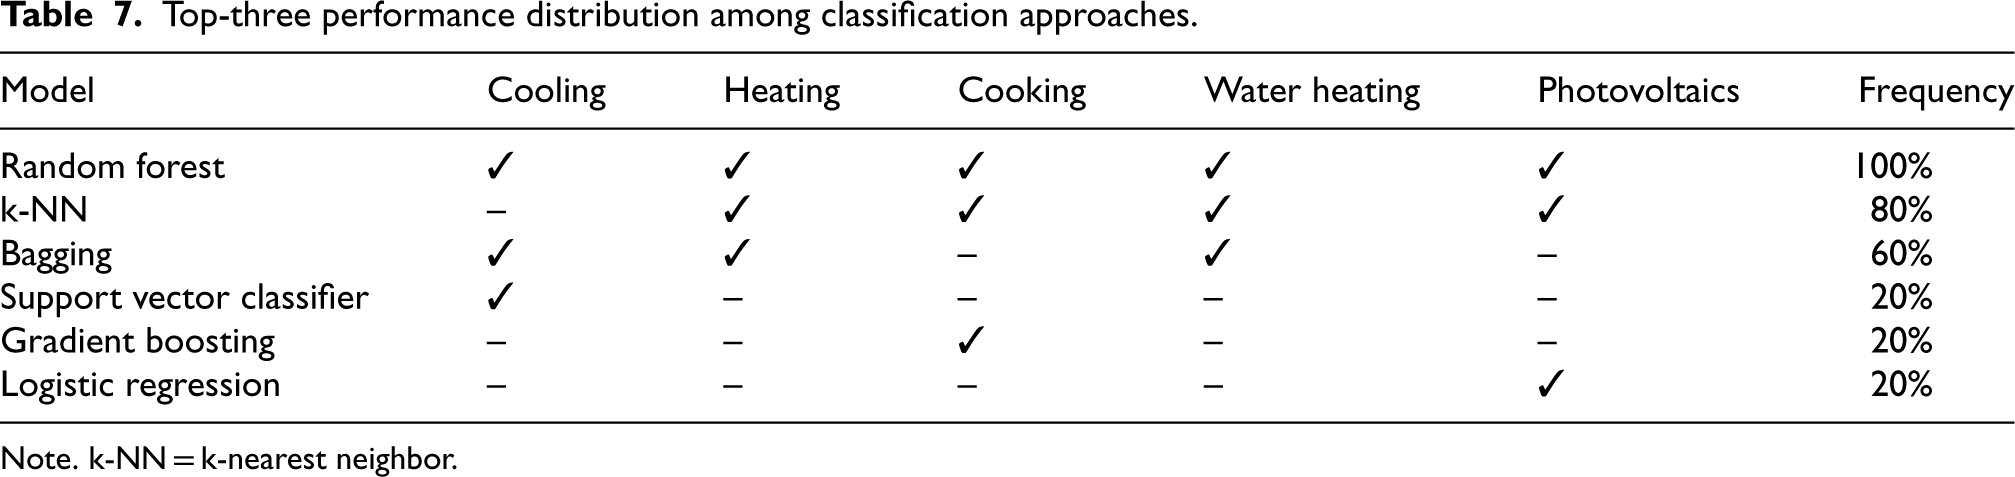
Top-three performance distribution among classification approaches.
Note. k-NN = k-nearest neighbor.
The results align closely with the objectives of the study, emphasizing the relationships between electrification, household resilience, and climate-driven risks. Fully electrified households exhibited markedly higher vulnerability scores during winter storms due to their reliance on electric systems for heating, while mixed-energy households benefited from energy source diversification. This supports prior research highlighting the resilience benefits of maintaining energy diversity in the transition to electrified systems.
However, the findings also introduce interesting insights. For example, while rooftop solar PV installations reduced summer vulnerability for fully electrified households, their limited efficacy during winter storms highlights the seasonal dependency of DERs. This highlights the need for further integration of seasonal storage solutions or complementary energy sources to enhance resilience year-round.
Interestingly, our analysis of behavioral loads such as water heating and cooking revealed subtler consumption patterns, with classification accuracies for these systems slightly lower than for weather-dependent loads. This highlights the technical challenge of disaggregating energy use for appliances with less pronounced temporal signatures, suggesting a potential avenue for methodological refinement.
Theoretical and practical implications
Theoretically, this work advances the conceptual framework of urban energy resilience by bridging the gap between grid-level assessments and household-level realities. By integrating high-resolution synthetic data with ML, the study introduces a scalable and non-intrusive method for assessing electrification and vulnerability patterns. This approach informs resilience planning by offering granular insights that are both adaptable to different geographic contexts and sensitive to climate-specific risks.
Practically, our findings have significant implications for urban energy policy and smart city development in grid modernization, building electrification, and resilience planning. The high accuracy of our classification framework (exceeding 80% for all five key appliances) equips utilities and urban planners to track electrification trends with precision. For example, the ability to classify weather-dependent loads such as heating (with 96% accuracy) and cooling (with 98.5% accuracy) supports the detailed mapping of electrification patterns without intrusive surveys. This capability extends to tracking solar PV installations (with 96.5% accuracy), enabling better planning for DERs.
However, our vulnerability assessment underscores critical trade-offs: while electrification reduces emissions, it also heightens vulnerability to extreme weather. Temporal variations in vulnerability highlight the need for seasonally aware resilience strategies. Solar-equipped homes, beneficial during summer heat waves, provide limited protection during winter storms, pointing to the strategic deployment of complementary resources such as backup power systems.
By integrating electrification and vulnerability assessments, our framework offers a scalable, non-intrusive solution for identifying at-risk areas. This is particularly valuable for prioritizing resilience interventions and enhancing emergency response planning. For instance, during winter storms, neighborhoods with high concentrations of electrified homes may require immediate support. Such insights align with the objectives of smart cities, where resource allocation must adapt to diverse energy landscapes and seasonal fluctuations.
Limitations
Despite its contributions, this study is not without limitations. The reliance on synthetic data from the ResStock dataset, while enabling privacy-preserving analysis, may not fully capture the nuances of real-world household energy behavior. This is particularly evident in the classification of behavioral loads, where moderate accuracy suggests the need for enhanced feature engineering and validation against real-world data. The geographic scope, while broad, may not account for regional variations in building characteristics and energy use patterns. Future studies could expand the analysis to additional regions, incorporating local climate factors and socioeconomic variables to refine the framework’s applicability.
A notable limitation of the vulnerability framework lies in the method used to derive adaptive weights for determining the relative importance of appliances under varying climate conditions. At present, these weights are based on the relative differences in energy consumption between electrified and non-electrified households, assuming a linear relationship. However, this assumption may oversimplify the complex, non-linear interactions between appliance usage, household behavior, and climate impacts. Future research is needed to develop more sophisticated methods for extracting these weights, incorporating non-linear dynamics and broader contextual factors. Additionally, systematic verification and validation across diverse scenarios, including varying geographic regions and climate conditions, will be essential to ensure the reliability and generalizability of these weights.
Furthermore, the vulnerability assessment relies on aggregate energy data, which may overlook critical contextual factors such as building insulation, occupancy patterns, or grid reliability. Incorporating these variables in future iterations could enhance the framework’s predictive accuracy and generalizability.
Future directions and recommendations
Building on this study, future research should address several key areas. First, validating the framework against real-world outage data would strengthen its applicability and ensure robust generalization. Second, extending the methodology to include multi-family and mixed-use buildings would enhance its applicability to diverse urban contexts. Our preliminary exploratory analysis highlights challenges in distinguishing building types and energy consumption patterns using aggregate data. For instance, high summer energy consumption could stem from electric cooling in single-family homes or inherently higher usage in multi-family buildings. Overcoming this issue requires rethinking our feature engineering approach and may demand the use of more advanced ML techniques such as neural networks. Third, integrating socioeconomic and demographic data could provide a more comprehensive understanding of household resilience, highlighting disparities and informing equitable policy interventions.
Methodologically, incorporating advanced ML techniques or hybrid models that combine physics-based and data-driven approaches could improve the classification of behavioral loads and DER performance. Additionally, exploring interdisciplinary connections, such as combining energy modeling with social network analysis, could reveal new dimensions of household and community resilience.
Broader context and long-term impact
This study addresses a pressing challenge in the global transition to sustainable urban energy systems: balancing the benefits of electrification with the imperative of resilience. By offering a scalable, data-driven framework for household vulnerability assessment, it contributes to the broader discourse on how cities can adapt to climate change, mitigate risks, and enhance the quality of life for residents.
In a global context, the findings underscore the need for tailored resilience strategies that account for regional and climatic variations. Policymakers and urban planners worldwide can leverage this research to develop adaptive infrastructure that not only supports decarbonization but also safeguards communities against the growing risks of extreme weather events.
Conclusion
This study introduces a framework for assessing household vulnerability to power outages in rapidly electrifying urban environments. By combining ML with high-resolution synthetic data, we developed a scalable and privacy-preserving methodology to classify household energy systems and quantify vulnerabilities across diverse scenarios. Fully electrified homes were found to be significantly more vulnerable during winter storms due to their reliance on electric systems, whereas mixed-energy configurations benefited from greater resilience through energy diversification. These findings align with the existing literature but offer enhanced granularity, linking electrification levels to outage risks at the household level.
The framework bridges grid-level vulnerability assessments with household-specific realities, advancing resilience planning efforts. However, its reliance on synthetic data limits direct real-world applicability. Expanding the approach to include real-world data and diverse building types, such as multi-family or mixed-use structures, would enhance its robustness and generalizability. Furthermore, the challenges associated with classifying behavioral loads, such as water heating, highlight opportunities for methodological refinement, particularly in feature engineering.
This work has practical implications for policymakers and urban planners, enabling targeted interventions in areas with high concentrations of fully electrified households, especially in regions vulnerable to extreme weather. Nevertheless, the framework addresses only the technical dimensions of resilience, without directly integrating socioeconomic or broader infrastructural factors, which remain critical to comprehensive planning.
In summary, this study contributes to urban energy resilience by providing a scalable framework for household-level vulnerability assessment. While not a comprehensive solution, it lays a foundation for future research and practical applications as cities navigate the dual imperatives of decarbonization and climate adaptation.
Footnotes
Funding
The authors received no financial support for the research, authorship, and/or publication of this article.
Declaration of conflicting interests
The authors declared no potential conflicts of interest with respect to the research, authorship, and/or publication of this article.