






Abstract
This article highlights the critical role of robust data infrastructure in enabling data-driven smart cities, emphasizing metrology and systems engineering to ensure reliability and interoperability. The Smart Metrology Campus (SMC) aims to facilitate reliable data science in smart cities by integrating sensor and meter data with metrology-based metadata. Prior research has established systems engineering as the optimal strategic framework for guiding such data engineering processes. Additionally, the subsequent concept phase has been demonstrated to align with the data engineering requirements for electricity data collection. Building on this, the present study extends the methodology by defining a data quality framework focused on trust in electricity meter data. The article further elaborates on the systems definition phase, utilizing outcomes from the concept definition, such as requirements and general architecture, to develop a detailed system architecture, including technology selection for subsystems. It explores methods and tools for efficient system definition, combining established techniques like requirements tables and criteria catalogs with software engineering approaches like entity-relationship models and mockups. These methods, alongside the data quality framework, are applied in a case study of the SMC, culminating in a fully specified system architecture with detailed subsystem descriptions to support implementation.
Introduction
In the rapidly evolving landscape of smart cities, metrology and robust data infrastructure play a pivotal role in ensuring the reliability, interoperability, and trustworthiness of urban systems. Metrology, which is the science of measurement, extends beyond traditional calibration to encompass the validation of data integrity, sensor accuracy, and algorithmic transparency within interconnected networks. As cities increasingly rely on Internet of Things (IoT) devices, big data analytics, and cyber-physical systems, the need for standardized metrological frameworks becomes critical to support real-time decision-making, resource optimization, and sustainable urban development. Recent research highlights the importance of systems metrology, which shifts focus from individual sensors to integrated data infrastructures, enabling cities to address challenges such as data governance, interoperability, and security while fostering innovation in urban management and services (Jung et al., 2024).
The Smart Metrology Campus (SMC) at the Physikalisch-Technische Bundesanstalt (PTB), Germany’s National Metrology Institute, explores how metrological principles can be applied to future urban environments. A key element of this initiative is the establishment of advanced data infrastructures, designed not only to meet institutional objectives such as improving energy efficiency but also to serve as a research platform for metrology in smart city contexts. At the technological core of such infrastructures lies a data management system capable of automatically acquiring, storing, and semantically linking sensor data with its associated measurement metadata (Jung et al., 2024). The chosen concept for such data management systems is the lambda architecture (Ulbig et al., 2025b).
The principles and systems developed in this context are being advanced in cooperation with the Elenia Institute at the Technical University of Braunschweig (Kurrat and Engel, 2024). This article continues the paper ”Building trustworthy smart cities: the system definition of the SMC data infrastructure” (Ulbig et al., 2025b). The result of the prior work was to supplement the concept definition phase with tools as well as define the lambda architecture as fitting concept for a data management system for the SMC and its use case. This article aims to define the systems definition phase and supplement it with tools and methods from other systems engineering projects. The defined systems engineering phase will then be applied on the SMC use case to select the right technology, define the architecture and provide further documents to structure and enhance the development of the lambda architecture. This article provides a detailed evaluation of the application of the systems engineering approach to develop the lambda architecture for the SMC. In particular, the following research questions are discussed:
Which data quality (DQ) aspects are relevant to ensure trust into measuring data of electricity meters? How must the Lambda Architecture be designed to enable the semantic interconnection of sensor and meter data as well as their associated metadata in the smart city domain? What are the advantages and disadvantages of employing systems engineering for data engineering in the systems definition phase?
The state-of-the-art section outlines the theoretical and technological context by reviewing existing literature and frameworks relevant to the field. The state of the art is parted into a general description about the role of data infrastructures in smart cities, a review of the DQ dimensions which are related with trust, and a summary of the preliminary works of so far systems engineering approach for data engineering and its application to the use case electricity meters in smart cities. The trust in data is a critical aspect of any analysis.
The section DQ compares different DQ dimensions which are found in the state-of-the-art section to synthesize the relevant dimensions which are needed to ensure trust in data. The result of the section is a DQ framework for the trust in data from electricity data. These DQ dimensions will have an impact on the final design of systems components such as the data model and dashboard design.
Section 4 presents a systematic analysis of design principles, tools, and techniques drawn from the domains of data, software, and systems engineering. These elements are synthesized into a cohesive systems definition approach adapted for data engineering processes. The methodology involves deriving the relevant system components from the selected concept, identifying the necessary requirements, selecting appropriate technologies, and designing a comprehensive system architecture. This process culminates in the development of detailed design specifications for each individual component, ensuring a structured and implementable system design.
The case study then presents a real-world application of the proposed methodology, focusing on its implementation within the use case electricity data management system at PTB. This section provides a detailed account of the system architecture, data flow, and integration processes, highlighting the challenges encountered and the solutions applied. The case study serves as a practical demonstration of the methodology’s effectiveness, offering insights into its scalability, adaptability, and performance in a real-world setting. In Section 6, the results obtained from the case study are critically analyzed and interpreted. This section compares the findings with the existing state-of-the-art, evaluating the strengths and weaknesses of the proposed system. It addresses the implications of the results for the broader field of data engineering, discussing how the methodology could be applied to other domains or scaled for larger implementations. Additionally, it acknowledges the limitations of the study, such as potential bottlenecks in data processing or challenges in integrating legacy systems, and suggests areas for future research to overcome these obstacles.
Finally, the conclusion summarizes the key contributions of the article, restating the research objectives and how they were achieved. It highlights the practical and theoretical significance of the proposed data management system, emphasizing its potential to improve data quality, system interoperability, and decision-making processes. The conclusion also provides recommendations for practitioners and researchers, suggesting future directions for extending the work, such as exploring advanced analytics, machine learning integration, or further optimization of the data pipeline.
The role of data infrastructures for smart city challenges
Smart cities represent a transformative approach to urban development, leveraging digital technologies to enhance efficiency, sustainability, and quality of life. However, their implementation is fraught with challenges, particularly as cities grapple with the dual pressures of rapid urbanization and climate-induced migration. As Carvalho argues, climate change is reshaping urban centers by driving large-scale, often permanent displacement due to extreme weather, resource scarcity, and ecological degradation (Carvalho, 2025). This phenomenon strains infrastructure, social cohesion, and governance systems, while also exposing gaps in legal frameworks designed to protect the rights of environmental migrants and ensure equitable access to urban services. The Teitiota case and broader international legal discourse highlight the need for anticipatory urban planning that integrates climate resilience, ensuring that cities can address both immediate pressures and long-term vulnerabilities (Carvalho, 2025).
The role of data infrastructures in smart cities is central to addressing these challenges, as they enable the integration of real-time data from diverse sources to support decision-making and service delivery. FIWARE emerges as a key enabler in this context, providing standardized APIs such as NGSI-LD and a library of Smart Data Models to ensure interoperability, data sovereignty, and the creation of value chains across domains (Ahle and Hierro, 2022). Standardization through metrology, which is the science of measurement, further enhances the reliability and comparability of data, ensuring that smart city infrastructures can deliver consistent and trustworthy insights. However, the deployment of these infrastructures introduces legal challenges, particularly around data ownership and the role of search engines in digital markets. Funta’s analysis underscores the importance of the General Data Protection Regulation (GDPR) in addressing these issues, advocating for stronger consumer rights, such as data portability and opt-in consent, to mitigate lock-in effects and ensure fair competition (Funta, 2024).
The exchange of data between organizations in smart cities is essential for addressing the multifaceted challenges of urban development, including climate resilience and resource optimization, as it fosters collaborative problem-solving and enhances interoperability. However, as outlined by Bojinovic Fenko et al. (2024), the EU’s evolving security landscape demonstrates that such data exchange is not merely a technical issue but also a legal and security concern, particularly within the European context. These risks are compounded by the interconnected nature of data infrastructures, where unauthorized access or cyberattacks could trigger cascading disruptions across critical urban systems. In response, FIWARE Data Spaces, when combined with targeted legal reforms, offer a promising pathway to bolster the EU’s security framework. By enabling secure, cross-border data sharing through mechanisms like eIDAS, IDS Connectors, and Keyrock, these infrastructures can mitigate risks while fostering resilience against geopolitical and economic pressures (Ahle and Hierro, 2022). The FIWARE IDS Connector, for instance, ensures that data exchanges are authorized and that participants comply with defined rules, thereby addressing both legal and security concerns in a hybrid threat environment (Ahle and Hierro, 2022). Furthermore, the GAIA-X project and the Connecting Europe Facility (CEF) Digital program align with the EU Strategy for Data, aiming to create a single, interoperable market for data sharing across sectors, grounded in European values of privacy, self-determination, and fair competition (Ahle and Hierro, 2022). By combining standardized data infrastructures with legal frameworks that address ownership, access, and security, the EU can not only enhance the functionality of smart cities but also reinforce its strategic autonomy and resilience in an increasingly complex global landscape.
Data engineering structured by systems engineering
This article constitutes the third installment of the series: ‘‘Building trustworthy smart cities,” which published in this journal. The initial study, following extensive analysis, concluded that a systems engineering approach is best suited for planning the development of a data management system tasked with collecting, historicizing, and distributing data within a broader data infrastructure. Systems engineering serves as a holistic framework that supports the development of complex systems (Kossiakoff et al., 2011). This approach facilitates the realization, operation, and decommissioning of engineered systems by applying systems principles and concepts in conjunction with scientific, technological, and managerial methods (ISO/IEC/IEEE 15288, 2023). The systems engineering approach employed here is the technical process as described by the ISO/IEC/IEEE 15288 standard (ISO/IEC/IEEE 15288, 2023). This technical process comprises the phases of concept definition, system definition, system realization, and system deployment and use.
The primary objective of the concept definition phase is to identify and select an appropriate concept for the system. This concept should be justified and articulated based on the use case context, potential solution options, and the stakeholders’ requirements.
The system definition phase determines how the proposed concept can be implemented using various technologies. This phase includes the system’s requirements definition, the system analysis process, the system architecture definition process, and the design definition process (ISO/IEC/IEEE 15288, 2023). In the context of data engineering for smart cities, this phase should result in a blueprint outlining how a data management system can be implemented for its specific use case (Ulbig et al., 2025a).
The purpose of the system realization phase is to establish the solution developed in the preceding phases, ensuring it is ready for operational use. The phase comprises the processes of implementation, integration, verification, and validation. Following implementation, the resulting components are integrated, after which both the implementation and integration outcomes must undergo verification and validation.
The system deployment and use phase specifies requirements early in the technical lifecycle, underscoring the importance of ease of maintenance, uninterrupted operation, and readiness for eventual transitions or decommissioning (ISO/IEC/IEEE 15288, 2023). In the context of data engineering, the emphasis is placed on preparation activities, as the execution and management stages incorporate the strategic considerations for each process (Ulbig et al., 2025a).
The second paper (Ulbig et al., 2025b) describes how the concept definition can be executed by diverse methodologies and tools. These methodologies and tools are subsequently demonstrated within the SMC project as a practical use case.
Figure 1 outlines the tasks and procedural order of the system definition phase. The process begins with the system requirements definition process, which, as per the standard, aims to translate stakeholder and user expectations into a technical framework that meets operational demands. Both, the requirements and the applicable constraints are established by the stakeholders (ISO/IEC/IEEE 15288, 2023).
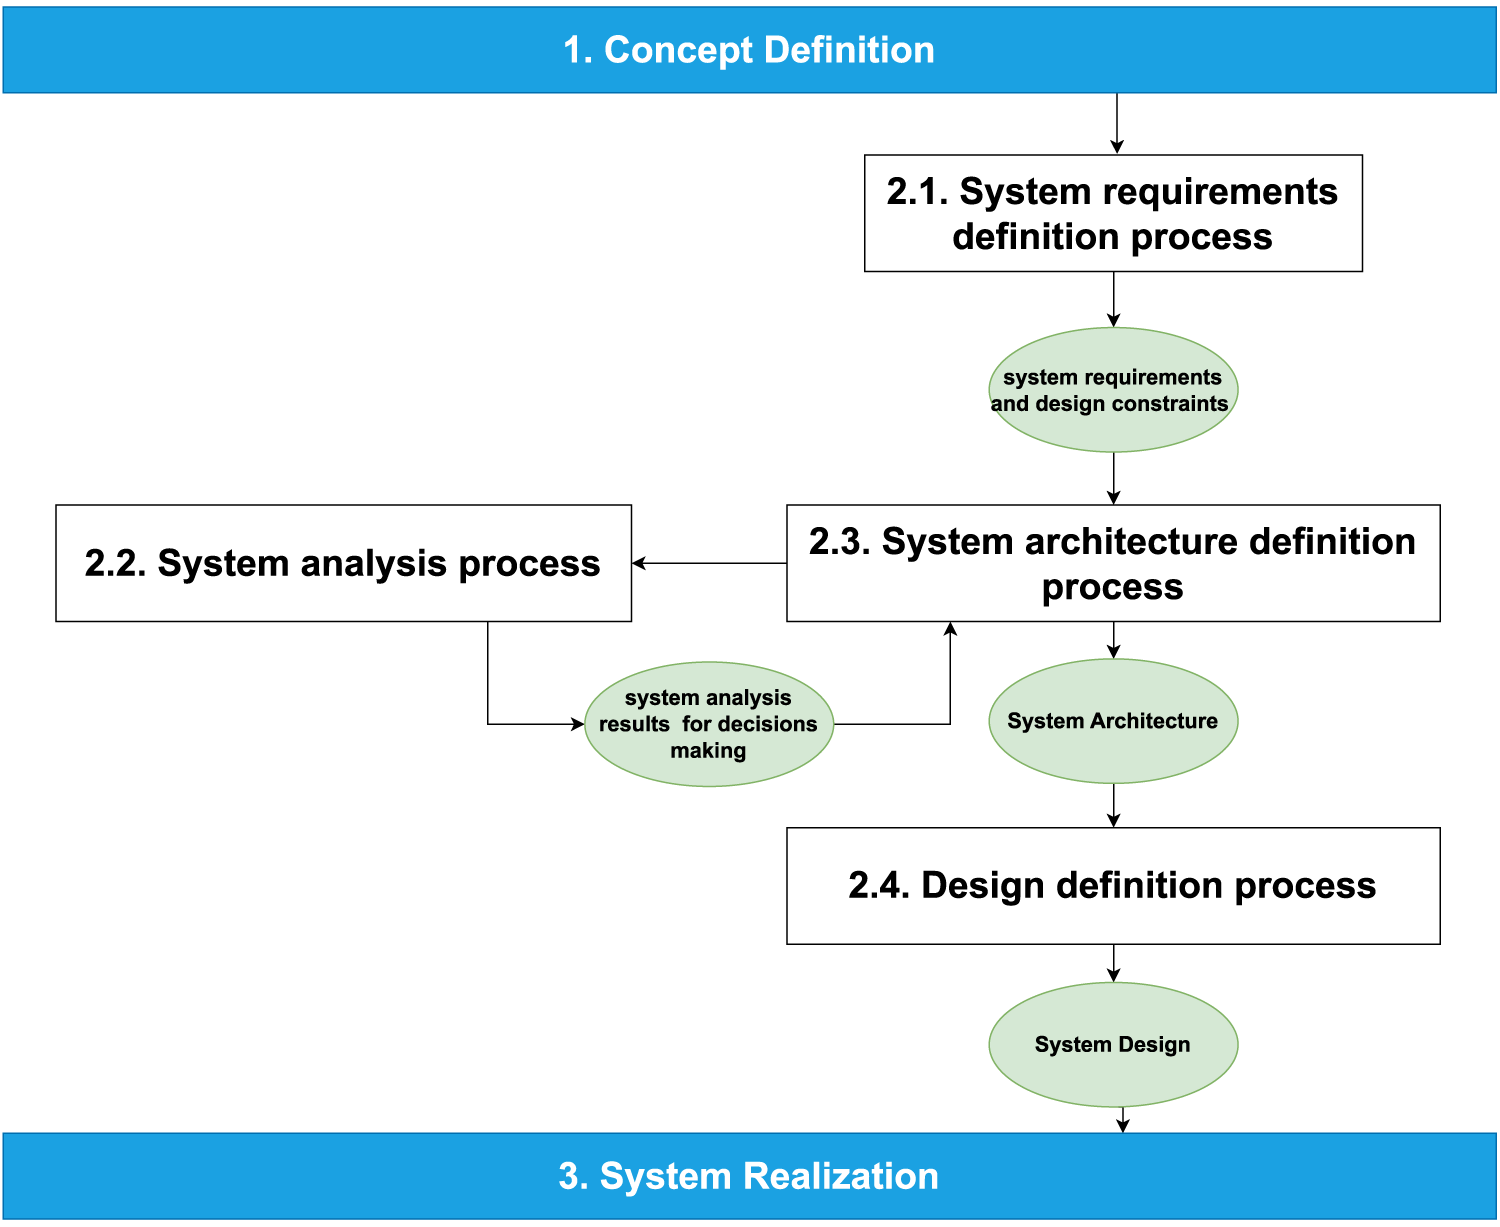
Ulbig, 2025 page 8: Steps of the technical process of systems engineering described in the ISO/IEC/IEE 12588 with extensions for data engineering (Ulbig et al., 2025a).
Unlike the concept definition phase, this process emphasizes technical considerations (ISO/IEC/IEEE 15288, 2023). In the context of data engineering for smart cities, the system requirements definition generates a comprehensive overview of requirements and constraints, informed by insights from the concept definition phase. This overview subsequently serves as evaluation criteria, guiding decision-making in the system analysis and system architecture processes (Ulbig et al., 2025a).
The second step is the system architecture definition process in combination with the system analysis process. As outlined in the standard, a best practice within this process is to define a solution grounded in principles, concepts, and properties that are logically and coherently interconnected (ISO/IEC/IEEE 15288, 2023). From the perspective of data engineering in smart cities, this process build up to a formulation of a detailed description or visualization of the system architecture. It provides a comprehensive overview of the selected technologies and their interactions, both internally and with external systems. The final solution selection is guided by the system analysis process, in alignment with the system requirements and design constraints (Ulbig et al., 2025a).
The system analysis process involves the systematic evaluation of the system elements identified during the system architecture definition process, applying the criteria established in the system requirements definition process. Originally, the system analysis process extends beyond basic evaluation, incorporating a range of analytical functions and varying levels of complexity, depending on the significance of the required information (ISO/IEC/IEEE 15288, 2023). Within the domain of data engineering for smart cities, the process serves similar purposes. However, its primary contribution is the generation of system analysis results that support the decision-making during the system architecture process (Ulbig et al., 2025a).
The design definition process translates the established architecture and requirements into an implementable system design. This process provides comprehensive descriptions and diagrams that correspond with architectural models and perspectives while fulfilling all agreed on system requirements (ISO/IEC/IEEE 15288, 2023). Within the domain of data engineering,the resultant system design yields a detailed blueprint including specifications for both the overall system architecture and its individual constituent elements (Ulbig et al., 2025a).
The primary objective of the system is to provide additional information to judge the trustworthiness of data from sources such as meters and other data providers. To achieve this objective, the system must provide DQ metrics that enable data consumers to assess the trustworthiness of the data. For the system to provide these DQ aspects, they need to be measurable and either directly traceable from the measurement or indirectly derived from related metadata. Additionally, the DQ aspects should be metrologically traceable, meaning that a measurement result is a property that can be related to a reference through a documented, unbroken chain of calibrations, with each calibration step contributing to the measurement uncertainty (JCGM, 2012). Over time, numerous publications and standards have addressed the topic of trust in data and DQ:
One of the arguably first publications which investigates this topic is “Beyond Accuracy: What Data Quality Means to Data Consumers” in 1996 (Wang and Strong, 1996). In this article, the authors present a framework for organizing DQ dimensions based on a two-stage survey and a two-phase sorting study. As a result, they concluded that there are four categories of DQ, which are intrinsic DQ, contextual DQ, representational DQ, and accessibility DQ. Since both the representational DQ and accessibility DQ are not measurable, the resulting attributes which can be considered are believability, accuracy, objectivity, reputation, value-added, relevancy, timeliness, completeness, and appropriate amount of data.
The first standard to explicitly define DQ criteria is ISO/IEC 25012 (ISO/IEC 25012, 2008), which introduces a comprehensive DQ model. This model, framed within the context of software engineering, distinguishes between inherent DQ, system-dependent DQ, and a combination of both. To ensure applicability across diverse systems, the analysis will concentrate on the system-inherent attributes, namely consistency, currentness, completeness, precision, accuracy, security, availability, understandability, manageability, efficiency, productivity, safety, credibility, accessibility, and regulatory compliance.
Another relevant publication addressing this use case is the technical report titled “Towards a context-dependent numerical DQ evaluation framework Technical Report” from 2018 (Marev et al., 2018). By focusing on numerical data and conducting a comprehensive survey of relevant literature, the report identifies accuracy, accessibility, consistency, completeness, currency, timeliness, precision, and uniqueness as fundamental dimensions of DQ.
One of the more recent and widely cited studies, ‘‘Dictionary of Dimensions of Data Quality,” has been adopted by the International Data Management Association (DAMA) (DAMA-NL, 2020). This article provides a comprehensive overview of various DQ dimensions, categorizing them into distinct data concepts, such as data values, format, metadata, and so on. The examined are those directly associated with data values, including metadata compliance, objectivity, precision, accuracy, comparability across populations, comparability over time, completeness, consistency, credibility, currency, integrity, plausibility, validity, and volatility.
A publication which is specifically dedicated DQ in sensor networks is ‘‘Semantic Description of Quality of Data in Sensor Networks” (Vedurmudi et al., 2021). The data quality dimensions are described here as qualtiy of data indicators, which are battery level, sampling rate, calibration data, operating conditions, accuracy, timeliness, completeness, and consistency.
The most recent related publication presents the METRIC framework, which was developed to assess DQ for trustworthy AI in medicine. This framework is organized into five distinct clusters: measurement process, timeliness, representativeness, informativeness, and consistency. Within this structure, representativeness and informativeness are acknowledged as subjective dimensions that cannot be directly quantified. For the remaining DQ dimensions, the underlying DQ dimensions derived from these clusters include accuracy, precision, noisy labels, carelessness, outliers, completeness, expertise, traceability, data poisoning, consistency, timeliness, age, and currency (Schwabe et al., 2024).
Data quality
As mentioned in the state-of-the-art, the DQ dimensions which are relevant for establishing trust in data are governed by two chosen fundamental criteria. First, it is required that the necessary information can either be provided directly by the data source or derived from it mathematically. Secondly, it is essential that these dimensions demonstrate objectivity, thereby eliminating any ambiguity or subjective interpretation. The quantities which the DQ dimensions apply to will be active power (
The main dimensions are measurement uncertainty, completeness, consistency, timeliness, credibility, and validity. With the exception of validity, these dimensions align with the inherent data quality dimensions defined in the ISO 25012 standard (ISO/IEC 25012, 2008). According to the standard, inherent DQ refers to the extent to which the intrinsic characteristics of data inherently possess the potential to satisfy both explicitly stated and implicitly derived requirements when utilized under defined conditions. From this perspective, DQ is concerned primarily with the data itself (ISO/IEC 25012, 2008). By this, they do fulfill both requirements that those DQ dimension can be provided by the source and are objective, with the exception of validity, which is inherently context-dependent. However, when the appropriate context is provided, validity also fulfills both requirements and plays a crucial role in establishing trust in data. The following sections introduce the main dimensions along with their associated sub-dimensions.
Accuracy and measurement uncertainty
Accuracy is for example defined by the ISO 25012, as the degree to which the data has attributes that correctly represent the true value of the intended attribute of a concept or event in a specific context of use (ISO/IEC 25012, 2008). In measurement applications, however, accuracy is frequently operationalized through quantitative metrics, with the definition often reduced to a simplified form: the difference between a measured value and the true value. This pragmatic interpretation commonly manifests in statements such as ‘‘accurate to within
A related term to accuracy is the term uncertainty. Uncertainty of measurement recognizes the inherent limitations in achieving perfect precision and is defined as a parameter associated with a measurement result that quantifies the range of plausible values attributable to the measured quantity. It is typically expressed as an interval within which the true value is estimated to reside, based on a specified level of statistical confidence. Importantly, it does not assume or depend on the existence of a single, definitive true value (NPL, 2026). The term uncertainty is established in the domain of metrology, which has the effect that established methods are available such as a guide to the expression of uncertainty in measurement (GUM) and calibration.
GUM provides standardized guidelines for evaluating and reporting uncertainty in measurement, ensuring its relevance to a wide range of measurement applications. The uncertainties which are specified are the standard uncertainty and expanded uncertainty (JCGM, 2008). The standard measurement uncertainty is described as the standard deviation of the measurements. The calculation of the standard deviation splits into type A and type B. Type A evaluation is the statistical determination of a component of measurement uncertainty, based on analyzing measured quantity values acquired under defined measurement conditions. The calculation of type B is based by means other than type A. Examples for type B evaluation, which are provided by GUM JCGM (2008), are based on information ‘‘associated with the quantity value of a certified reference material,” ‘‘calibration certificates,” or ‘‘accuracy class of a verified measuring instrument,” for example. The expanded uncertainty is the interval around the measuring result where the true value is considered to be included by a defined probability. This probability is typically 95% in metrological applications. The expanded uncertainty is calculated by the standard uncertainty multiplied a factor larger than one. For normal distributed measurement data, this factor is commonly two to achieve 95% coverage.
GUM (JCGM, 2008) describes the calibration operation as a two-step process conducted under specified conditions. In the first step, it establishes a relationship between the quantity values (including their measurement uncertainties) provided by measurement standards and the corresponding indications (with associated uncertainties). In the second step, this relationship is used to derive a measurement result from an observed indication.
A sub-dimension which is also often mentioned in the DQ frameworks is precision. Here precision is captured within the dimension of measurement uncertainty. GUM (JCGM, 2008) explicitly states that precision (expressed as the standard deviation of repeated measurements) contributes to the combined uncertainty of a measurement result.
Further sources for information about the measurement uncertainty can be found in the standards DIN EN 50470-4 and DIN EN 50470-3, which some electricity meters are manufactured after. The standard divides the electricity meters into three accuracy—classes A, B, and C. A allowing the most inaccuracy and C allowing the least inaccuracy. Further the standards define impacts factors for conditions such as temperature, voltage jumps by
Consistency
Consistency is described as a the degree to which data is free of contradictions (ISO/IEC 25012, 2008; Miller et al., 2025). As outlined by Schwabe et al. (2024), consistency is further categorized into three different distinct types: rule-based consistency, logical consistency, and distribution consistency. Notably, rule-based consistency is synonymous with validity, which is treated as a separate dimension in this framework. Logical consistency refers to the extent to which data values are plausible and records are semantically coherent. The third dimension is distribution consistency which includes homogeneity which is the extent to which distributions are stable among relevant subsets and distribution drift which is the extent to which new data matches the distribution of existing data.
In the case of electricity meter data, distribution consistency is challenging to apply due to the highly dynamic nature of the data distribution. However, logical consistency, particularly in assessing the interdependencies among attributes, can be enforced through the application of physical rules. These rules are derived from the power triangle relationships, which include the calculations for active power (1), reactive power (2), apparent power (3), and the power factor (5) (Elektronik-Kompendium, 2026), as well as the computation of











In all occasions, the analyzed attribute is the minuend, which has the effect that the difference will be positive in case the analyzed attribute exceeds its calculated evaluation equation and negative if the opposite holds. The difference will also be given in the unit of the attribute. The resulting difference is consistently expressed in the unit of the attribute under consideration.
Validity, as defined by DAMA-NL (2020), refers to the degree to which data conforms to established rules. It is noteworthy that in certain frameworks, validity is subsumed under alternative terms such as credibility (Marev et al., 2018) or rule-based consistency (Schwabe et al., 2024). However, within the context of trust in data, validity emerges as a fundamental criterion. By this data which is invalid automatically cannot be trusted.
For electricity meters, the validity of data is contingent upon the metered quantities (e.g., frequency, current, and voltage). Sub-dimensions which are related to the validity are noisy labels and metadata compliance. This means, that labels and metadata must comply with the rules of the expected context. In the case of measurements, these rules encompass the unit, range, quantity kind, as well as environmental and operating conditions. A measurement, by definition, consists of a numerical value paired with a unit (Hutzschenreuter et al., 2020). By this a valid measurement requires the correct unit, which becomes relevant in case a meter get exchanged which changes the unit for a quantity.
Closely related to the unit is the quantity kind, which denotes a shared property among mutually comparable quantities (JCGM, 2012). A quantity is characterized as a property of a phenomenon, body, or substance, where the property possesses a magnitude that can be expressed as a number and a reference (JCGM, 2012).
Another critical sub-dimension is outliers, which are assessed based on the value range of an quantity. This assessment necessitates consideration of environmental and operating conditions. For electricity meters, this includes factors such as the type of power grid (low-voltage, medium-voltage, and high-voltage) and geographical location (e.g., Americas and Europe). In the context of electricity data, an exception arises with regard to polarity, wherein negative values may serve as indicators of incorrect cabling. These contextual elements are essential for determining whether a measured value falls within an expected range as set out, for example, in manufacturer specifications, thereby validating its reliability.
Credibility
The credibility is defined as the degree to which data is regarded as true and believable. It includes the concept of authenticity, which itself includes the truthfulness of origins, attributions, and commitments (DAMA-NL, 2020). Credibility is not only pertinent to raw data but also extends to metadata and documents, ensuring that all components of the data ecosystem adhere to the same standards of trustworthiness.
The truthfulness of origins is intrinsically linked to the responsibility of the data, with sub-dimensions including regulatory compliance, expertise, and traceability. To establish accountability, data must be associated with an identifiable entity, that bears responsibility for its accuracy and integrity, such as an individual, department, or organization.
In dynamic data environments where information traverses multiple entities, documenting the entire data lineage becomes essential to maintain credibility. Furthermore, modifications to the data must be tracked and displayed to substantiate its integrity. The integrity of data is closely associated with sub-dimensions such as security and volatility, with integrity threats including actions like data poisoning. Ensuring these dimensions are rigorously addressed is fundamental to maintaining the overall credibility of the data infrastructure.
The truthfulness of origins is intrinsically linked to the responsibility of the data, with sub-dimensions including regulatory compliance, expertise, and traceability. To establish accountability, data must be associated with an identifiable entity—such as an individual, department, or organization, that bears responsibility for its accuracy and integrity (Butin et al., 2016; Sax et al., 2023). This responsibility is further emphasized through the concept of clear data ownership, which involves assigning specific authority and accountability for maintaining DQ. By designating owners, organizations ensure that someone is explicitly tasked with preserving the reliability, accuracy, and ethical use of the data. This clarity prevents ambiguity and fosters a culture of responsibility (Asswad and Marx Gómez, 2021). Data governance further strengthens this framework by providing policies, standards, and monitoring mechanisms that enforce consistency, security, and compliance, thereby enhancing credibility (Li et al., 2024). Meanwhile, the organization’s role in fostering transparency, ethical practices, and robust validation methods, such as third-party audits and open data initiatives, ensures that data remains trustworthy (Butin et al., 2016). Together, these elements create a cohesive system where traceability, expertise, and regulatory adherence converge to uphold the truthfulness and credibility of data.
Completeness
Completeness, as defined by DAMA-NL (2020), signifies the extent to which all required data values are present in a dataset. This dimension can be quantitatively expressed as a percentage. However, the assessment of completeness necessitates prior knowledge of the sampling rate, as this parameter is essential for identifying missing data points and accurately determining the proportion of available data.
A further layer of complexity arises in the evaluation of metadata completeness, which is inherently more nuanced than data completeness. Whereas data completeness focuses on the presence of measured values, metadata completeness requires clarification regarding the specific types of metadata necessary for comprehensive assessment.
In the context of electricity meter data, completeness can be operationalized by calculating the proportion of missing data points relative to the expected sampling rate. The completeness of the metadata needs to be split into different views such as how complete the metadata in the database is, for which measurement and which documents. Metadata completeness entails a multi-faceted evaluation that examines, the presence of metadata, the completeness of metadata associated with individual measurements and availability and integrity of supporting documents.
Timeliness
The definition and understanding of timeliness vary significantly across sources. Three sub-dimensions: age, currentness, and latency are commonly recognized within data quality frameworks (ISO/IEC 25012, 2008). Among these, latency, defined as the time interval between data creation and data usage, is only considered to have a significant impact, in fast monitoring applications which are handled by a machine. The sub-dimensions of age and currentness are also expected to exert a smaller influence on the trust in measurement data itself. However, these sub-dimensions can exert a considerable impact on the metadata associated with measurements.
For example, the age of a device may serve as an indicator of potential errors due to component degradation over time. While older devices are prone to errors from wear and tear, even newer devices may generate erroneous outputs if improperly configured. Similarly, the currentness of related documents, such as calibration certificates, directly influences other DQ dimensions, including accuracy. To address this, the system design must preserve and present the timestamps of such documents.
Irrelevant dimensions
The dimensions which are seen here are as irrelevant for the trust in data are, for example, uniqueness, relevancy, manageability, efficiency, and accessibility. Other dimensions are related to the trust in data but do not apply to numeric values or are subjective to the user and are cannot be measured such as objectivity, believability, reputation, relevancy appropriate amount of data, understandability, plausibility, carelessness, and comparability over population or over time plausibility.
The proposed DQ framework incorporates the dimensions of accuracy, consistency, validity, credibility, completeness, and timeliness, as illustrated in Figure 2, along with the associated evaluation criteria, as outlined in the preceding definitions. The application of theses DQ dimensions will be demonstrated in the case study by the dashboard. Following the delineation of these DQ dimensions, the subsequent phase involves the methodological approach for the system definition process.
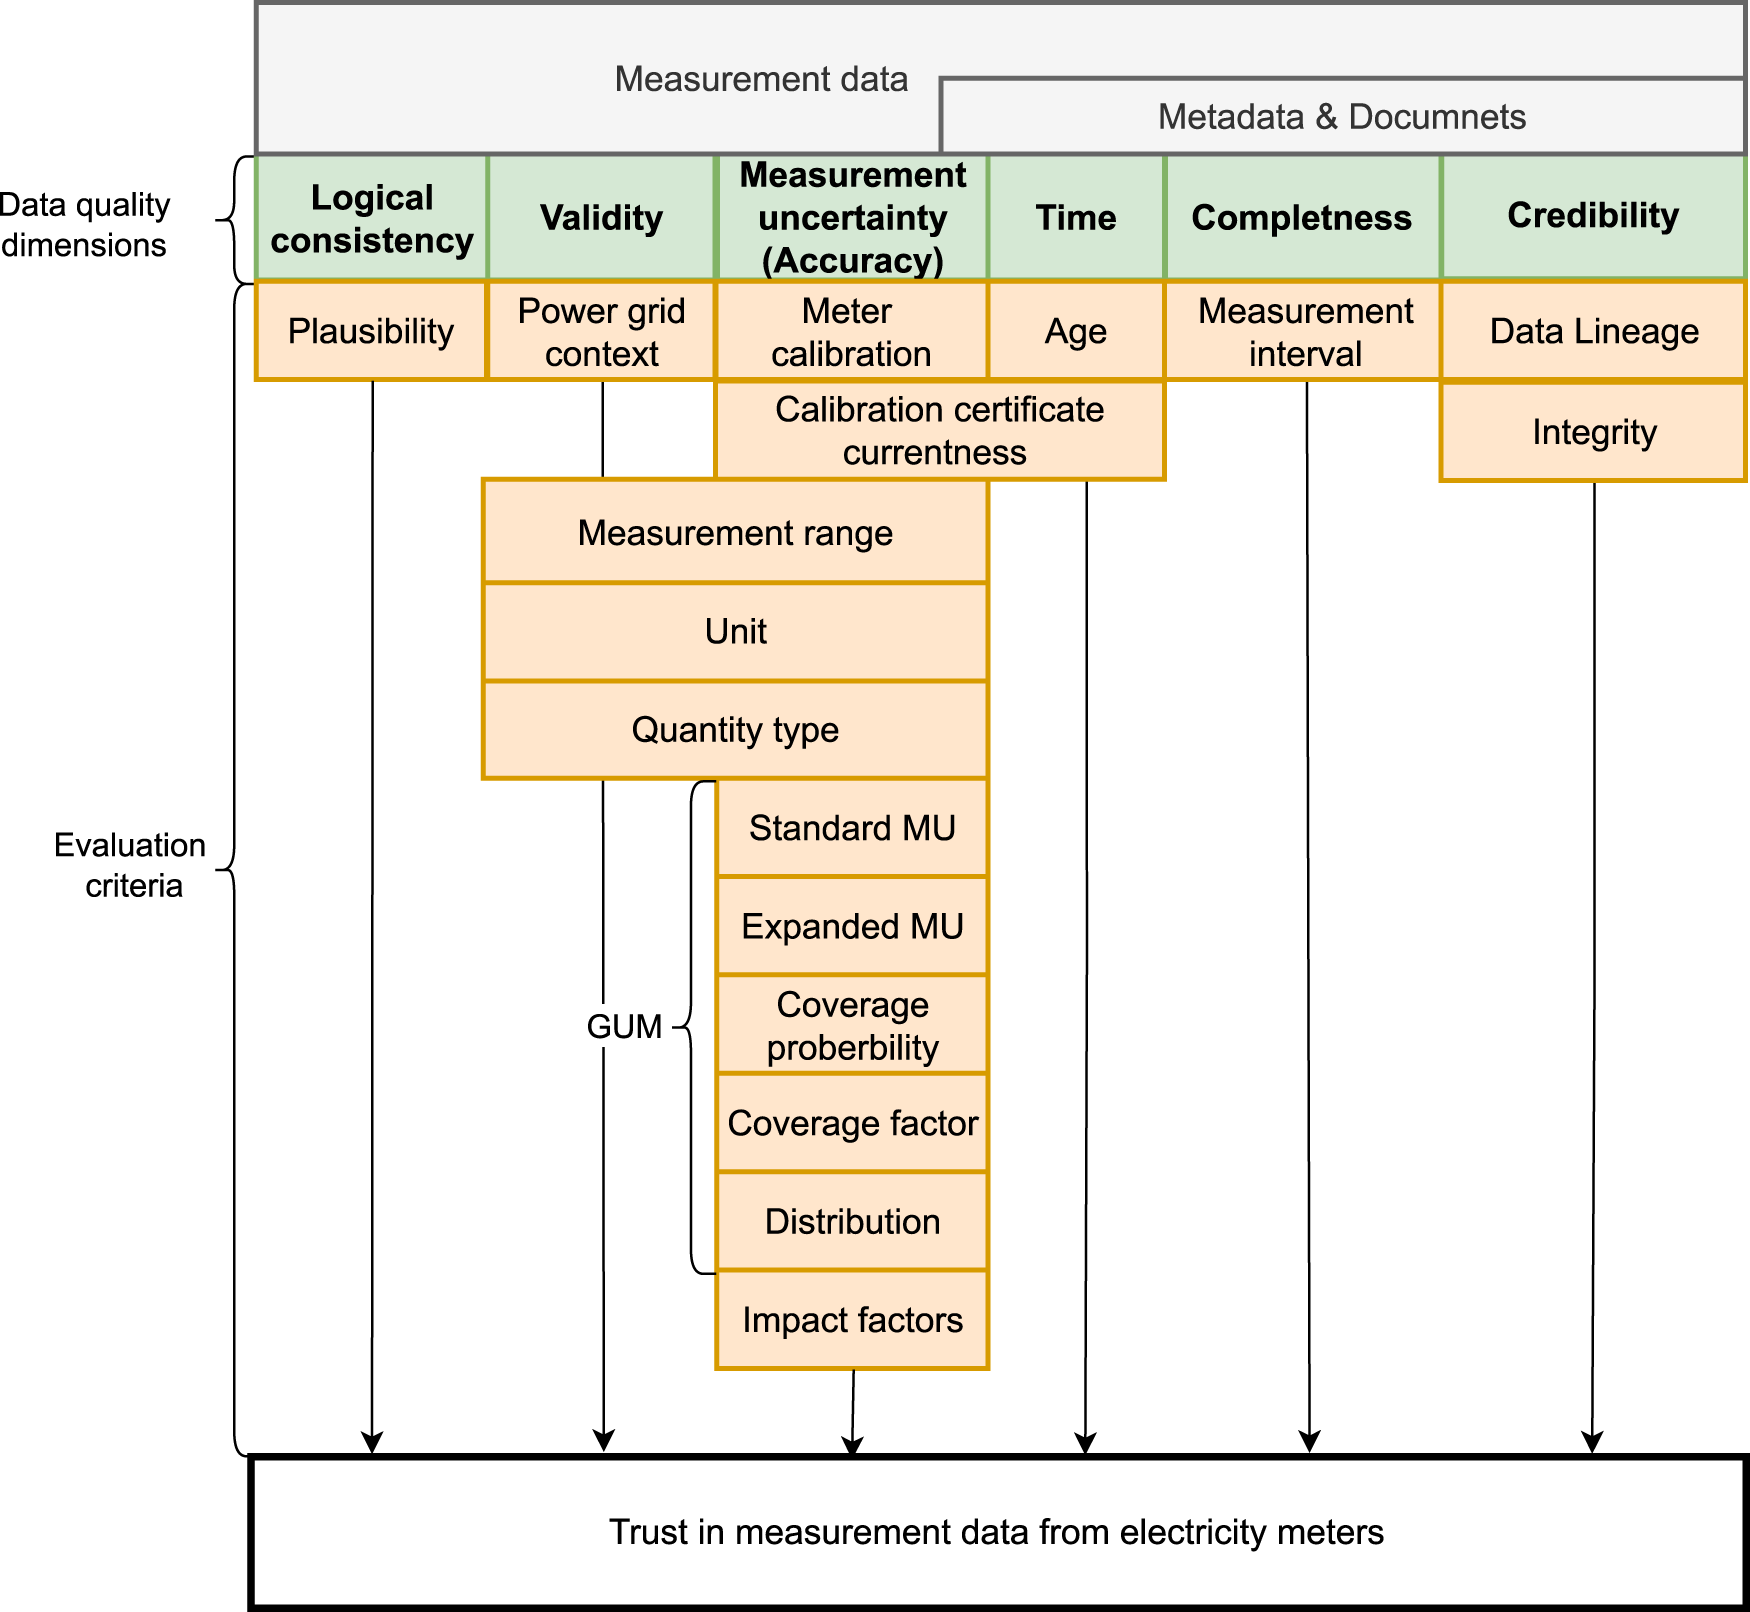
Data quality framework for measuring data and related medadata and documents. This is including data quality dimensions (green) as well as their related evaluation criteria (orange).
The methodical approach employed in this article mirrors that of the concept definition phase outlined in prior work (Ulbig et al., 2025b). In this context, all processes within the phase are systematically analyzed to determine how and with which existing methodical tools they can be effectively adapted and applied for data engineering. The result is a synthesized systems definition approach which is suitable to guide a data engineering process for the proposed smart city use case.
As described by Ulbig et al. (2025a), the system definition consists of the system requirements definition process, system analysis, system architecture definition, and design definition. The process of system definition is executed in the specified order.
As outlined by Ulbig et al. (2025b), the ISO 15288 standard establishes a general framework for the systems engineering process and defines the associated phases and tasks. The execution of the tasks themselves do need to be specified. The approach presented here seeks to address this gap by applying established methods and tools, as discussed in related work and the state-of-the-art. Where existing approaches prove inadequate, they may be adapted, and in some cases, entirely new methods must be developed. Furthermore, the selected or new methods should aim not only to follow the requirements of the data engineering lifecycle but also to simplify and potentially accelerate the overall process.
Consequently, the system definition is structured into the following process steps: Concept Architecture Diagram, System Requirement Table, Technology – Criteria Catalog, System Architecture – Draft, and Design Definition which is parted in overview and elements. Figure 3 illustrates how this process can be operationalized using methods from other domains. The subsequent section discusses the interpretation of the concept definition process in greater detail and its relation to the ISO 15288 standard.
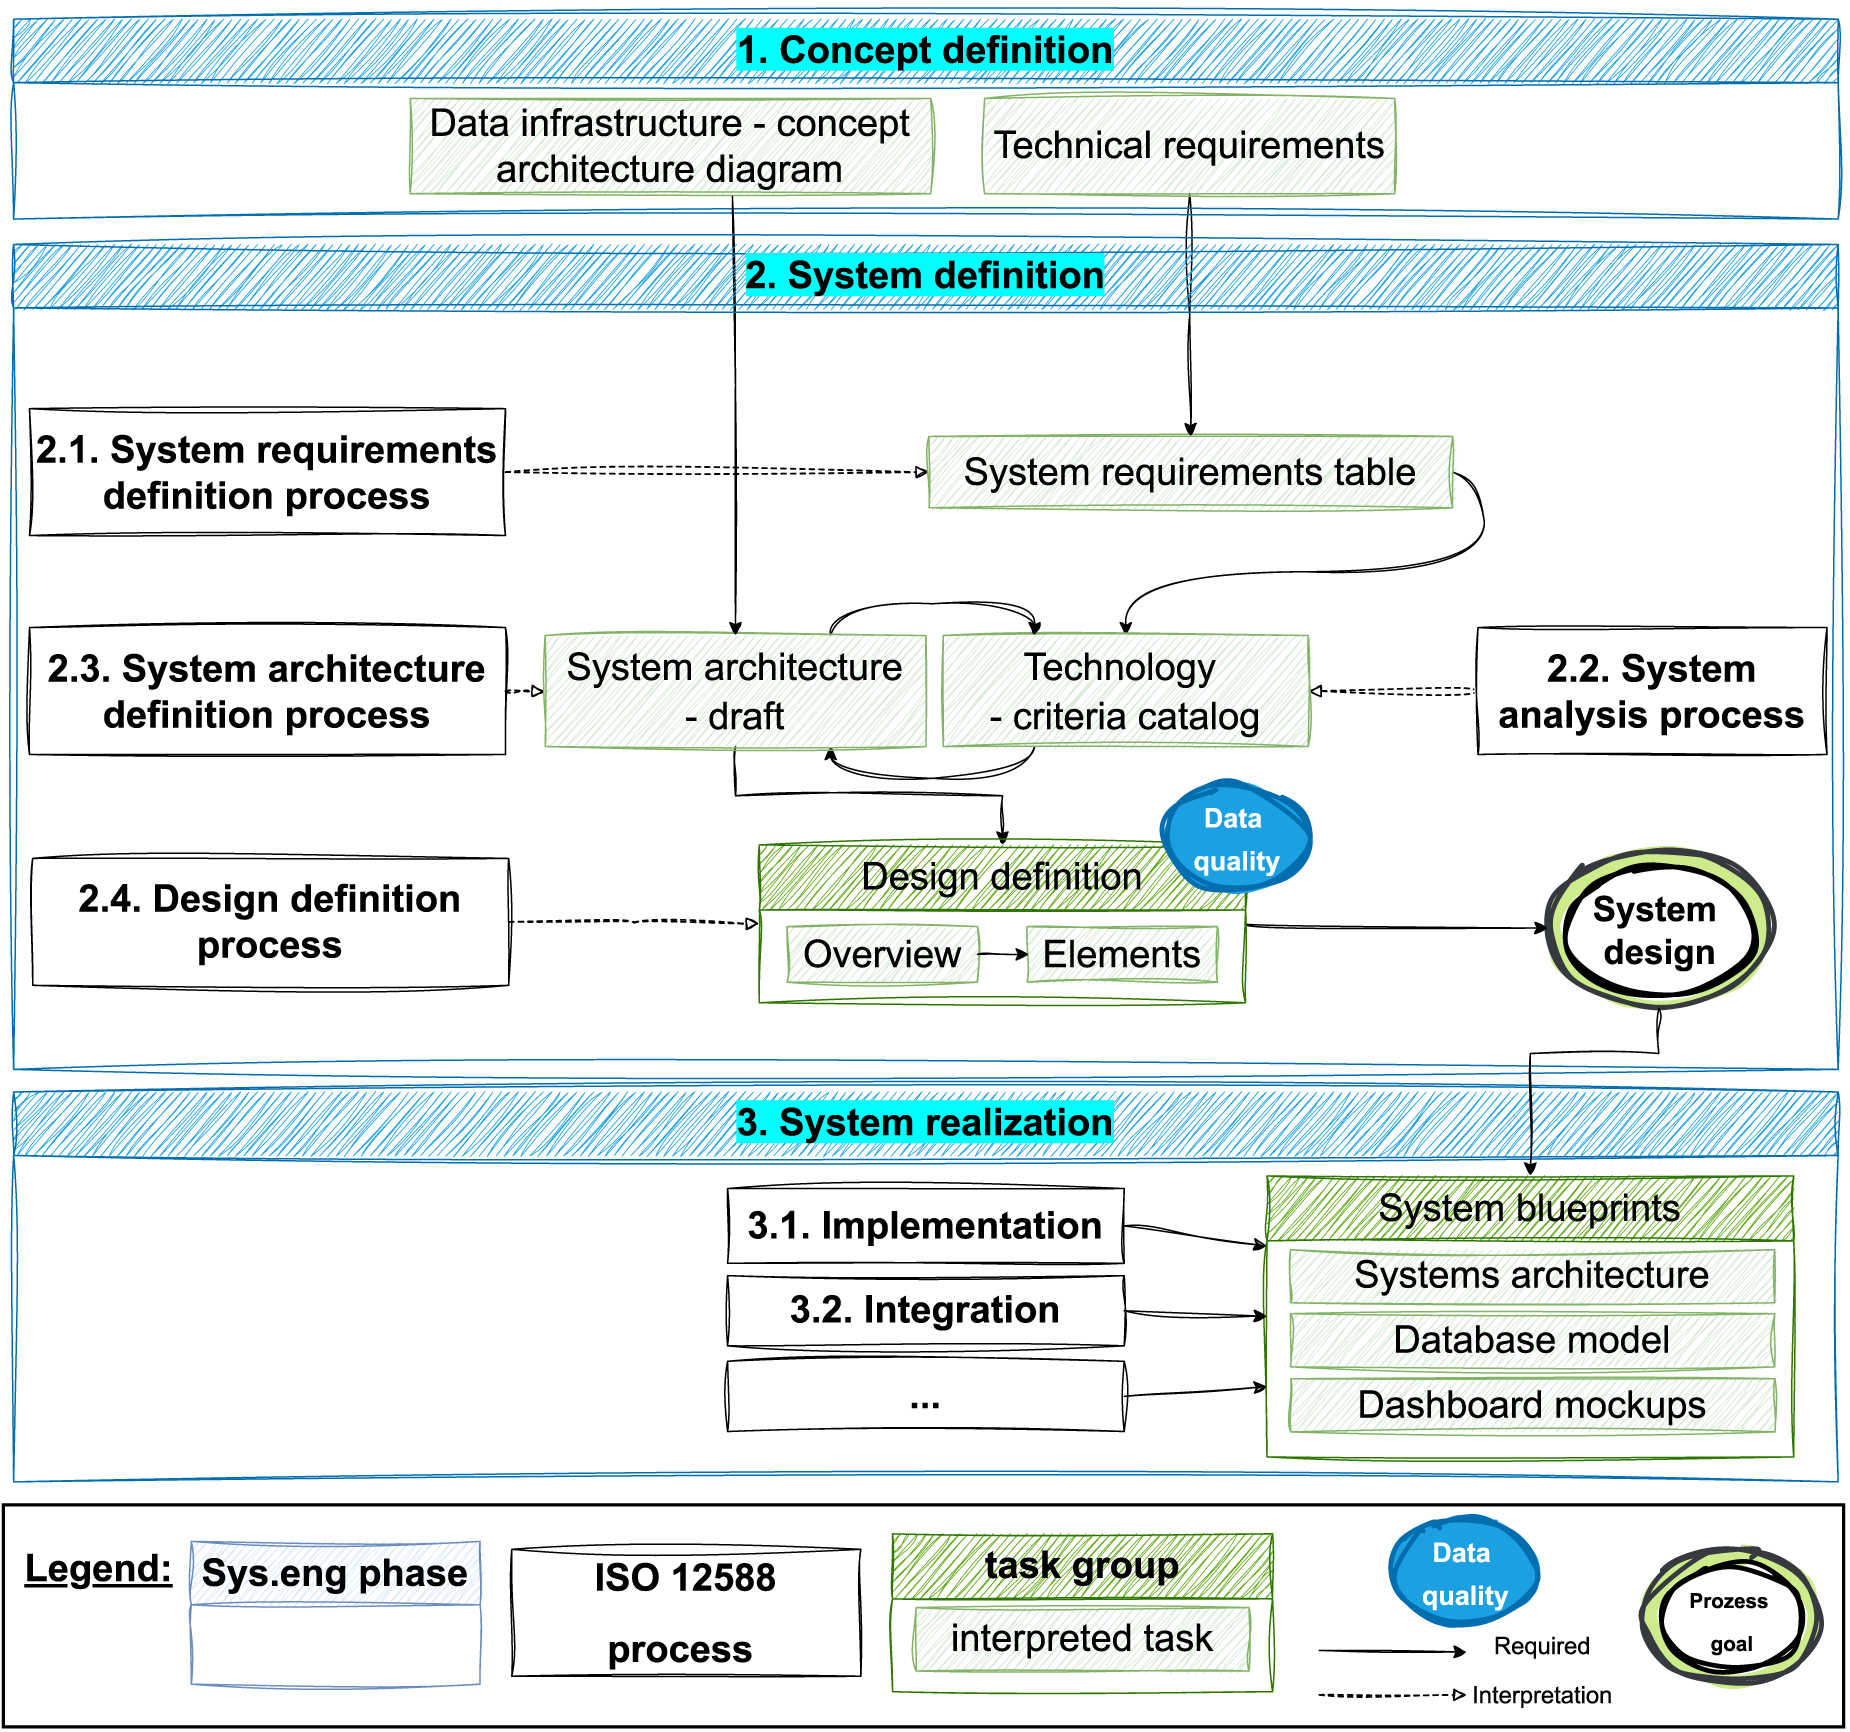
The processes of the system definition phase and their interactions including the outcome of each process.
The proposed approach initiates the process prior to the conventional onset of system definition. Within the domain of data engineering, the proposed and discussed result of the concept definition is the concept for a data management system tailored for the use case. Those concepts such as data lakes or lambda architectures already provide a predefined set of architectural components. The purpose of a concept architecture diagram of the data infrastructure is to draft and define all the sub-systems involved. This would include the sub-systems of the data management system and the auxiliary sub-systems that interface with it. Specifically, those responsible for data ingestion (e.g., data pipelines) and data consumption (e.g., dashboards).
The proposed representation for the concept architecture diagram of the data infrastructure takes the form of an sketch. This additional step creates a template that establishes the foundational systems architecture draft and enumerates the core components, thereby focusing on the subsequent selection of required technologies.
A more generalized alternative could be achieved through block definition diagrams (BDDs), a conventional method for modeling system architectures (Object Management Group , OMG). However, BDDs are less familiar to software developers, the primary intended audience for such diagrams and their advantages, including hierarchical decomposition and support for mathematical simulation, are not inherently applicable in this context.
The enumerated sub-systems, defined by the concept architecture diagram, serve as a basis for refining the requirements, which are systematically compiled in Section 4.2.
System requirements table
As defined by ISO/IEC/IEEE 15288 (2023), the Systems Requirements Definition process serves to translate stakeholder and user-centric perspectives into a technical specification that aligns with stakeholder needs.
An analogous procedure is the stakeholder needs and requirements process, which is integrated into the concept definition phase. The components of this process, the stakeholder requirements table and the system constraints table, have been developed based on the proposed requirements table framework presented by Hoffmann (2022). This tool has demonstrated its efficacy as an appropriate solution during the concept definition phase. The proposed structure for requirements encompasses several key elements, including the origin of each requirement, its intended application, and the metrics for its evaluation, as illustrated in Figure 4. For these reasons, the requirement table is proposed as the primary instrument for executing the systems requirements definition process.
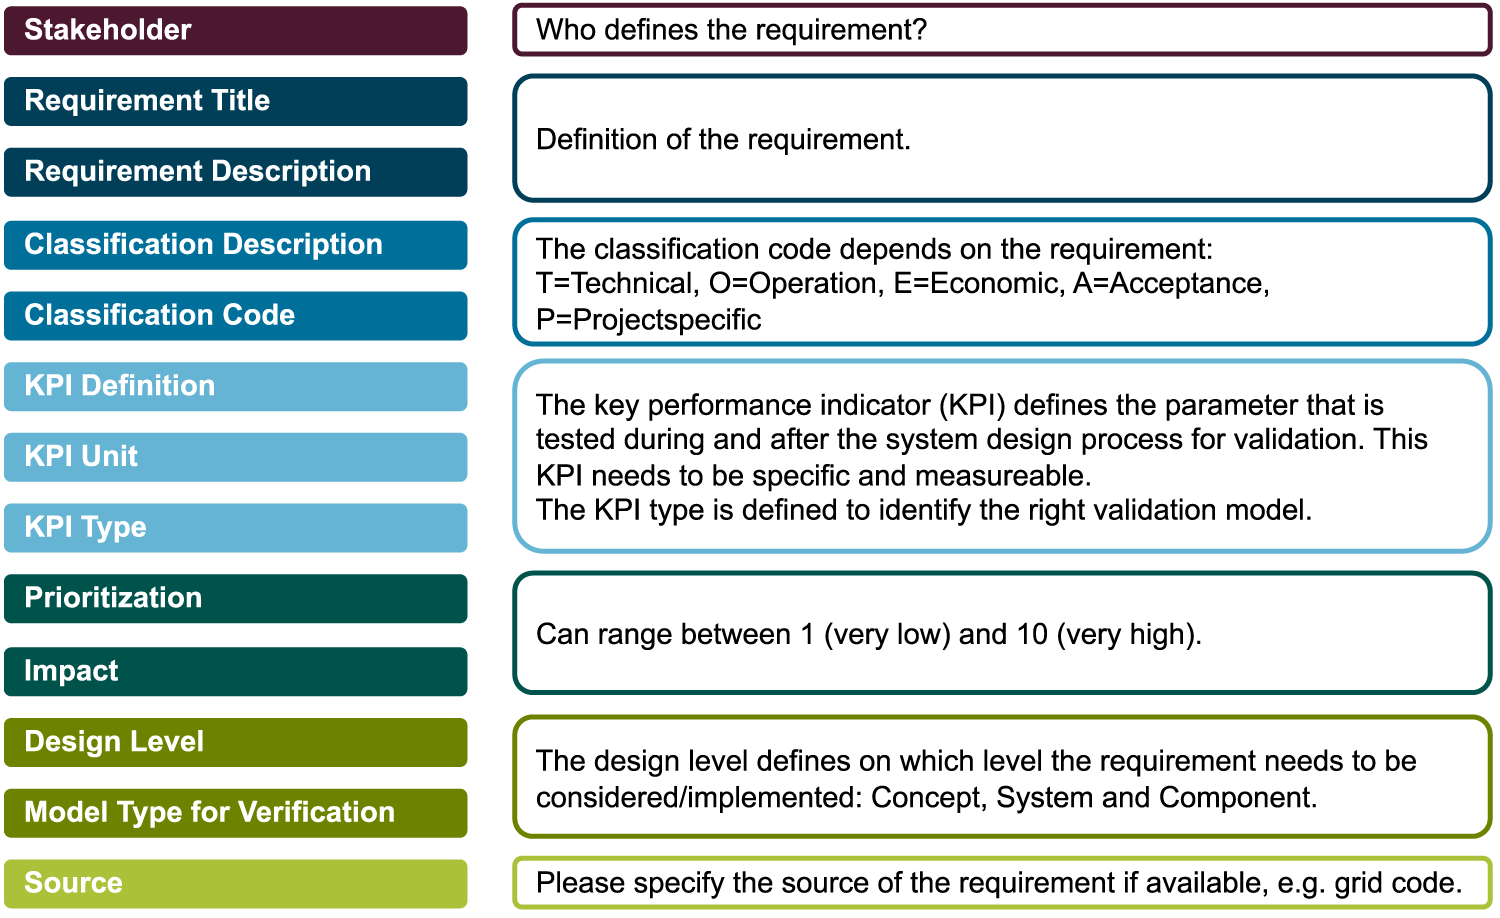
Hoffmann, 2021 page 21: Format for requirement definition with different requirement categories highlighted in different colors with the heading of each category on the left and the definition on the right (Hoffmann, 2022).
During the system definition phase, the System Requirements Table enumerates the functional and non-functional requirements pertinent to each individual sub-system or sub-system group. This includes requirements established during the concept definition phase, as well as any new requirements identified while developing the concept architecture diagram. Additionally, this framework would include further requirements that may extend to broader considerations, such as originating from strategic objectives. These defined requirements can serve as decision support for the technology selection.
Systems analysis, as defined by ISO/IEC/IEEE 15288 (2023), is designed to collect data and information to facilitate evidence-based decision-making. In the field of data engineering, the primary objective of systems analysis is to determine the fitting technology for a given sub-system. During the concept definition phase, the concept of a criteria catalog was introduced to systematically evaluate which concept best meets the specified use case requirements (Ulbig et al., 2025b). The criteria catalog is based on the established criteria applicable to data management systems. Requirements are systematically gathered during the concept definition phase and subsequently mapped to these criteria.
This kind of procedure would require the development of a criteria catalog for each sub-system. That would be very work intensive and time consuming. Instead of generating separate criteria, the requirements themselves are directly utilized as evaluative criteria and categorized into two distinct groups:
System architecture—draft
According to ISO/IEC/IEEE 15288 (2023), the primary objective of the System Architecture Definition process is to draft multiple architectural alternatives, which are subsequently evaluated against the system requirements to identify the most suitable solution. In the case of data engineering this would be a possible approach. While this approach could, in principle, be applied within the context of data engineering, the overall concept of the data management system has already been established through the concept definition process. Consequently, it is more appropriate to analyze the different alternatives for the selected sub-systems via the system analysis.
Upon selection of all sub-systems, the next logical step is to assemble each defined element and validate the interoperability of the chosen technologies. BDDs are a conventional method for representing such architectures. However, as static, they struggle to effectively depict the system’s data flow. Data flow diagrams address this challenge directly; however, their level of abstraction limits their effectiveness in visualizing the overall system architecture (IBM, 2025).
In summary, the heterogeneity of system architectures necessitates a flexible representational framework, which suggest neither BDD nor DFD. The primary objective should be to identify a representation that is both accessible to all stakeholders and comprehensive in documenting the aspects most critical to their needs.
Design definition
As defined by the standard, the objective of the design definition process is to provide sufficient information about the specified system (ISO/IEC/IEEE 15288, 2023). The information provided must enable the system’s implementation. To this end, it is important to first create a comprehensive overview of all documentation before proceeding with the development of individual components. Implementation typically requires supporting materials such as database schemas, code documentation, or dashboard mockups.
Case study
This case study investigates the integration of electricity meter data and associated metadata into the data infrastructure of the SMC. Expanding upon the findings presented by Ulbig et al. (2025b), where the concept definition phase identified the lambda architecture as a suitable concept for the data management system, this study proceeds to the system definition phase. This phase serves two primary objectives: first, to evaluate and select suitable technologies for implementing the lambda architecture in accordance with stakeholder specifications and second, to develop a comprehensive and detailed plan to realize the subsequent development of the data management system. To achieve this objective, the system definition process is implemented methodically, in accordance with the methodological framework established in the prior section.
Data infrastructure—concept architecture diagram
As depicted in Figure 5, the data infrastructure consists of three core sub-systems: the data portal, the data pipeline, and the lambda architecture. These elements are independently deployed across separate virtual machines and servers in the IT infrastructure.
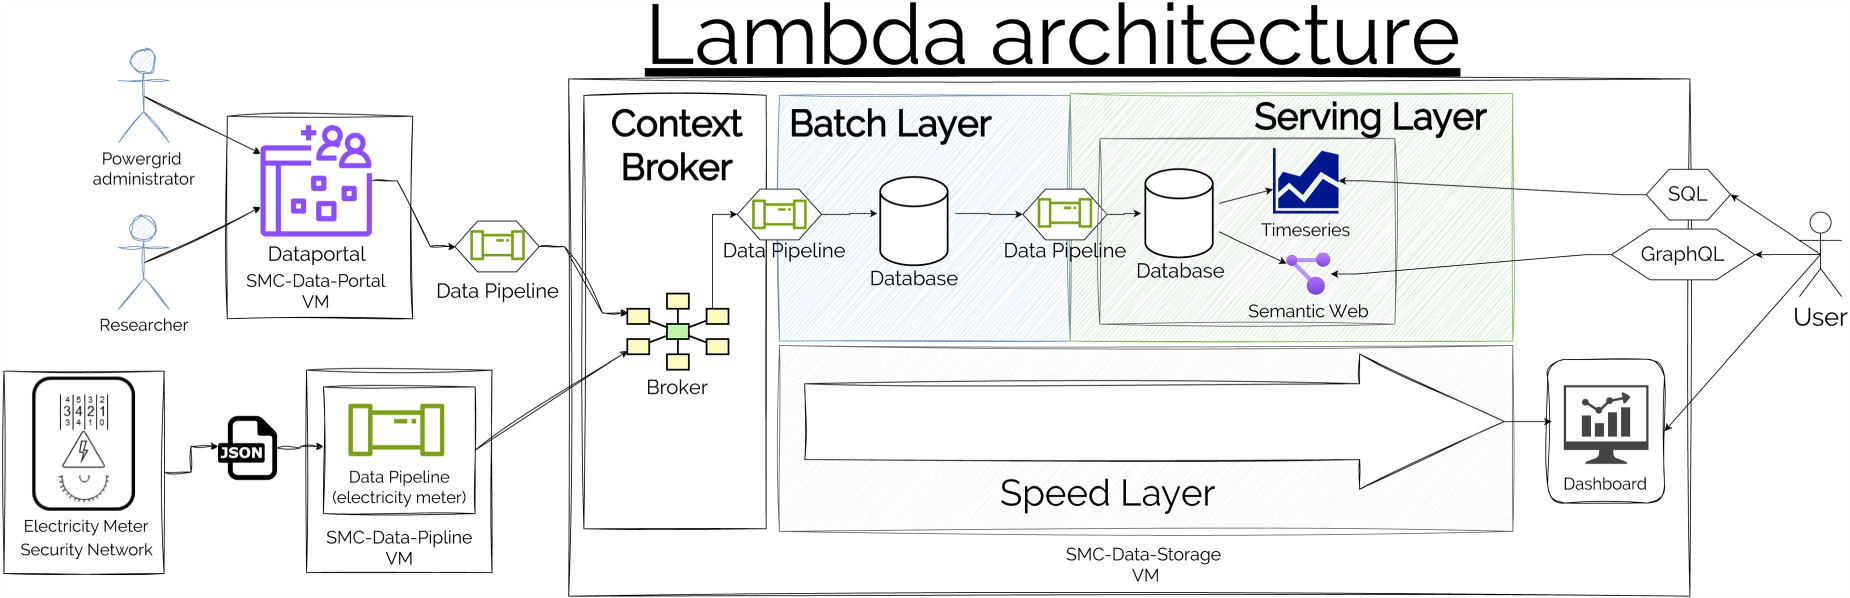
Overview of the first draft of a systems architecture including all subsystems in the data infrastructure which resulted from the concept definition phase.
The data pipeline (electricity meter) is responsible for collecting data from the electricity meters and transmitting it to the lambda architecture. While the pipeline has access to both other systems, the lambda architecture is deliberately restricted from accessing the pipeline to prevent any direct interaction with the electricity meters. The pipeline solution must be capable of retrieving electricity data through a RESTful API (Fra, 2021), parse the returned JSON payload, and transform the structured data into a standardized Smart Data Model specifically, the ThreePhaseACMeasurement schema (Abella, 2025). The processed data is then transmitted to the context broker through a secondary REST API interface.
The proposed data portal functions as a centralized interface enabling power grid administrators and, by extension researchers, to submit metadata corresponding to meter data. Data supplier may input information either through a structured template or by uploading supplementary documents containing relevant details. Additionally, the portal must incorporate an automated pipeline to aggregate submitted metadata, generate Smart Data Models, and transmit both the metadata and associated documentation to the underlying lambda architecture for processing.
The outputs from both pipelines are transmitted to the context broker, from which the data is subsequently forwarded through an additional pipeline to the batch layer. The batch layer incorporates a database designed to store both meter data and associated metadata. This system must support Smart Data Models alongside a range of data formats, including structured, semi-structured, and unstructured data. The foundational sub-system of the serving layer comprises a database designed to support two access paradigms: first, as a conventional time-series dataset, and second, as semantically annotated and connected information. A specialized pipeline will be implemented for the transfer of processed outputs from the batch layer to the serving layer. Furthermore, the speed layer integrates a processing pipeline that enables the real-time transfer of data from the context broker to the dashboard. In summary, the identified sub-systems, each requiring the specification of suitable technologies, include the following:
Data-Pipeline: Electricity Meter Data Portal Data-Pipeline: Data Portal Context Broker (FIWARE) Data-Pipeline: Context Broker Batch Layer: Database Serving Layer: Database Timeseries & Semantic Web Data-Pipeline: Batch Layer Data-Pipeline: Context Broker Dashboard
The technology which is specified for the context broker is FIWARE. This was addressed during the initial phase of concept definition. As a widely adopted framework in smart city and industrial IoT projects, FIWARE benefits from a global ecosystem of developers, researchers, and industry partners. This community-driven support ensures continuous innovation, validation, and best practices, reducing development time and costs while enhancing system robustness. Its architecture comprises three core technologies: the Orion Context Broker, MongoDB (a NoSQL database), and Smart Data Models (FIW, 2023). Orion serves as a context broker, a centralized sub-system designed to receive and distribute data from heterogeneous sources (Bro, 2023). This architecture is particularly advantageous in scenarios involving high-volume, multi-source data streams. Unlike conventional brokers, Orion supports the transmission and management of not only discrete data points but also contextual metadata, including sensor locations or environmental parameters associated with measurements (FIWARE Foundation, 2025). MongoDB, a NoSQL database, underpins FIWARE’s backend infrastructure, providing native support for JSON-based data storage among other formats. Within the FIWARE ecosystem, MongoDB is primarily employed for internal self-administration (Fiw, 2025). FIWARE relies on Smart Data Models (FIWARE Foundation, 2020), which are founded upon the Next Generation Service Interface – Linked Data (NGSI-LD) standard. NGSI-LD, in turn, is built upon JSON for Linked Data (JSON-LD) files (.jsonld), an extension of conventional JSON that introduces the @context keyword to enable semantic linking between JSON-LD documents (Ryte, 2021). This mechanism allows NGSI-LD to define entities within a structured framework, where attributes are categorized as either properties (containing data values) or relationships (describing associations with other entities). Smart Data Models leverage this standardization to ensure interoperable and reusable data representations across domains.
Consistent with the implementation strategy, the objective should be to develop the maximum number of sub-systems using a minimizing technological stack, thereby reducing complexity and improving long-term maintainability. As a result, all data pipelines and database-related decisions will undergo consolidation by the use of one technology for each sub-system. The following sub-systems consequently require formal specification:
Data pipeline Data portal Database Dashboard
The next step after the identification of the subsystems, follows the specification of their respective requirements. All these requirements are technical in nature, with the key performance indicator (KPI) being a binary metric indicating whether each requirement is fulfilled. As most of them are mandatory, each is assigned a prioritization and impact score of 10. Exceptions include a view requirements for the subsystems: database and dashboard as well as an additional table derived from the implementation strategy, which impacts the technological decision across all subsystems.
Data portal
The first subsystem is the data portal with three requirements as can be seen in Table 5. The data portal serves as the primary interface for data providers to add both structured metadata to predefined templates and documentation without an unknown structure. An example is inclusion of digital calibration certificates (DCCs) (Jagieniak, 2024). Those are available in XML-Format but other likely formats are also PDF and JSON. Consequently, the first requirement is the implementation of a graphical user interface (GUI) that enables data providers to upload documents, such as CSV, JSON, and PDFs. The second requirement is the provision of automatic access via a software. This is needed for automatic data transfer from the data portal into the Lambda architecture and transmits data to the context broker to generate Smart Data Models based on predefined templates. Another potential use case involves the automated upload of documents to the data portal through a programming interface. This functionality would enable, for instance, the automatic synchronization of new document versions, such as DCCs. The final requirement is the necessity of the implementation of a role-based access control (RBAC). A mechanism that enables the systematic organization of data access permissions across distinct user groups. Given that multiple stakeholders require both access to and contribution of data, it is imperative to systematically manage data accessibility to ensure proper governance and security.
Data pipeline
As can be seen in Table 6, the proposed data pipeline requirements table comprises all data pipelines, with each requirement having its own specific technical specifications. The first requirement pertains to communication via REST API (Representational State Transfer Application Programming Interface), an architectural style enabling standardized communication over the HTTP protocol (Red Hat, Inc., 2026). This functionality is essential for accessing electricity meters as well as for transferring measurement data and metadata to the FIWARE context broker (Fra, 2021; FIWARE Foundation, 2026b). Furthermore, the pipeline must support the retrieval of data from the FIWARE context broker via REST API. The second requirement involves the capability to transform data into various formats, a necessity for all data pipelines. This transformation typically encompasses filling, modifying, or extracting information across different JSON formats. Another critical requirement is the transfer of data to the database. Given that the database selection remains undetermined, the pipeline must support any type of database connection, most likely involving query languages such as SQL for relational databases. The same adaptability applies to the data repository, as its selection is also pending, necessitating a highly flexible pipeline design.
The final two requirements address document handling: extracting information from structured documents such as CSV and XML for integration into the data portal, and transferring documents between different data repositories.
Database
The database design is governed by a total of nine distinct requirements, as can be seen in Table 7. The first three requirements are about data storage capabilities, mandating support for saving data in all kinds of structures. The first beeing structure data ins the shape of timeseries.
Additionally, the secondary data ingested into the batch layer consists of metadata in JSON format as well as relevant files, such as DCCs, in XML format. Consequently, the database must also support the storage of semi-structured data. Unstructured data which needs to be saved can be instrument manuals or data sheets of electricity meters.
Regarding data access, four requirements are specified. The database must enable individual access to specific documents, semantic access to preserve the logical structure of Smart Data Models, and support data aggregation for statistical computations, such as determining the minimum and maximum values of measurement uncertainties. Access control mechanisms must also be implemented to regulate data access across different user groups.
While individual access and access control are mandatory with scores of ten for both prioritization and impact, the aggregation requirement, though mandatory, receives a prioritization score of 10 but an impact score of 8, as aggregation could alternatively be handled by external scripts.
The semantic integrity of the system is addressed by preserving all information within the Smart Data Models to ensure reproducibility. Although the semantic logic is embedded in these models, future research could explore their conversion to other semantic technologies. Consequently, semantic access capabilities are assigned a prioritization score of 6 and an impact score of 6 in the decision-making process.
The final two requirements focus on storage duration control and high performance. While data must not be deleted, the finite nature of storage capacity necessitates a preference for databases with higher storage limits. Similarly, although electricity meters generate data at 15-second intervals, the database must maintain high performance to efficiently handle the growing volume of data over time. Both requirements receive a prioritization score of 7 and an impact score of 7.
Dashboard
As displayed in Table 8, the first three requirements define the basic functions of the dashboard, focusing on displaying and monitoring timeseries data and metadata from the electricity meter. Attributes such as voltage, current, and frequency are visualized through line charts, while metadata, primarily comprising statistical values, are presented in tabular format. The monitoring functionality occupies a dedicated section of the dashboard, separate from the historical data display.
The subsequent two requirements address the capability to download data and metadata. Although direct download functionality is preferred, the provision of download links represents an acceptable alternative. Consequently, both requirements are assigned a prioritization and impact score of 7. Another requirement concerns the need for intuitive navigation through the data, which naturally arises from the system’s scale of
The final requirement is the implementation of RBAC. RBAC enables the systematic organization of data access permissions by assigning users to predefined roles, each with distinct authorization levels. Given the involvement of multiple stakeholders in both data contribution and consumption, it is imperative to establish a structured framework for managing data accessibility in accordance with organizational policies and security protocols.
Implementation strategy
The following requirements are derived from the implementation strategy and apply uniformly across all sub-system, as displayed in Table 9:
The first requirement mandates that all sub-systems, including data pipelines, databases, dashboards, and other elements, must be containerized.
Containerization encapsulates software code with the minimal operating system (OS) libraries and dependencies required for execution, resulting in lightweight, standalone units known as containers. These containers ensure consistent performance across diverse infrastructures (International Business Machines Corporation , IBM). The selected platform for containerization is Docker, an open-source solution (Docker, Inc., 2025). This requirement is classified as technical, with a binary KPI indicating whether it is fulfilled or not. As a mandatory requirement, it holds the highest prioritization and impact, each scored as 10.
The second requirement addresses the timeliness of the technology, with a particular focus on open-source solutions that may risk deprecation without updates. To mitigate this, the last release of any selected technology must not be older than one year. This operational requirement uses the date of the last release as its KPI, with preference given to technologies featuring later release dates in cases of ties. Both prioritization and impact for this requirement are scored as 7.
The third requirement pertains to the availability of documentation. While assessing documentation quality is inherently subjective, this operational requirement employs a binary KPI to determine fulfillment. Prioritization and impact for this requirement are each scored as 7.
The fourth requirement considers the popularity of the technology, as widely adopted solutions increase the likelihood that new team members will have prior experience with them, thereby facilitating smoother transitions during staff changes. Alternatively this can also interpreted as the popularity of the technology by the already existing staff. This operational requirement measures popularity using Google Trends data over time. Prioritization and impact for this requirement are each scored as 5.
The final requirement stipulates that the technology must be open-source to ensure independence from proprietary vendors. This operational requirement also employs a binary KPI, with prioritization and impact each scored as 5.
Technology—criteria catalog
Following the specification and documentation of all requirements, the subsequent step involves applying these requirements to inform decision-making regarding the individual sub-systems. In this case study, each sub-system has its own criteria catalog. Furthermore, a unified implementation strategy is applied across all sub-systems, with additional sub-system-specific strategies deployed where deemed appropriate.
Criteria catalog—data portal
The pre-selected options for the Data Portal include MinIO, Dropbox, and HDFS:
MinIO is a high-performance, Kubernetes-native, S3-compatible object storage solution designed for deployment across on-premises, private cloud, public cloud, and edge infrastructures, supporting modern application workloads at petabyte scale (MinIO, Inc., 2025). MinIO was selected due to its self-hosting capability and internal network accessibility, complemented by a modern interface.
Dropbox is a cloud-based file storage and sharing platform that enables users to securely store, access, and collaborate on files from any device, integrating with a wide range of tools and offering features like version history, universal search, and advanced security (Dropbox, Inc., 2025b). Dropbox was chosen for its self-hosting support, internal network integration, and widespread adoption as a user-friendly solution.
HDFS (Hadoop Distributed File System) is a highly fault-tolerant, distributed file system designed to run on commodity hardware, providing high-throughput access to large datasets and optimized for batch processing rather than interactive use (Apache Software Foundation, 2025a). HDFS is included based on its established prominence in big data ecosystems.
As illustrated in Table 1, both MinIO and Dropbox satisfy all functional requirements. In contrast, HDFS lacks a native GUI, which would significantly impede usability for data providers (Apache Software Foundation, 2025b). While third-party solutions—such as Hadoop User Experience (HUE) (CESGA, 2025)—could mitigate this limitation, they introduce additional complexity. Given the implementation strategy’s emphasis on minimizing the technology stack, HDFS is excluded from further consideration.
Criteria catalog for the selection of a data portal technology.
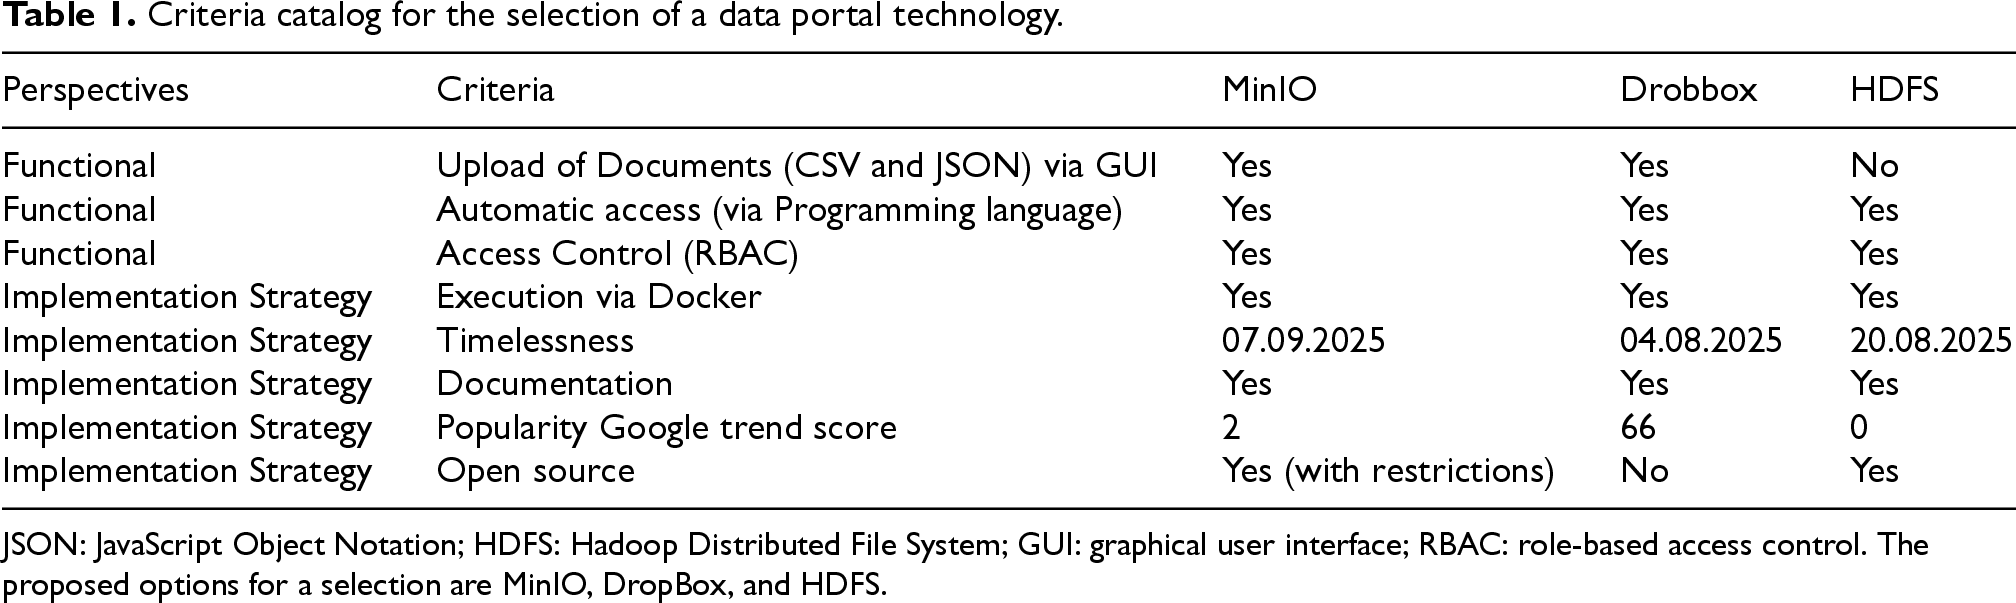
Criteria catalog for the selection of a data portal technology.
JSON: JavaScript Object Notation; HDFS: Hadoop Distributed File System; GUI: graphical user interface; RBAC: role-based access control. The proposed options for a selection are MinIO, DropBox, and HDFS.
Both MinIO and Dropbox fulfill functional requirements in a comparable manner. Regarding the implementation strategy, all criteria are met, with two key distinctions: (1) Dropbox exhibits substantially greater market adoption than MinIO, and (2) Dropbox is not fully open-source (Dropbox, Inc., 2025b), despite its public support for open-source initiatives (Dropbox, Inc., 2025a). This proprietary dependency introduces a potential long-term risk, as licensing or policy changes could arise. For this reason, the selection for the chosen technology is MinIO. Nevertheless, due to the functional equivalence of all three options, an alternative could be readily adopted should requirements evolve.
Several low-code platforms, such as Apache NiFi and Node-RED (Apache Software Foundation, 2025c; JS Foundation et al., 2025), are designed for data integration and processing. However, these platforms often suffer from a limited range of connectors, which may result in compatibility challenges. Consequently, the data pipeline implementation favors programming languages, as they are more likely to support the development of custom adapters. The selected languages for this purpose are Python and Java.
Python is a high-level, interpreted, and general-purpose programming language known for its clear syntax, readability, and extensive standard library. It supports multiple programming paradigms, including procedural, object-oriented, and functional programming, making it widely used for web development, data science, automation, and artificial intelligence (Python Software Foundation, 2025). Python was selected as a candidate due to its extensive adoption in the fields of data science and automation.
Java is a high-level, object-oriented, platform-independent programming language designed for building robust, scalable, and portable applications. It is widely used for enterprise software, Android apps, web development, and large-scale systems due to its ‘‘write once, run anywhere” capability, enabled by the Java Virtual Machine (JVM) (Oracle Corporation, 2025). Similarly, Java was preselected owing to its widespread usage and inherent flexibility.
As illustrated in Table 2, both programming languages satisfy the defined functional and strategic requirements. The primary distinguishing factors are their relative popularity and the extent of their open-source ecosystems. Given that all requirements are met by both languages, the decision favors Python due to its significantly higher adoption and community support.
Criteria catalog for the selection of a data pipeline technology.
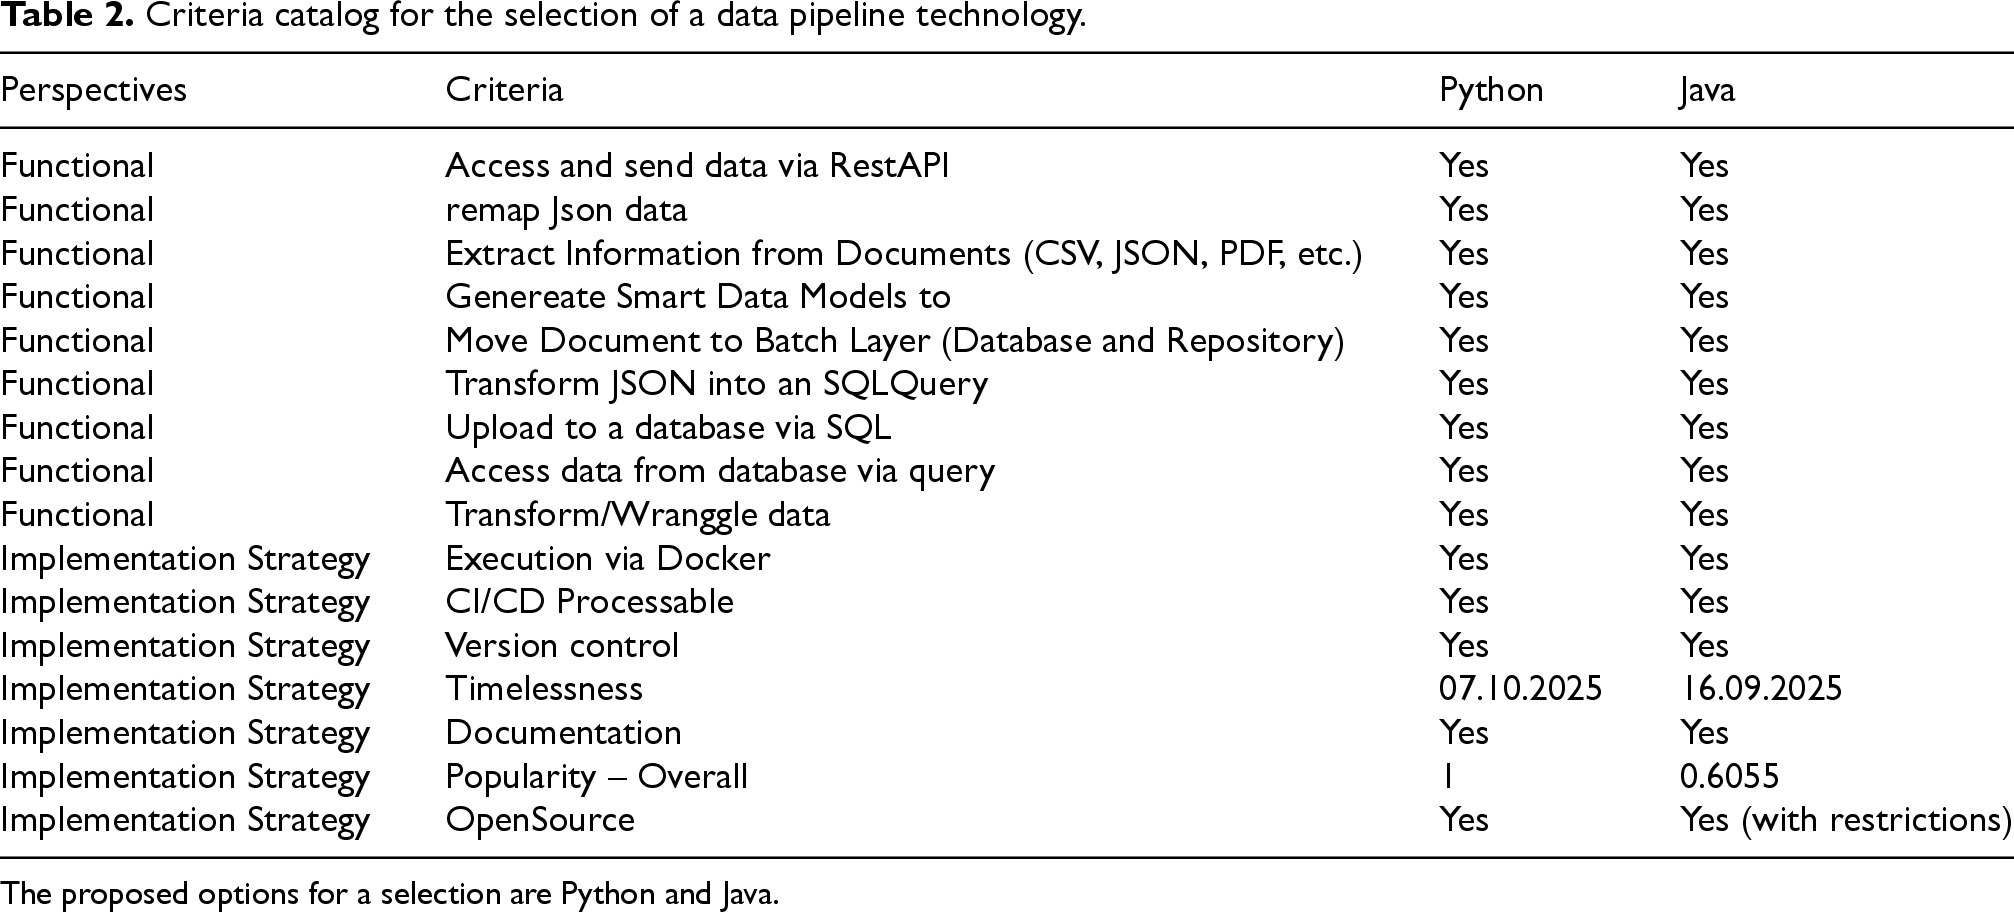
Criteria catalog for the selection of a data pipeline technology.
The proposed options for a selection are Python and Java.
The database technologies under consideration apply to both the batch and serving layers. So far requirements in both cases are the same. If, however, future requirements diverge, a separate evaluation will be necessary. The preselected database technologies include InfluxDB, PostgreSQL, and MongoDB.
InfluxDB is an time-series database (TSDB) optimized for handling high write and query loads on time-stamped data, such as metrics, logs, and events. It is widely used for real-time analytics, monitoring, and IoT applications due to its high performance, scalability, and built-in data retention policies (InfluxData, Inc., 2025b). InfluxDB was chosen due to its specialization in time-series data storage and processing, which aligns with the temporal nature of the datasets under consideration.
PostgreSQL is a powerful, open-source relational database management system (RDBMS) known for its extensibility, SQL compliance, and advanced features such as support for complex queries, JSON, and geospatial data. It is highly regarded for its reliability, robustness, and performance, making it a popular choice for both small and large-scale applications (PostgreSQL Global Development Group, 2025). PostgreSQL was selected for its widespread adoption in big data applications and its schema flexibility, enabling efficient storage of heterogeneous data types.
MongoDB is a leading NoSQL database that uses a flexible, document-oriented data model (JSON-like documents) to store and manage unstructured or semi-structured data. It is renowned for its scalability, high performance, and ease of use, making it ideal for modern applications requiring agility and horizontal scaling (MongoDB, Inc., 2025b). MongoDB was preselected owing to its native support for JSON-based data structures and its integration within the FIWARE ecosystem, both of which are critical for interoperability with existing smart data models.
As illustrated in Table 3, PostgreSQL is the only database system that fully satisfies all specified requirements. While InfluxDB supports parsing JSON into its native Flux data type (InfluxData, Inc., 2025a), it lacks a native JSON data type or alternative mechanisms for storing unstructured data. This limitation also impedes semantic data discovery.
Criteria catalog for the selection of a database technology.
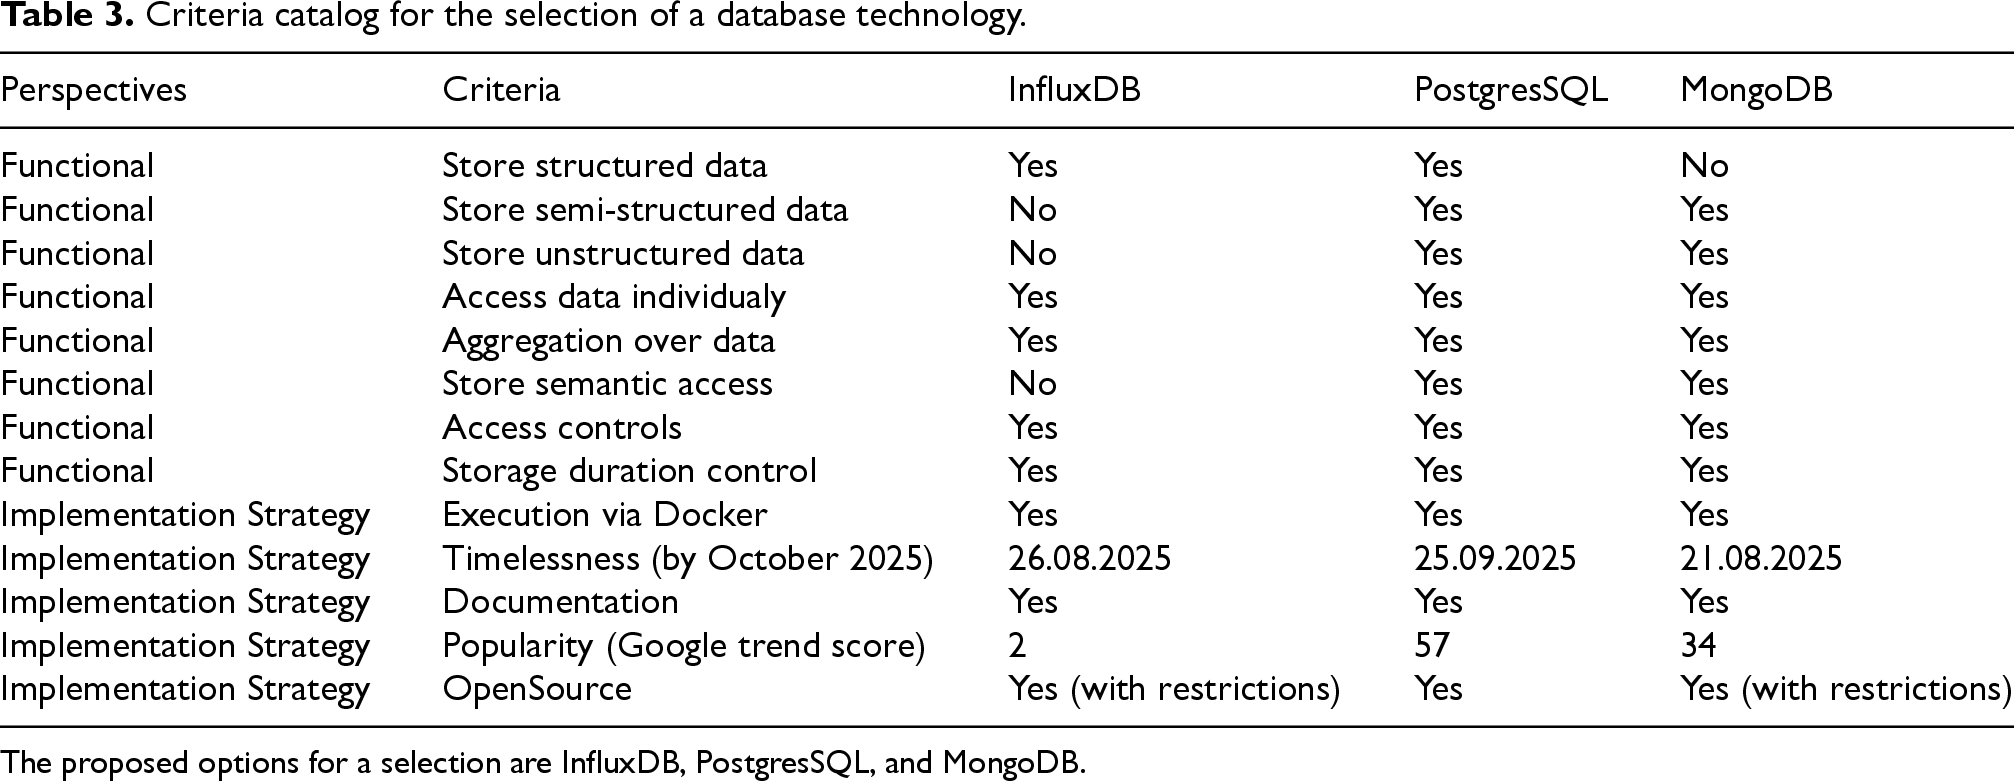
Criteria catalog for the selection of a database technology.
The proposed options for a selection are InfluxDB, PostgresSQL, and MongoDB.
MongoDB, in contrast, stores data in a JSON-like format, which restricts its ability to handle fully structured data or confines such data to semi-structured representations (MongoDB, Inc., 2025a). In summary, PostgreSQL not only meets all functional requirements but also offers the advantages of being open-source without licensing restrictions and the highest adoption rate among the evaluated options Consequently, PostgreSQL has been selected as the database technology for this implementation.
The dashboard serves as the primary user interface of the system, facilitating both data dissemination to end users and interactive exploration of datasets. The technologies selected for dashboard implementation include Grafana, Zabbix, and the native dashboarding capabilities of OpenSearch.
Grafana is an open-source platform for monitoring, visualization, and analytics, widely used to create interactive, customizable dashboards for time-series data, logs, and metrics from various data sources like Prometheus, InfluxDB, and OpenSearch (Grafana Labs, 2025). Selected for its widespread adoption in visualizing and analyzing time-series data.
Zabbix is an open-source, enterprise-grade monitoring solution designed for real-time tracking of networks, servers, applications, and cloud services. It offers advanced alerting, visualization, and reporting features, making it a popular choice for IT infrastructure monitoring and performance management (Zabbix SIA, 2025b). Chosen due to its robust monitoring capabilities, particularly for infrastructure and application performance.
OpenSearch (Dashboard) is an open-source, community-driven suite for search, analytics, and visualization, derived from Elasticsearch and Kibana, offering tools for log analysis, real-time application monitoring, and data exploration. The OpenSearch Dashboard provides a user-friendly interface for visualizing and interacting with data indexed in OpenSearch (OpenSearch Project, 2025). Preferenced for its real-time data monitoring functionality and advanced data exploration features.
As illustrated in Table 4, all evaluated options satisfy the functional requirements, with the sole exception that Zabbix supports only JSON-based data exports (Zabbix SIA, 2025a). Furthermore, all criteria defined by the implementation strategy are fulfilled. The primary distinguishing factor among the candidates is Grafana’s significantly higher adoption rate. Consequently, Grafana is selected as the preferred solution. Should requirements evolve, however, technology could be substituted with minimal effort due to the modularity of the proposed architecture.
Criteria catalog for the selection of a dashboard technology.
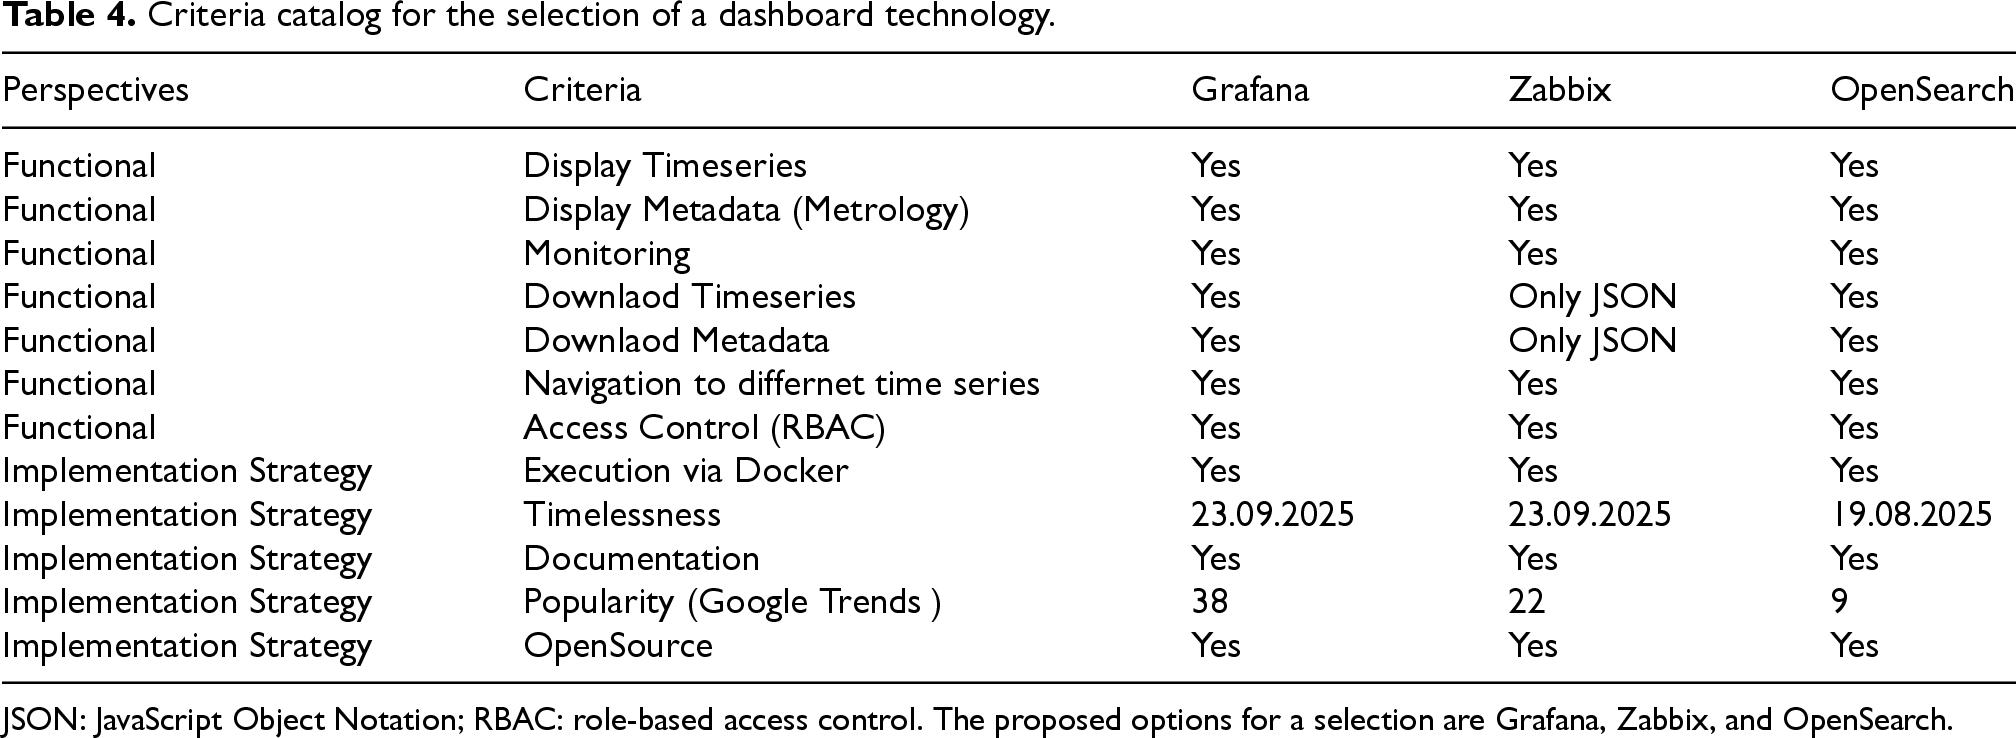
Criteria catalog for the selection of a dashboard technology.
JSON: JavaScript Object Notation; RBAC: role-based access control. The proposed options for a selection are Grafana, Zabbix, and OpenSearch.
In summary, the selected technologies comprise MinIO for the data portal, Python for the data pipeline, PostgreSQL for the database, and Grafana for the dashboard. The subsequent section will elaborate on how these technologies, alongside additional sub-systems, are integrated within the system architecture.
The final architecture, which can be seen in Figure 6, consists of three virtual machines. All sub-systems such as the scripts, databases, dashboards, and so on are containerized. Containerization involves bundling software code alongside the minimal OS libraries and dependencies necessary for execution, resulting in a lightweight, standalone unit, referred to as a container, that ensures consistent performance across diverse infrastructures (International Business Machines Corporation , IBM). The used platform for containerization is called Docker, which is open-source (Docker, Inc., 2025).
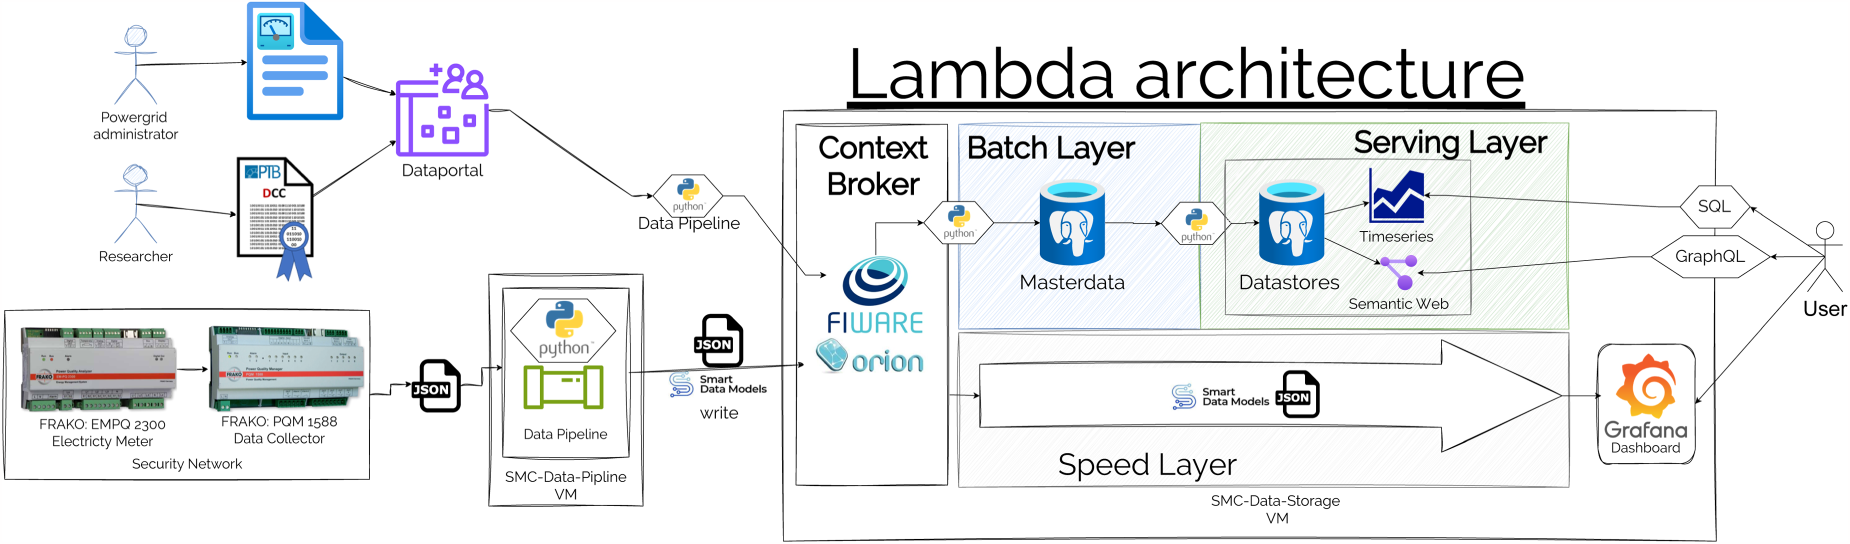
An overview of the systems architecture including all final decisions on the technologies for the data infrastructure sub-systems.
Both, virtual machines and containers are monitored via Checkmk. Checkmk is an open-source platform for real-time monitoring of IT ecosystems, from servers to cloud services, focusing on uptime assurance, performance analysis, and early issue detection (Checkmk GmbH, 2025). It is here manly used to monitor its capacity and for error detection.
Electricity meters are deployed across the campus, with dedicated data collectors aggregating and transmitting measurements from multiple devices. The data pipeline which is implemented as a Python script, periodically polls these collectors at 15-second intervals, retrieves the raw data in JavaScript Object Notation (JSON) format, and transforms it into a Smart Data Model before forwarding it to the FIWARE IoT broker (FIW, 2023).
Metadata ingestion is facilitated through a data portal implemented using MinIO, which serves as the primary interface for user-driven metadata submission. The data portal will allow people to enter metadata into the system. The portal provides a GUI enabling stakeholders, such as grid administrators or researchers, to upload supplementary files, including manuals or DCCs. Users organize submissions within predefined directory structures to ensure systematic data categorization. A time- or event-controlled python script collects this data and transfers the documents into the batch layer into a Postgres database as well as the relevant information to the FIWARE Broker. The extracted metadata is integrated into the Smart Data Model, while the associated documents are persisted in the batch layer for long-term storage and processing. A more elaborate description of the data portal layout and interaction will follow in the design definition subsection.
Over the selected context broker solution, FIWARE, the data from the electricity meters is transmitted over the entity ThreePhaseAcMeasurement and includes the attributes such as id, phaseVoltage, and activePower, alongside a relational property, refDevice, which establishes a reference to the Device entity. The information about the device is transmitted via the information provided in the data portal. An entity device includes distinct attributes such as deviceState and batteryLevel (Abella, 2025; Abella et al., 2025).
Upon ingestion into the FIWARE platform, the data is subsequently transmitted to the batch layer through a dedicated data pipeline. This process leverages FIWARE’s subscription mechanism, which triggers data forwarding to a predefined endpoint whenever a relevant attribute, such as a current measurement, is updated. A script-based collector then retrieves the transmitted data and persists it in the batch layer database. The database in the batch layer is PostgresSQL.
Upon ingestion into the batch layer, the data retains its raw format, thereby preserving all attributes and metadata from the original input. Subsequently, the processed data is transferred from the batch layer to the serving layer. The serving layer’s data store must support multiple access paradigms, enabling retrieval of the data both as a timeseries or relational dataset and as a graph-based structure. To facilitate timeseries data queries, the data collector should be granted SQL-based access to the stored datasets.
Given that data transformation across the batch and serving layers introduces increased latency, the preferred approach involves direct data transfer with subsequent access to the context broker via Grafana. One viable solution is the implementation of the Infinity plugin (Grafana Labs, 2026c). Alternatively, a Python-based middleware script could be deployed to facilitate data transmission.
A dedicated specification document should be provided for each sub-system requiring development or configuration. Under this definition, the scope includes all data pipelines, the data portal, context broker, the databases of both the batch and serving layers, and the dashboard (as illustrated in Figure 7). Additionally, supplementary documentation, such as operational manuals (e.g., for electricity meters), should be provided as well.
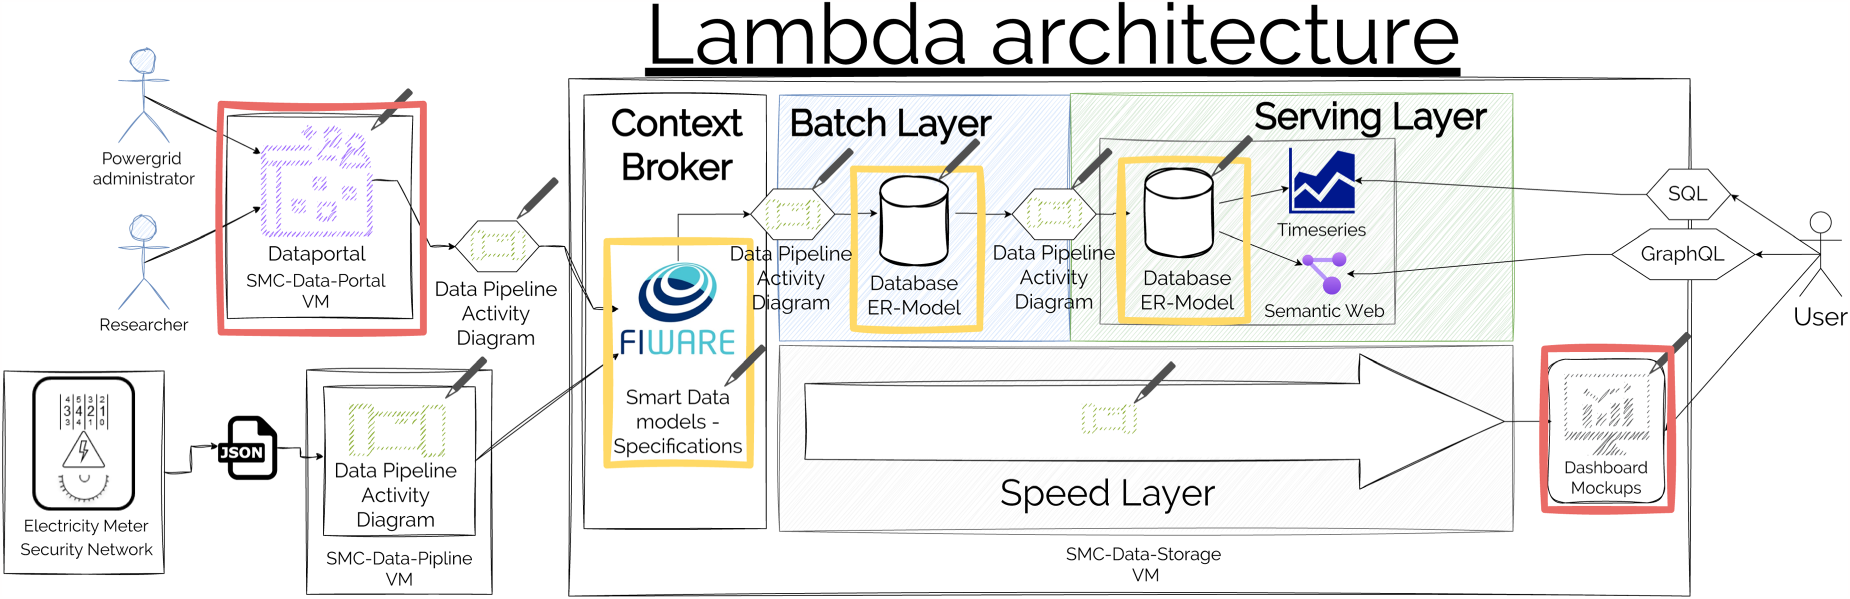
An overview of the architecture and the demands of further specifications. All sub-systems which are marked with a pen are sub-systems which can be specified. The sub-systems with a red or orange frame are discussed in this article. The sub-systems with a red frame will be discussed individually and orange will be discussed combined.
The selected specification format for the data pipelines is activity diagrams, as exemplified by Ulbig et al. (2025b) for the pipeline connecting electricity meters to the context broker. Given that all data pipelines follow the extract-transform-load (ETL) paradigm, further diagrams would be redundant with the provided example and are left out from this discussion. The remaining sub-systems to be specified include the data portal, context broker, databases, and dashboard. The specification for the data portal will take the form of a diagram illustrating the various methods by which data can be uploaded.
The data model for the context broker and associated databases will be visualized using an entity-relationship (ER) model, a standard representation for database schemas. A unified ER model will consolidate the database structures of all three components, namely, the context broker, the batch layer, and the serving layer. Given that the batch-layer database mirrors the context broker’s data model and the serving layer functions as a partitioned subset of the batch-layer database, this consolidation ensures logical and structural coherence.
The final sub-system requiring specification is the dashboard. The corresponding specification will be presented in the form of mockups, which define both the data visualization approach of the data and the navigational structure to navigate through the dataset.
The function of data portal is to allow users, such as power grid administrators or researchers, to integrate metadata and documents to the system. As depicted in Figure 8, the data portal operates on its dedicated server and comprises two core layers: the document layer and the template layer. Additionally, data pipelines facilitate a data transfer from the document layer to the template layer, as well as from the data portal to both the batch layer and the context broker. Ideally, metadata integration would occur through standardized documents that are automatically processed by the system. However, in practice, metadata is frequently unstructured, non-standardized, or non-machine-readable, rendering full automation impractical. To address this challenge, the proposed solution employs human- and machine-readable CSV templates, which serve as direct representations of the corresponding Smart Data Models. In this framework, two primary templates are utilized: Device and D-SI_Metadata.
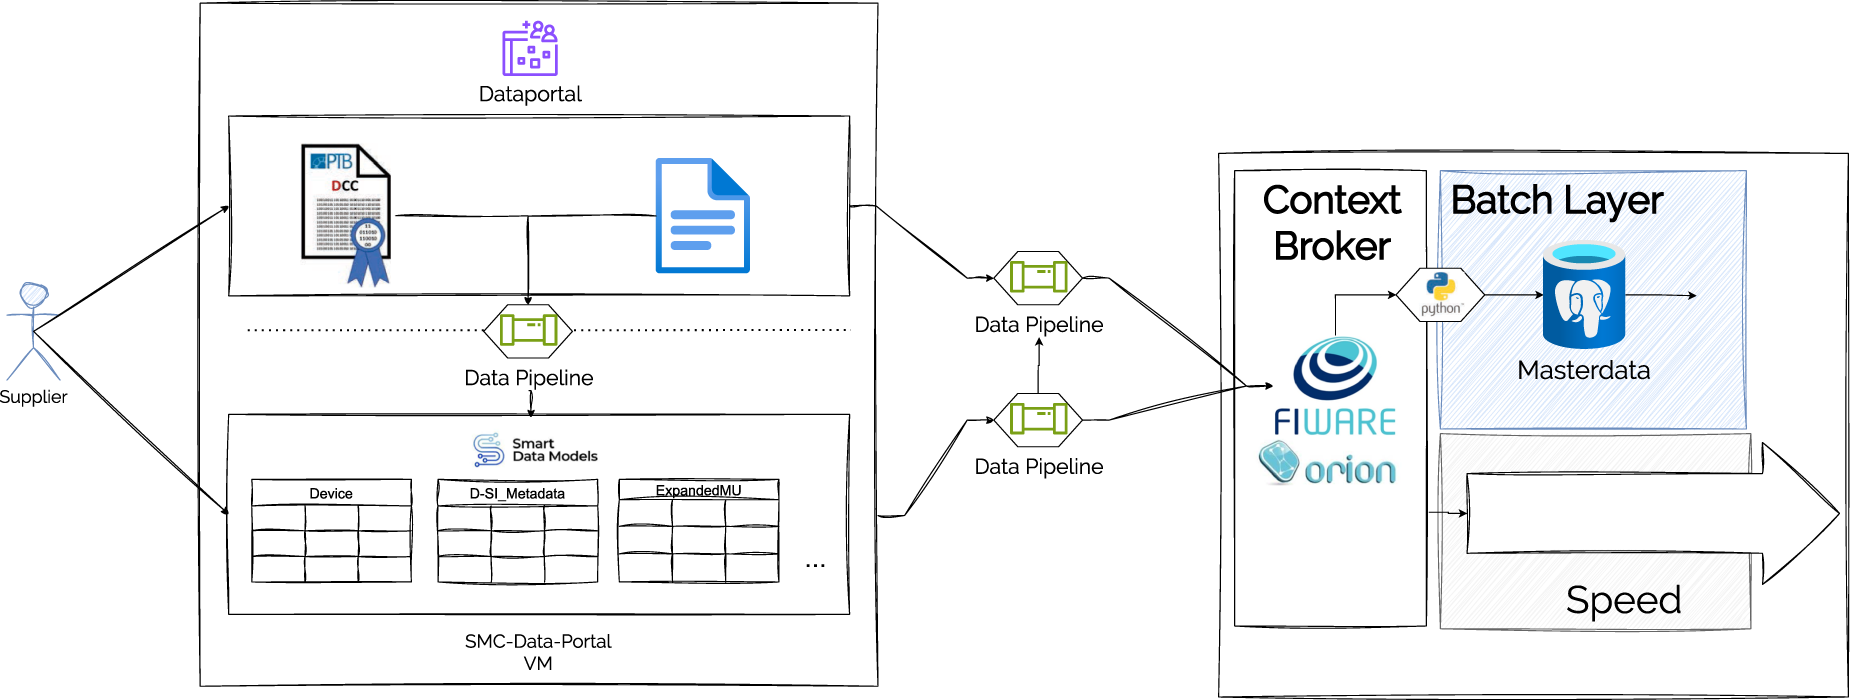
The structure of the data portal including the data flow inside and to the lambda architecture.
Despite the emphasis on templates, the system must also accommodate manual document uploads. The document layer is organized into individual, device-specific folders, which remain separate from the template layer. Two distinct scenarios govern document integration:
Unprocessed documents are uploaded directly, such as user manuales, for example, which are retained for transparency and traceability. Processed documents are those requiring structured extraction and transformation, including digital calibration certificates or certificates of conformity. In smart city power grids, such documents are frequently updated during meter integration or routine maintenance. A dedicated data pipeline automatically extracts relevant information, transforms it into the required format, and inserts it as a new entry into the corresponding templates, triggering further data transfer into the database of the batch layer.
The processed data is subsequently transferred into the Lambda Architecture via a data pipeline. This pipeline extracts data from the CSV templates, transforms it into a Smart Data Model, and uploads it to the FIWARE context broker. The resulting update in the context broker triggers a further transfer of data into the batch layer’s database. Documents themselves are also uploaded to the batch layer, where the data pipeline duplicates them and updates the document entity in the context broker. This ensures that documents remain referenceable via their associated device entities, maintaining data integrity and traceability throughout the system.
The database model for the context broker, batch layer, and serving layer is fundamentally based upon the Smart Data Models provided by FIWARE. The utilized models include ThreePhaseACMeasurement and Device, with the entire data model extended by the entities Documents, D-SI_Metadata, and ExpandedMU, as illustrated in Figure 9.
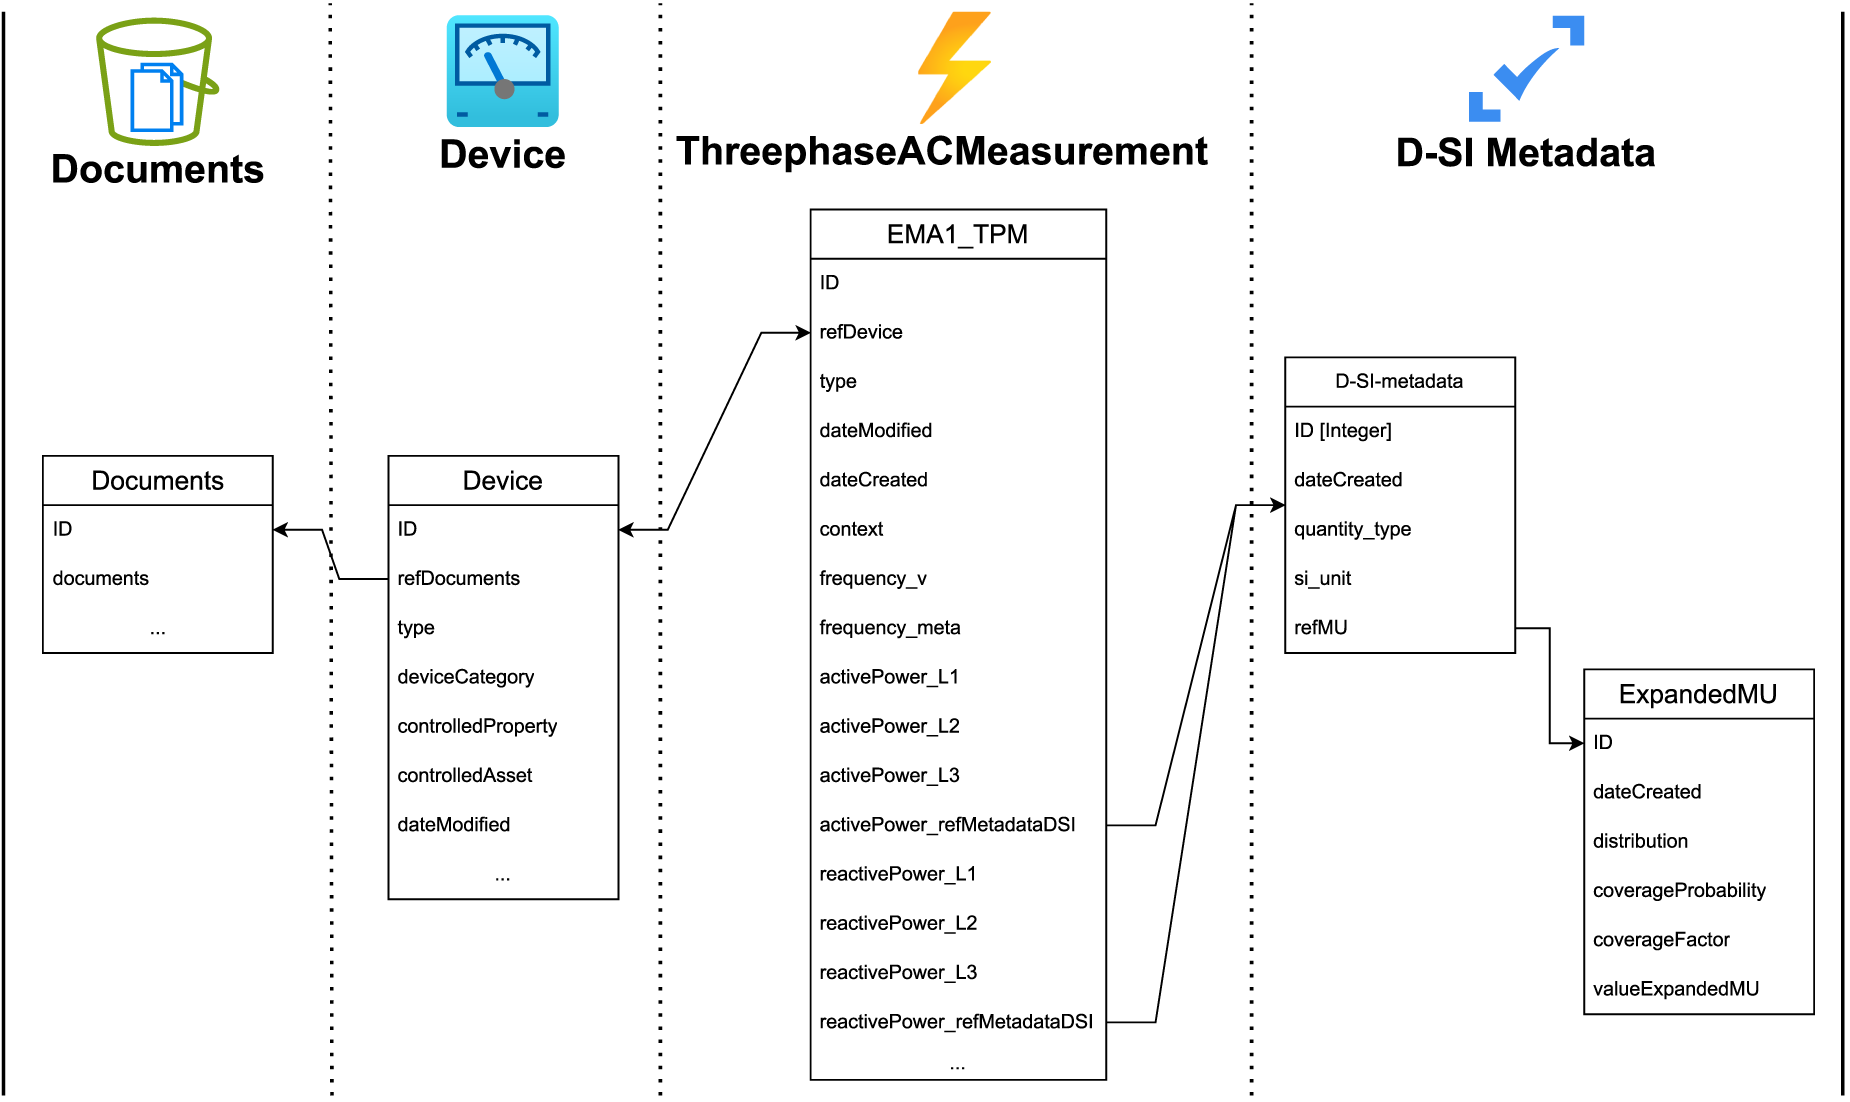
The entity relationship model of the data model through the lambda architecture including the context broker and database. The model is inspired the smart data models ThreePhaseAcMeasurement and Device (Abella, 2025; Abella et al., 2025).
The most extensive data model is ThreePhaseACMeasurement, which characterizes electrical measurements from systems employing three-phase alternating current (Abella, 2025). The attributes retained from the original Smart Data Model include: active power, reactive power, apparent power, power factor, displacement power factor, current, phase voltage, phase-to-phase voltage, THD voltage, and THD current. Each of these attributes is divided into three values, one for each phase. Additionally, the model incorporates the frequency attribute, as well as the aggregated values for active power, reactive power, apparent power, power factor, and displacement power factor across all three phases. The metadata, which is mandatory, includes the attributes identification (id), date of modification (dateModified), date of creation (dateCreated), and reference of the device (refDevice), the latter of which links the measurement data to a corresponding Device entity. The database model retains all these attributes while extending each measurement attribute with a reference to its associated metadata entity, for example, activePower_refMetadataDSI.
The Device Smart Data Model, in addition to mandatory attributes, includes descriptive properties such as category of the device (deviceCategory), the property which is controlled (controlledProperty), the asset which is controlled (controlledAsset), and the owner. It also encompasses several temporal attributes, including the date of modification (dateModified), creation (dateCreated), installation (dateInstalled), first usage (dateFirstUsed), last calibration (dateLastCalibration), date when the last value was reported (dateLastValueReported), and the date of the last observation (dateObserved).
The Documents Smart Data Model is an entirely new addition, comprising an id and a document attribute. The latter contains the actual document data, as PostgreSQL offers large object data types, enabling the database to store data that typically cannot be accommodated within a standard SQL table (PostgreSQL Global Development Group, 2001). In the event of limitations, an alternative approach would be to store the data in an external repository while saving only a reference in the database.
The two additional new data models are D-SI-metadata and ExpandedMU. The D-SI-metadata model, in addition to mandatory attributes, includes a machine readable unit of measurement in the SI System of units (si_unit) and an information on the measured quantity (quantity_type), and the reference to the measurement uncertainty statement (refMU). An SI unit is a coherent unit of measurement within the International System of Units (SI), a globally standardized system designed for universal application in science, technology, trade, and societal domains (International Bureau of Weights and Measures , BIPM). This approach ensures consistency, traceability, and alignment with the current understanding of natural laws, replacing the prior framework based on seven base units. The benefit of adopting SI units in this context is to maintain international comparability and reusability of the data. A kind of quantity is a categorical classification shared by mutually comparable quantities, which, though partially conventional, groups quantities with analogous characteristics (e.g., length for diameter, circumference, and wavelength; energy for heat, kinetic energy, and potential energy) (JCGM, 2012).
The proposed dashboard is designed to serve two primary user groups: power grid operators, who utilize it as a real-time monitoring tool to detect anomalies such as consumption peaks or power grid errors, and researchers, who employ it as a data portal to download and validate data for their investigations.
To accommodate these distinct use cases, the dashboard is divided into two main sections: a navigation interface and a data overview. The navigation section provides a comprehensive listing of all meters, enabling users to filter by building and network before selecting the desired meter for further analysis.
The data overview section subsequently displays, as visualized in Figure 10, all 10 measurements from the ThreePhaseACMeasurement smart data model, including active power (
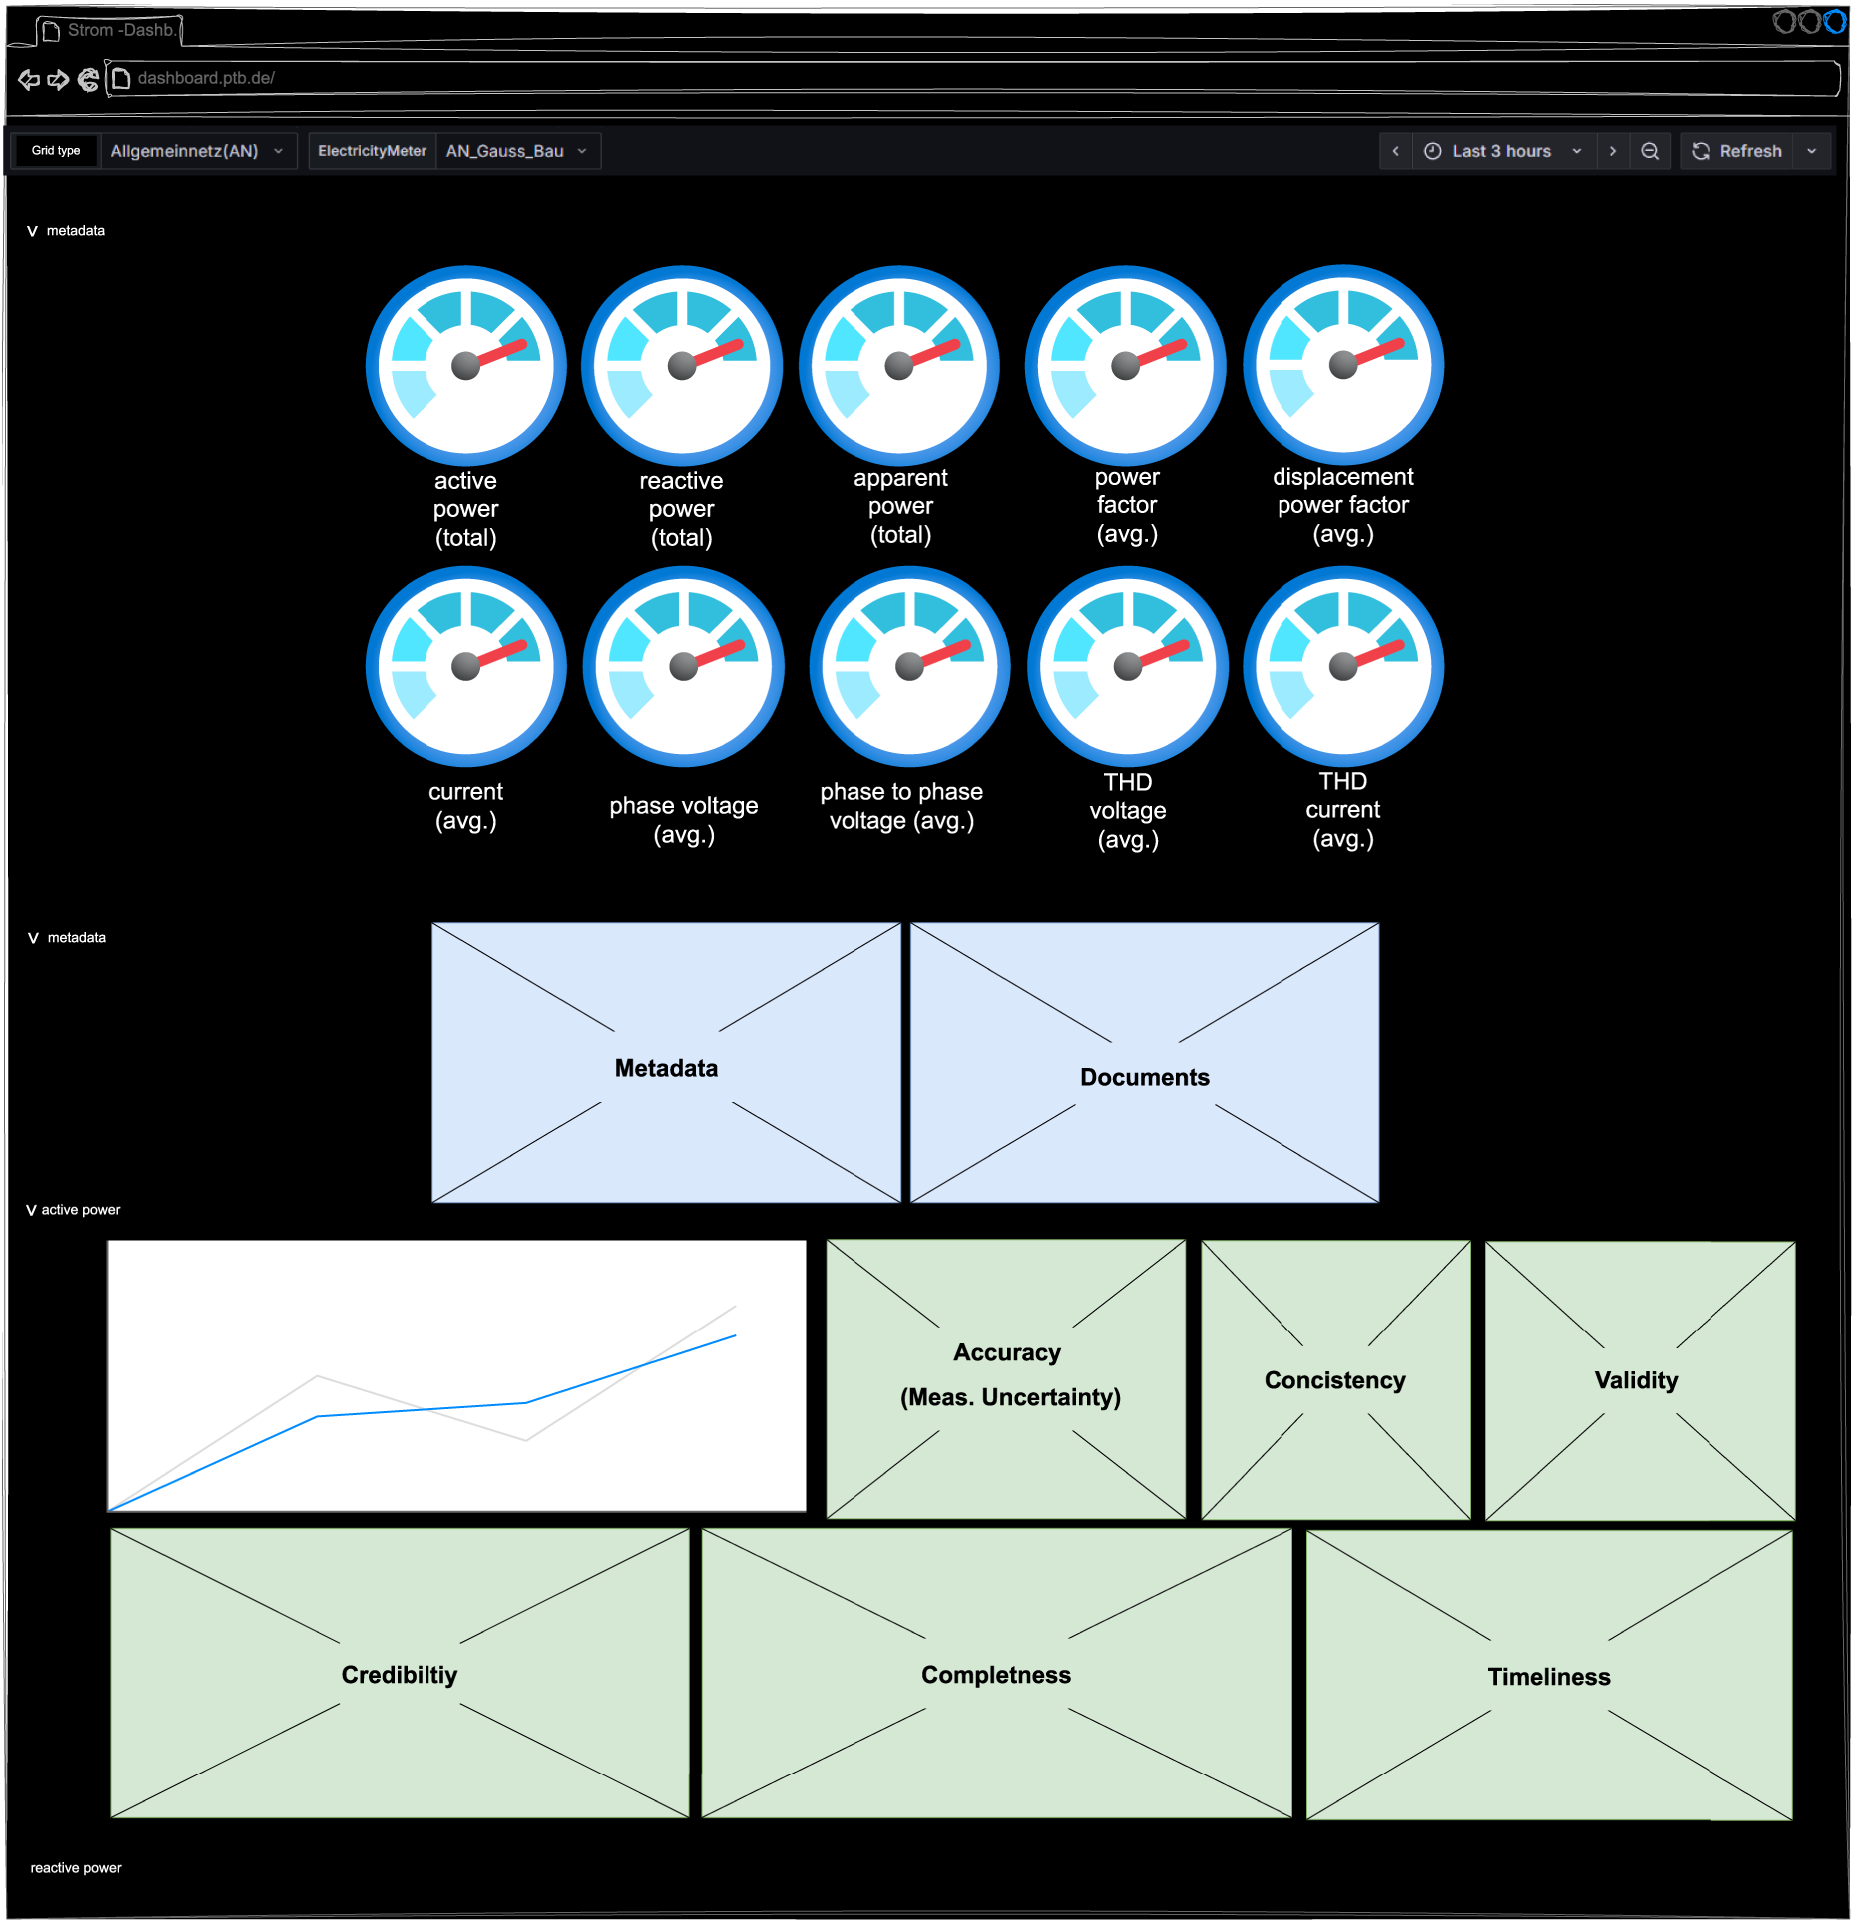
Mockup of the energy dashboard which will be realized in Grafana. The dashboard is structured, from top to bottom into live view, metadata, and a historic view for each meter attribute including all data quality dimensions.
Grafana dashboards are organized into rows, each capable of containing multiple visualization panels (Grafana Labs, 2026a). The dashboard is structured into 12 rows, including a live view, a metadata view, and dedicated data views for each attribute. The first row presents live values, representing real-time measurements streamed directly via the FIWARE context broker, with all relevant attributes visualized using the Grafana gauge panel (Grafana Labs, 2026b).
The metadata and documents display is organized into two panels. The left panel presents the metadata, showing all values associated with the entity’s device. As illustrated in Figure 11, this panel offers a consolidated overview of all information contained within the device entity. In cases where multiple device references exist within the dataset, the corresponding values are displayed as an array. The right panel contains the document references included in the dataset, structured as a table with columns for the upload date, document type (including version), and a link to the document itself. This layout ensures transparent access to all foundational information about the electricity meter, serving as a resource for further investigation in the event of anomalous dataset behavior.
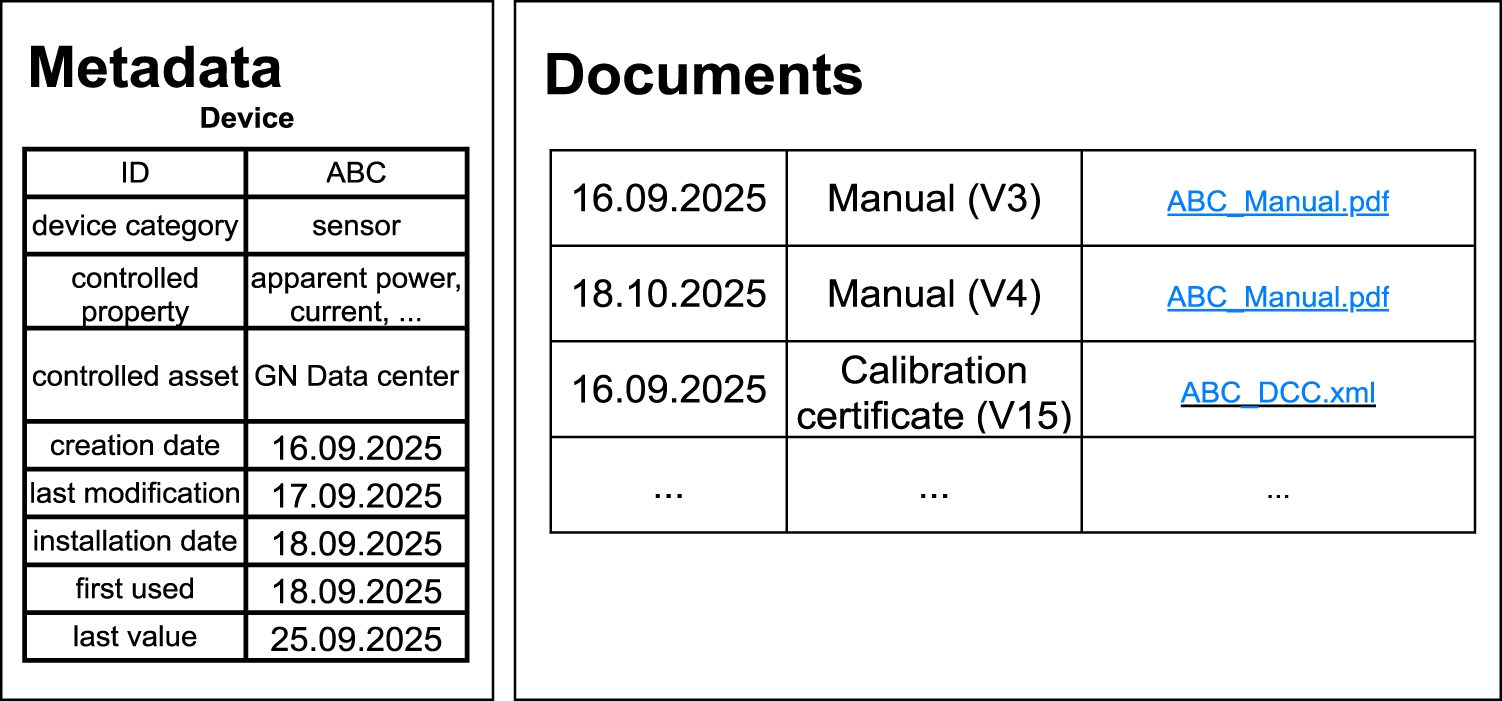
Mockup of the metadata and document panel including, on the left, a panel showing all relevant information from the device and on the right all connected documents.
This is followed by a detailed metadata section, with one row dedicated to each attribute. Each row features a panel with a line graph representing the attribute’s data, accompanied by six additional panels—one for each of the DQ dimensions outlined in Section 3. The implementation of each DQ dimension as a panel will be described in the following paragraphs. The accuracy (Meas. uncertainty) panel consolidates all information pertaining to the accuracy of the measurement (Figure 12). A typical application for researchers involves evaluating the data to ensure the validity of their findings. For instance, when assessing active power consumption in a power grid over a month, the uncertainty of the calculations must be incorporated to validate the analysis. If the uncertainty proves excessive for the intended analysis, the panel enables users to identify the underlying causes. To ensure transparency, the panel includes all static uncertainty-relevant information, such as the uncertainty class of the electricity meter, calibration certificates, and the resulting measurement uncertainties derived in accordance with the GUM. Additionally, dynamic factors influencing uncertainty can be incorporated, including, as discussed in Section 3, temperature variations, voltage jumps, frequency jumps, andTHDs.
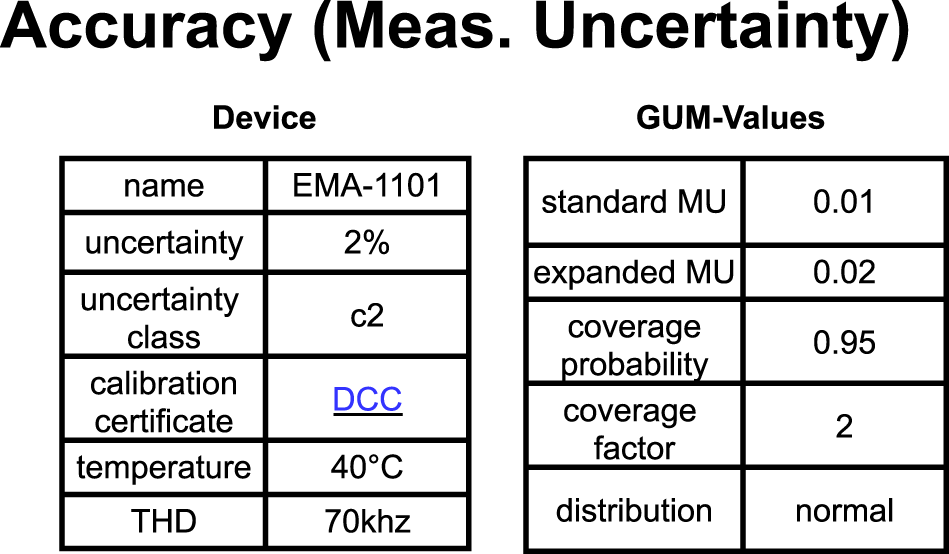
Mockup of the measurement uncertainty panel showing on the left relevant information related to the uncertainty and on the right all relevant information related to guide to the expression of uncertainty in measurement (GUM).
The consistency panel presents the degree of consistency of the data, as defined by the logical rules of the respective attributes. Unlike the other panels, the consistency panel is attribute-specific, as detailed in the Data quality section. As illustrated in Figure 13, each rule is represented through two distinct elements. The upper element displays the average difference of the consistency for the respective rule. The lower element provides a list of all inconsistencies identified within the selected dataset. In this context, researchers can assess whether the anomalous behavior of the data originates from attribute inconsistencies, thereby enabling adjustments to the analysis, contact with the data owner, or further investigation into potential sources of inconsistencies, such as damaged or malfunctioning electricity meters.
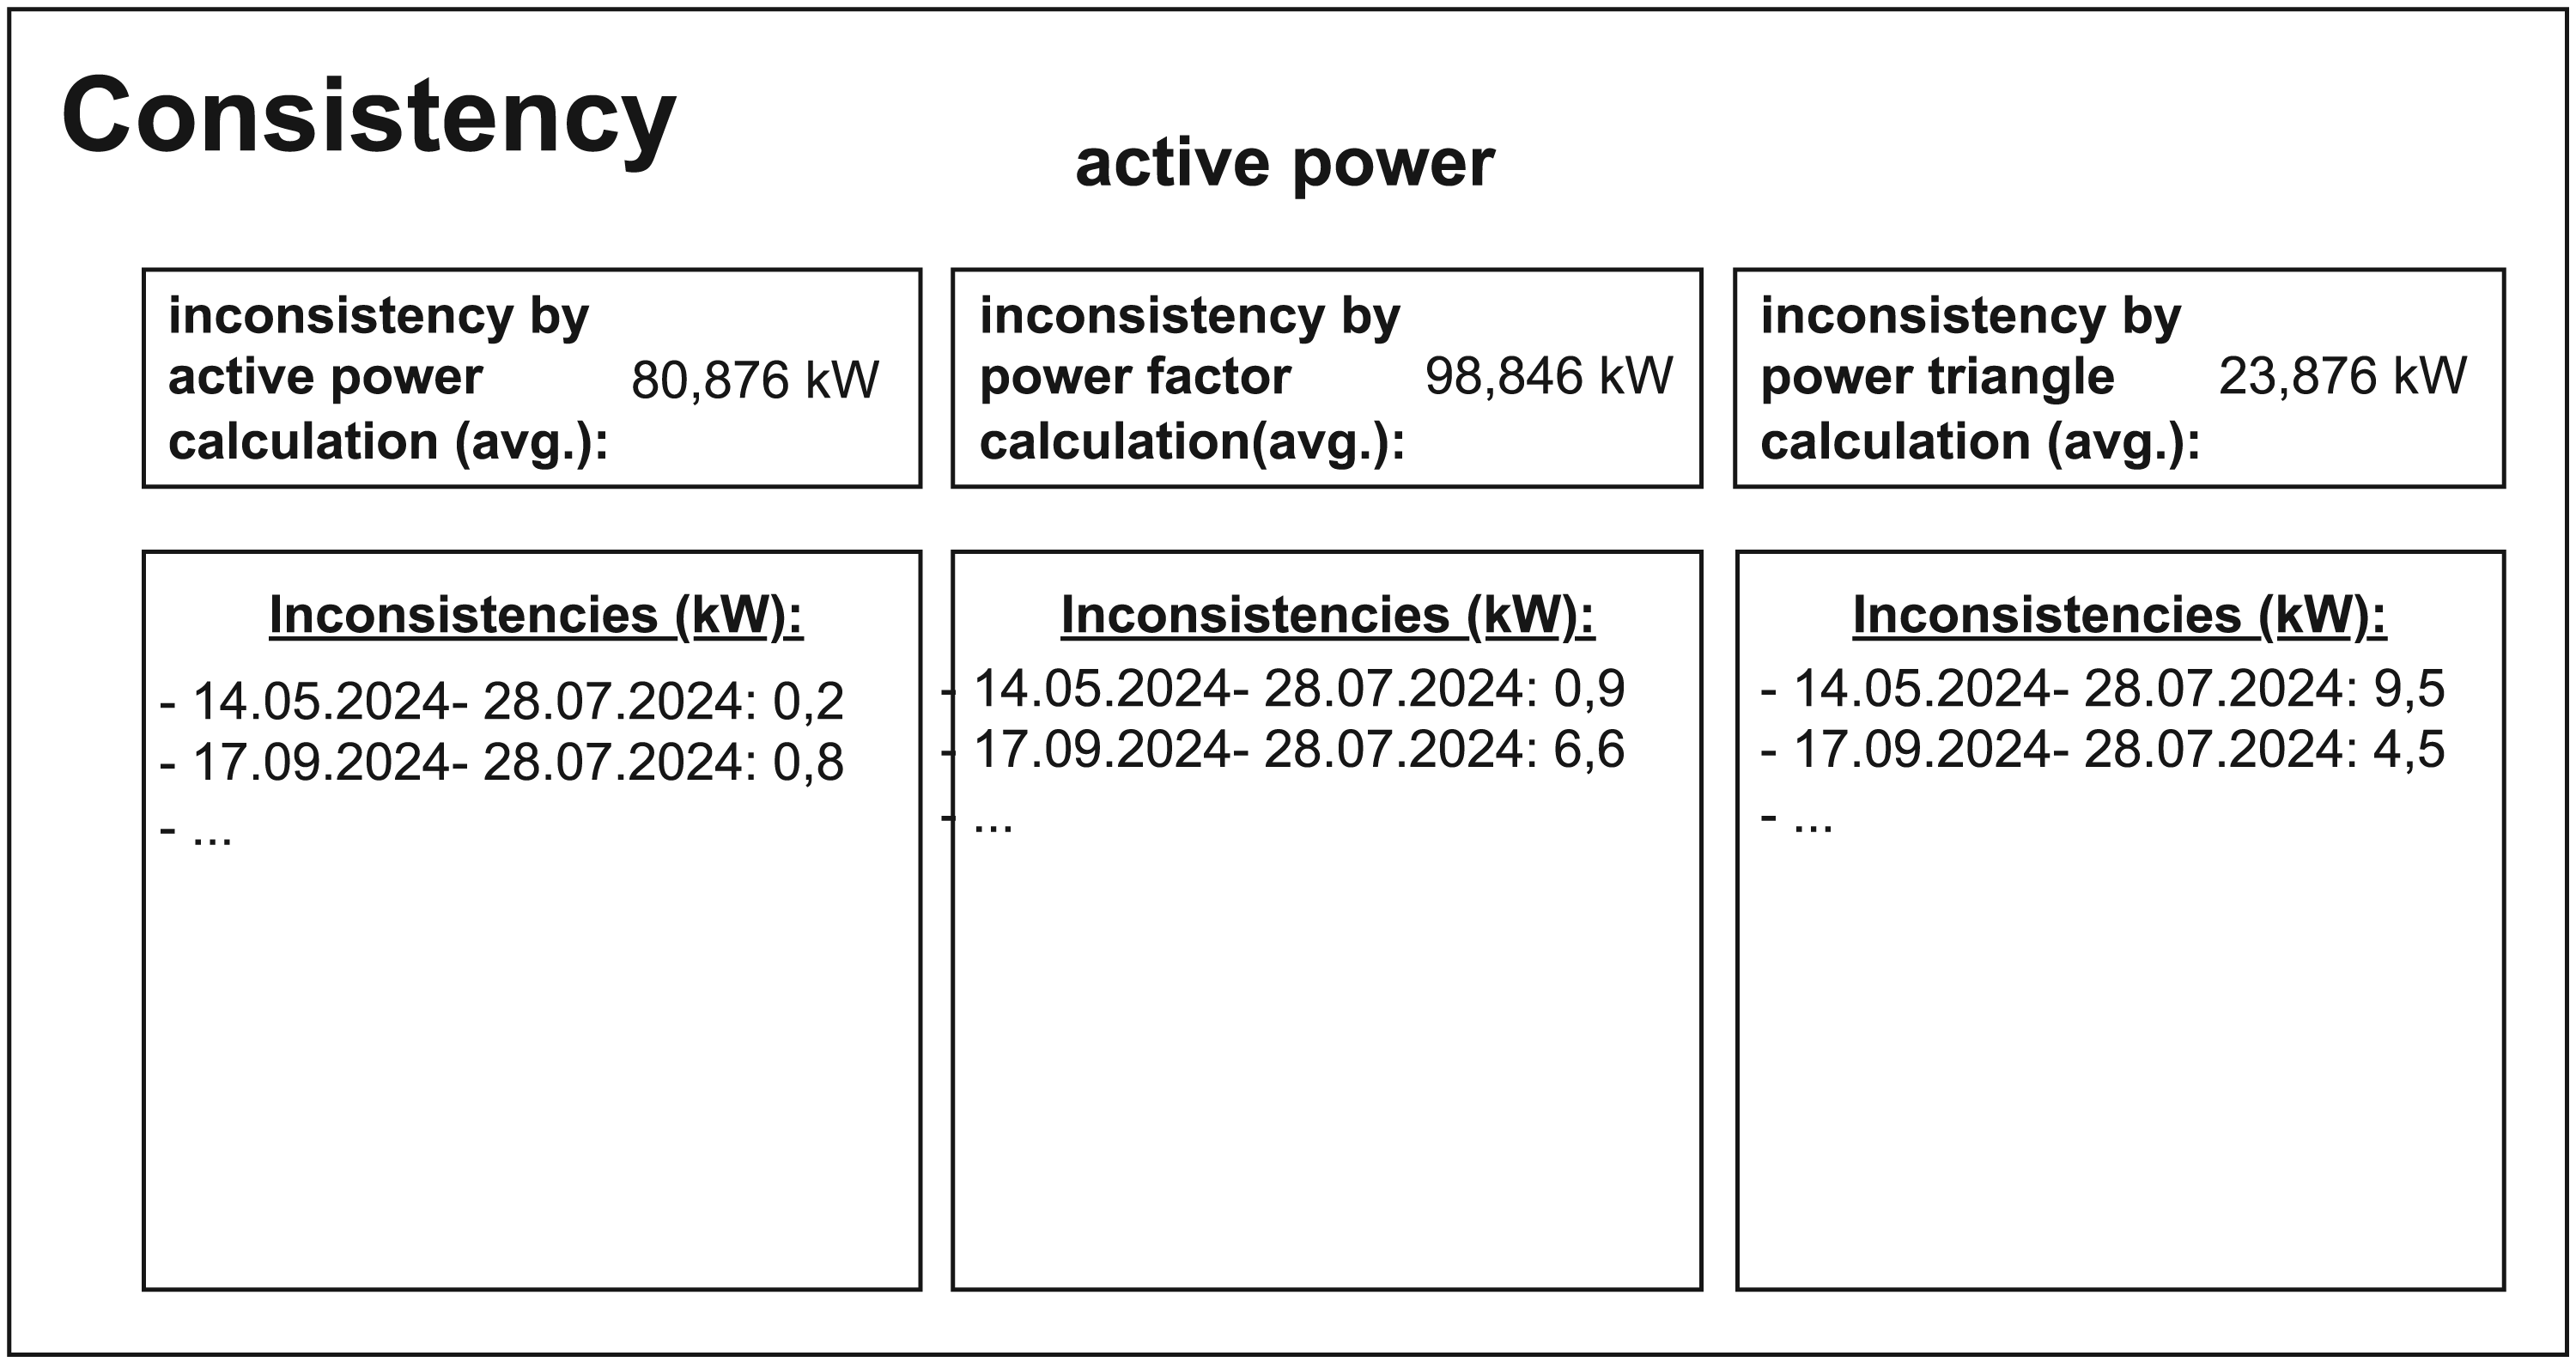
Mockup of the consistency panel, here for active power, showing the consistency based on the calculation by the normal active power formular, power factor formular and on the power triangle formular.
The validity panel displays the degree of validity for the entire dataset while identifying any instances of invalid data. As illustrated in Figure 14, the validity panel is divided into two distinct sections. The left section presents the calculated validity of the selected measurement data, including the unit, quantity kind, measurement range, and its contextual definition. These parameters may be defined statically or determined dynamically using the median of the dataset.
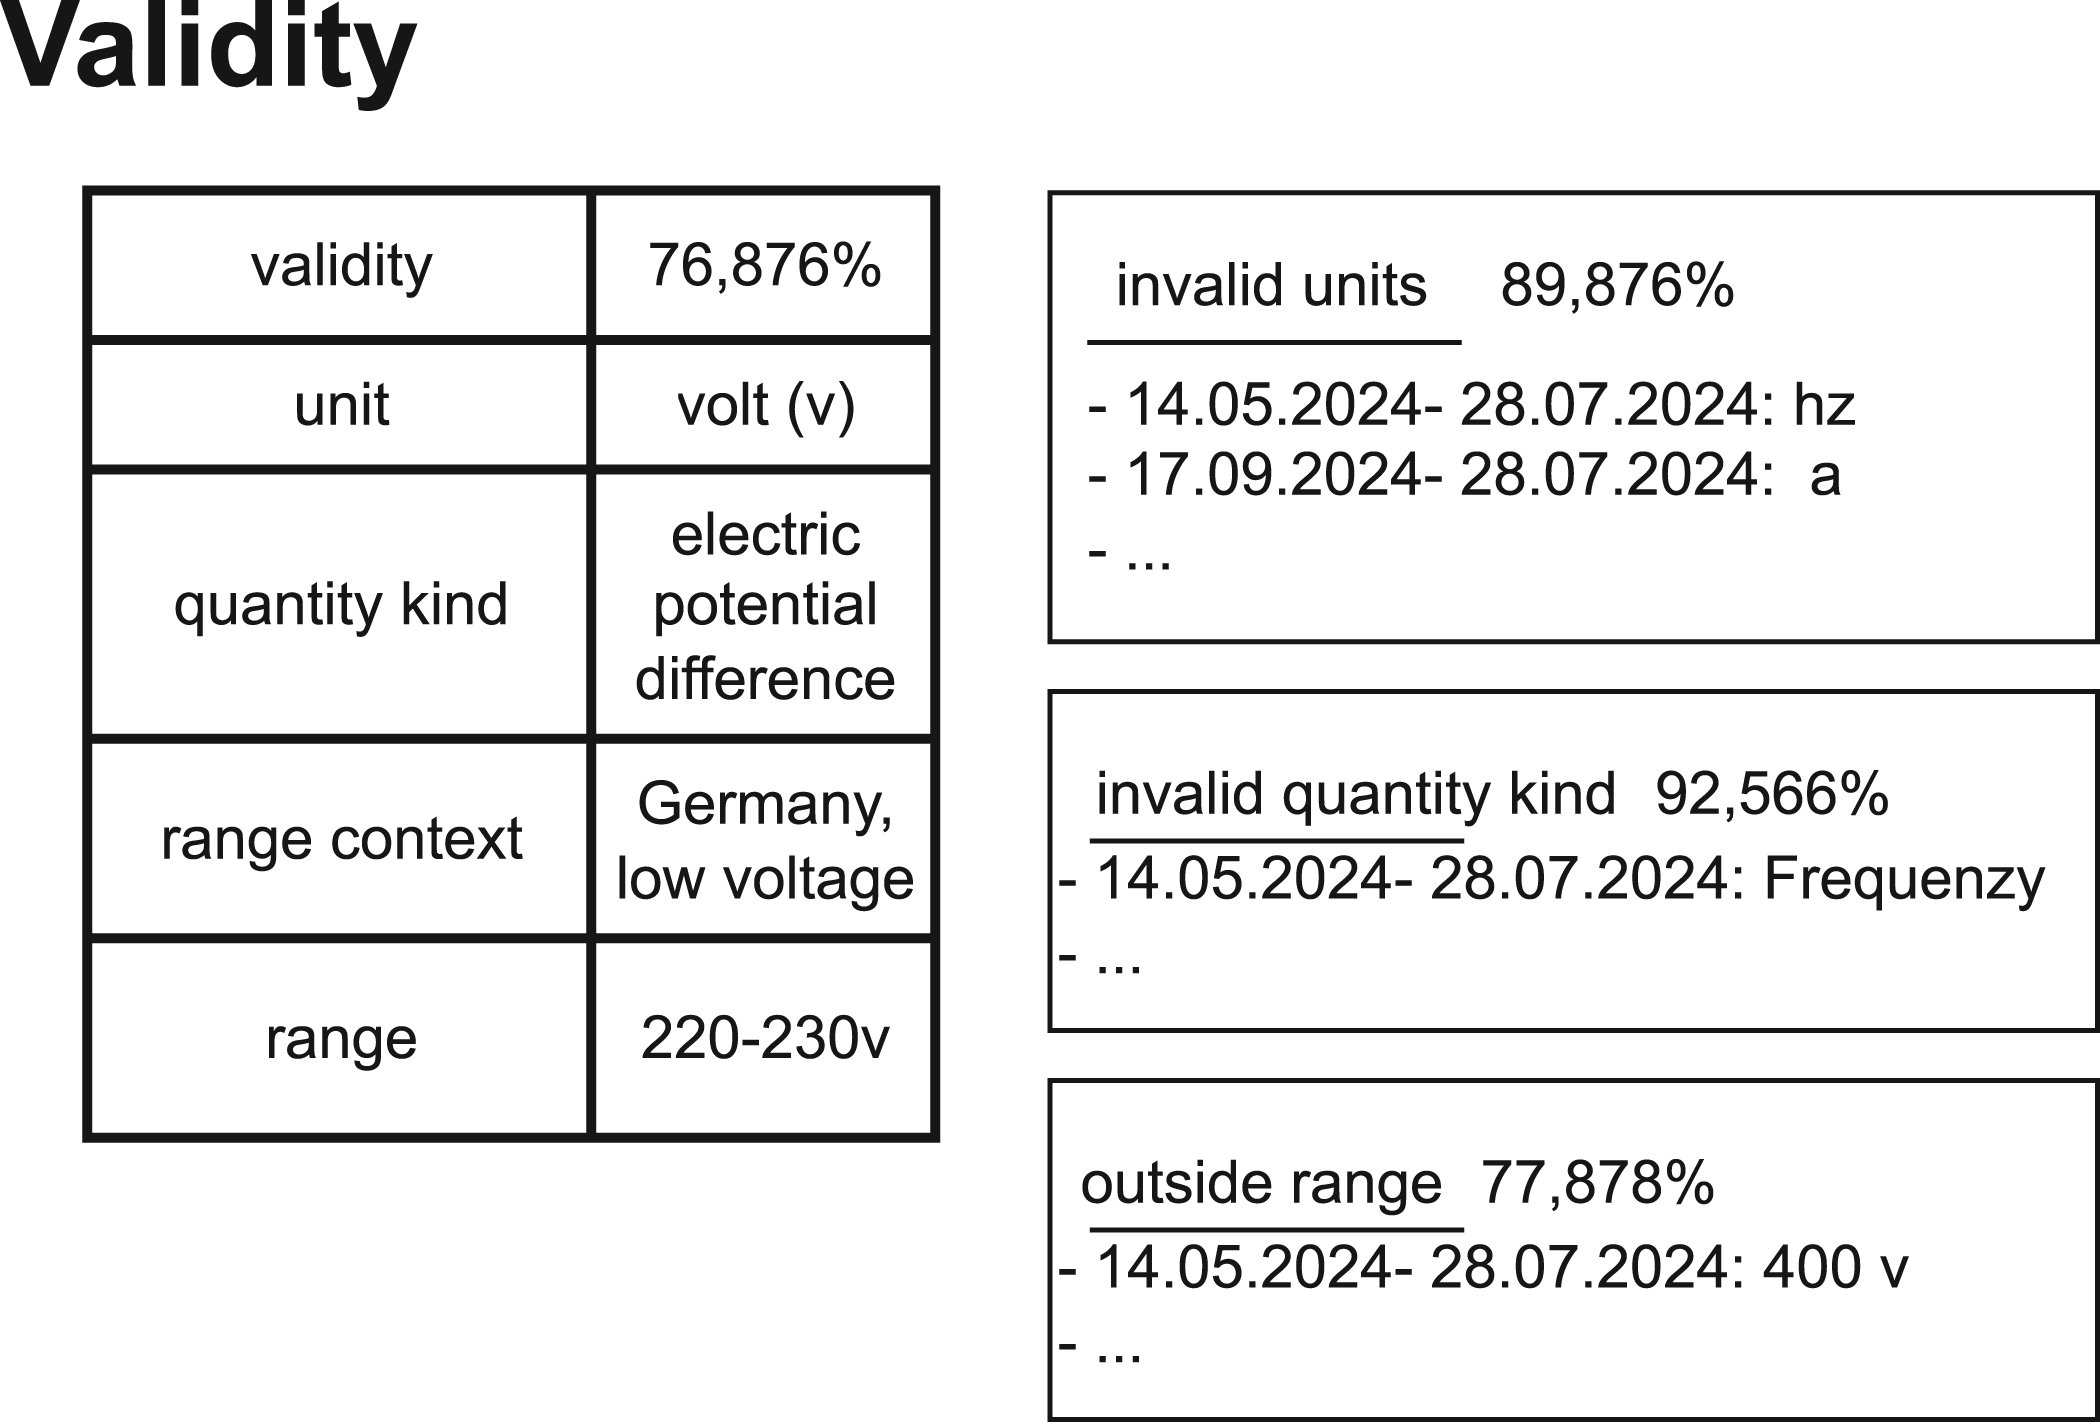
Mockup of the validity panel showing on the left showing the true context of the measurement, and on the right a list of all inconsistencies.
The right section comprises three elements, each displaying the percentage of invalid entries alongside a list of all invalid instances, including their respective timestamps. From top to bottom, these elements represent invalid units, invalid quantity kinds, and out-of-range values. In this context, the validity assessment may be employed to investigate anomalous data behavior. This functionality enables researchers to verify the validity of all data, exclude invalid entries, or contact the responsible data owner to address potential issues. The panel dedicated to displaying the credibility of the data is divided into three columns, representing measurements, metadata, and documents, respectively, as illustrated in Figure 15. Each of these columns is further subdivided into two distinct elements. As discussed in the data quality section, the credibility of the data is inherently linked to the responsibility for that data. The upper element of each column explicitly identifies the responsible party, namely the data owner. The lower element functions as a change log, documenting modifications and their respective authors. This design enables researchers to trace the origin of anomalous information, identifying both the responsible party and whether the data has been modified by an unusual source.
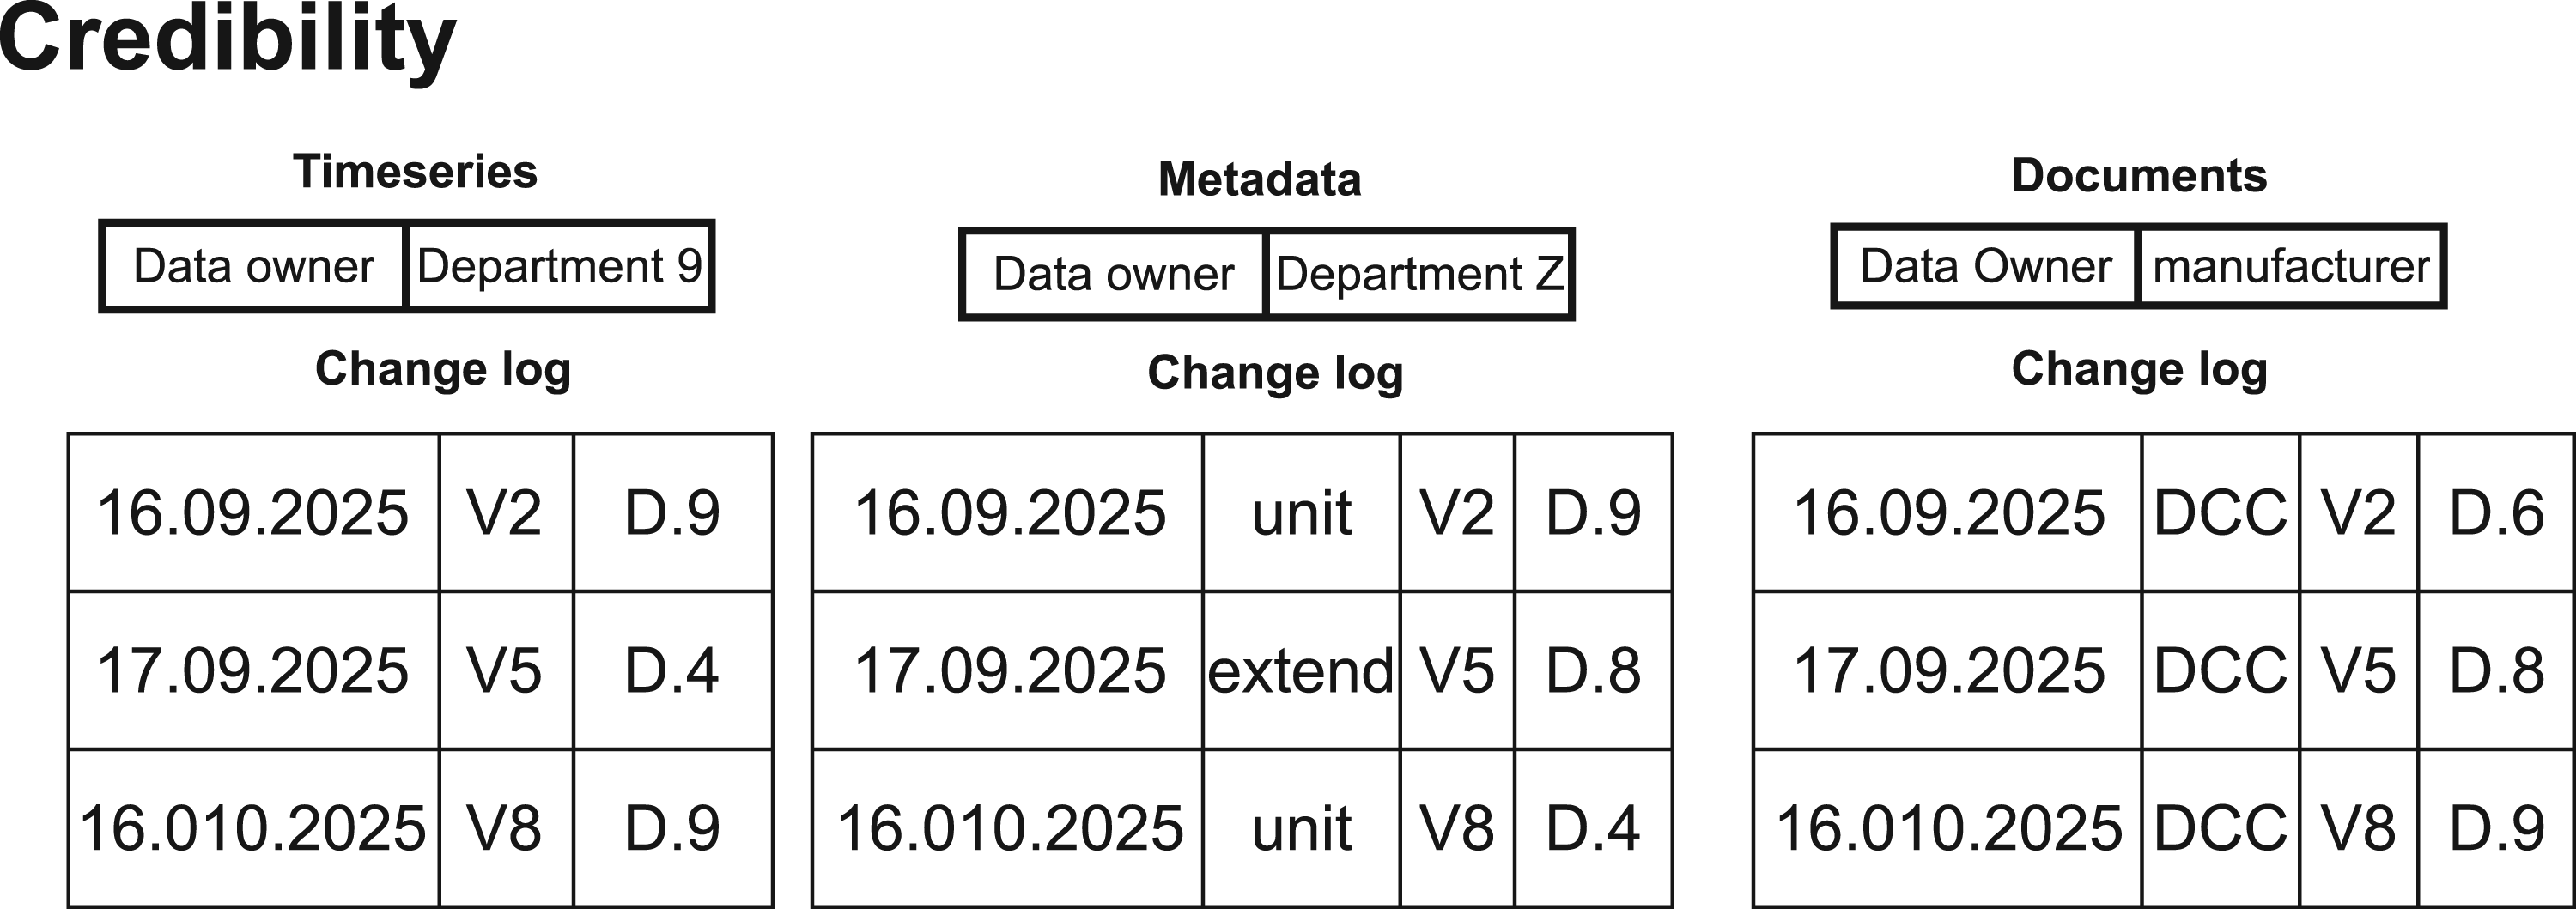
Mockup of the credibility panel showing the entity with the main responsibility for the measurement data, metadata and related documents. Below is the changelog of the data.
The completeness panel provides a comprehensive overview of missing measurements, metadata, and documents. As illustrated in Figure 16, the panel includes values representing the completeness of measurements on the left, the completeness of metadata in the center, and the completeness of documents on the right. For time series data, the resolution is also provided to assess the accuracy of the measurement. Additionally, the completeness metrics for metadata and documents include a list of missing items. In a typical scenario, such as evaluating power consumption over a year, which would incorporate statistical metrics such as maximum, minimum, and mean values. The completeness metric then provides an assessment of the significance of the analysis based on the available data. Another potential scenario involves the evaluation of anomalous data. In this case, the identification process would assess whether missing data or documents could explain anomalies, such as the possibility that the data might belong to a different unit or quantity type. The timeliness panel includes all data to evaluate the age of a dataset and the metadata. In scenarios where researchers intend to use data for statistical analysis or machine learning models, datasets spanning multiple years are typically employed. In such cases, assessing the age of the data, as well as identifying potential gaps caused by errors or operational changes, becomes particularly challenging. As shown in Figure 17, this panel presents four statistical values on the left side: the latest data point, the oldest data point, the mean age, and the median age. The latest and oldest data points are referenced to the viewer’s current time, which is relevant when data must not exceed a predefined age threshold. The mean age, in combination with the median timestamp, can be used to identify significant gaps in the dataset. For example, if an analysis requires data spanning 10 years but data for March of the fourth year is missing, the median timestamp would shift later than the mean. These values adapt dynamically depending on the defined time frame.
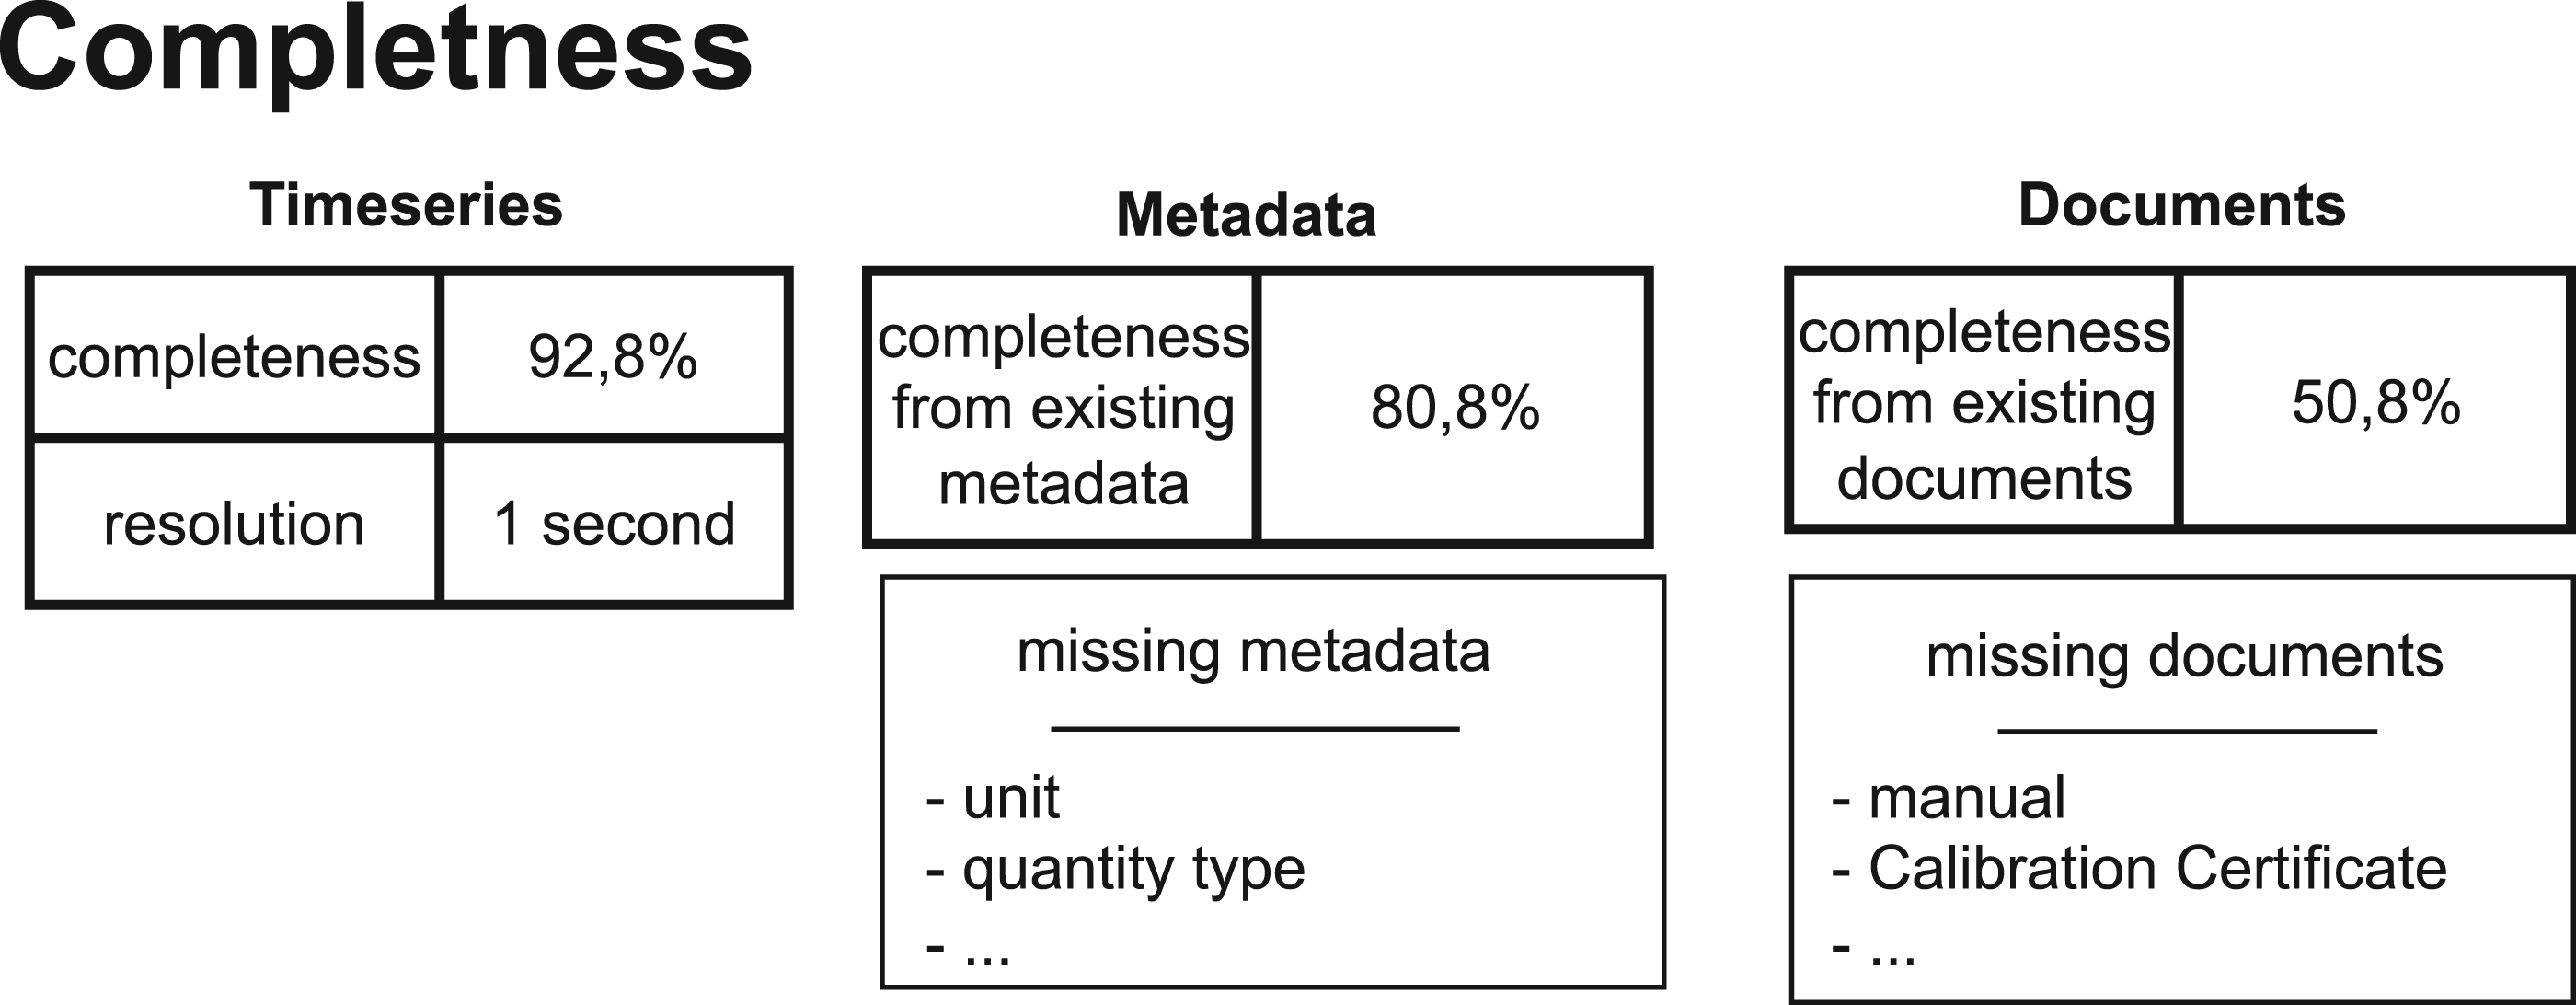
Mockup of the completeness panel showing the completness for each measurement data metadata and related documents.
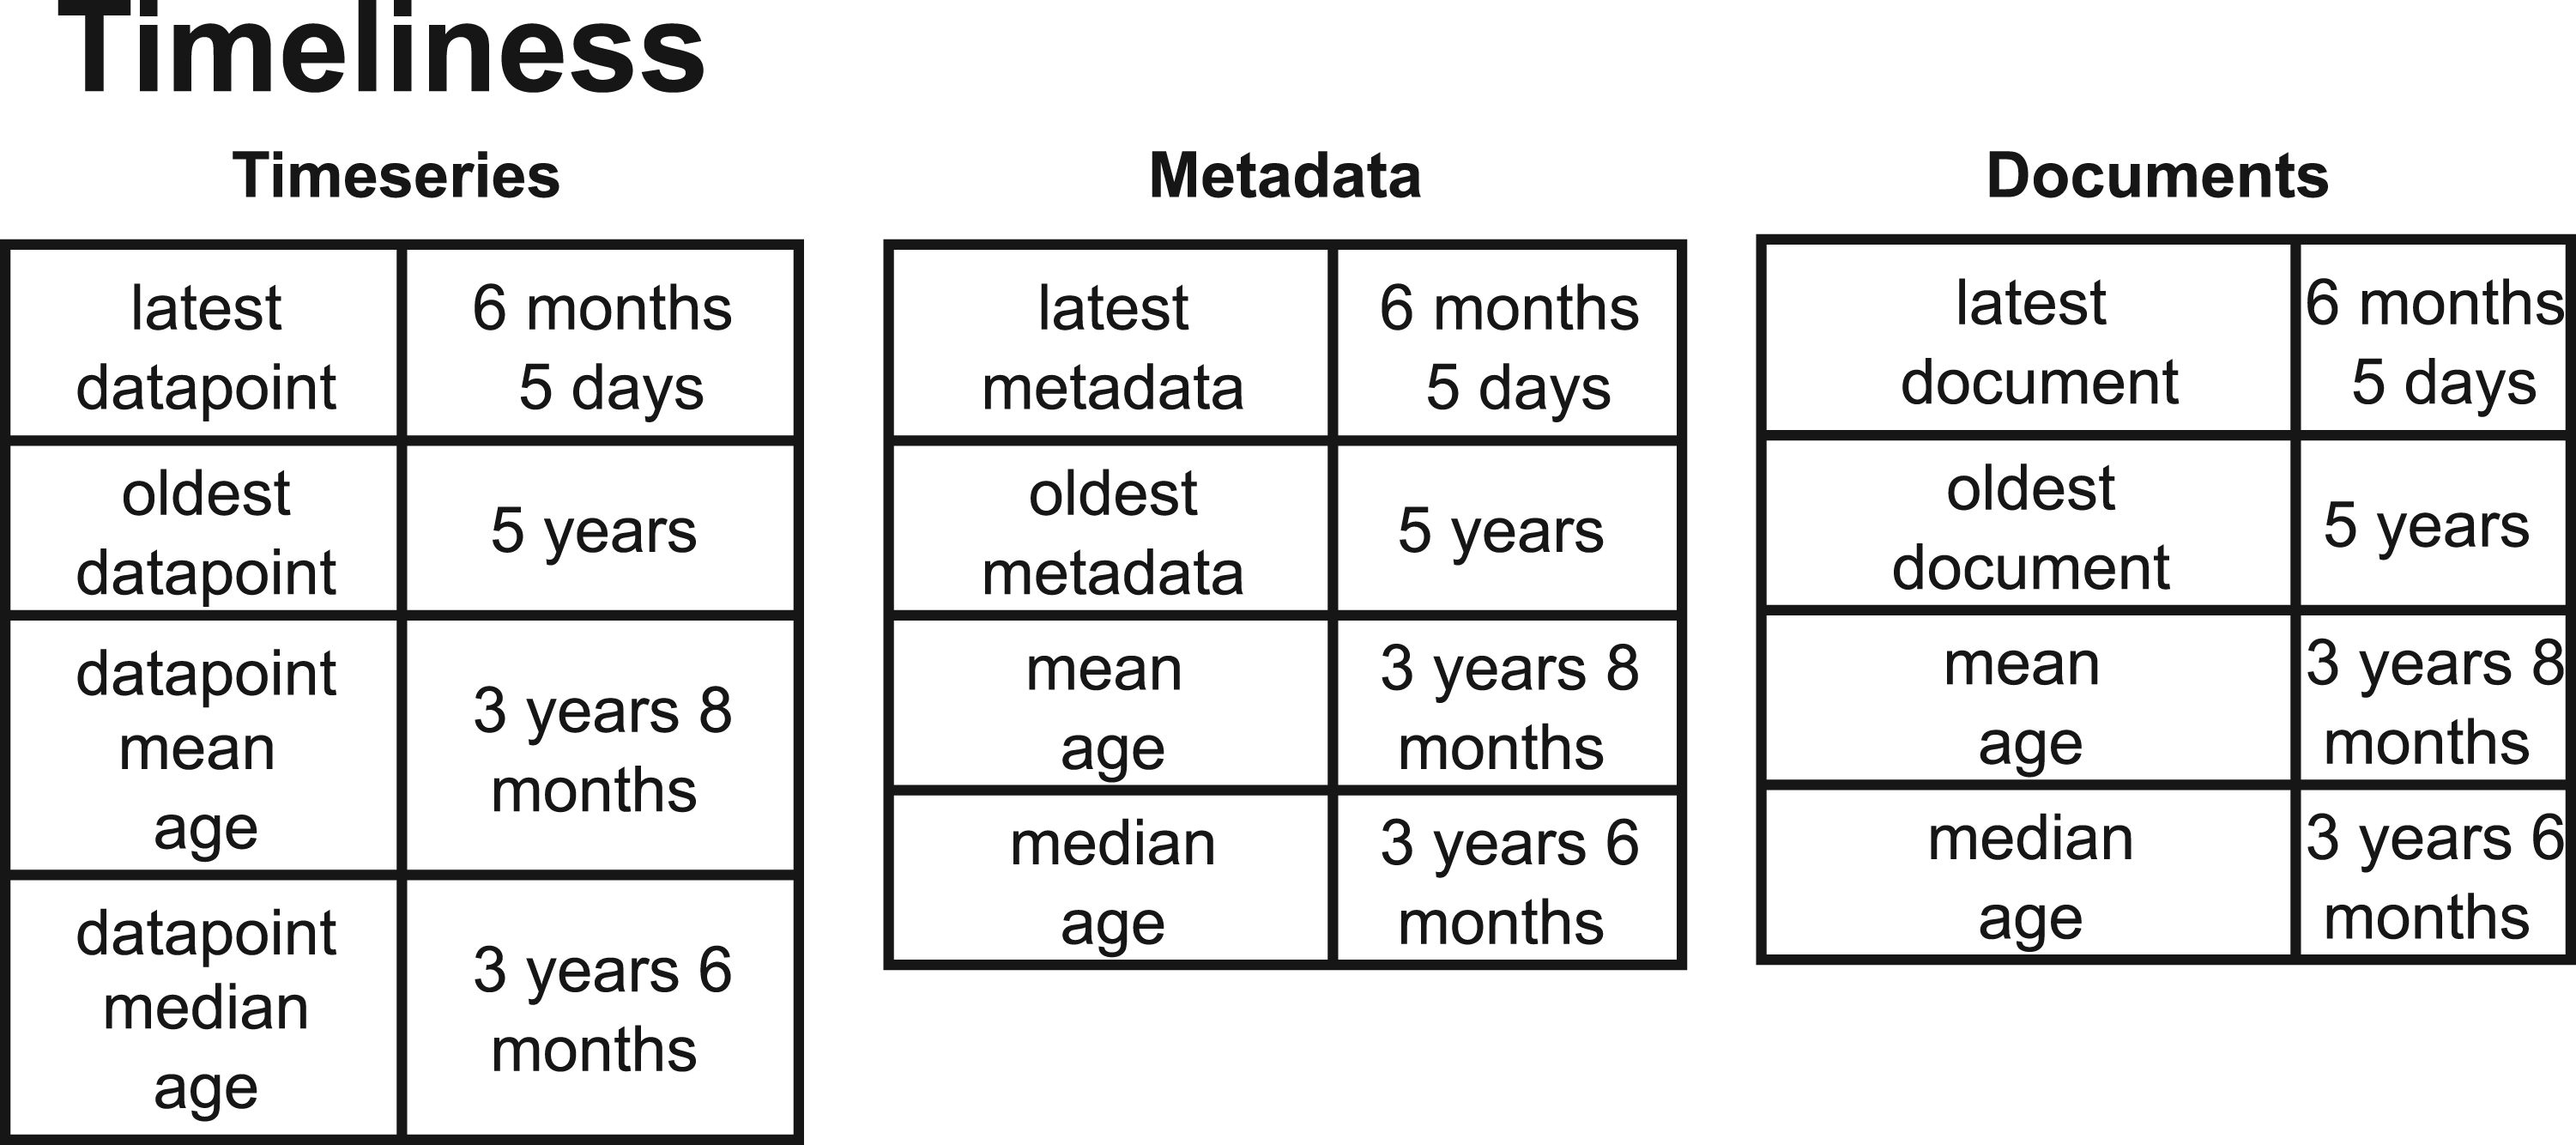
Mockup of the timeliness panel showing the time for each measurement data metadata and related documents.
The same metrics and logic are applied to metadata and associated documents. In this context, the metadata can also be used to identify outdated documents or metadata entries.
This article illustrates how data engineering can be systematically structured using tools and methodologies from system engineering, demonstrated on the use case electricity meters in smart cities. The subsequent discussion addresses the three central research questions introduced earlier, exploring their implications and potential solutions.
In the Data quality section, the analysis pinpointed measurement uncertainty, consistency, validity, credibility, completeness, and timeliness as the essential dimensions for evaluating electricity meter data in smart city frameworks. These dimensions were selected for their capacity to deliver objective, actionable insights—addressing challenges like sensor inaccuracies (measurement uncertainty), uniform data collection (consistency), and trustworthy sourcing (validity and credibility). Meanwhile, completeness ensures no critical data gaps, and timeliness maintains relevance for real-time applications.
The findings highlight that these dimensions not only define DQ but also form a robust foundation for a smart city DQ dashboard. By integrating them into monitoring systems, stakeholders can track performance, detect anomalies, and enhance the reliability of electricity meter data, ultimately supporting smarter urban energy management.
A potential criticism of including certain DQ dimensions, such as timeliness, in the dashboard is that they may already be visualized by the system, for example, through timelines or diagrams. However, by explicitly treating timeliness as a distinct dimension within the framework, this aspect is systematically emphasized to ensure that all relevant factors are not only addressed but also consistently evaluated and reported in a structured manner.
Another potential criticism, is that the assessment of dimensions such as credibility involves a degree of subjectivity, as it often relies on qualitative judgments regarding the trustworthiness of data sources, methodologies, or providers. Thus, the framework emphasizes the need for clear, predefined benchmarks, such as the reputation of data providers and the transparent history of the data and metadata to ensure that credibility can be evaluated as unbiased as possible.
The list of DQ dimensions as well as the related evaluation criteria are selected through the process described and could arguably be extended. A DQ dimensions which have been most discussed is noise. However, similar to precision, noise is inherently captured within the dimension of measurement uncertainty. GUM (JCGM, 2008) explicitly states that noise (potential sources of variation, including random fluctuations) contributes to the combined uncertainty of a measurement result. By including measurement uncertainty as a core dimension, the framework already accounts for the variability and repeatability of measurements, rendering noise redundant as a standalone metric.
The proposed solution combines electricity meter data with metadata using Smart Data Models, ensuring every measurement is directly linked to its source meter and associated metadata in the D-SI format. A key strength of the system including the D-SI format, is that measurement data, enriched with metrological metadata (such as uncertainty, units, and quantity type) and meter-specific information, enables the evaluation of electricity measurements using the introduced DQ dimensions. In addition, the systems dual-access capability over the context broker and database allow users to retrieve both real-time measurements and historical metadata. This flexibility enables the creation of detailed reports, long-term trend analyses, and real-time evaluations, while also incorporating trust-enhancing metadata. For smart cities, this means more reliable, transparent, and actionable electricity data to support efficient energy management and decision-making.
Critics may argue that the current architecture relies heavily on JSON-LD for semantic interoperability, which, while flexible, may not fully align with the stringent requirements of the Semantic Web. To address this limitation, future research could investigate the integration of RDF-based standards (e.g., RDF/XML and Turtle) to ensure closer alignment with W3C recommendations. Additionally, as device models increasingly incorporate SAREF concepts (FIWARE Foundation, 2026a), which themselves adhere to W3C standards (ETSI, 2026), future advancements in the interoperability of these systems are anticipated.
The proposed Lambda Architecture-based approach, with its emphasis on DQ dimensions, is highly transferable to other smart city domains where trustworthy, real-time data is critical. For instance, in transportation and mobility, the same methodology could ensure the reliability of sensor data from traffic cameras or EV charging stations, where measurement uncertainty directly impacts safety and efficiency (Asaithambi et al., 2020). Similarly, in environmental monitoring, the framework could validate air quality or water pollution sensors, ensuring compliance with regulatory standards (Demirezen and Navruz, 2023). The modularity of the Lambda Architecture makes it adaptable to domains requiring both real-time decision-making (e.g., traffic light optimization) and long-term analytics (e.g., climate trend analysis) (Yousfi et al., 2019).
However, transferring the method to new domains may require domain-specific adjustments to the data quality dimensions (Alkadhi et al., 2026). For example, healthcare applications would demand stricter validity and credibility checks, while waste management might prioritize completeness and timeliness. Despite these variations, the core principles of the Lambda Architecture, such as real-time and batch processing, semantic interoperability, and DQ assurance, remain universally applicable, ensuring scalability across smart city ecosystems (Mokoginta and Bijaksana, 2026).
A significant advantage of the systems definition approach on data engineering is the seamless integration of three critical processes: requirements management, systems architecture definition, and technology selection. The method follows a logical, step-by-step deductive process:
Identifying the subsystems of the architecture. Defining requirements for these subsystems. Using these requirements to guide the decision-making process for technology selection and to finalize the systems architecture.
In contrast, alternative development approaches often begin with a high-level requirements overview based on stakeholder discussions and preliminary technology recommendations. If requirements acquisition and technology research are not conducted holistically and within a sufficient timeframe, critical functions and requirements may be overlooked, leading to costly fixes in later stages. Conversely, if these steps are executed thoroughly, they inevitably mirror the structured deductive method, underscoring the value of the systems definition approach in the first place. Another advantage is the inclusion of the design definition process to create supporting documents for the systems realization. While this step may seem time-consuming, it ultimately prevents errors and enhances communication among multiple developers.
Another great advantage of the system definition phase is the continuing communication with the stakeholders. The main interaction to the stakeholders is located in stakeholder needs and requirements definition process in the concept definition phase. However, the systems definition process, as interpreted here allows the stakeholders to define their requirement via the system requirements tables. In return the criteria catalogs allow a transparent decision documentation for the stakeholder. The stakeholder groups in the case study have been grid operator, researcher, developer, and maintainer. In the context of the smart city, the roles would be extended with governmental bodies from the city as well as other interest groups.
The systems definition phase presents certain limitations, particularly in terms of time consumption and challenges in handling dynamic projects (Heidrich et al., 2016). To optimize efficiency, components such as requirements tables could be streamlined to include only essential information, such as requirement descriptions and prioritization. Similarly, criteria catalogs could be condensed, though this may introduce risks of oversight. Additionally, while the systems engineering process may appear to generate overhead, particularly for smaller projects, it significantly accelerates future development cycles once mastered. Ultimately, this methodology is not suited for rapid prototyping but excels in delivering reliable and safe solutions.
Another limitation, especially in projects with many stakeholders, is in the scenario of opposite requirements. In smart city use cases which want to implement data collecting systems, the usual opposite opinion are the side which wants to collect data and the side which does not want the data to be collected, by concern that this would have a negative impact on them. Here the systems engineering can support by transparently communicating technological abilities and possibilities. However, in some cases the contradicting requirements continue and this system does not provide a solution for this.
Conclusion
This article presents the system definition for the data infrastructure of the SMC, specifically designed for the management and processing of electricity data. All in all, this article concludes the developments by providing three larger contributions to the systems definition. The first contribution is the data quality dimensions for electricity data, which includes evaluation criteria subsequently utilized in the design and specification of the dashboard. The second contribution is the methodical definition of the systems definition phase for data engineering. This comprehends the use of the subprocess of the phase to design a deductive decision-making process for a system architecture design and including technologies. Third, the article presents the resulting system architecture, derived from the application of the proposed methodology to the electricity meter use case. This contribution includes detailed descriptions of the subsystems constituting the SMC infrastructure.
Following the systems engineering process, the next phase following the systems definition is the system realization of the SMC. Parallel to this research, the SMC is actively under development. Since the systems engineering process is a dynamic process, it is as a subsequent step, a detailed report on the realization of the data management system will be produced, documenting the implementation and operationalization of the proposed architecture. Additionally, this article provides a comprehensive assessment of the current system definition phases. However, as the system evolves and additional project requirements emerge, certain elements, such as technology selection or the database model, may be subject to revision. Future work on this topic will revisit and refine these aspects accordingly.
The SMC is an integral component of the broader initiative aimed at enabling systems metrology for future cities. As part of the initiative, the system supports the data supply of energy data into a digital twin, thereby supporting environmentally optimized high-performance computing (Ulbig and Kammeyer, 2025). Additionally, it contributes to research on perception-based metrics, treating the human as a sensor to enhance data interpretation and integration (Jung et al., 2024). A further focus of ongoing research will be the effective communication of the DQ dimensions to the broader public, to foster transparency, trust, and informed decision-making.
Future research aims to explore the applicability of the DQ dimensions to additional physical measurements and assess its validity across diverse data types. This would help determine the framework’s generalizability and robustness in contexts beyond its original scope. Additionally, the interpretation of the systems definition phase warrants further investigation, particularly regarding its potential extension to other data engineering use cases. These may include not only additional smart city applications but also domains such as manufacturing, finance, or industrial automation, where structured data management is equally critical.
Further research is also required to establish the systems architecture for alternative smart city use cases, as well as for electricity data collection in different contexts. One idea is the integration of a unit converter to enable easier analysis on a international scale for example. Further examples include battery production environments or complex power grids incorporating decentralized energy sources. Such investigations would contribute to a deeper understanding of the architecture’s scalability, adaptability, and performance in varied operational settings.
Footnotes
Funding
The authors received no financial support for the research, authorship, and/or publication of this article.

Declaration of conflicting interests
The authors declared no potential conflicts of interest with respect to the research, authorship, and/or publication of this article.
Copyright
Copyright © 2016 SAGE Publications Ltd, 1 Oliver’s Yard, 55 City Road, London, EC1Y 1SP, UK. All rights reserved.