
Abstract
Background:
Motor vehicle accidents (MVAs) are a major cause of unintentional injury deaths in the United States. Substance use, particularly alcohol and cannabis, is a well-established contributor to impaired driving and fatal MVAs. This study aimed to analyze mortality trends from MVAs associated with substance use from 1999 to 2020 in the United States.
Methods:
We conducted a retrospective analysis using the CDC WONDER database, examining death certificates from 1999 to 2020 that recorded both MVAs and substance use in individuals aged ≥15 years. Data were stratified by sex, age group (15-64 and ≥65), race (white and black), and US census region. Age-adjusted mortality rates (AAMRs) were calculated, and temporal trends were analyzed using the Mann-Kendall trend test. Jointpoint regression analysis was used to calculate Average Annual Percentage Change (AAPC).
Results:
A total 24 152 deaths were recorded, with an overall AAMR of 0.46 per 100 000 population. While overall trends were stable, a significant increase in AAMR was observed among women (AAPC: 3.04% increase; P = .002), particularly white women (+4.3%) and women in the West (+2.0%). Older men (≥65) also experienced a significant rise (τ: 0.63; P < .001). Men consistently had higher mortality than women across all demographics (P < .001). Regionally, men in the Northeast experienced a significant decline (τ: −0.57).
Conclusion:
While total substance-related MVA mortality remained stable, the rising mortality among women, older men, and certain subgroups highlights shifting risk profiles. These findings underscore the need for targeted, demographically inclusive public health strategies and equitable resource allocation to reduce preventable deaths.
Highlights
Substance-related fatal motor vehicle accidents rose significantly among women. White women and women in western US are particularly vulnerable.
Men had consistently higher mortality rates than women across all groups.
Mortality trends remained stable in US regions, declining only for men in the Northeast.
Introduction
Motor vehicle accidents (MVAs) are one of the leading contributors to unintentional injury deaths in the United States. 1 Among MVA fatalities, 37% involved one or more drivers with a positive blood alcohol concentration (BAC). 2 The use of cannabis is another risk factor for impaired driving and is the second most common substance involved in fatal MVAs after alcohol.3,4 The effects of Δ9-tetrahydrocannabinol (THC) from cannabis impair driving skills, including lane weaving, slower reaction times, diminished coordination, and altered perception.3,5,6 Laboratory tests indicate that combining low-dose cannabis with alcohol can enhance impairment more than using either substance alone, especially related to driving-related skills. 7
Over the past 2 decades, United States cannabis policy has shifted dramatically, with the legalization of medical and recreational cannabis, resulting in a subsequent increase in adult cannabis use. 8 Between 2002 and 2017, past-month use increased for those aged 26 and older from 4.0% to 7.9%, and for adults aged 18 to 25 from 17.3% to 22.1%. 9 Similarly, the rates of cannabis prevalence among nighttime drivers also rose, from 8.6% to 12.6%, between 2007 and 2013. 10 A study by Salas-Wright et al. from 2016 to 2018 revealed that 29.5% of cannabis users admitted to driving under the influence. 11 However, the proportion of MVA deaths in the United States that involve alcohol has remained constant over time. 2 A meta-analysis by Elvik et al found that the use of amphetamines, benzodiazepines, cocaine, and opiates was associated with a higher risk of fatal MVAs. 12
Given the high prevalence of fatalities associated with MVA and the widely reported correlation to substance abuse, understanding its geographical trends and connection to patient demographics is imperative. The literature lacks sufficient reports that clarify this association effectively. To bridge this gap, we investigated trends in substance use related to fatal MVAs by utilizing the Centers for Disease Control and Prevention’s (CDC) Wide-ranging Online Data for Epidemiologic Research (WONDER) database. Our focus was on sex, race, age, and geographical parameters to determine the trends in MVA fatalities associated with substance use.
Materials and Methods
Study Design and Data Source
We conducted a retrospective study using the CDC WONDER database. 13 This centralized database includes mortality data from multiple causes of death files across all 57 US vital statistics jurisdictions.
The study adheres to the Strengthening the Reporting of Observational Studies in Epidemiology (STROBE) guidelines. 14 Institutional review was not sought, as the data were publicly available and deidentified and therefore informed consent was not applicable per HHS regulation 45 CFR 46.101(c).
Study Population and Variables
CDC WONDER’s Multiple Cause Of Death field was queried using International Classification of Diseases, 10th Revision (ICD-10) codes. MVA cases were filtered using ICD-10 codes
To derive the above coding list for substance use, the exact inclusion criteria from previously published CDC WONDER studies were utilized.15,16 However, the previous studies aggregated chronic and acute conditions together. Substance-related codes that attributed death to chronic pathology (eg,
Data were stratified by sex (male and female), race (restricted to white and black), US census regions (Midwest, Northeast, South, and West) and age (15-64 and >64 years). Other racial and ethnic groups had small sample counts, which were deemed suppressed (defined as less than 10 death counts) or unreliable (defined as less than 20 death counts) by the database. This prevented monotonic trend evaluation, and as such, non-white and non-black individuals were excluded from analysis.
Full details of codes used to define substance use can be found in Supplemental Tables 1 and 2.
Primary and Secondary Outcomes
The primary outcome was to assess trends in age-adjusted mortality rates (AAMRs) from substance-related MVAs across the United States.
The secondary outcome was to explore disparities in AAMRs based on sex, race, age group, and geographic region.
Statistical Analysis
Temporal trends were analyzed using the Mann-Kendall trend test, which calculates the Kendall tau coefficient to assess monotonic changes over time (reported as Kendall’s tau and P-value). To quantify the magnitude of change for demographic subgroup with a significant monotonic trend, we utilized joinpoint regression analysis. 17 To strictly evaluate the net change over the full 22-year study period, Average Annual Percent Change (AAPC) was calculated and reported. Descriptive identifiers are used for subgroups with no significant monotonic trends.
Independent samples t-tests were used to compare the average magnitude of AAMRs between groups independent of the temporal trend shape. To assess the robustness of the findings and identify whether the trends were driven by a specific drug, a sensitivity analysis was conducted by dividing the cohort into an alcohol group and non-alcohol group. Similar to the issue faced when assessing non-white and non-black races, further stratification of non-alcohol group was difficult due to low death counts. Statistical significance was defined as P < .05. All analyses were performed using IBM SPSS Statistics (Armonk, NY: IBM Corp), Version 23.0. 18
CDC WONDER contains aggregate population-level data and is unable to link individual level death record to external covariates (state toxicology protocols, policy changes, or law enforcement intensity). As such, multivariable temporal regression models accounting for these variables could not be performed.
Results
Overall Age-Adjusted Mortality Rate in Men and Women
From 1999 to 2020, a total of 24 152 people with substance use died from MVAs. The total AAMR was 0.456 per 100 000 (95% CI: 0.450-0.462), and no trend was seen during the study period (τ: −0.206, P = .184). The cohort had a female-to-male ratio of 1:4.63. Women had an age-adjusted mortality of 0.171 (95% CI: 0.166-0.176) and showed a significant upward trend (τ: 0.326, P = .034), increasing from 0.111 in 1999 to 0.209 in 2020 (APPC = 3.036, 95% CI: 2.195-4.299). Men had a total AAMR of 0.754 (95% CI: 0.744-0.765) and showed no variation in AAMR over the years (τ: −0.177, P = .248). Men had a higher AAMR than women during this time period (P < .001) (Figure 1; Table 1).
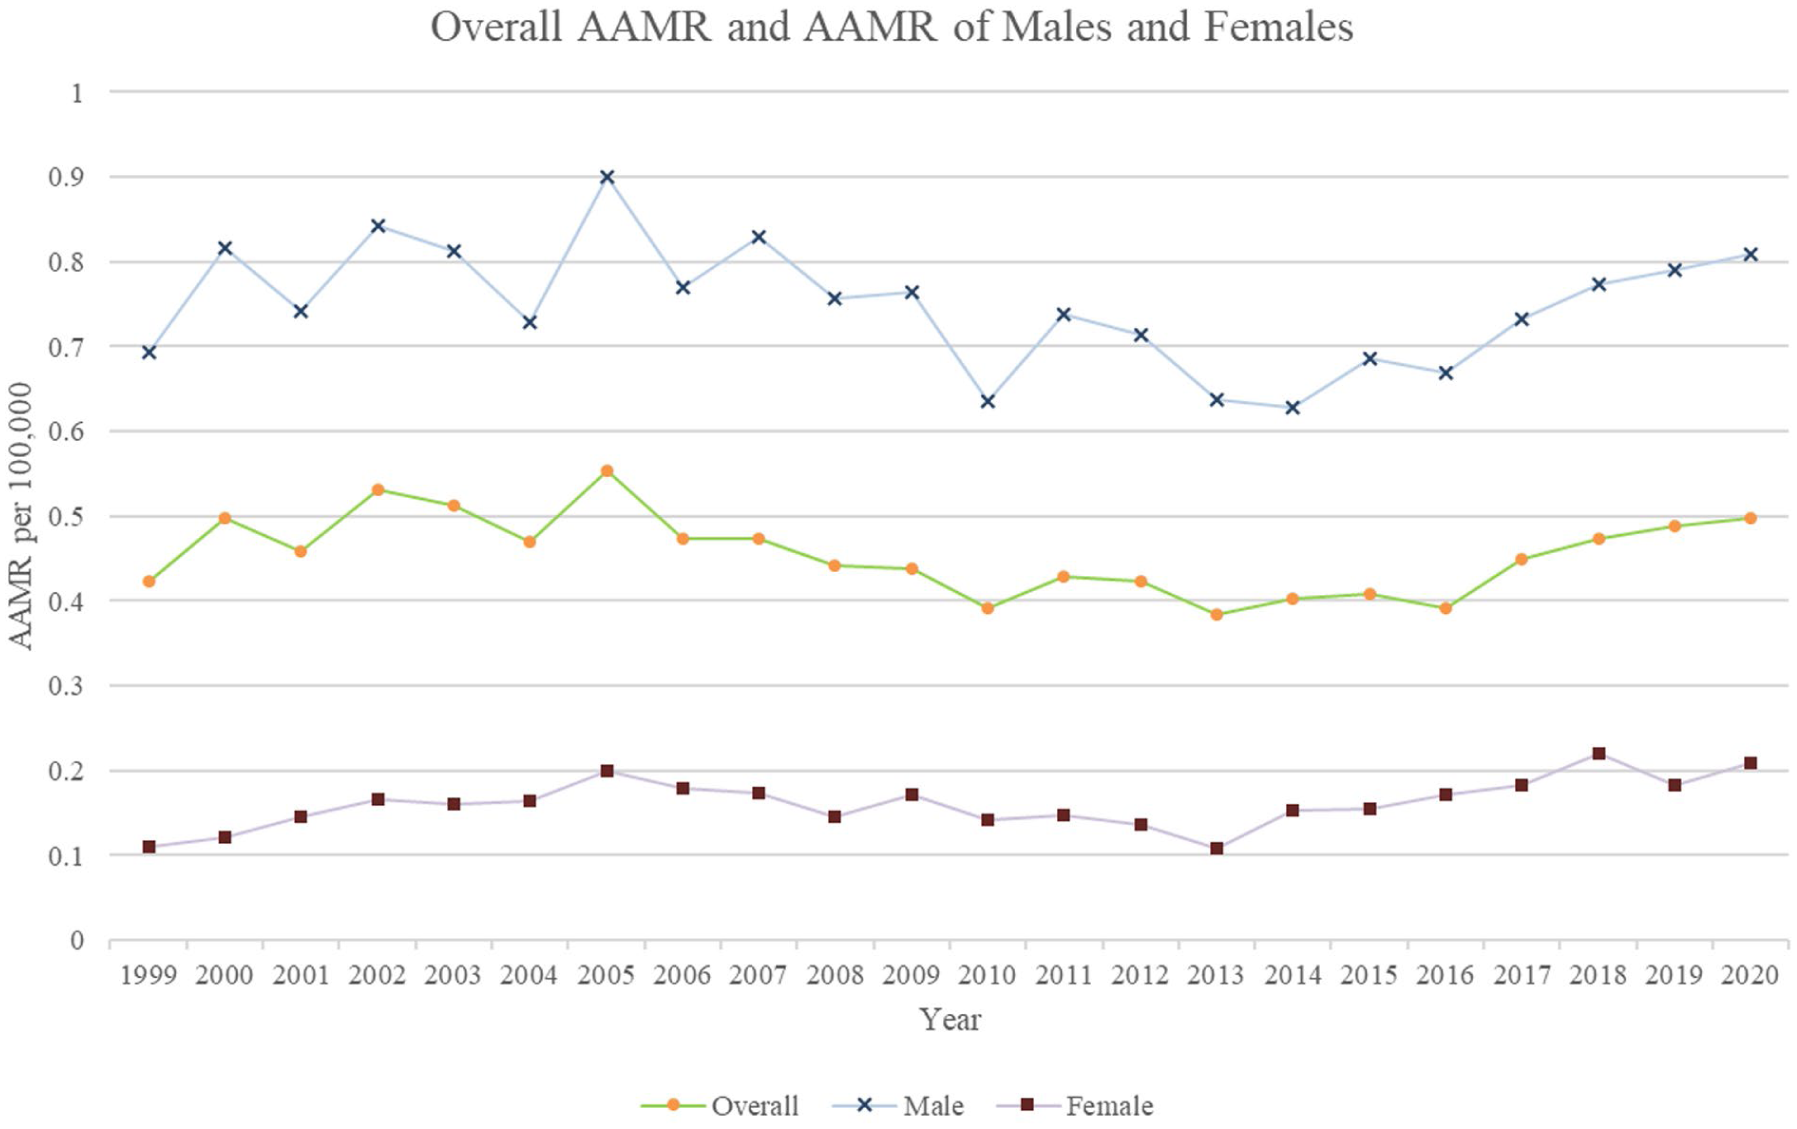
Age-adjusted mortality rates (AAMR per 100 000) according to age group and sex among the US population 1999 to 2020 (Overall τ: −0.206, P = .184; Women τ: 0.326, P = .034; Men τ: −0.177, P = .248).
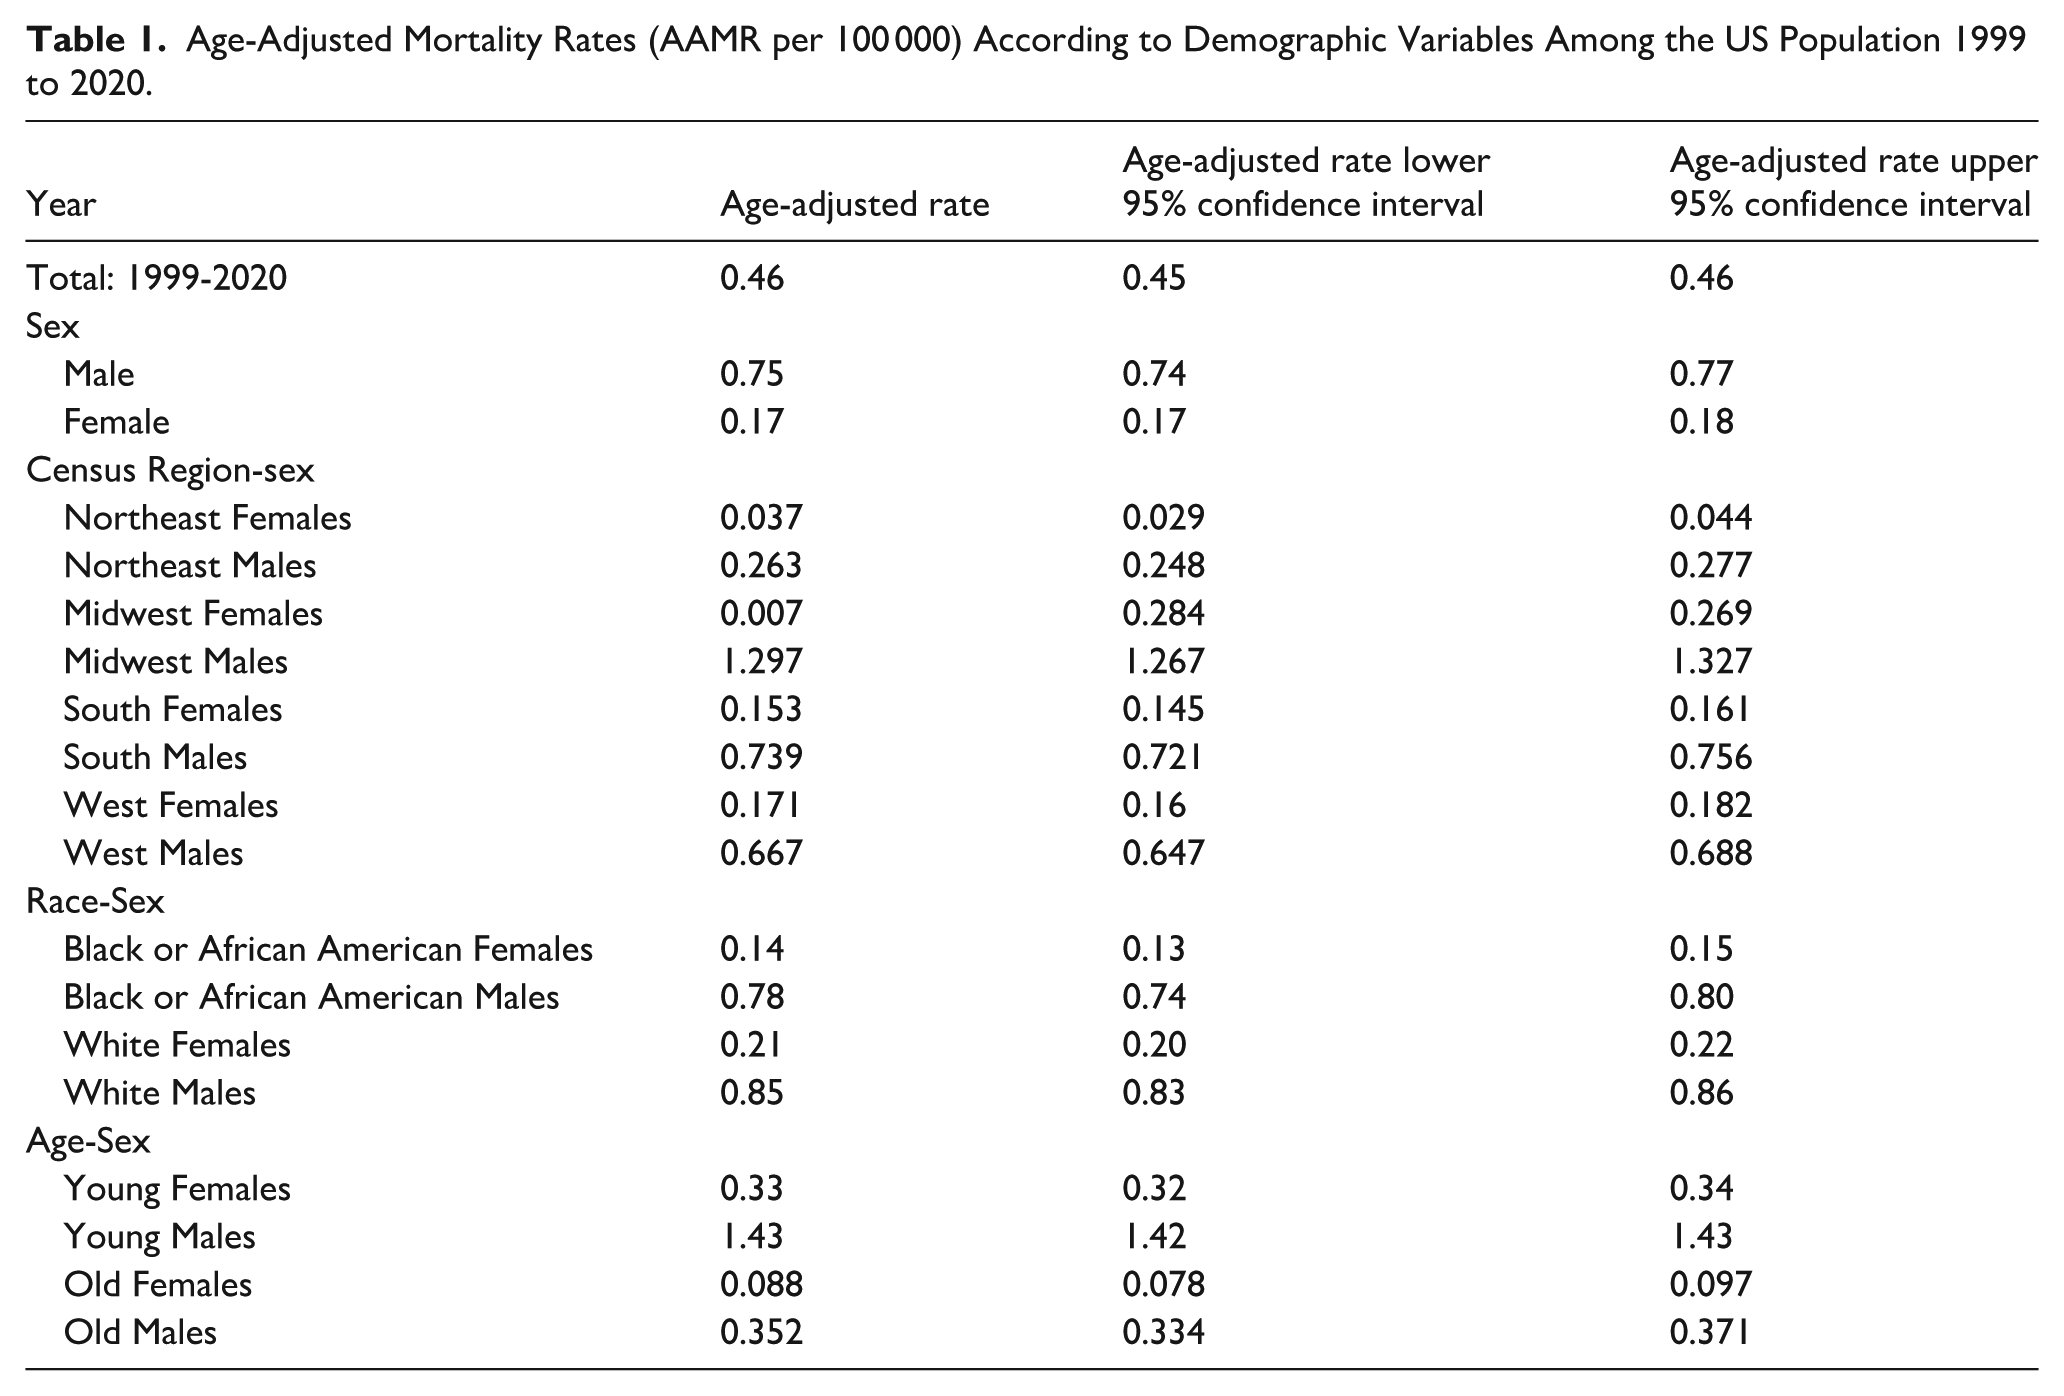
Age-Adjusted Mortality Rates (AAMR per 100 000) According to Demographic Variables Among the US Population 1999 to 2020.
Mortality Rates by Census Region
Among women, a significant upward trend in AAMR was observed only in the West (τ: 0.371, P = 0.039) with an AAPC of 1.95% (95% CI: 0.441-3.842). The AAMR remained stable in the Midwest (P = .88) and the South (P = .48). In the Northeast, due to the low number of female substance user who died in MVAs, the AAMRs for each year were deemed either unreliable or suppressed by the CDC WONDER database and the trend could not be properly evaluated.
Among men, only those in the Northeast showed a decline (AAPC: −3.309, 95% CI: −4.639 to −2.025) in AAMR between 1999 and 2020 (τ: −0.573, P < .001). The rest of the regions showed no change in AAMR over the time period (P = .414 for Midwest, P = .297 for South, and P = .142 for West). Men had a higher AAMR than their female counterparts in all 4 regions (P < .001) (Table 1). Refer to Figures 2 and 3 for visual representations.
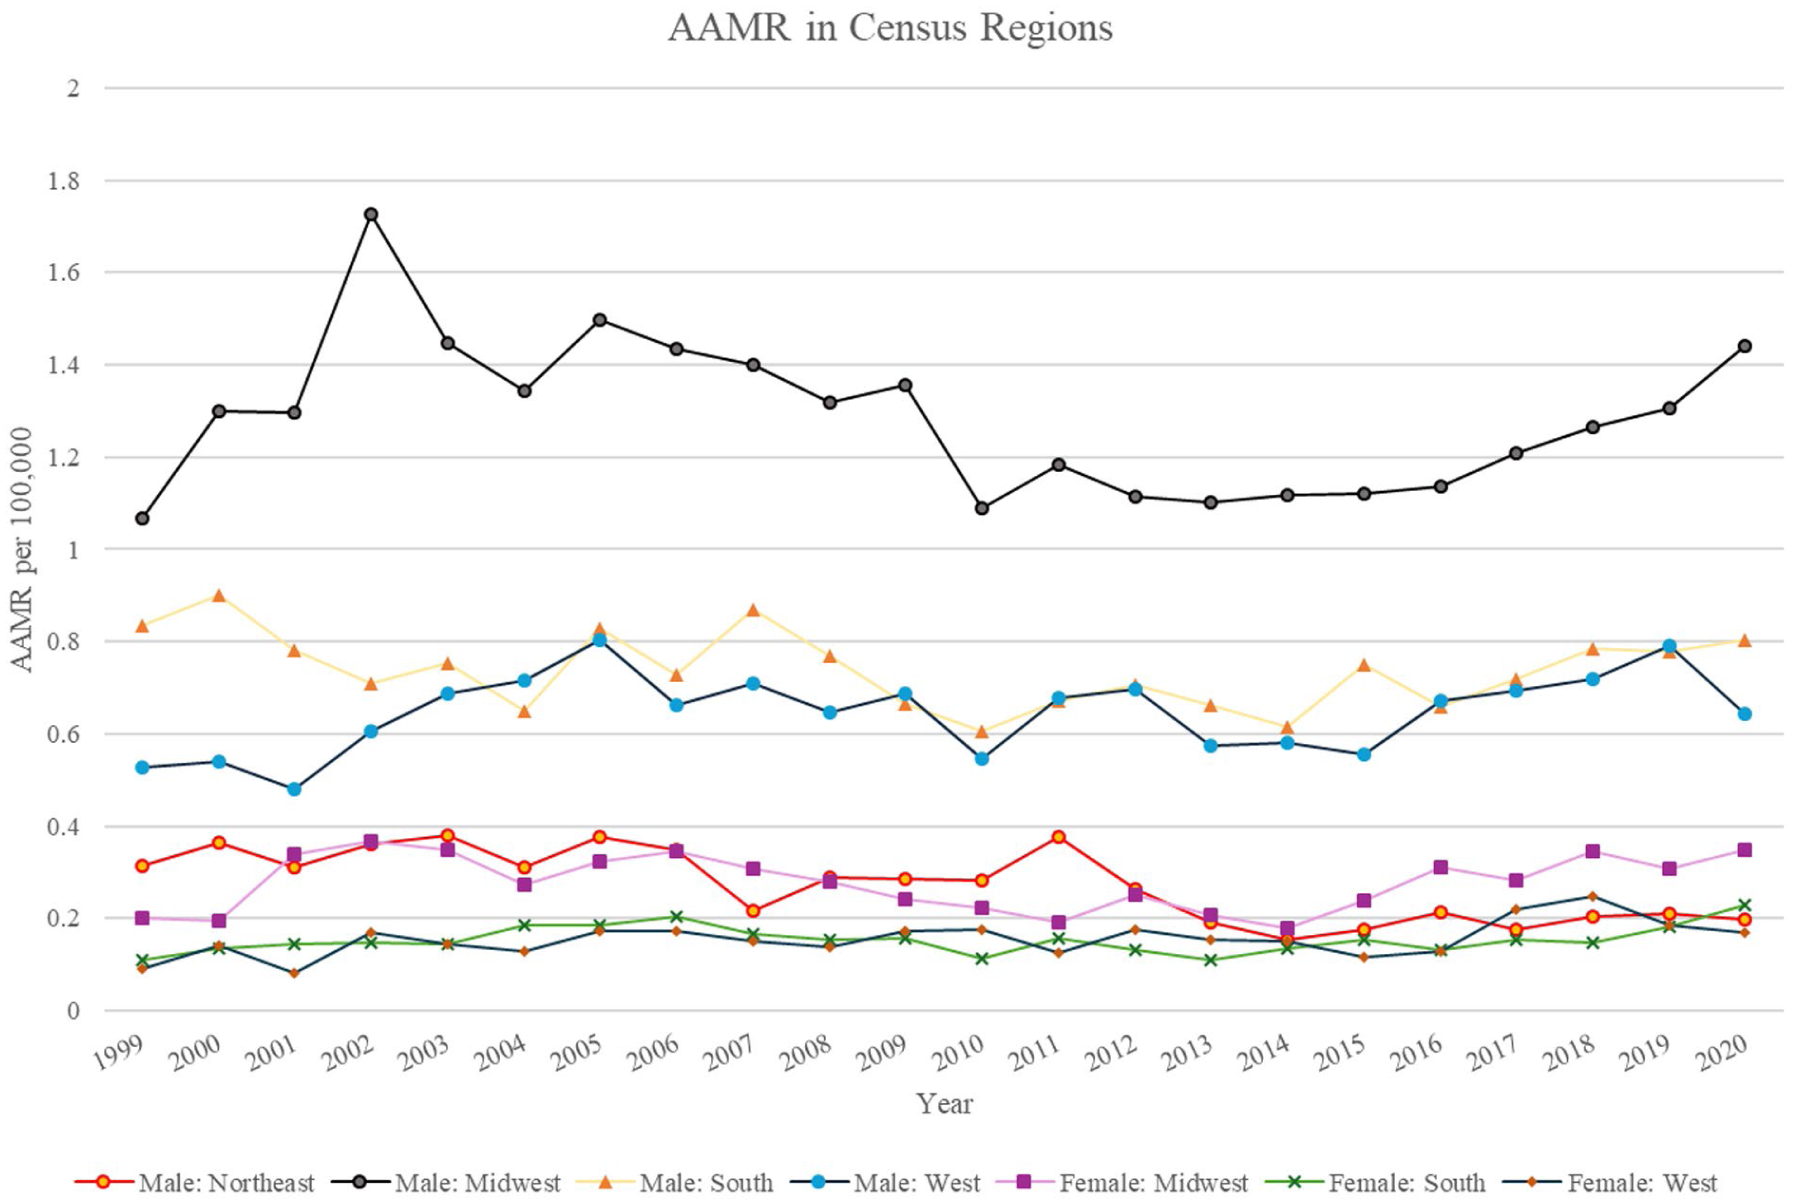
Age-adjusted mortality rates (AAMR per 100 000) according to census region and sex among the US population 1999 to 2020 (Male Midwest τ: −0.126, P = .414; Male Northeast τ: −0.573, P < 0.001; Male South τ: −0.16, P = .297; Male West τ: 0.226, P = .142; Female Midwest τ: −0.022, P = .888; Female South τ: 0.109, P = .48; Female West τ: 0.371, P = .039).
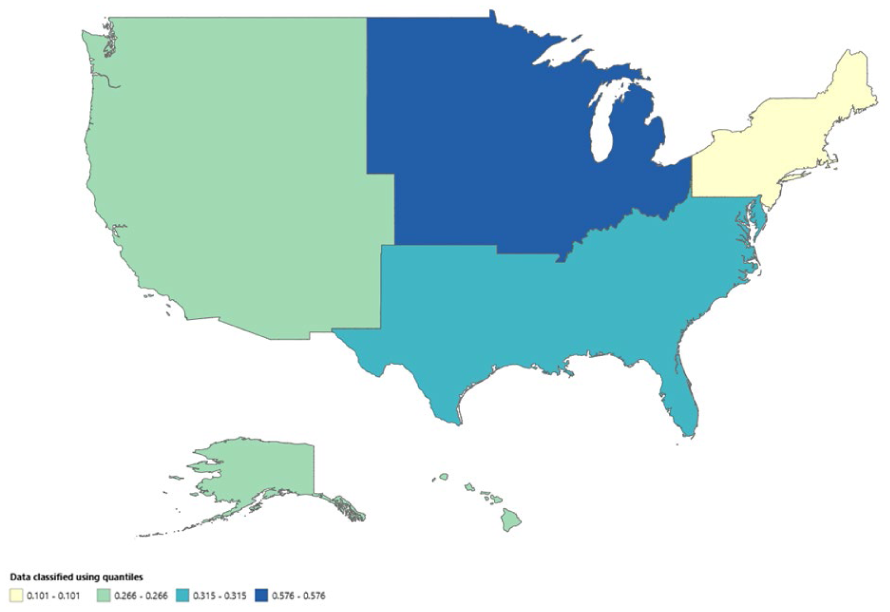
Heat map according to age-adjusted mortality rates per 100 000 according to census regions among the US population 1999 to 2020.
Mortality Rates Stratified by Sex and Race:
After stratification based on sex and race, a significant change in AAMR over time was only seen among white women (τ: 0.309, P = .045), who saw an average annual increase of 4.34% (95% CI: 2.477-7.276). White men and black men did not show any trend in their AAMR (P = .481 for white men, and P = .91 for black men). Black women saw low deaths in several years, which prevented accurate trend assessment.
Black men had a significantly higher AAMR than black women (0.767 vs 0.139, P < .001). Similarly, white men had a significantly higher AAMR than white women (0.845 vs 0.209, P < .001). White men had a significantly higher overall AAMR than black men (0.845 vs 0.767, P = .002). White women had a significantly higher overall AAMR than black women (0.209 vs 0.139, P = .009) (Figure 4; Table 1).
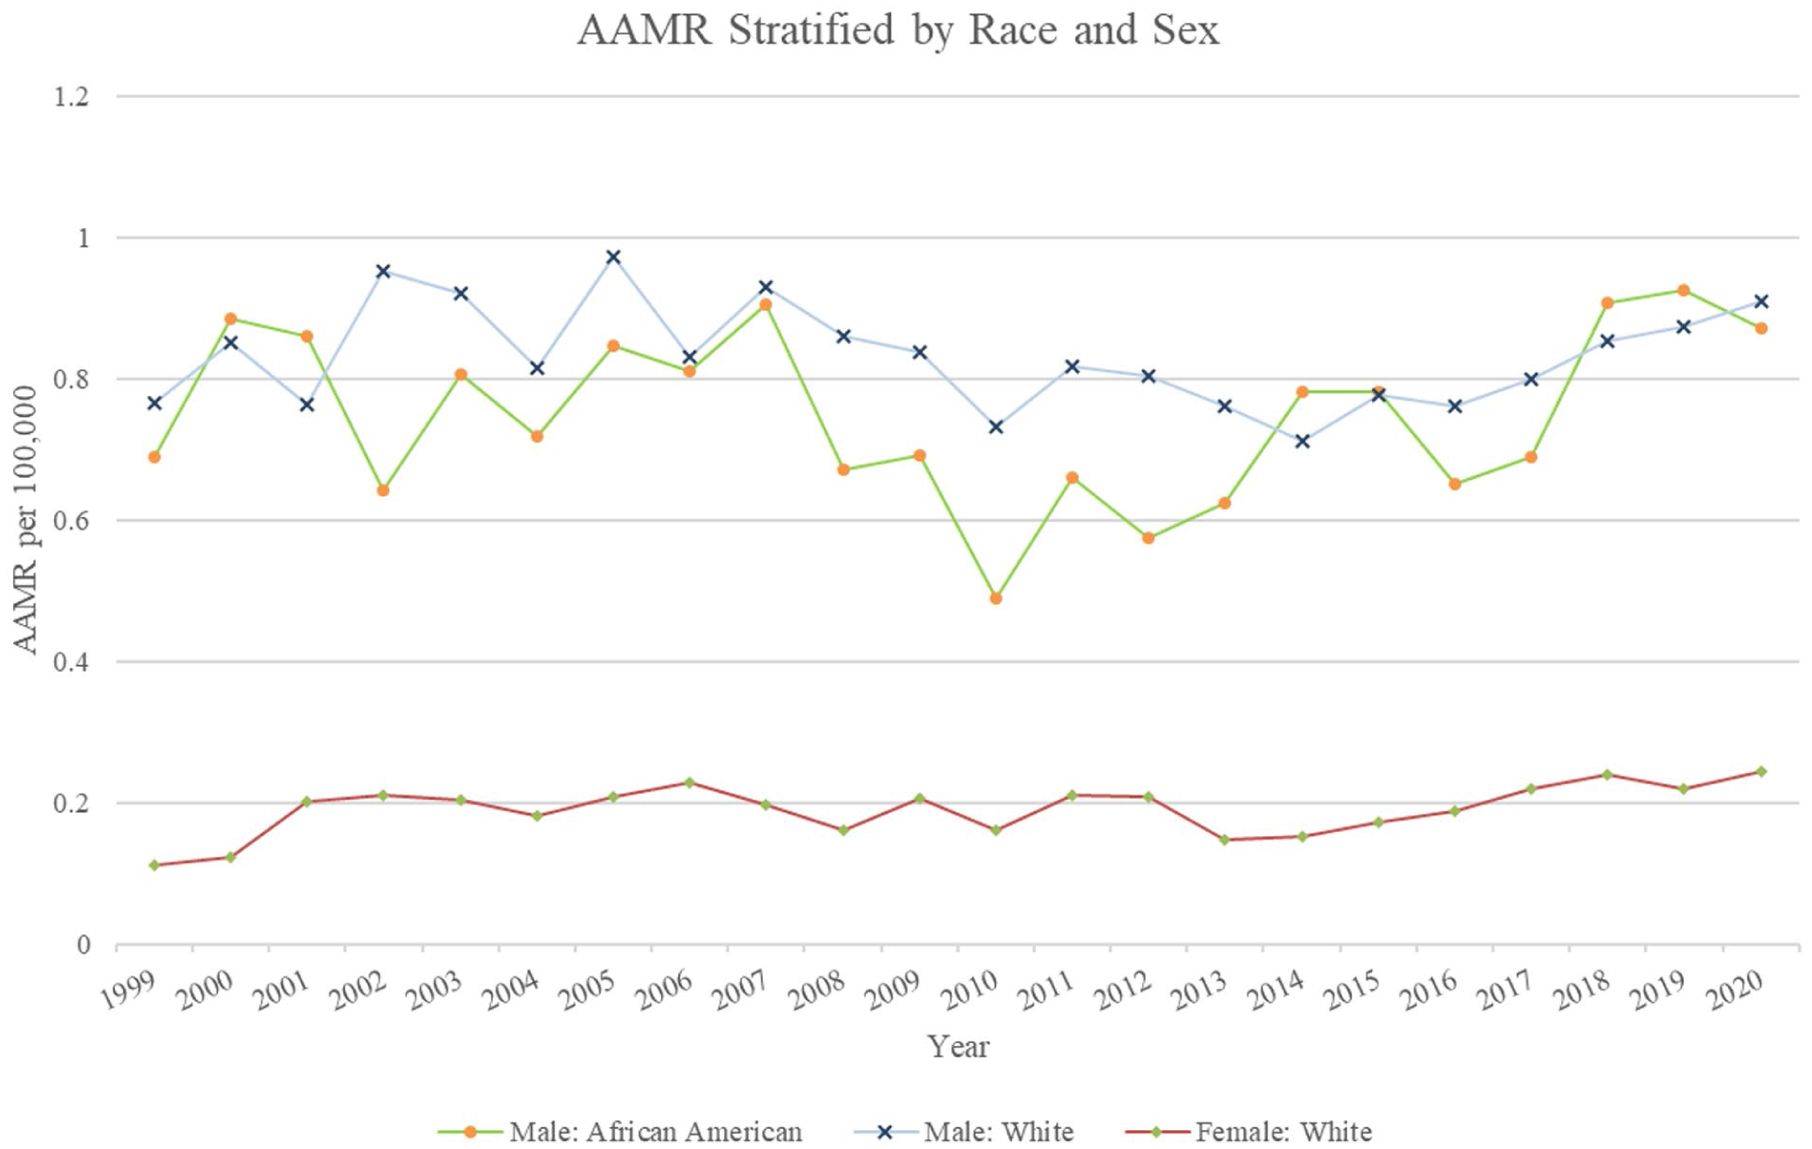
Age-adjusted mortality rates (AAMR per 100 000) according to race and sex among the US population 1999 to 2020 (White Female τ: 0.317, P = .039; White Male τ: 0.226, P = .142; Black Male τ: 0.017, P = .91).
Sex Stratified by Age
During the study period, a significant upward trend in AAMR was seen in older men aged >64 (τ: 0.633, P < .001). For men in the older cohort, the AAMR had an AAPC of 3.783% (95% CI: 2.382-5.817). The total number of older women with substance use who died in MVAs were too low between 1999 and 2016, and as such, a trend could not be calculated (Figure 5; Table 1).
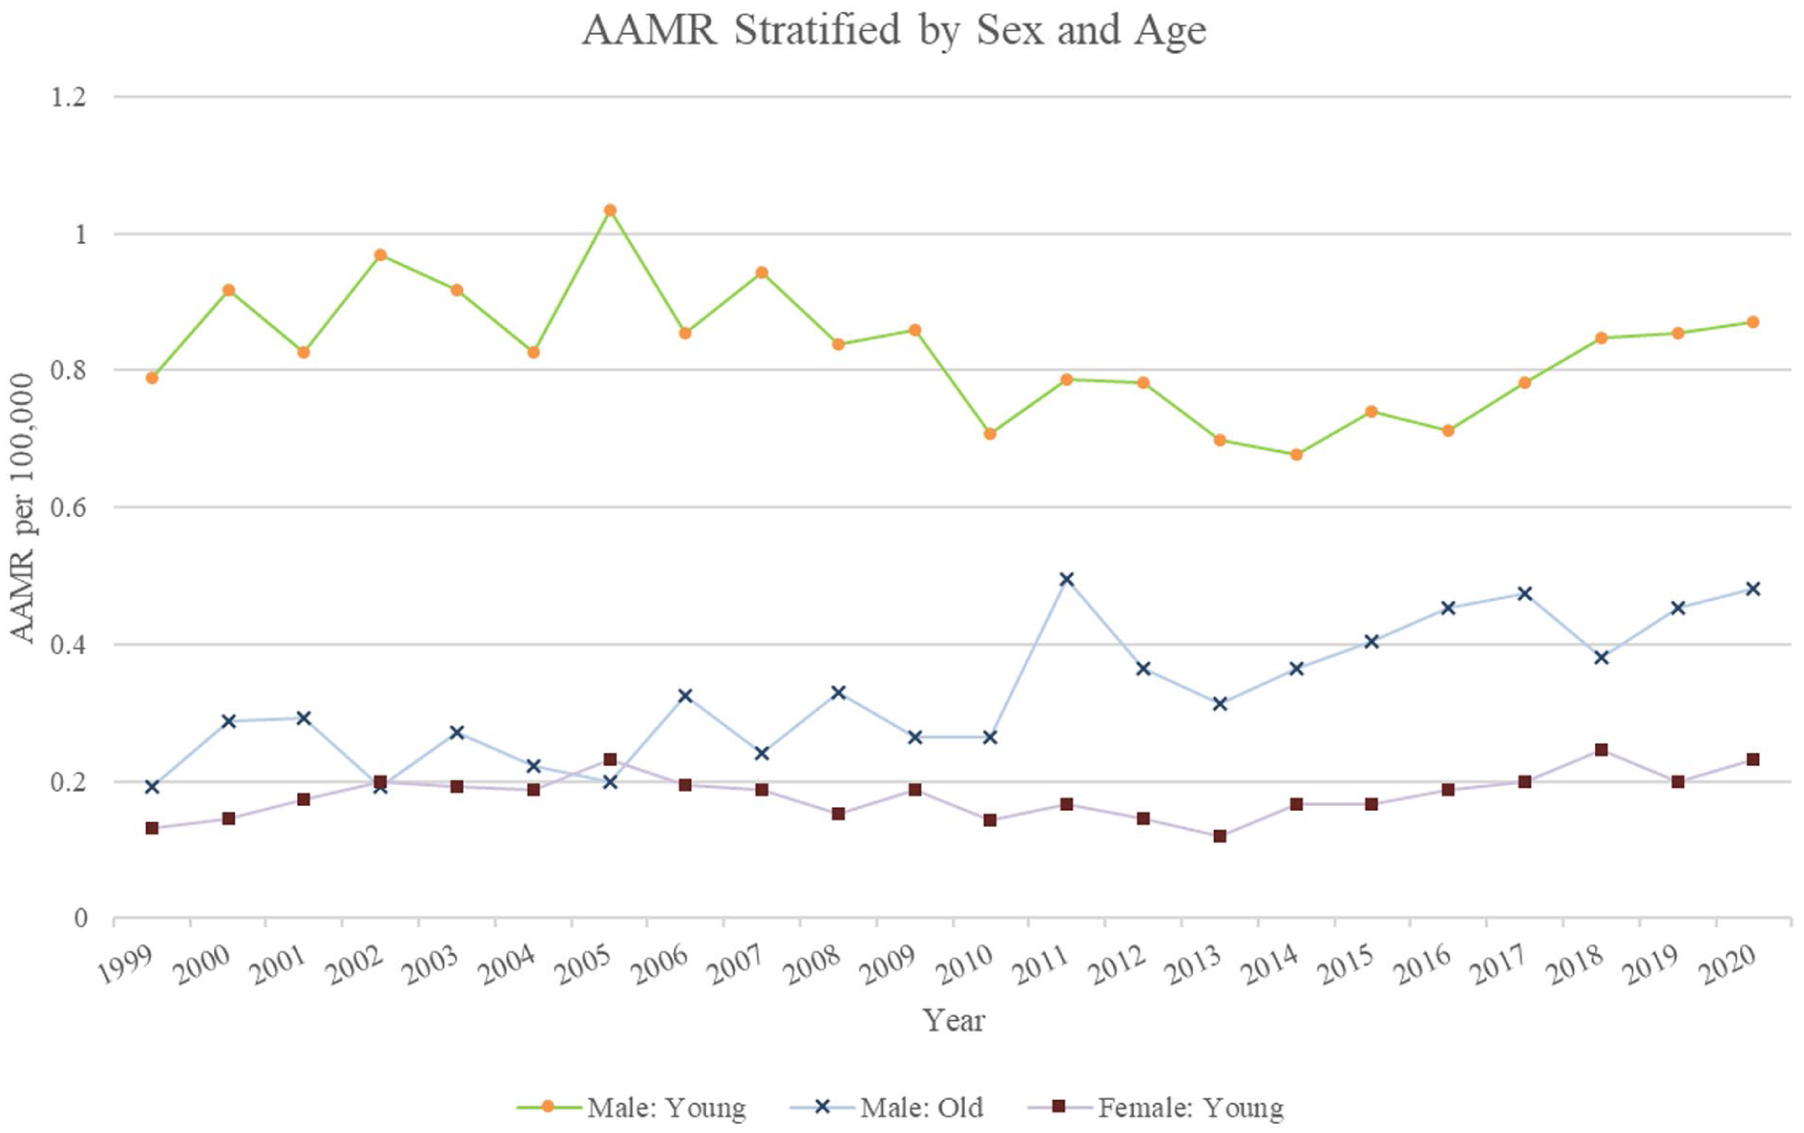
Age-adjusted mortality rates per 100 000 according to age group and sex among the US population, 1999 to 2020 (Young Female τ: 0.209, P = .182; Young Male τ: −0.244, P = .114; Old Male τ: 0.633, P < .001).
Younger individuals (aged 15-64) had a two-and-a-half-fold higher mortality than older individuals (P < .001). However, the AAMR for men and women in this cohort did not show any fluctuation during the study period (P = .114 for Men and P = .182 for women). Men had a higher AAMR than women (0.831 vs 0.187, P < .001) (Figure 5; Table 1).
Sensitivity Analysis, Stratified by Alcohol and Non-Alcohol
A total of 18 529 MVA deaths (77% of total deaths) were attributed to alcohol use between 1999 and 2020. During this period, AAMR for alcohol use–related MVA deaths saw a decreasing trend (τ: −0.715, P < .001), where it decreased from 0.377 deaths per 10 00 000 in 1999 to 0.26 per 1 00 000 in 2020 (AAPC = −2.625, 95% CI: −3.254 to −2.029). In contrast, 7650 MVA deaths were due to substance use other than alcohol for this period. This group saw an increasing trend in their AAMR (τ: −0.83, P < .001). The AAMR rose by an average of 7.242% each year (AAPC; 95% CI: 5.327-9.227).
Discussion
Our analysis of the trends in mortality due to substance use and MVAs from 1999 to 2020 reveals critical insights into demographic disparities and evolving public health challenges. Between 1999 and 2020, there were 24 152 deaths attributed to substance use–related MVAs, with an overall AAMR of 0.46 per 100 000. During this period, no significant overall trend emerged.
Women saw an increasing trend in AAMR, which may be explained by shifting alcohol consumption patterns alongside a distinct “medicalized” pathway to impairment and physiological vulnerabilities. Nationally, the prevalence of alcohol use disorder and high-risk drinking has increased significantly faster among women (83.7%) than among men (34.7%) over the last 2 decades. 19 Furthermore, women achieve higher blood alcohol concentrations and experience greater motor impairment than men after consuming equivalent amounts of alcohol due to lower total body water and decreased gastric alcohol dehydrogenase activity. 20 Women are also at a greater risk of conditions such as anxiety, insomnia, and depression and are more likely to be prescribed opioids and sedatives, which can impair driving and increase the risk of fatal accidents.21-23 In fact, CDC data from 1999 to 2016 showed that deaths from prescription opioid overdoses increased seven-fold among women, compared with a four-fold increase among men. 24 This prescription bias may interact with biological susceptibility. Women are particularly vulnerable to the psychological and physiological effects of substances, with more rapid progression from use to dependence compared to men.25,26
An important aspect of this study is the rise in female mortality rate was not uniform across demographic subgroups. Our analysis potentially identifies a high-risk cohort driving this rise: white women, particularly residing in the West region of the United States. This increase in mortality rate for both subgroups highlights the dangerous intersection between demographics and regional drug market. This trend aligns with studies and the broader “Deaths of Despair” phenomenon, where socioeconomic distress and limited mental health infrastructure in rural areas drive self-medication behaviors among white populations and the rising mortality from drug-related causes, including accidental overdoses and impaired driving-related deaths.27-29 This ethnic divergence stems from both iatrogenic factors and profound relative deprivation. Working-class white Americans have suffered a decades-long erosion of historical economic expectations and struggled to adapt, whereas marginalized communities rely on established sociocultural buffers against such structural inequities. 30 Furthermore, implicit racial biases in clinical pain management led to white patients disproportionately receiving highly addictive opioid prescriptions, structurally leading to the initial substance crisis within these communities. 31 Crucially, this vulnerability is compounded by the unique drug landscape of the West. Regional models confirm that in the West, women have a significantly higher drinking baseline than the national US median of 56.0%. This creates a larger population “pool” that is at risk of escalating to excessive use. 32 Between 2005 and 2012, heavy drinking among women in these counties also increased by 38.1% (more than double the 18.3% increase observed in men). 32 Ellis et al identified this region as being most severely impacted by the opioid and methamphetamine epidemics between 2011 and 2017, and both substances strongly linked to increased MVA fatality risk. 33 Considering, women often initiate methamphetamine use at an earlier age than men, and the widespread availability of this substance in Western states might contribute to the specific rise in female mortality observed in this region. 34
Although men did not show a significant upward trend, they consistently experienced substantially higher mortality rates than women across all demographics. Men, as compared to women, are significantly more likely to engage in high-risk behaviors such as driving under the influence, have higher rates of heavy alcohol use, and polysubstance involvement, and are less likely to seek treatment for substance use (resulting in longer, more severe trajectories of substance use). All of these are strongly associated with MVA fatalities.25,35-37 However, men in the Northeast exhibited a significant decline in mortality. This may reflect the region’s stronger public health infrastructure. The Northeast leads the nation in health care quality benchmarks, suggesting that comprehensive prevention strategies can effectively mitigate these trends. 38
The above-mentioned regional differences can possibly be explained by the large scale migration to the West, which has driven the rapid urban sprawl and “the suburbanization of poverty.”39,40 This expansion forces economically vulnerable populations into car-dependent areas that lack public transport. This environment might be particularly detrimental for women, whose complex, multi-stop driving patterns for combined household and occupational duties (“trip chaining”) force a higher frequency of daily car trips than of men. 41 In a sprawling environment, this continuous structural reliance on personal vehicles can amplify their fatal crash exposure, especially as female substance use vulnerabilities rise. 42 Conversely, the decline observed in males in the Northeast may be explained by the regions migration patterns and infrastructure. The relocation of young, working age population to the West, shifts the highest at risk-of-MVA demographic out of the Northeast.43,44 Further, the remaining population benefits from older, high-density urban cores and robust public transit systems. By providing accessible alternatives to driving, this transit-oriented environment structurally has led to Northeast having the lowest overall per capita vehicle reliance and possibly mitigating MVA risk exposure in males.45,46
While black individuals did not demonstrate temporal trends, black men had notably high AAMRs, throughout the 2 decades. Historically, black communities were less impacted by the initial wave of the prescription opioid crisis. However, more recent research points to a sharp increase in synthetic opioid-related deaths, particularly involving fentanyl, within black populations. 47 This surge became especially pronounced after 2016, which may be too recent to generate a statistically significant trend across the entire 1999 to 2020 timeline. 47 The persistently high rates among black men may also reflect deep-rooted systemic disparities, including limited access to treatment and reliance on punitive measures over public health interventions.48,49
Interestingly, older men (aged 65 and above) also exhibited a significant upward trend in AAMR over the study period. This is a significant trend that may be explained by changing drug use demographics and vulnerabilities in aging populations. Recent evidence highlights increasing alcohol and drug use among older adults, including the use of prescription opioids, benzodiazepines, and illicit drugs.50,51 Polypharmacy, common in older adults, can exacerbate the impairing effects of substances on driving ability, including slowed reaction time, cognitive deficits, and sedation. 52 There is also a lack of age-appropriate substance use screening and treatment in geriatric populations, potentially leading to underdiagnosed and undertreated substance use disorders. 53
It is critical to contextualize the role of alcohol, which accounted for 77% of the deaths in this time period. This overwhelming predominance means that overall stable mortality rate for the whole population, is largely a reflection of the decreasing mortality rate of alcohol-specific MVA mortality, which masks the surge in non-alcohol substance use. The decline in alcohol mortality likely reflects the cumulative success of public health interventions (eg, zero-tolerance laws) and the proliferation of ridesharing services, which have been associated with a quantifiable reduction in alcohol-involved traffic fatalities. 54 However, these counter measures have not mitigated the effect of drug-impaired mortality. Further, we should cautiously view this decrease considering the evolving nature of “alcohol related” mortality; recent toxicology data indicate a growing prevalence of polysubstance impairment (eg, alcohol combined with opioids), a synergy that increases fatal crash risk exponentially compared with either substance alone. 55 Thus, the public health victory in reducing drunk driving is being complicated by a more complex crisis of drug-impaired and polysubstance-involved roadway mortality.
The rising prominence of cannabis-related MVA mortality also warrants specific exploration, particularly regarding its shifting legal landscape. Although driving under the influence of cannabis (DUIC) is illegal nationwide and carries standard DUI penalties, such as steep fines and possible jail time, the enforcement remains inconsistent. Unlike alcohol, there is no universal scientific or legal impairment standard comparable to a 0.08 BAC limit. 56 Even though the commercialization of recreational cannabis is increasingly associated with rising fatal collisions, 57 systematic data limitations prevent the isolation of cannabis trends within this longitudinal analysis. The National Highway Traffic Safety Administration (NHTSA) notes, laboratory tests are costly and most state statutes do not legally distinguish between alcohol and drug impairment penalties. As such, drivers are frequently not tested for secondary drugs like cannabis if alcohol is already present. 58 Furthermore, standard toxicology frequently detects residual, inactive cannabinoids weeks after use, indicating mere drug presence rather than active impairment at the time of the crash. This lack of uniform, reliable toxicological data possibly pushed cannabis-specific queries below CDC WONDER’s suppression thresholds in this analysis, necessitating the broader alcohol versus non-alcohol dichotomy and preventing a direct quantification of localized legalization impacts.
Clinical Implications
Our findings have strong public health implications. First, the divergence between falling alcohol rates and rising drug deaths necessitates a shift in enforcement; reliance on breathalyzer testing may fail to detect the growing burden of drug-impaired driving. The rise among women highlights the need for sex-specific prevention, including better screening in health care settings. Regionally, the marked increase in the West calls for targeted infrastructure addressing the psychostimulant crisis. The rising mortality among white women and persistently high rates among black men highlight the intersection between race and systemic inequities. Specifically, the black population requires vigilant monitoring due to the rapid proliferation of synthetic opioids (fentanyl) in these communities. This poses a severe risk of precipitating a future rise in MVA mortality, particularly among black men who already face high baseline fatality rates. Lastly, the increasing mortality among older men emphasizes the need to include older adults in routine substance use screening and update guidelines around polypharmacy and driving. It must be acknowledged that as an observational study, these findings identify populations at risk but cannot infer direct causality.
Limitations
Our study has some limitations that should be considered. First, this is a retrospective study based on death certificate data from the CDC WONDER database, which may be subject to misclassification or underreporting. The accuracy of cause of death coding, especially in cases involving polysubstance use or uncertain intoxication status, is variable and can result in underestimation or misattribution of substance-related MVA deaths. Second, our analysis only includes fatal MVAs and does not account for nonfatal but serious injuries related to substance use. This limits our ability to capture the full burden of substance-related driving impairment and may underestimate the public and health care impact of this issue. Third, the observed rise in non-alcohol substance involvement may partly reflect the increasing availability and sophistication of postmortem toxicology testing over the study period, rather than solely an increase in prevalence. Fourth, the CDC WONDER system suppresses data deemed statistically unreliable due to small counts. As a result, several subgroup estimates, particularly for older women and women in the Northeast, were excluded or limited, potentially biasing our understanding of trends in these populations. Fifth, although specific ICD-10 codes exist for distinct drug classes, we stratified primarily by alcohol versus non-alcohol causes because further stratification into specific drug types (eg, separating opioids from stimulants, separating cannabis from the whole cohort) frequently yielded suppressed or statistically unreliable estimates due to low case counts. Sixth, nationwide legislative changes regarding alcohol and cannabis may have influenced enforcement and crash reporting standards, introducing potential period effects. Finally, our findings are based on population-level trends and cannot be used to infer causation at the individual level.
Conclusion
Our study captures a thorough analysis of mortality trends due to substance use–related MVAs in the United States from 1999 to 2020, exhibiting significant disparities across sex, age, race, and geographic regions. While the overall AAMR remained stable, this stability obscures a critical public health divergence: The successful reduction in alcohol-specific fatalities is being offset by a rapidly escalating crisis of drug-impaired driving. Beneath this stability, we identified emerging high-risk demographic subgroups; white women in the Western United States and Older men, possibly reflecting demographic at risk from psychostimulants and polypharmacy. These findings necessitate an immediate modernization of road safety strategies, transitioning from an alcohol-centric enforcement model to the one that integrates widespread drug impairment testing and prevention efforts must move beyond broad campaigns to include sex, race, and age-specific clinical screening and regionally tailored interventions to target demographics that were previously considered low risk.
Supplemental Material
sj-docx-1-saj-10.1177_29767342261452632 – Supplemental material for Substance Use and Motor Vehicle Accident Mortality in the United States: A 22-Year National Analysis
Supplemental material, sj-docx-1-saj-10.1177_29767342261452632 for Substance Use and Motor Vehicle Accident Mortality in the United States: A 22-Year National Analysis by Abdullah Ahmad, Muhammad Ahmad Nadeem, Asad Gul Rao, Abdul Rafeh Awan, Abdullah Khan, Ahsan Raza Raja, Arlin A. Bustillos, Mohammed A. Quazi, Jibran Ikram, Asad Ullah, Abu Baker Sheikh and Amir Humza Sohail in Substance Use & Addiction Journal
Footnotes
Acknowledgements
The authors utilized Google’s Gemini large language model (LLM) during the preparation of this manuscript for the sole purpose of checking grammar. The AI model was not used for data generation, data analysis, or citation creation. All aspects of the research and analysis writing were designed exclusively by the authors, who take full responsibility for the integrity and content of this work. In accordance with journal policy, the AI model is not listed as an author.
Author Contributions
Abdullah Ahmad: Conceptualization, data curation, formal analysis, investigation, writing—original draft. Muhammad Ahmad Nadeem: Conceptualization, data curation, formal analysis, investigation, writing—original draft. Asad Gul Rao: Data curation, investigation, writing—original draft. Abdul Rafeh Awan: Conceptualization, supervision, validation, writing—review and editing. Abdullah Khan: Writing—review and editing, visualization. Ahsan Raza Raja: Writing—original draft, visualization. Arlin A. Bustillos: Writing—review and editing, validation. Mohammed A. Quazi: Formal analysis, methodology, software, writing—review and editing. Jibran Ikram: Data curation, formal analysis, methodology. Asad Ullah: Writing—review and editing, validation. Abu Baker Sheikh: Conceptualization, writing—review and editing. Amir Humza Sohail: Supervision, writing—review and editing. All authors have read and approved the final version of the manuscript. Abdullah Ahmad and Muhammad Ahmad Nadeem contributed equally to this work and are considered co-first authors.
Funding
The authors received no financial support for the research, authorship, and/or publication of this article.
Declaration of Conflicting Interests
The authors declared no potential conflicts of interest with respect to the research, authorship, and/or publication of this article.
Supplemental Material
Supplemental material for this article is available online.
References
Supplementary Material
Please find the following supplemental material available below.
For Open Access articles published under a Creative Commons License, all supplemental material carries the same license as the article it is associated with.
For non-Open Access articles published, all supplemental material carries a non-exclusive license, and permission requests for re-use of supplemental material or any part of supplemental material shall be sent directly to the copyright owner as specified in the copyright notice associated with the article.