
Abstract
Background:
Driven by concerns of gabapentin misuse and other harms, Kentucky (KY) and West Virginia (WV) became the first states to classify gabapentin as a schedule V controlled substance in July 2017 and June 2018, respectively. This study examined the association of these policies with gabapentin utilization among Medicaid beneficiaries.
Methods:
Using a controlled interrupted time series design, we modeled a segmented generalized least squares regression and calculated the immediate and trend changes of gabapentin prescriptions among Medicaid enrollees in 2 states (KY, WV), separately. North Carolina (NC) was used as a control to account for secular changes; there was no controlled substance designation for gabapentin in NC during the study period. Total outpatient prescriptions per quarter (Q) were calculated from Medicaid’s publicly available State Drug Utilization Data, and rates were established using state-specific combined Medicaid and CHIP average enrollment for the period 2016 to 2019. Multiple sensitivity analyses were performed, including a phase-in period model and internal negative control model, to assess robustness of results.
Results:
Overall, utilization rates of gabapentin were higher in KY and WV relative to NC throughout the study period. The gabapentin controlled substance classification in KY was associated with a sustained decrease in trend (−10.6 prescriptions per 1000 enrollees per quarter; 95% CI: −13.6, −7.6) relative to NC. An immediate decrease in prescription rate (−18.9 prescriptions per 1000 enrollees; 95% CI: −32.7, −5.1) and a sustained decrease in trend (−3.8 prescriptions per 1000 enrollees per quarter; 95% CI: −7.1, −0.5) was observed in WV relative to NC.
Conclusions:
Our results show an association between decreased gabapentin utilization among Medicaid enrollees and classifying gabapentin as a schedule V controlled substance in KY and WV. Future research should focus on fully understanding the policy’s impact on other populations and potential unintended or downstream effects.
Highlights
Kentucky (KY) and West Virginia (WV) were the first states to schedule gabapentin medications.
Gabapentin dispensing immediately fell for Medicaid after scheduling in KY and WV.
A sustained decline in gabapentin dispensing was seen in KY postscheduling.
Introduction
Despite having only 3 Food and Drug Administration (FDA)-approved uses (postherpetic neuralgia, partial onset seizures, and restless legs syndrome), 1 prescribing of gabapentin in the United States has increased over time, 2 with an estimated 83% to 95% of all use being off-label for a wide variety of conditions such as neuropathic pain, bipolar disorder, and drug and alcohol withdrawal.3-5 These high levels of off-label use, combined with increasing reports of misuse and dependence, require attention in the context of the drug overdose crisis in the United States. Individuals who are current or past nonmedical opioid or benzodiazepine users may be particularly vulnerable to misuse and its associated harms. 6 One cross-sectional study of US adults found that prior treatment for substance use disorder was predictive of gabapentinoid misuse or obtainment. 7 Another study found that 22% of opioid-dependent patients used higher amounts of gabapentin than prescribed or used gabapentin without a valid prescription. 8 The most recent systematic review on gabapentin misuse has shown increasing evidence of an association between gabapentin misuse and opioid use disorder (OUD). 9
To address misuse and its associated harms, 24 states in the United States have enacted policies related to gabapentin as of early 2025, either scheduling gabapentin as a schedule V controlled substance, mandating prescription drug monitoring, or a combination of both. 10 Kentucky (KY) and West Virginia (WV) were the first 2 states to schedule gabapentin as a controlled substance in July 2017 and June 2018, respectively, and 6 additional states have followed suit. 10 Scheduling policies have been shown to decrease prescribing and utilization11,12 which may in turn decrease misuse. For gabapentin specifically, state-level schedule V classifications have been shown to decrease total days’ supply among Medicare beneficiaries. 13 However, the effect of these policies on Medicaid-insured patients is currently unknown.
Medicaid beneficiaries as a population typically reflect a wider range of health statuses, including those that are low-income, chronically ill, and/or disabled. 14 Relative to the United States as a whole, minoritized racial and ethnic groups are overrepresented in the Medicaid population, with about 60% of enrollees identifying as some other race than White. 15 Adults with OUD are also overrepresented in Medicaid with 38% of nonelderly adults with OUD covered, more than twice the share of all nonelderly adults covered (16%). 16 Additionally, as high as 40% of Medicaid beneficiaries who initiated gabapentin in a primary care setting have no documented follow-up. 3 Thus, understanding the impact of state-level scheduling of gabapentin in the Medicaid population is of particular importance given its diverse population and potential for treatment disparities to prevent unintended harm.
Objective
The purpose of this study was to evaluate, using a controlled interrupted time series analysis, the association between KY’s and WV’s classification of gabapentin as a schedule V controlled substance and outpatient gabapentin prescriptions reimbursed by state Medicaid programs, compared with prescriptions in North Carolina (NC) (where no such policy was enacted) during the period 2016–2019.
Methods
Study Population
The study population included all individuals enrolled in Medicaid that are eligible to receive outpatient medications paid for by the Medicaid Drug Rebate Program 17 in the states under study (KY, WV, and NC) from quarter one (Q1) 2016 to quarter four (Q4) 2019. Medicaid is a joint federal and state-run program that covers medical care costs for adults and children with limited income and resources. This population includes eligible children, adults, pregnant women, older adults, and people with disabilities. 18
Data Sources
Dispensing data were extracted from the publicly available State Drug Utilization Data (SDUD) provided by Medicaid. 19 The SDUD cover all outpatient prescription medications paid for by the Medicaid Drug Rebate Program 17 and do not include outpatient prescription drugs for dual-eligible beneficiaries whose prescription coverage is provided by Medicare Part D. Aggregated counts of dispensed medications by drug name, National Drug Code (NDC), and plan type are reported quarterly by state. Any counts with values less than 11 are suppressed for confidentiality. 19 To establish the quarterly rates in KY and WV, we estimated the denominator for individuals who are eligible for comprehensive Medicaid benefits using the monthly Medicaid and CHIP enrollment reports gathered by the Kaiser Family Foundation (KFF) from the Centers for Medicare and Medicaid Services (CMS) Eligibility and Enrollment Reports. 20 Beginning in June 2017, several states revised their enrollment reporting methodology to better align with CMS criteria. 20 This change led to an immediate drop of approximately 300 000 Medicaid enrollees in NC which could result in an overestimate of dispensing rates in NC from June 2017 onward. To limit bias resulting from this reporting change and as a more conservative approach for rate estimation, we used Medicaid and CHIP enrollment data directly from the NC Medicaid office 21 to ensure consistency in measurement throughout the study period.
Timing of Intervention (Schedule V Controlled Substance Designation)
Effective July 1, 2017, KY added gabapentin to the list of schedule V controlled substances. This designation also in turn mandated reporting of gabapentin prescriptions in the state’s electronic prescription drug monitoring program (PDMP). 22 KY’s intervention was modeled at Q3 2017 to align with these policy changes. Eleven months after KY’s policy change, WV expanded their controlled substance listing to include gabapentin on June 7, 2018. WV was already tracking gabapentin prescriptions in their PDMP prior to this controlled substance classification. 22 As data were only available quarterly, and given that the intervention occurred toward the end of a quarter, we modeled WV’s intervention at Q3 2018.
Trends were only assessed until Q4 2019 as we were interested in the immediate and sustained effects around the time of the policy’s implementation. Inclusion of longer post-policy time periods could introduce additional co-interventions or alternative causes that may influence gabapentin utilization trends, such as the COVID-19 pandemic and its associated disruptions to health services23,24 or new black box warnings from the FDA.25,26 Analyses were stratified by jurisdiction.
Control Selection
After a comprehensive policy surveillance approach, 10 NC was selected as the control state for our primary analyses to account for secular changes because (1) NC had not classified gabapentin as a schedule V controlled substance or mandated reporting in the state’s PDMP during the study period, 22 (2) NC is in the same geographic region (Southeast, Appalachian US), and (3) NC had no other gabapentin-specific interventions during the time period.
Outcome Definition
We measured the quarterly rate of gabapentin prescriptions among Medicaid enrollees. Gabapentin prescriptions were systematically identified by NDC using First Databank, a licensed database, to capture prescriptions across dosages and manufacturers. Identified prescriptions in the SDUD included product names “gabapentin,” “Neurontin,” “Gralise,” “Horizant,” “Gralise ER,” and “Horizant E.” We averaged the monthly Medicaid enrollment counts across each 3-month period to compute quarterly rates per 1000 Medicaid enrollees.
Statistical Analysis
We used a controlled interrupted time series (CITS) design27-29 to measure the immediate level change and trend change of gabapentin prescriptions among Medicaid enrollees following the state-level controlled substance classification relative to the control. Interrupted time series designs focus on before-after comparisons within a single population which minimizes the impact of between group differences that can occur due to selection bias and confounding.27,30,31 However, without the use of a control group, the impact of secular trends or co-occurring interventions around the time of the exposure cannot be properly accounted for and the internal validity of the analysis is compromised. CITS, by nature of its design, controls for time-varying confounders, including co-occurring events, in both the control and intervention group. 28
Our statistical model was a segmented generalized least squares linear regression, adjusting for autoregressive moving averages. Models were fit with an intervention point (interruption) at the quarter of schedule V classification, and analyses were conducted separately for each intervention state (KY and WV). Autoregressive and moving average parameters were determined by assessing the autocorrelation and partial autocorrelation functions. Our model assumes that (1) in the absence of the intervention, the outcome of interest would have continued the state-specific, observed preintervention trend, (2) the outcomes follow a linear trend, and (3) there were no external interventions that differently affected the intervention and control group.
After visual inspection of the data, an outlier, or “wild point,” was observed in Q3 2017 for WV. A wild point is a value in interrupted time series that is highly inconsistent with the values observed throughout the study period and can reflect anticipatory effects, data quality issues, or a known or unknown, short-term global event affecting the population of interest.32,33 On July 1, 2017, in WV, all managed care pharmacy services were shifted to a fee-for-service structure 34 which appears to have resulted in a short-term dramatic decrease in prescriptions reported by Medicaid. To address this wild point and reduce its impact on the prepolicy trend, we included a wild point indicator variable in the models for WV which produced a separate coefficient.32,33
Sensitivity Analyses
Multiple sensitivity analyses were conducted to assess (1) model specification, (2) interruption specification, (3) control selection, and (4) suppressed data. Model specification: We ran single interrupted time series models without control separately for KY and WV and also modeled WV without the wild point. Interruption Specification: We modeled a 1 quarter phase-in period at the start of the postclassification period to assess the impact of this period on level and trend change. 35 We also conducted exploratory analyses using joinpoint regression methods to identify significant variations in the trend of prescription fills without specifying a strict interruption. Joinpoint analysis produces the simplest model that identifies all significant trend changes with no a priori selection of an intervention timepoint and can be useful when describing trends over a period of rapid policy change.36,37 Control selection: We ran a separate CITS model using an internal negative control outcome design rather than using NC as a comparator. 38 We used pregabalin prescription dispensing data reported by the SDUD for KY and WV, respectively. Pregabalin was chosen as the internal negative control because it is also a gabapentinoid medication with some similar indications to gabapentin and could potentially serve a similar patient population of individuals with pain 39 who often have complex treatment challenges. Since pregabalin has been scheduled federally as a controlled substance (schedule V) since its FDA approval date 40 and pregabalin is typically more expensive than the dose-equivalent gabapentin, we would not expect prescriber substitution related to the implementation of gabapentin scheduling policies as both medications would share the same legal regulations. Suppressed data: We conducted quantitative bias analysis 41 to measure the effects of this suppressed data in the 2 most extreme cases. For Hypothetical Case A, for the prepolicy period, we imputed a value of 10 for all suppressed counts for the intervention group and 0 for the control group, and for the postpolicy period, we imputed a value of 0 for the intervention group and 10 for the control group. For Hypothetical Case B, for the prepolicy period, we imputed a value of 0 for all suppressed counts for the intervention group and 10 for the control group, and for the postpolicy period, we imputed a value of 10 for the intervention group and 0 for the control group.
Ethics Statement and Study Reporting
This study was considered exempt by the University of North Carolina at Chapel Hill’s Institutional Review Board. Consistent with recommendations from the American Statistical Association, 42 we examined directionality, magnitude, and precision when discussing observed policy impacts. All analyses were conducted using SAS 9.4 (SAS Institute, Cary, NC, USA), R version 4.4 (R Project for Statistical Computing), and the Joinpoint Software from the National Cancer Institute. 43 Results from this study follow the Transparent Reporting of Evaluations with Nonrandomized Designs (TREND) 44 guidelines.
Results
Kentucky
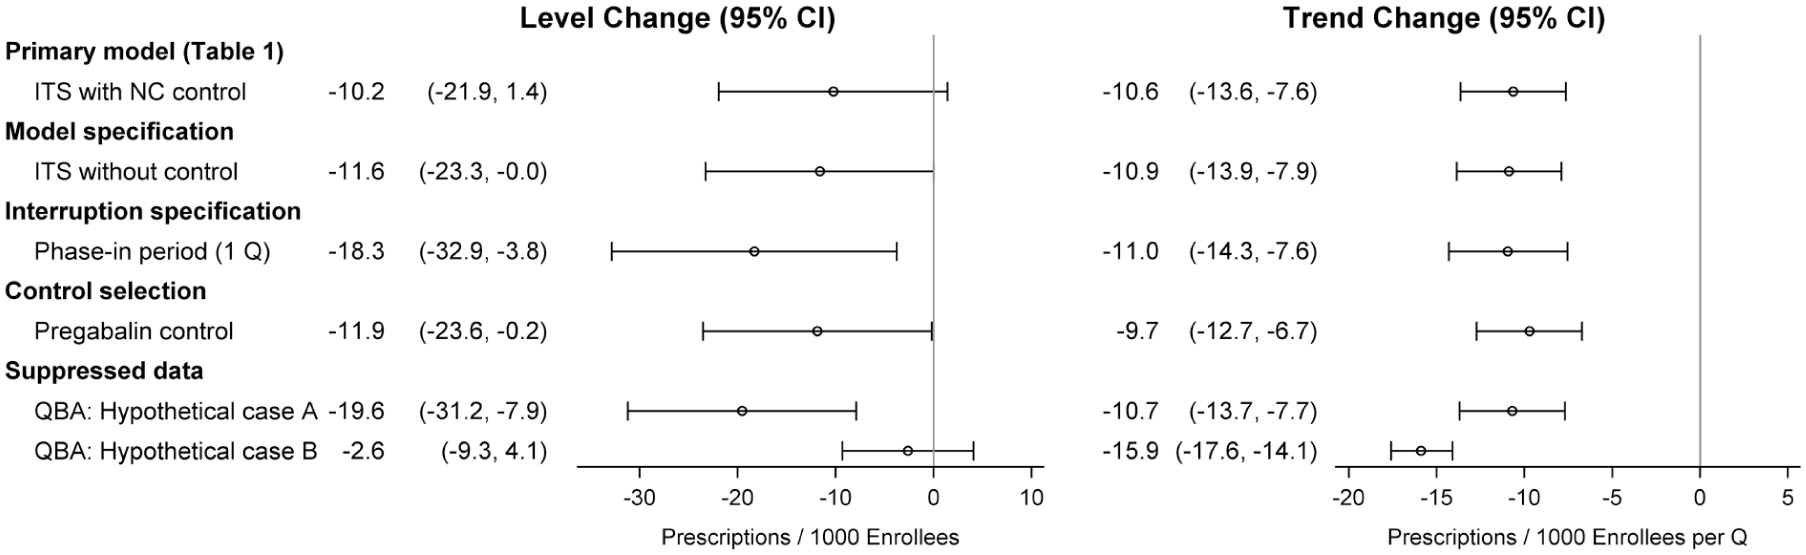
From Q1 2016 to Q4 2019, a total of 2 302 556 gabapentin prescriptions in KY were paid for by Medicaid and approximately 43% of these disbursed prescriptions occurred prior to the policy implementation date. Utilization rates were higher in KY compared to NC for the entirety of the study period. Table 1 includes the coefficient estimates for the primary CITS model with NC as the control. Prior to the policy, gabapentin dispensing was increasing among Medicaid enrollees in KY relative to NC at a rate of 4.7 prescriptions per 1000 enrollees per quarter (95% CI: 1.5, 7.8). The gabapentin controlled substance classification in KY was associated with a sustained decrease in trend (−10.6 prescriptions per 1000 enrollees per quarter; 95% CI: −13.6, −7.6) relative to NC (Table 1, Figure 1). Though not statistically significant, there was also an immediate decrease in prescription rate (−10.2 prescriptions per 1000 enrollees; 95% CI: −21.9, 1.4). Across the sensitivity analyses conducted, results were stable with the largest deviations observed in the hypothetical quantitative bias analyses (Figure 2, eTables 1-5, eFigures 1-5). Allowing for a one quarter phase-in period, the magnitude of the immediate change in dispensing was higher than the primary model at −18.3 prescriptions per 1000 enrollees (95% CI: −32.9, −3.8); however, the confidence intervals mostly overlapped (eTable 2, eFigure 2). When compared to pregabalin dispensing, the policy’s implementation was associated with a decrease in gabapentin dispensing of −11.9 prescriptions per 1000 enrollees (95% CI: −23.6, −0.2), and a decreasing trend of −9.7 prescriptions per 1000 enrollees was observed (−12.7, −6.7) (eTable 5, eFigure 5).
Estimated Level and Trend Change in Prescription Rate Following Controlled Substance Classification, in Kentucky and West Virginia (Intervention States), Relative to Control (North Carolina), 2016 to 2019.
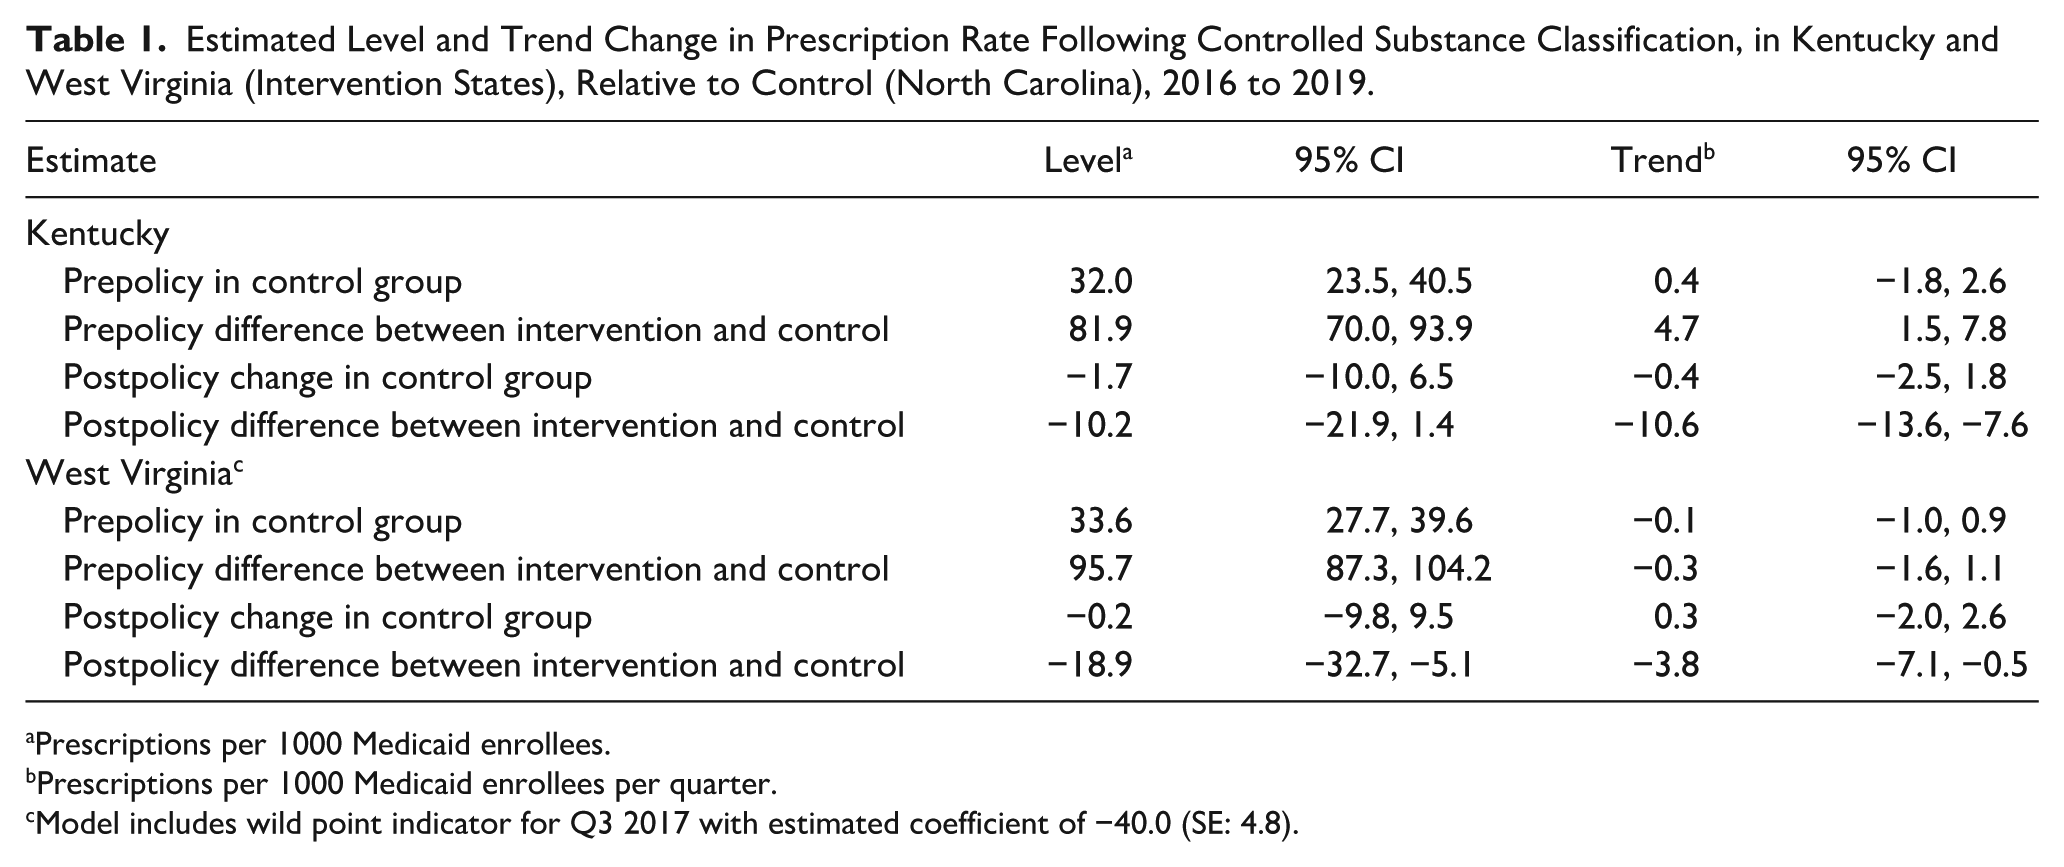
Prescriptions per 1000 Medicaid enrollees. b Prescriptions per 1000 Medicaid enrollees per quarter. c Model includes wild point indicator for Q3 2017 with estimated coefficient of −40.0 (SE: 4.8).
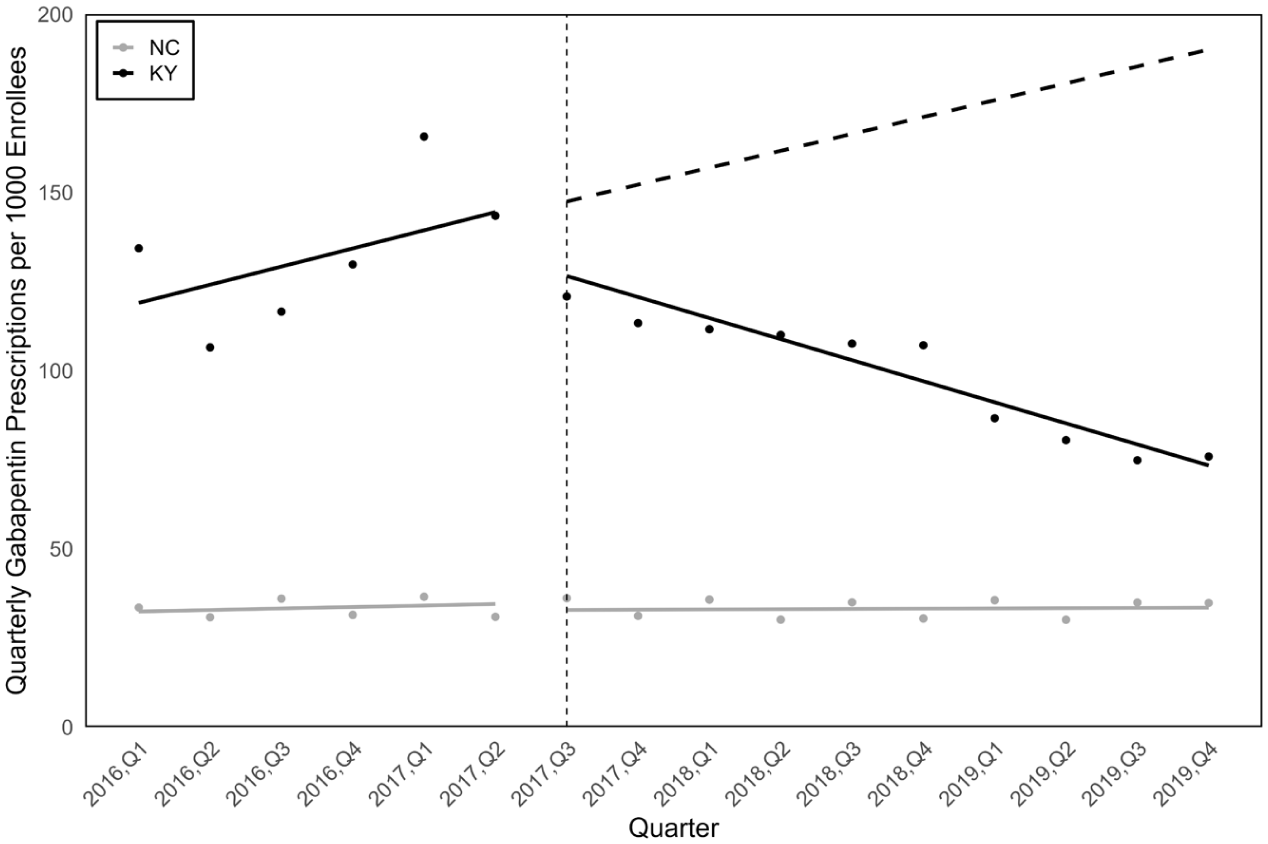
Quarterly gabapentin prescriptions among Medicaid enrollees in Kentucky, 2016 to 2019, with North Carolina control.
Comparison of level and trend estimates across sensitivity analyses, Kentucky.
West Virginia
A total of 977 548 gabapentin prescriptions were paid for by Medicaid in WV, with 70% disbursed prior to Q3 2018. Prior to the policy implementation, there was no evidence of a meaningful upward or downward trend in gabapentin dispensing in WV relative to NC (–0.3 prescriptions per 1000 enrollees per quarter; 95% CI: –1.6, 1.1). Similar to KY, the scheduling policy was associated with an immediate decrease in prescription rate (−18.9 prescriptions per 1000 enrollees; 95% CI: −32.7, −5.1) and a sustained decrease in trend (−3.8 prescriptions per 1000 enrollees per quarter; 95% CI: −7.1, −0.5) relative to NC (Table 1, Figure 3). Results were also stable across the sensitivity analyses with the largest deviations observed in the level in the internal negative control (Figure 4, eTables 6-11, eFigures 6-11). Allowing for a one quarter phase-in period, the magnitude of the immediate change in dispensing was slightly higher than the primary model at −22.3 prescriptions per 1000 enrollees (95% CI: −38.4, −6.2), though the confidence intervals mostly overlapped (eTable 2, eFigure 2). When compared to pregabalin dispensing, the policy’s implementation was associated with a decrease in gabapentin dispensing of −10.1 prescriptions per 1000 enrollees (95% CI: −11.9, −8.2); the decreasing trend of −4.2 prescriptions per 1000 enrollees per quarter (95% CI: −8.2, −0.1) was similar to other models (eTable 11, eFigure 11).
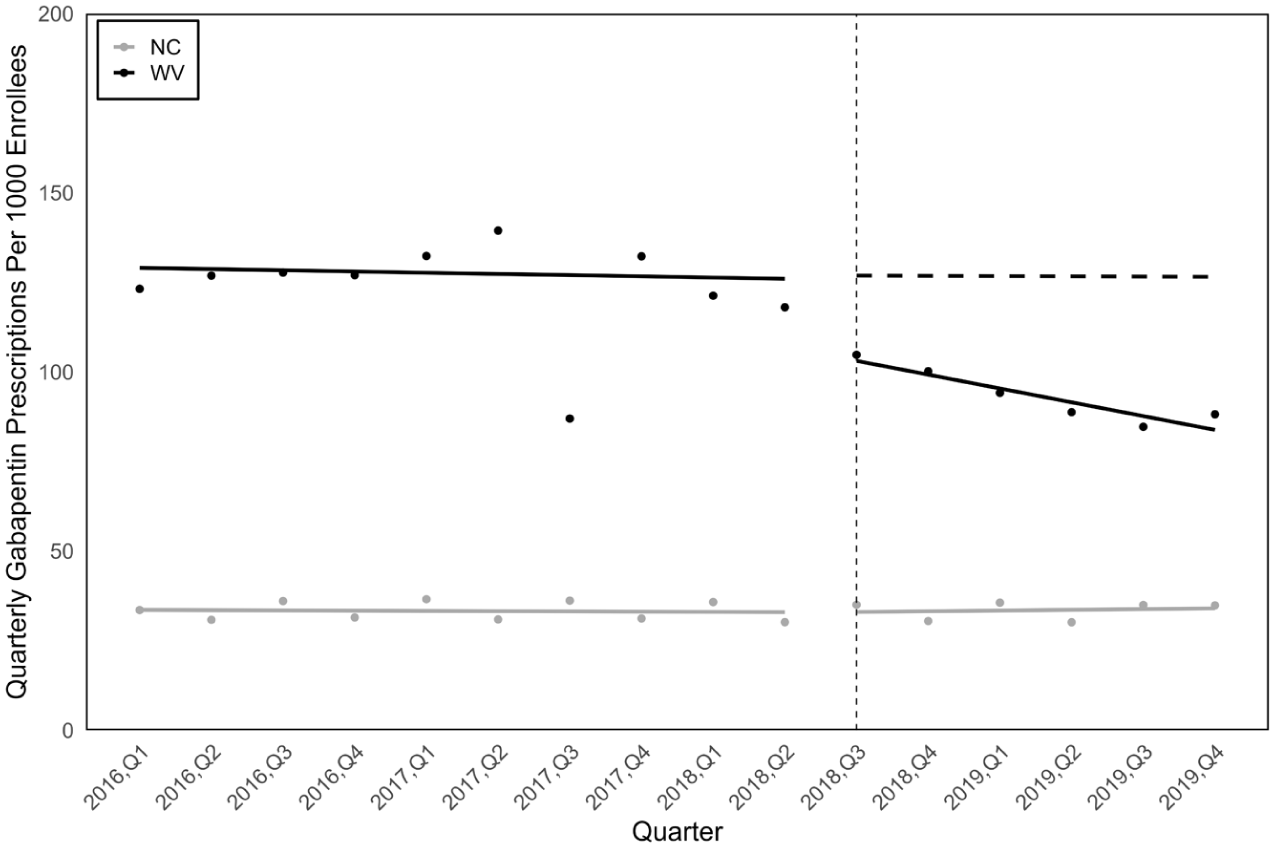
Quarterly gabapentin prescriptions among Medicaid enrollees in West Virginia, 2016 to 2019, with North Carolina control.
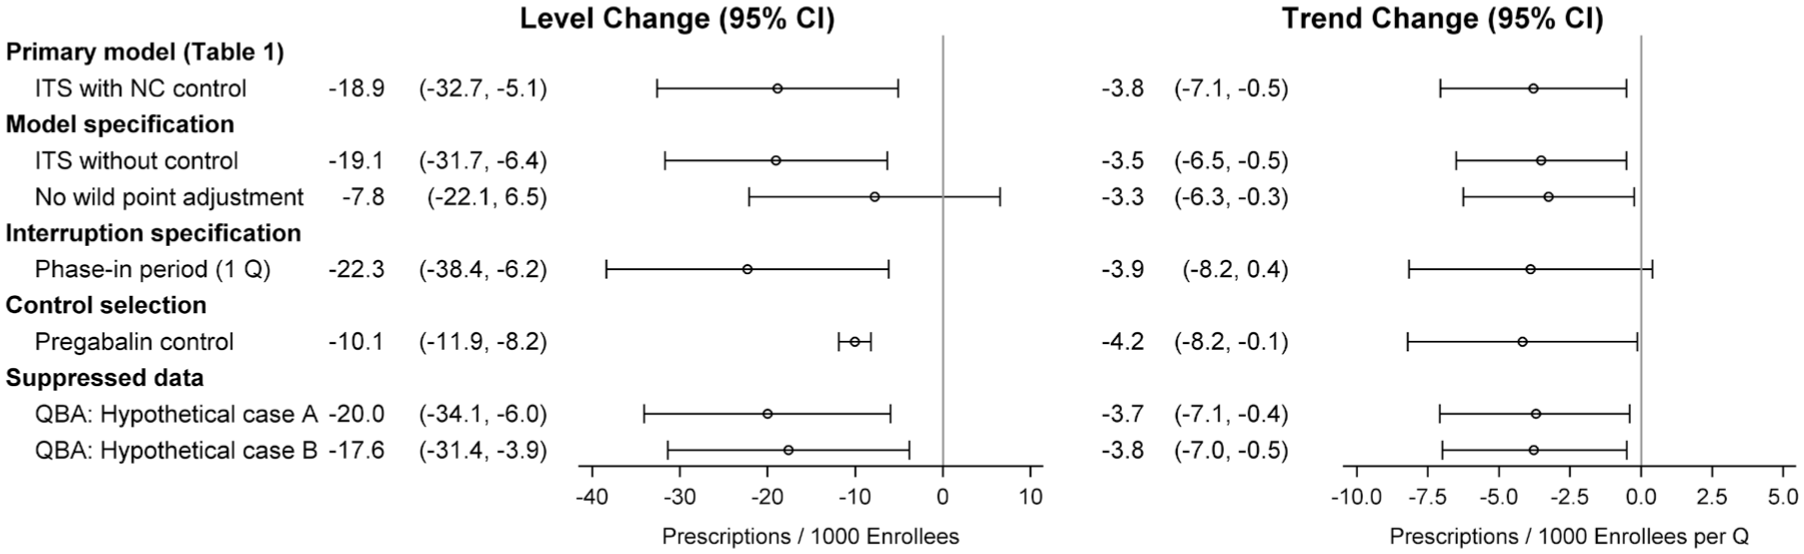
Comparison of level and trend estimates across sensitivity analyses, West Virginia.
Discussion
Classifying gabapentin as a schedule V controlled substance was associated with a sustained, decreasing trend postpolicy in both states and an immediate decrease in gabapentin prescribing in WV. Though not statistically significant, the magnitude of the immediate decrease in gabapentin prescribing in KY—and corresponding results from sensitivity analyses—suggests an association. Our models showed a stronger decreasing postpolicy trend in KY as compared to WV. This may be due to the co-occurrence of the new PDMP requirement at the time of KY’s scheduling policy in contrast with WV, where the PMDP requirement was established prior to the scheduling. Gabapentin utilization was also higher in our intervention states compared to the control state for the entirety of the study period. This may reflect differences in patient populations across states or differences in provider practices informed by state-specific characteristics. Despite these differences in baseline utilization rates, the association between the scheduling policy and changes in utilization level and trend are evident, both in the controlled and uncontrolled models.
The downward directionality of these results was observed in all models, including all sensitivity analyses. Notably, using pregabalin as our internal negative control, gabapentin dispensing also immediately decreased after the scheduling policy in both states, though the magnitude of effect was less pronounced than the location-based control results. Though the directionality was consistent with our other sensitivity analyses, this attenuation closer to the null may be due to some provider substitution of gabapentin with pregabalin. Our findings supplement other literature that demonstrated a reduction of 8.4 total days’ supply of gabapentin per Medicare enrollee per year in states with schedule V policies. 13 Gabapentinoid prescribing restrictions have also been shown to decrease utilization in international settings. In both France and Saudi Arabia, increased regulations on pregabalin also showed a marked decrease in overall prescribing.45,46 Together, the evidence points to prescribing regulations as one effective measure to reduce gabapentinoid prescribing.
Our results must be considered in the context of the policy’s clinical implications. Gabapentin misuse can lead to a variety of harms. For example, sustained overuse of gabapentin resulted in an 86% increase in diagnosis of altered mental state in an inpatient or emergency department setting 47 and overuse was associated with increased odds of all-cause and drug-related inpatient stays compared to individuals utilizing gabapentin without overuse. 47 Concurrent use of gabapentin with opioids has also been shown to increase the likelihood of respiratory depression or death. 47 However, gabapentin is still a safe, effective, and recommended medication for its FDA-approved indications and other off-label uses like diabetic neuropathy.1,5,48,49 Further, clinical needs do not decrease as the result of a scheduling policy, and yet, prescribers may be more hesitant to prescribe the medication due to increased scrutiny 50 and may lack knowledge of other alternatives, if available. Therefore, it is critical to ensure that any prescribing regulation policies do not perpetrate unintended harm,51-53 particularly among populations like Medicaid enrollees and individuals with substance use disorders who may already face barriers to healthcare and accessing treatment for pain.
This study has several limitations. First, our findings rely on Medicaid claims data and therefore, our results do not explore impacts of the schedule V policy on gabapentin obtainment outside of the Medicaid reimbursement system. This is particularly important given that the SDUD do not provide information for outpatient prescription drugs paid for by Medicare Part D for dual-eligible beneficiaries; given that gabapentin use is highest among older age groups 54 who are often covered by Medicare, our calculated rates for utilization among Medicaid enrollees are likely underestimated and do not represent changes in utilization across the overall patient population. The presence of any additional gabapentin-specific policy interventions in the selected states that occurred during the study period may introduce uncontrolled confounding. To better understand the potential impact of this limitation, we conducted policy surveillance to understand whether there were any other policies during the time period that likely impacted our outcomes of interest. In WV, mandated reporting of gabapentin in the state’s PDMP in July 2017, 22 prior to the schedule V controlled substance classification, may have altered prescribing. Other interventions that occurred throughout the study period, including the introduction of opioid restriction laws in all 3 states, expansions of harm reduction services and treatment programs, or changes in provider behavior related to increased knowledge of gabapentin misuse, may also have influenced gabapentin utilization patterns. Given the difficulties of disentangling these contemporaneous policies and interventions, we have interpreted our findings as associations between the policy’s implementation and changes in gabapentin utilization.
There may also have been spillover effects of KY’s scheduling felt in WV, a bordering state. To address this potential limitation, we included data prior to scheduling in either state to establish a stronger preclassification trend. The limited number of time points and the narrow length of the postclassification period, particularly in WV, may introduce instability and impact the observed trends; however, we believe that the inclusion of data during the early stages of COVID-19 could have likely introduced even more bias given the overwhelming evidence of healthcare disruptions during this time felt globally.23,24,55-57 Our selection of control (NC) could also impact our results if underlying differences in the population between the intervention and control impact gabapentin use. Inclusion of an aggregate control group or creation of a synthetic control could be explored, but this approach is limited by the inconsistent legal landscape across the country.
As these results only cover the impact of the scheduling policy on Medicaid enrollees with comprehensive benefits, they cannot be fully generalized to all residents of KY and WV and may also not generalize to Medicaid enrollees with limited benefits. Additionally, as Medicaid populations can vary across states due to sociodemographic differences or eligibility, the results may not fully represent the impact of scheduling policies on the very heterogenous group of Medicaid enrollees countrywide. Both KY and WV expanded Medicaid in 2014 as part of the Affordable Care Act allowing more individuals to qualify for the coverage. 58 NC did not expand Medicaid until 2023. 59 Medicaid expansion is, thus, not an additional policy that changed during our study period in any of our states. It is known, however, that expansion changes the demographic composition of the Medicaid beneficiaries, 60 which may introduce additional confounding. We also elected to use a different data source for our Medicaid enrollment for NC due to the changes in reporting methodology for the KFF Medicaid enrollment reports as these changes could have led to an overestimate of NC’s dispensing rates. Our decision to use a different NC enrollment data source, though more conservative for rate estimation, could still have introduced some bias. The publicly available SDUD data do not include demographic information; therefore, we were unable to assess any differences in policy effect by subgroup. In spite of these limitations, our extensive and robust sensitivity analyses, combined with the use of an internal negative control, all showed agreement on the directionality of the policy effects.
Conclusion
Classifying gabapentin as a schedule V controlled substance was associated with decreased dispensing among Medicaid enrollees in both KY and WV. Further research is necessary to understand the impacts of these policies on misuse overall, as well as its associated harms, including gabapentin-involved deaths. In particular, more nuanced research studying potential unintended effects of the policy will be imperative prior to more widespread implementation of these policies in the United States.
Supplemental Material
sj-pdf-1-saj-10.1177_29767342261456625 – Supplemental material for Decreased Gabapentin Prescription Fills Among Medicaid Enrollees Following State-Level Schedule V Controlled Substance Classification in Kentucky and West Virginia
Supplemental material, sj-pdf-1-saj-10.1177_29767342261456625 for Decreased Gabapentin Prescription Fills Among Medicaid Enrollees Following State-Level Schedule V Controlled Substance Classification in Kentucky and West Virginia by Katherine Gora Combs, Stephen W. Marshall, Rachel Vickers-Smith, Alan Kinlaw, Nabarun Dasgupta and Juan M. Hincapie-Castillo in Substance Use & Addiction Journal
Footnotes
Acknowledgements
ChatGPT version 5.0 (OpenAI) was used to assist in the customization of the figures in this manuscript.
Ethical Considerations
This study was considered exempt by the University of North Carolina at Chapel Hill’s Institutional Review Board.
Author Contributions
KGC: Conceptualization, Formal analysis, Funding acquisition, Methodology, Visualization, Writing—original draft, Writing—review and editing; SWM, RVS, AK, ND: Conceptualization, Methodology, Writing—review and editing; JHC: Conceptualization, Methodology, Visualization, Supervision, Writing—original draft, Writing—review and editing.
Funding
The authors disclosed receipt of the following financial support for the research, authorship, and/or publication of this article: This work was supported by the National Institute on Drug Abuse of the National Institutes of Health under award number R36DA062854. The content is solely the responsibility of the authors and does not necessarily represent the official views of the National Institutes of Health.
Declaration of Conflicting Interests
The authors declared no potential conflicts of interest with respect to the research, authorship, and/or publication of this article.
Data Availability Statement
Data used in this study are publicly available through the SDUD provided by the Centers for Medicare and Medicaid, the KFF Medicaid Enrollment Reports, and the NC Medicaid Enrollment Reports. The code lists from First Databank are available via license only; however, a comparable coding list is available for free from the ATHENA – OHDSI Vocabularies Repository (https://athena.ohdsi.org/). Analytical code is available upon request. The analytical dataset used in this analysis is included in the ![]() .
.
Additional Disclosure
Preliminary results from this manuscript were published as an abstract in Pharmacoepidemiology and Drug Safety after presentation at the 41st International Society for Pharmacoepidemiology Conference (DOI: 10.1002/pds.70186).
Supplemental Material
Supplemental Material for this article is available online.
References
Supplementary Material
Please find the following supplemental material available below.
For Open Access articles published under a Creative Commons License, all supplemental material carries the same license as the article it is associated with.
For non-Open Access articles published, all supplemental material carries a non-exclusive license, and permission requests for re-use of supplemental material or any part of supplemental material shall be sent directly to the copyright owner as specified in the copyright notice associated with the article.