






Abstract
Background:
Molecular subtyping of urothelial carcinoma (UC) into luminal and nonluminal lineages is clinically relevant for prognosis and emerging targeted therapies. Elevated peroxisome proliferator-activated receptor gamma (PPARG) expression is a defining feature of luminal UC and provides the biological rationale for FX-909, a first-in-class, orally bioavailable, selective PPARG inhibitor currently under clinical evaluation in luminal UC with high PPARG expression. However, RNA sequencing (RNA-seq), the standard approach for molecular subtyping, remains costly and difficult to implement broadly. An artificial intelligence (AI)-based histopathology platform may enable rapid, scalable, and practical identification of luminal tumors for FX-909 patient selection.
Methods:
We developed an AI-based computational pathology model to classify luminal versus nonluminal UC directly from hematoxylin and eosin (H&E)–stained whole-slide images (WSIs). An additive multiple-instance learning (aMIL) architecture with a lightweight ShuffleNet backbone was trained and evaluated across The Cancer Genome Atlas-derived UC specimens and independent validation UC cohorts, including an advanced-stage dataset. Model performance was assessed using the area under the receiver operating characteristic curve (AUROC). Reproducibility was measured across technical replicates and multiple tissue sections per case, and interpretability was evaluated using attention heatmaps highlighting regions contributing to model predictions.
Results:
The model achieved robust discrimination of luminal and nonluminal UC, with AUROC values exceeding 0.95 across validation cohorts and strong generalization to an independent advanced-stage cohort. Predictions were highly reproducible, with 95.2% concordance across technical replicates and 91.3% agreement in the classification of luminal/nonluminal subtypes across multiple tissue sections, indicating that a single representative section is sufficient for subtype assignment in most cases. Model probability scores were largely polarized, with most cases assigned high-confidence luminal or nonluminal predictions and a smaller subset showing intermediate probabilities consistent with mixed or heterogeneous features. Attention heatmaps provided interpretable visualization of histological regions driving predictions, supporting pathologist review and hypothesis generation.
Conclusion:
AI-driven analysis of routine H&E WSIs enables accurate, reproducible, and interpretable classification of UC molecular subtypes without RNA-seq. This scalable approach supports identification of PPARG-driven luminal tumors and provides a foundation for development of a novel companion diagnostic assay to potentially enable precision patient selection for FX-909, a first-in-class PPARG-targeting drug.
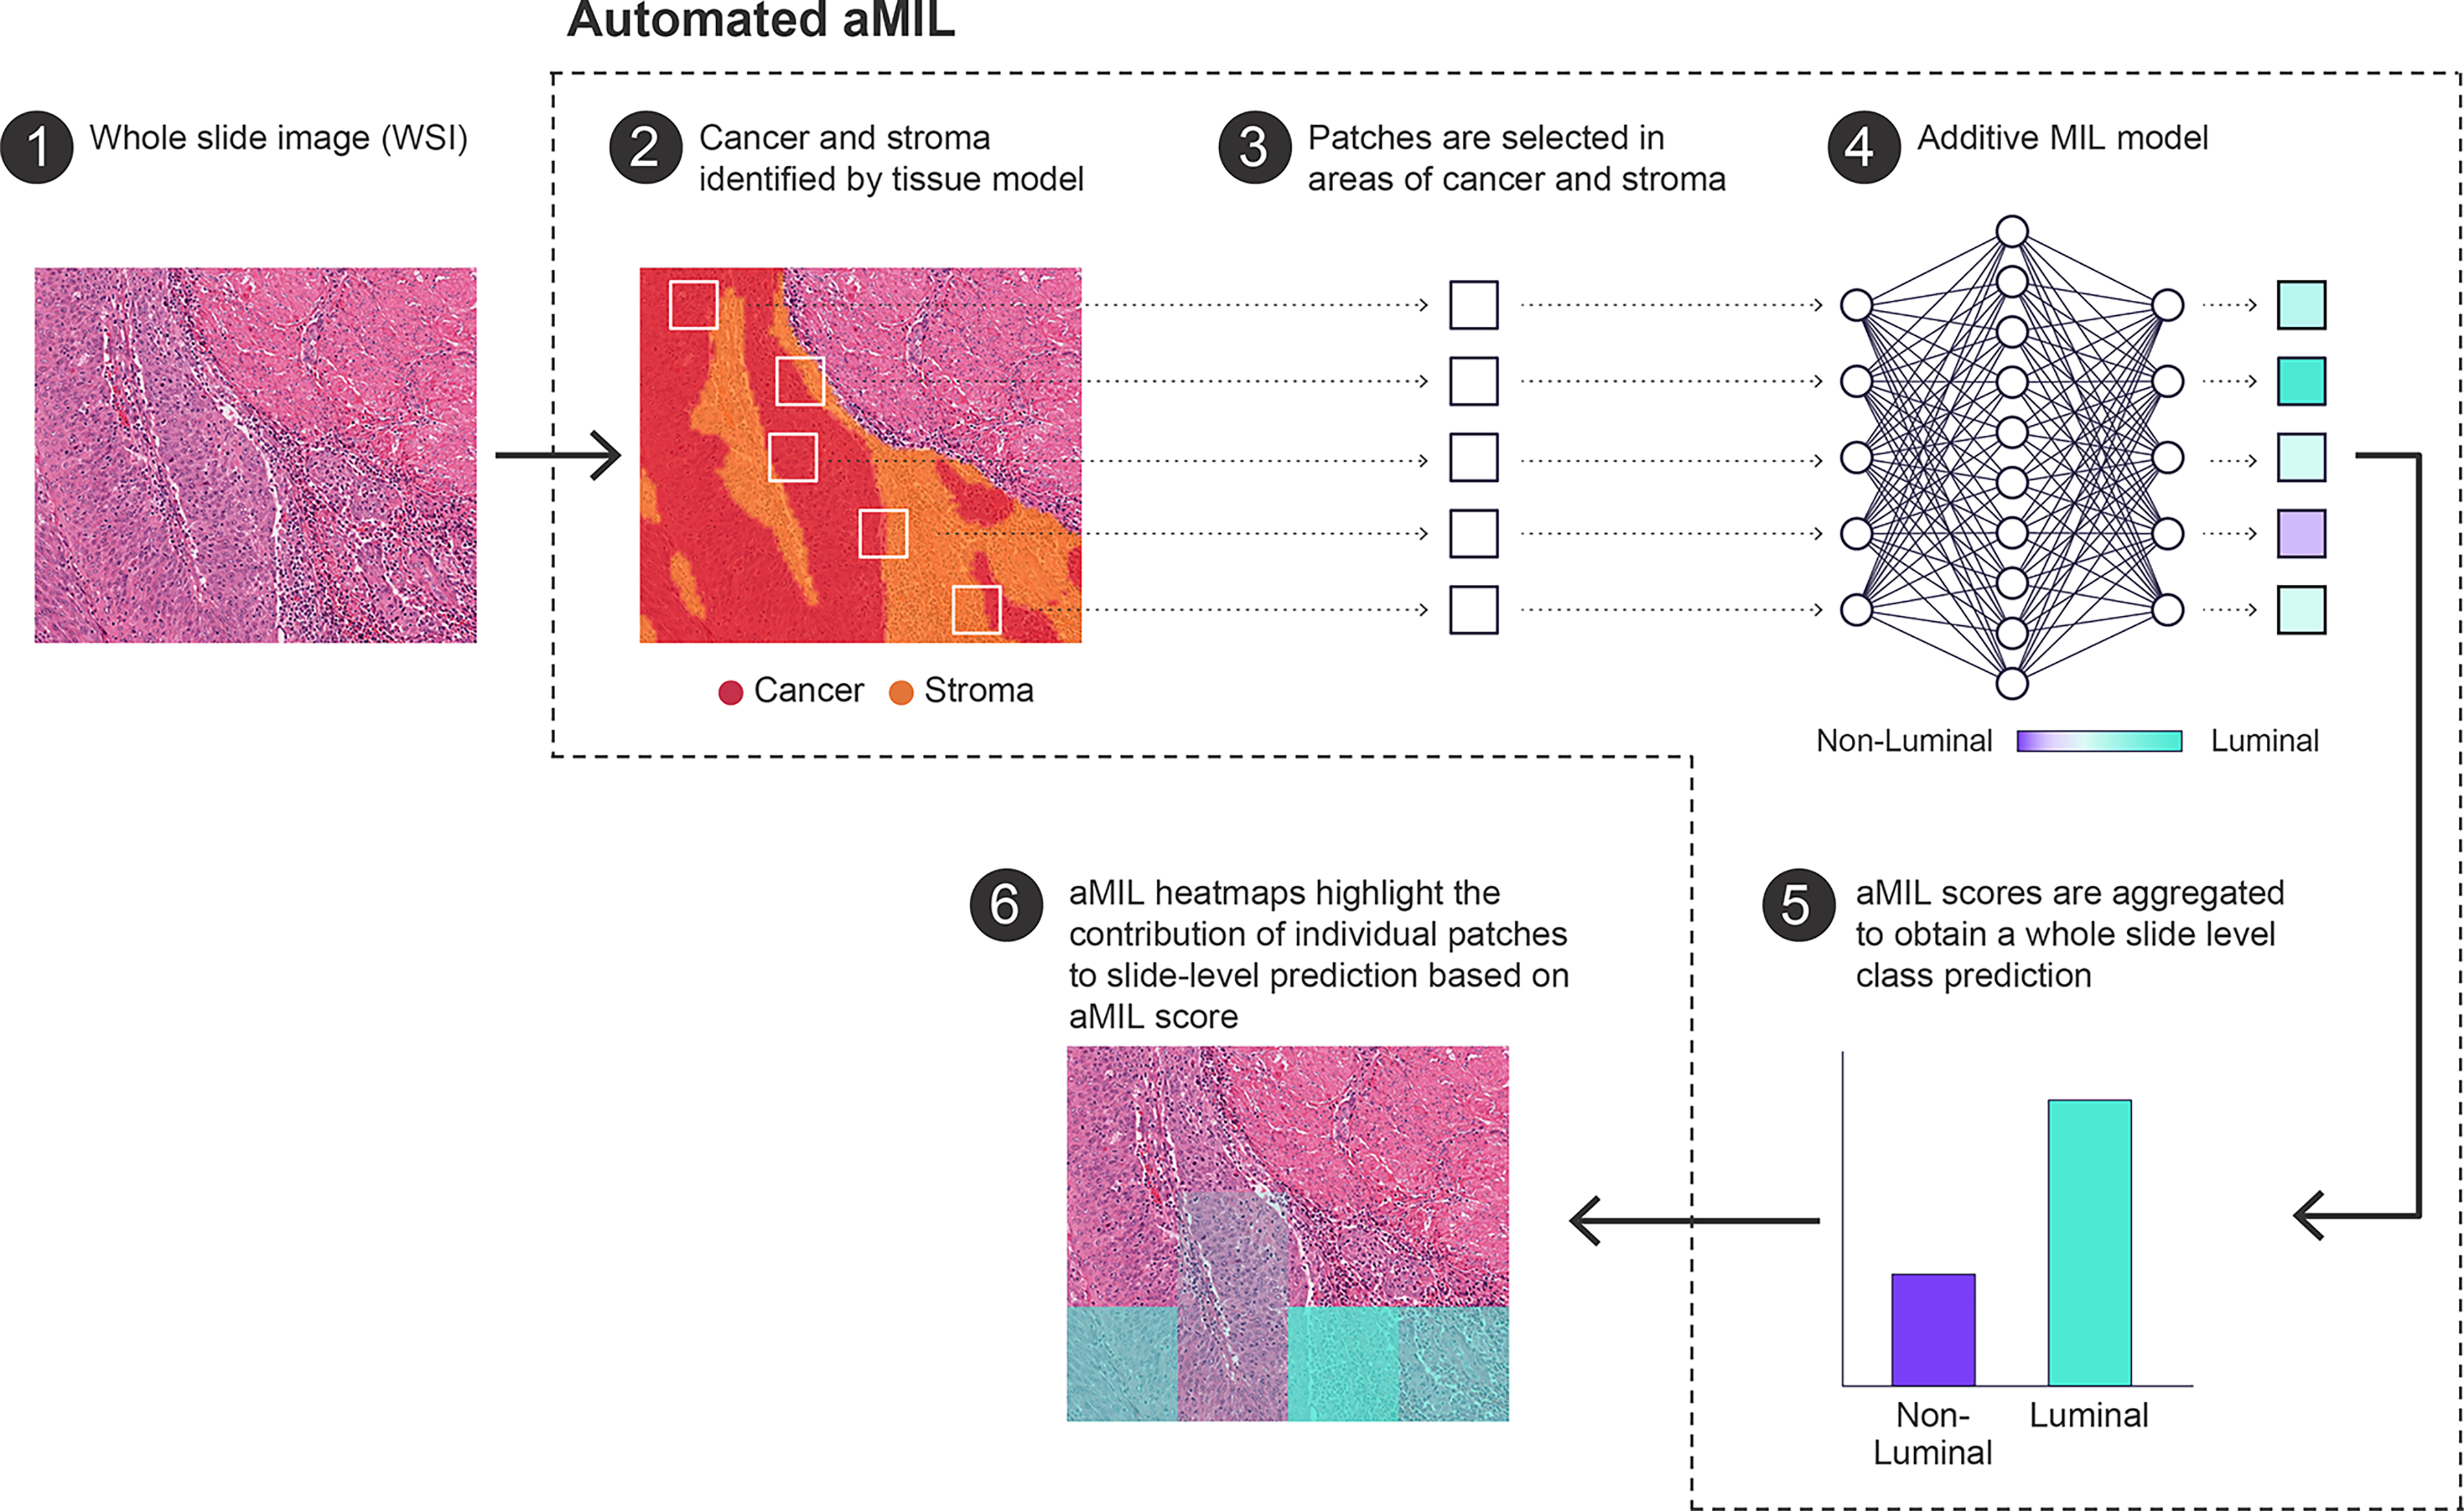
Overview of the automated attention-based multiple-instance learning (aMIL) pipeline for whole-slide classification. A hematoxylin and eosin (H&E) stained whole-slide image (WSI) is used as input (1). A tissue segmentation model identifies cancer and stromal regions (2). Image patches (tiles) are extracted from regions containing cancer and stroma (3). The selected patches are processed by an aMIL model to generate patch-level contributions toward a luminal versus nonluminal prediction (4). Patch-level scores are aggregated to produce a whole-slide–level class probability (5). Model-derived heatmaps visualize the relative contribution of individual patches to the final slide-level prediction, enabling interpretation of spatially informative regions (6).
Keywords
Introduction
Bladder cancer is one of the most common malignancies worldwide, with mortality rates continuing to rise.1,2 The vast majority of cases (>90%) originate from the urothelial cells lining the bladder and urinary tract and are classified as urothelial carcinoma (UC). 3 In the United States, ∼85,000 new cases are expected in 2025, with UC representing the predominant histological subtype. Despite advances in diagnosis and management, outcomes for patients with locally advanced (unresectable) and metastatic UC remain poor, underscoring the aggressive nature of this malignancy and the urgent need for more effective therapeutic strategies.
Urothelial cancers are classified into luminal or nonluminal lineages based on their cell of origin and distinct molecular and pathological characteristics. An updated The Cancer Genome Atlas (TCGA) molecular taxonomy has been proposed that includes luminal-papillary, luminal-infiltrated, luminal, neuronal, and basal-squamous subtypes. 4 Subsequent classification systems have incorporated additional tumor microenvironment-related features, such as stromal content and immune infiltration. 5 Application of this mRNA-based classification of lineage subtypes to a real-world dataset of 2609 advanced UC samples revealed that tumors of luminal lineage account for approximately 65% of advanced UC cases; within this luminal lineage, tumors can be further stratified into luminal-papillary (38%), luminal-infiltrated (36%), and luminal (26%) subtypes. The remaining tumors were of basal-squamous (23%) and neuronal (12%) lineages. 6 Intratumoral heterogeneity is observed, with individual UC tumors often demonstrating mixed molecular and histopathological features across spatially distinct regions. 7
In urothelial carcinoma, PPARG is a master regulator of luminal cell identity, playing an essential role in normal urothelial homeostasis and regeneration, and mounting evidence indicates that aberrant PPARG activation drives initiation and progression of tumorigenesis in luminal UC.8,9 PPARG is a ligand-activated nuclear receptor belonging to the peroxisome proliferator-activated receptor (PPAR) subfamily within the nuclear hormone receptor superfamily. Recurrent genetic alterations in PPARG, including focal amplification, missense mutations, and fusions, as well as hotspot mutations in its obligate heterodimer, retinoid X receptor alpha (RXRA), are characteristic of this molecular subtype. 10 , 11 Elevated PPARG expression is a defining molecular hallmark distinguishing luminal from nonluminal UC.6,9,12 Within the luminal lineage, PPARG mRNA expression is consistently high, with similar proportions of patients harboring or lacking genetic alterations in PPARG and RXRA, its primary heterodimerization partner. Comparable patterns are observed for fibroblast growth factor receptor (Fibroblast Growth Factor Receptor [FGFR]3) mutations, which occur in ∼18% of luminal tumors.4,6
Collectively, these findings highlight the central role of PPARG signaling in establishing and maintaining luminal differentiation in UC. Targeting PPARG thus represents a novel therapeutic strategy aimed at disrupting a fundamental driver of luminal tumor biology. FX-909 is a first-in-class, orally bioavailable, potent, and selective inhibitor of PPARG that stabilizes the receptor in a conformationally repressive state, leading to durable tumor regressions in xenograft models.13,14 FX-909 is currently being evaluated as monotherapy in a Phase 1 clinical trial (NCT05929235) and has demonstrated an acceptable safety and tolerability profile, along with promising antitumor activity in patients with advanced UC of luminal lineage characterized by high PPARG expression.15,16
Novel biomarkers that enrich for luminal UC tumors are critical for identifying patients most likely to benefit from FX-909. While hematoxylin and eosin (H&E) staining offers important morphological context, human pathologist evaluation based solely on this assay is insufficient to reliably differentiate luminal from non-luminal molecular subtypes. RNA sequencing (RNA-seq) is the primary method for molecular subtyping in advanced UC. 4 However, despite its value, RNA-seq remains limited in clinical use due to high cost and technical complexity. 4
Artificial intelligence (AI)–based analysis of histopathology images offers a transformative approach to the classification of molecular subtypes in advanced UC. By leveraging deep-learning algorithms capable of recognizing subtle morphological cues, AI can extract biologically meaningful features from H&E-stained slides that reflect underlying molecular and genetic alterations.17–19 Computational pathology models have demonstrated high accuracy, reproducibility, and efficiency in tumor detection, grading, staging, and outcome prediction.17,20–23 Notably, emerging models can infer transcriptomic profiles directly from digital slides by detecting histological correlates of nuclear morphology, stromal architecture, and immune contexture.17,18,24–26 Given the clinical relevance of molecular subtypes in guiding prognosis and therapeutic response, AI-driven histopathologic analysis represents a practical and scalable strategy for identifying luminal, PPARG-dependent, advanced UC potentially responsive to PPARG inhibition. 4
Methods
Dataset information
Whole-slide images (WSIs) of primary UC specimens stained with H&E (N = 370) were obtained from TCGA. Cases were selected based on the availability of WSIs derived from H&E-stained slides derived from formalin-fixed, paraffin-embedded sections and associated transcriptomic data. Cases were split into training (70%), validation (15%), and held-out test (15%) sets in a manner that preserved even splits of molecular subtype, stage, grade, and demographic variables (Table 1). Only one slide per case was included for model training; replicate slides (N = 62) were held out until after model development was complete. After finalization of the data splits, cases were excluded from final training and analyses for the following reasons: inability to determine molecular subtype based upon the Robertson method (N = 2 slides in the training set, N = 1 slide in the test set) or the identification of insufficient tumor on the slide (N = 1 “luminal-papillary” slide in the test set). An additional commercially acquired retrospective cohort of formalin-fixed, paraffin-embedded primary bladder resections from localized and metastatic, stage III-IV advanced UC (N = 40) was used as an independent test set. Sample sizes were not examined using power analysis due to the availability of specimens for the analysis.
Cohort Metadata and Subtype
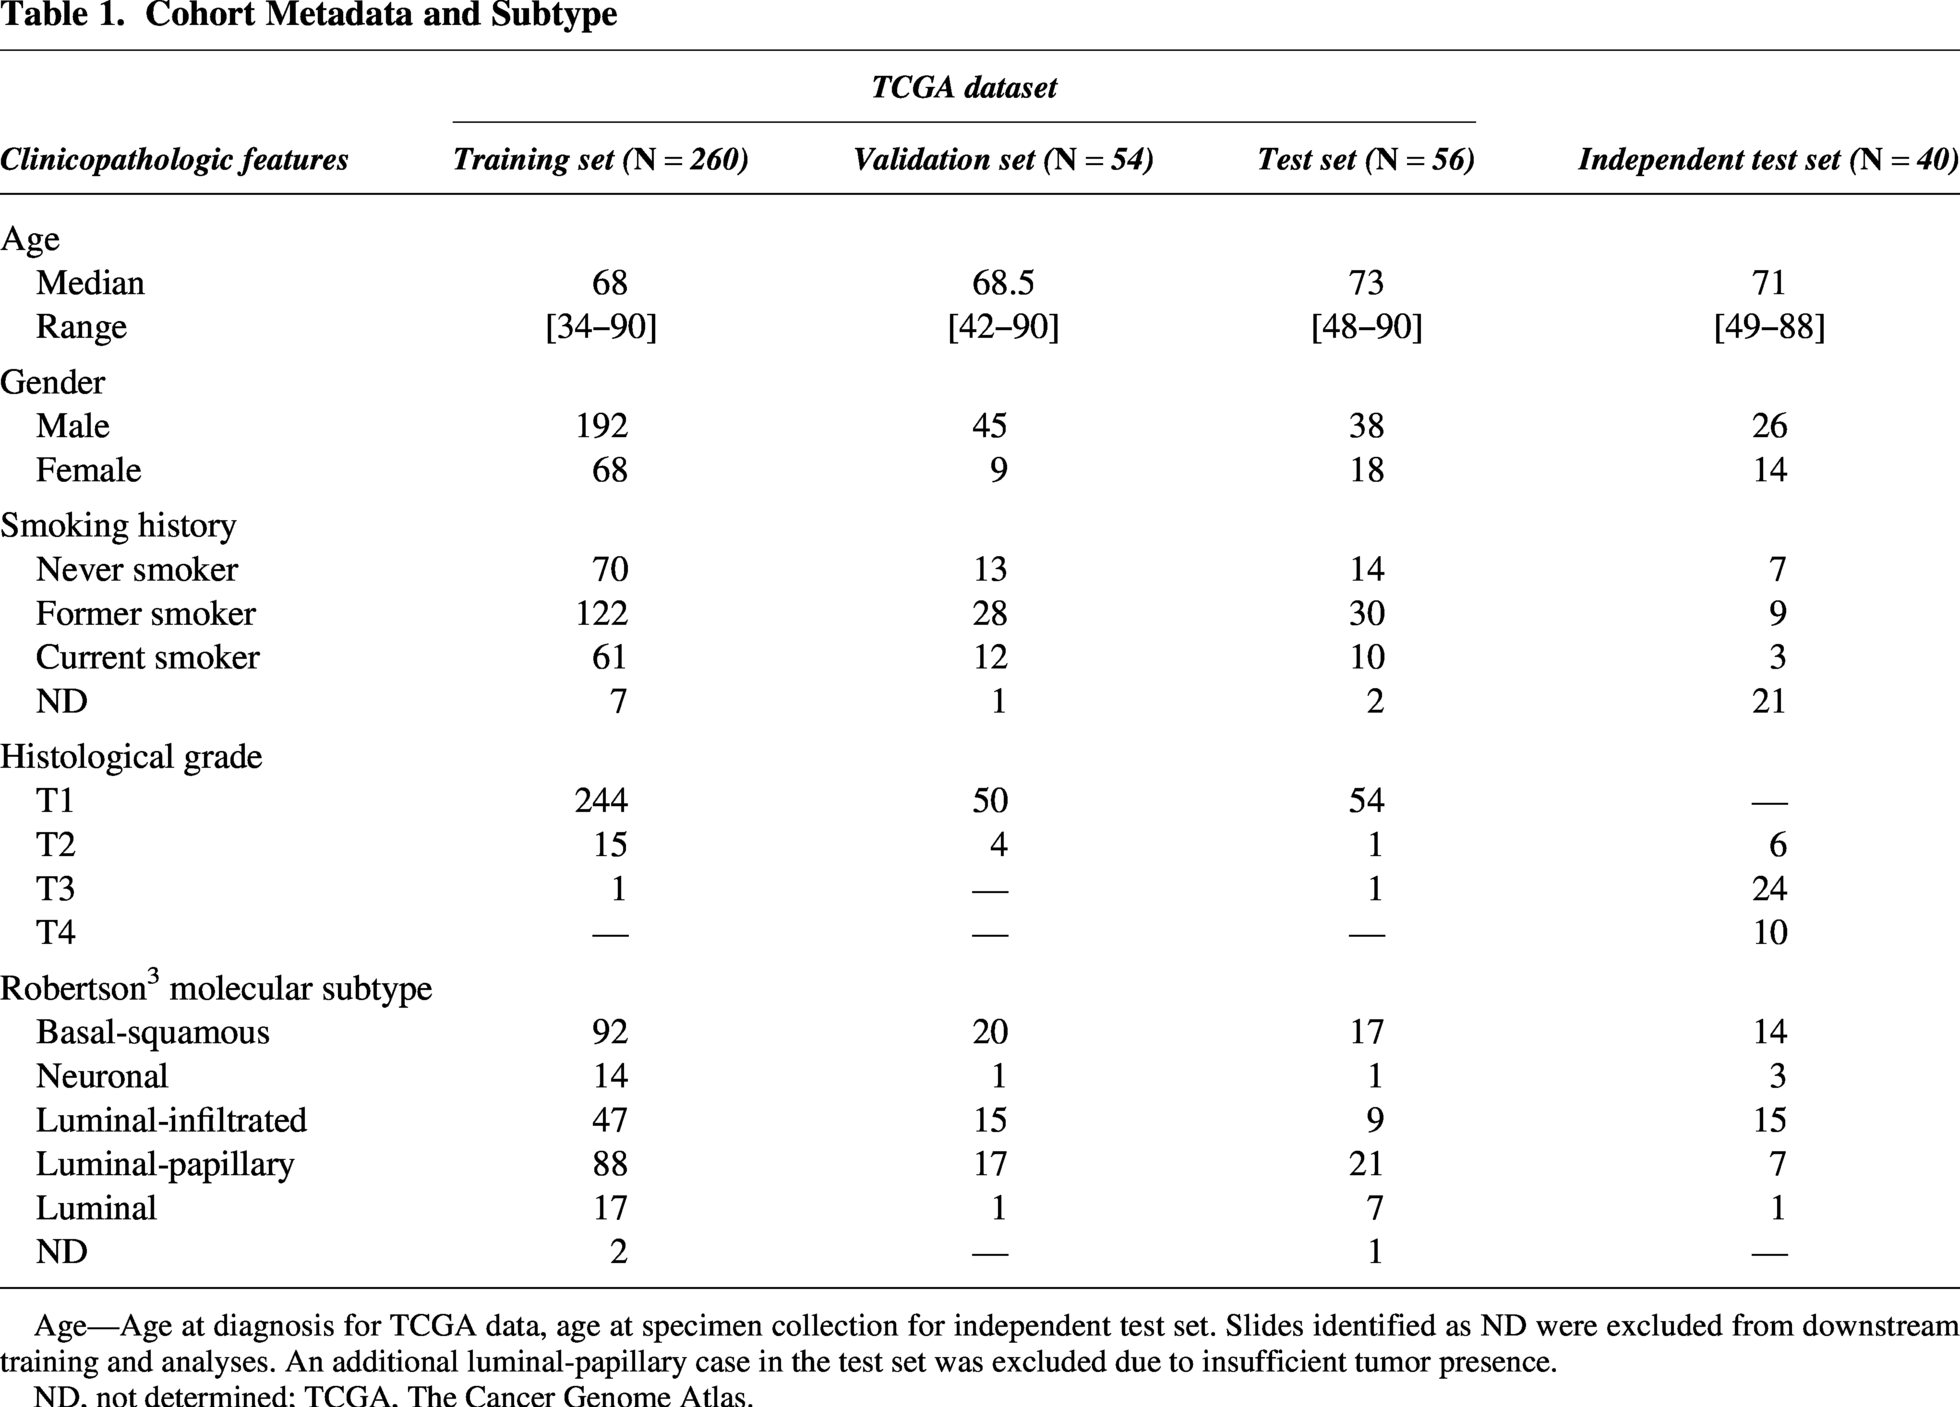
Age—Age at diagnosis for TCGA data, age at specimen collection for independent test set. Slides identified as ND were excluded from downstream training and analyses. An additional luminal-papillary case in the test set was excluded due to insufficient tumor presence.
ND, not determined; TCGA, The Cancer Genome Atlas.
Molecular subtyping
Classification of molecular subtypes was performed using non-negative matrix factorization rank following the Robertson method.4,6 Categories of “luminal,” “luminal-papillary,” and “luminal-infiltrated” were combined into a general “luminal” class. Basal-squamous and neuronal classes were combined into a general “nonluminal” class.
Model architecture and training
Pretrained artifact and tissue segmentation models were deployed on all slides to identify artifact-free areas of cancer and cancer-associated stroma (Fig. 1). 27 Tissue model performance was determined to be satisfactory based on a qualitative review by three board-certified pathologists. 27 Training and validation WSIs were then sampled into 224 × 224-pixel patches (N < 5000 patches per slide) at 0.5 microns per pixel resolution from regions of cancer and cancer-associated stroma. The chosen patch size (224 × 224 pixels) aligns with the standard input dimensions for training ImageNet convolutional neural networks.28–30 Additive multiple-instance learning (aMIL) models a were trained to predict the slide-level binarized molecular subtype prediction (“luminal” or “non-luminal”). 31 The aMIL model used an ImageNet-pretrained ShuffleNet backbone to keep model size small. The backbone, the attention module, and the additive classifier were fine-tuned end-to-end on this task. A class-balanced sampling scheme was used to ensure each batch had a balanced distribution from both classes. Cross-entropy loss was optimized during training for the binary classification task. An additional loss term penalizing prediction variance across common data augmentations was used to enhance model robustness, with both loss terms contributing equal weights to the final loss. Validation performance was monitored using metrics such as the area under the receiver operating characteristic curve (AUROC) and F1 score (calculated at 0.5 threshold). Key hyperparameters, including learning rate, resolution, bag and batch sizes, were tuned via grid search on the validation set. The model was trained for 10,000 iterations with a bag size of 48 and a batch size of 32 with a learning rate of 1e-3.
Model performance was assessed through comparing predictions to ground-truth molecular subtypes as defined by Robertson et al. 4 The final model iteration, selected based on its performance on validation AUROC, was deployed on the held-out test set and an independent commercial test set.
Model deployment and evaluation
The final aMIL model generated a probability score (0–1) for luminal classification on each WSI. For spatial interpretability, aMIL-derived heatmaps provided patch-level luminal contribution scores (224 × 224 pixels), which were aggregated to produce slide-level probabilities and enable visualization of regions most influential for classification. Model performance was assessed using both threshold-independent (AUROC) and threshold-dependent metrics (accuracy, sensitivity, specificity, and Cohen’s κ). Independent testing on a commercial cohort was performed to evaluate generalizability across laboratory and staining variations.
Statistical analysis
Model performance was quantified using AUROC analysis. All statistical analyses for model evaluation were performed in Python (version 3.6) using numpy, scipy, scikit-learn, pandas, statsmodels, lifelines, matplotlib, seaborn, and plotly packages, or in R (version 4.4.3).
Additional analyses were performed in R (version 4.4.3), as follows. RNA-seq–based UC subtyping was performed using the BLCAsubtyping R package. 5 S-curve parameter calculations were performed using sicegar, and gene annotation was conducted using biomaRt. The concordance between AI-based and RNA-seq–defined subtypes was evaluated with confusion matrices from the caret package. Survival analyses were performed using the survival and survminer packages based on TCGA clinical data obtained through TCGAbiolinks. All plots were generated in R (version 4.4.3) using ggplot2.
All scripts used to generate figures and analyses in this study are available at https://github.com/FlareTx/FX-909-DPath.
Results
Study population and cohort characteristics
This study included UC cases (N = 410) divided into four cohorts: TCGA training (n = 260), TCGA validation (n = 54), TCGA test (n = 56), and an independent validation cohort (n = 40). Two cases were excluded from the TCGA test set due to insufficient tumor presence (N = 1) and the inability to determine molecular subtype based on the Robertson method (N = 1), resulting in N = 54 cases for final analysis. 4 Patient demographics were similar across cohorts, with median ages ranging from 68 to 73 years and a majority of male subjects, consistent with UC epidemiology (Table 1). Smoking history revealed high tobacco exposure across TCGA cohorts, and molecular subtype distributions showed basal-squamous and luminal-papillary as the most prevalent subtypes in the TCGA training cohort, with similar patterns in the validation and test sets. The most profound difference between cohorts was the distribution of pathological T-stage. The TCGA cohorts consisted almost exclusively of early-stage disease, with T1 tumors representing more than 90% of cases in the training, validation, and test cohorts. In contrast, the independent validation cohort contained no T1 tumors and only tumors at stage T2 or higher.
Accurate and unbiased luminal subtype prediction across cohorts
The aMIL deep-learning model demonstrated excellent performance in predicting luminal molecular subtype across all test cohorts. The results presented in the confusion matrices showed that the model’s errors were evenly distributed between false positives and false negatives, suggesting no systematic bias toward the classification of either subtype (Fig. 2A). The model achieved AUROC values of 0.96 (95% CI: 0.93–0.99) in the TCGA validation set, 0.95 (95% CI: 0.91–0.99) in the TCGA test set, and 0.97 (95% CI: 0.94–1.00) in the independent test set (Table 2, Fig. 2B). At a probability threshold of 0.5, the model showed consistent accuracy across all three cohorts, with sensitivity of detection ranging from 86% to 96% and specificity of detection from 82% to 94%. Additionally, Cohen’s kappa coefficients ranged from 0.76 to 0.79, indicating substantial agreement between predictions made by the model predictions and the ground-truth molecular data.
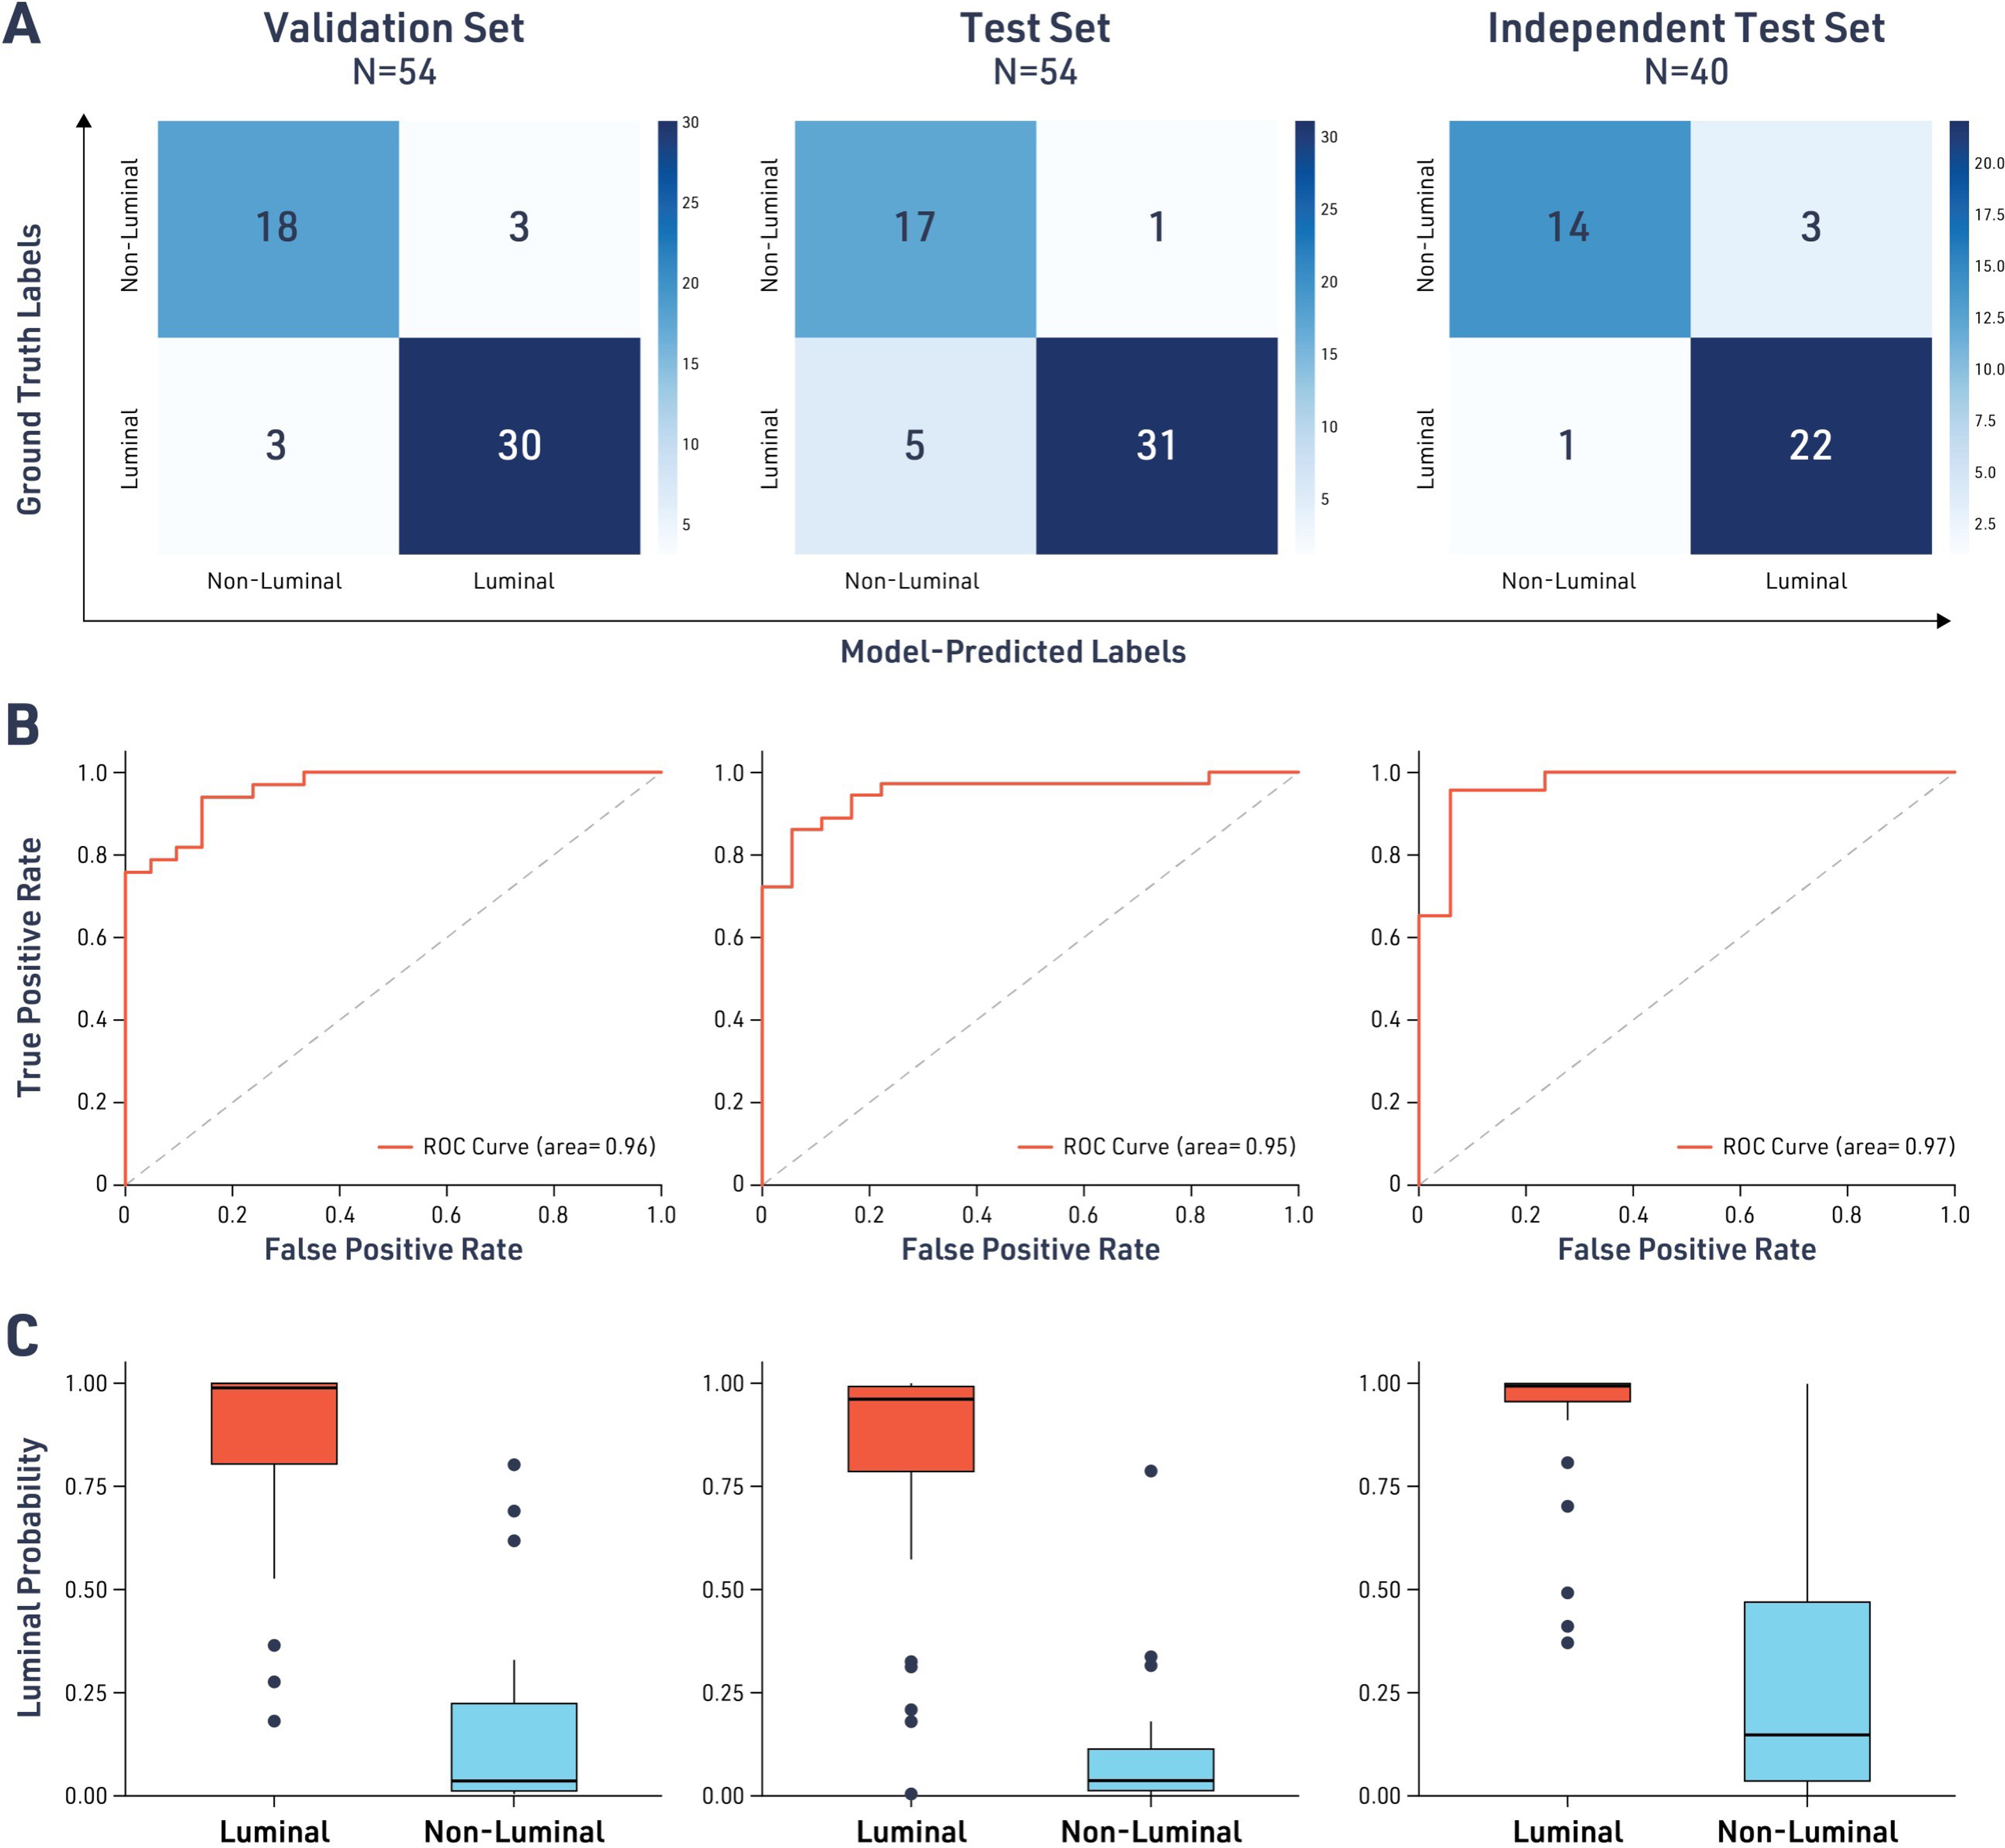
Model performance for the classification of luminal and nonluminal advanced urothelial carcinoma (UC) subtypes. Confusion matrices comparing model-predicted labels with ground truth labels derived from the molecular signatures described in Robertson et al.
Model Performance for Predicting Luminal Status in Advanced UC
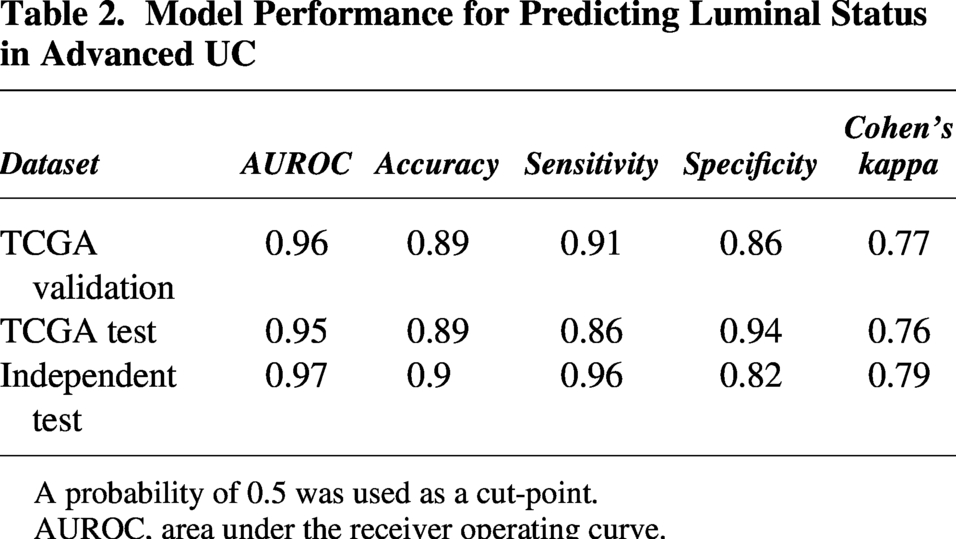
A probability of 0.5 was used as a cut-point.
AUROC, area under the receiver operating curve.
Interestingly, the distribution of model-derived luminal probability scores in the combined TCGA-independent dataset cohort followed a sigmoidal pattern. The parameters of this S-curve can be used to separate different subtypes of UC, primarily determining luminal versus nonluminal subtypes (Supplementary Fig. S1) based on the inflection point (IP) or extending the model to recognize three categories (luminal, non-luminal, and mixed/intermediate) based on start-of-growth and end-of-growth points. Using these unbiased thresholds, the frequency of luminal tumors remained the largest (54.3%), followed by nonluminal (29%) and mixed (16.7%). Changing the probability threshold to match the IP of the S-curve (IP = 0.56) did not substantially change the accuracy of the model (Supplementary Table S1) and can be potentially used as an unbiased threshold.
We did not observe a statistically significant association between model-derived luminal probability scores and survival in the TCGA BLCA cohort, comparing the categories in each scenario (p > 0.13). We also observed a lack of association between higher uncertainty in RNA-seq subtyping calls (defined as difference between top 2 subtype scores) and intratumoral heterogeneity (ITH). The number of clones predicted from the TCGA dataset had no correlation to the luminal probability score (R = 0.05) or to the mixed category (t-test p value = 0.66).
Model reproducibility and consistency analysis
Given the high level of accuracy observed for our model-derived luminal predictions, we sought to test the model’s reproducibility. Analysis of cases with replicate specimens (N = 62 specimens across N = 23 cases) revealed highly consistent classification performance, with 21 cases (91.3%) showing concordant luminal/non-luminal designation across all replicates (Fig. 3). When examined at the specimen level, 80 of 84 replicates (95.2%) produced consistent luminal status predictions, demonstrating robust performance despite inherent tissue heterogeneity and technical variations in slide preparation. Thus, model predictions of luminal status were highly reproducible, increasing our confidence in its ability to provide clinically actionable predictions.
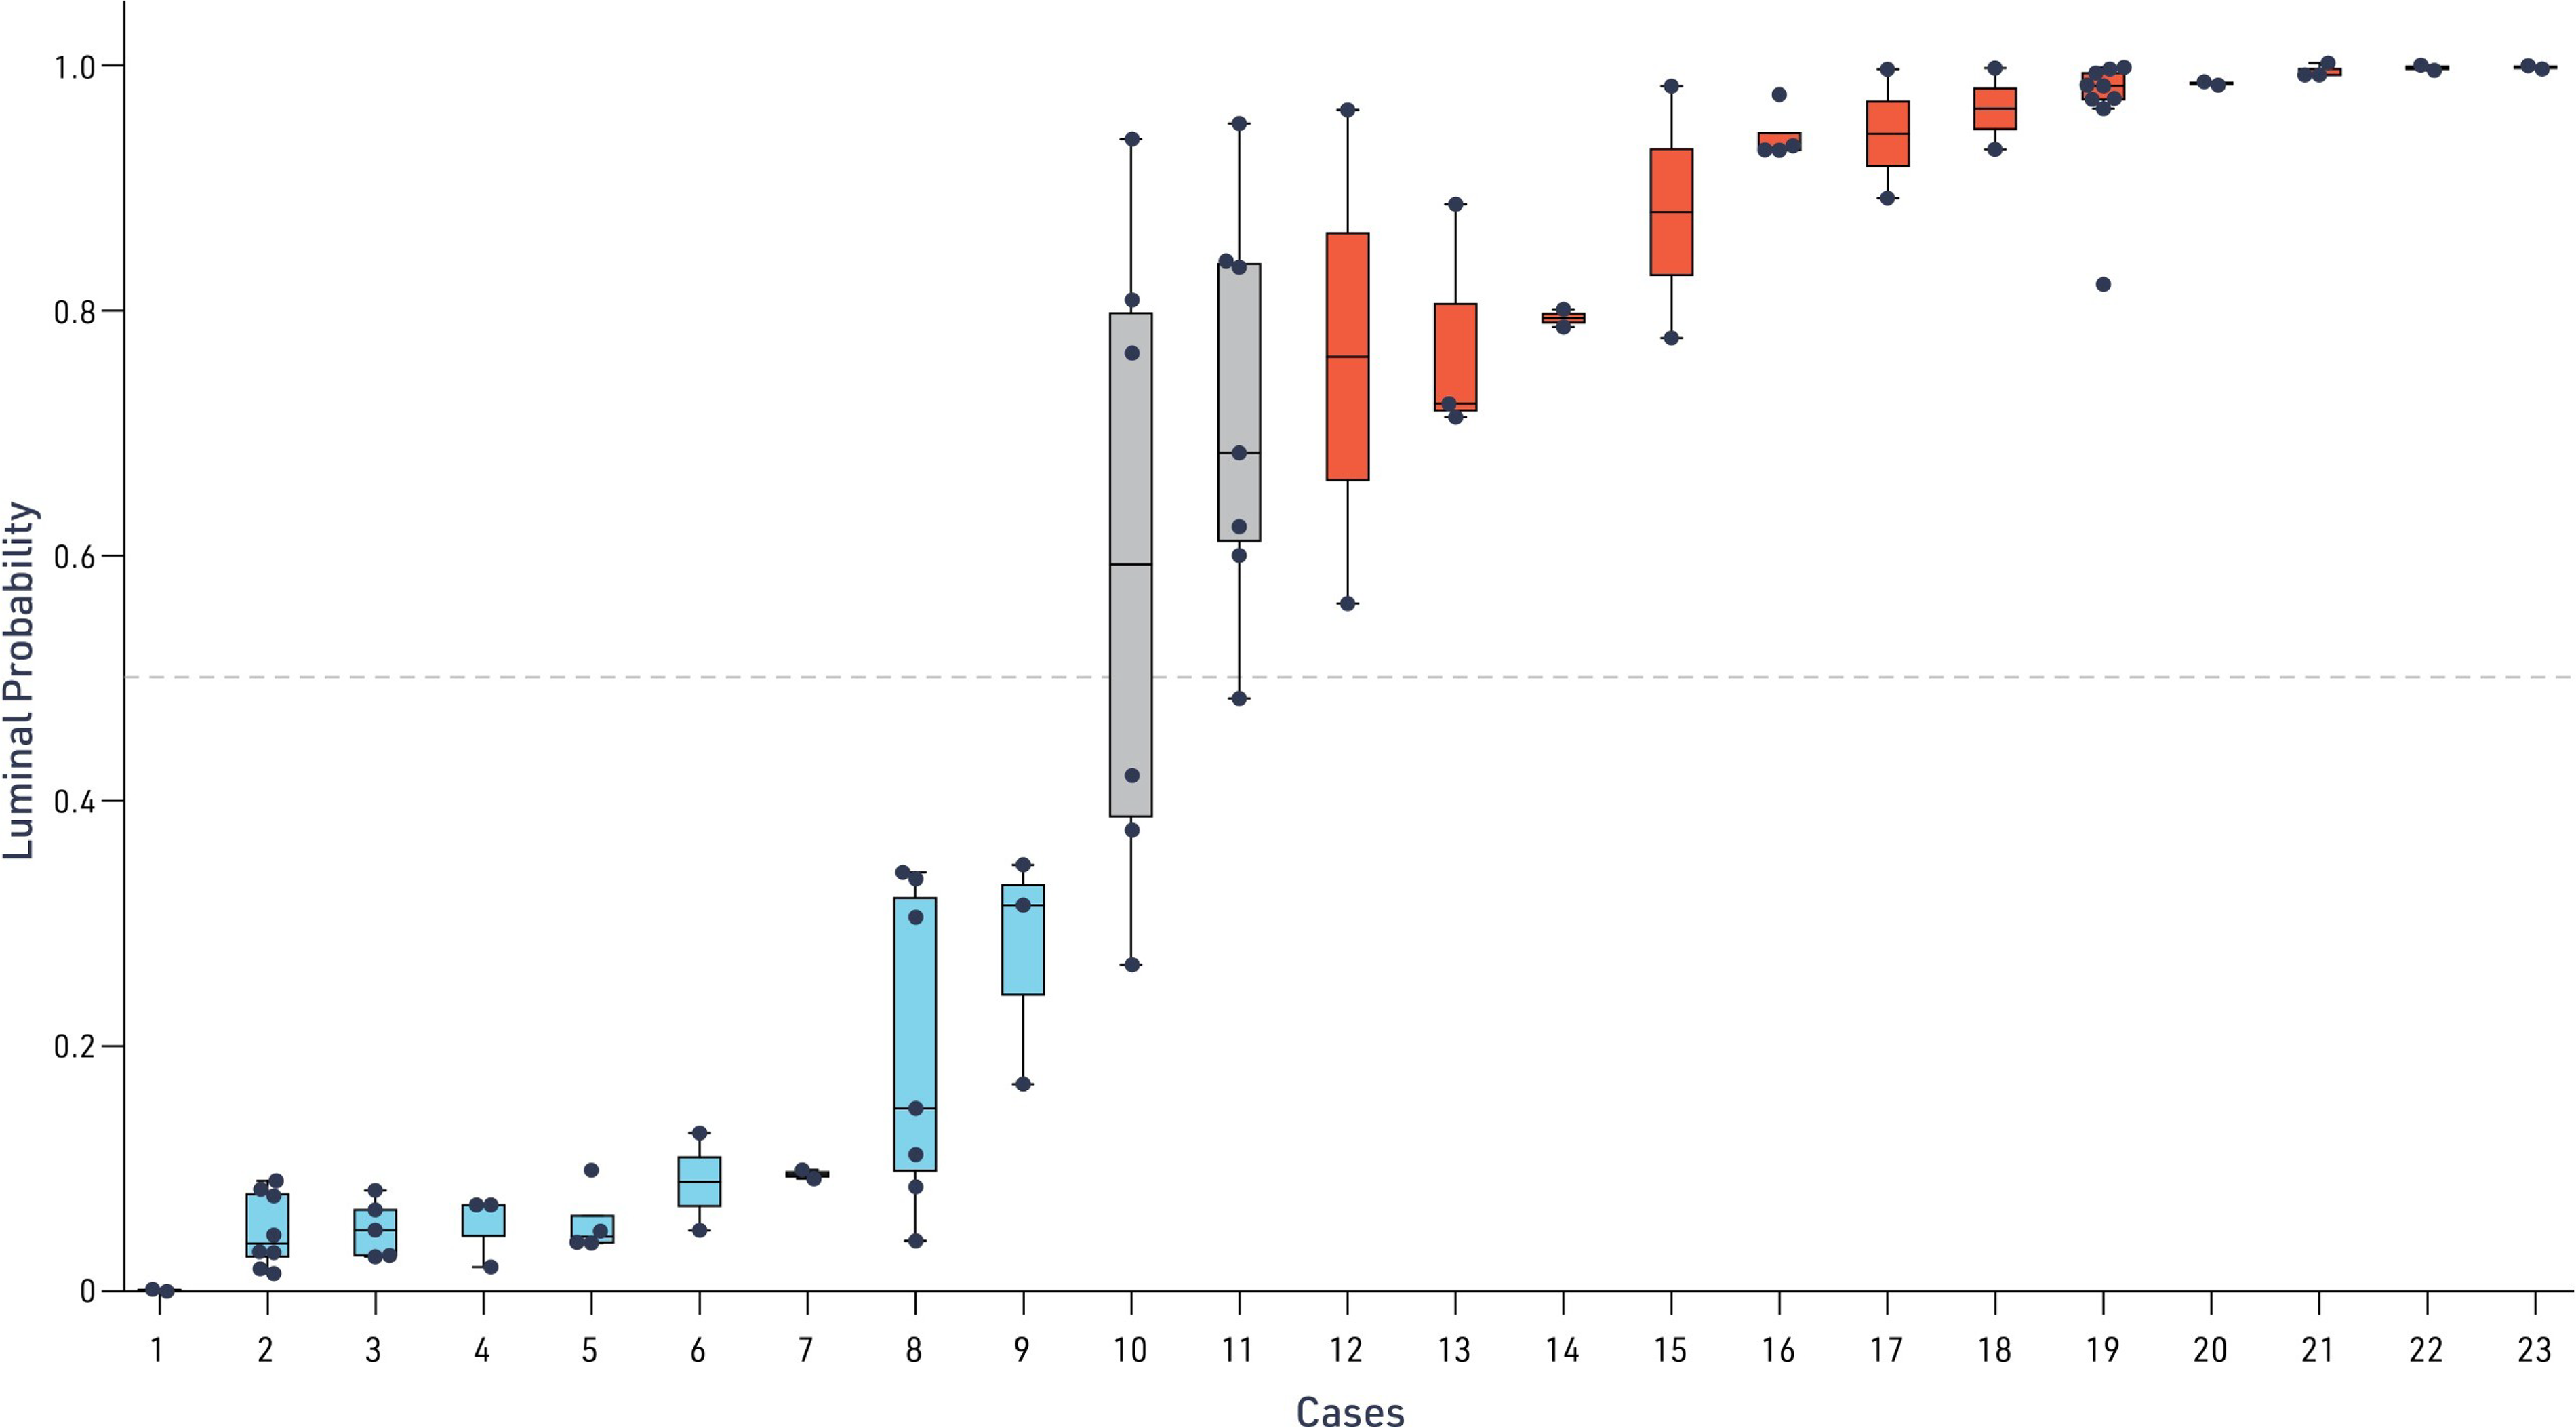
Consistency of model-predicted luminal status across replicates. Distribution of model-predicted luminal probability for each UC case across replicate WSI analyses. Each dot represents an individual replicate prediction, with the median and interquartile range indicated by the box and whiskers denoting the full range. The dashed horizontal line marks the decision threshold (luminal probability = 0.5) used to classify samples as luminal or non-luminal.
In the initial model development, only one replicate was used per case. After the model was developed, intracase and intersample consistency were investigated. Cases with a probability >0.5 (red line) were predicted to be luminal. Each box plot shows the distribution of scoring across replicates for each case. Only 2 out of 23 cases assessed had specimens with inconsistent luminal/nonluminal scoring (Case 10 and Case 11). In total, 80/84 replicates consistently determined luminal status.
Transcriptomic validation and biological correlation
To validate the biological relevance of the AI-derived predictions, we examined the correlation between model outputs and established molecular profiling methods. The luminal probability scores generated by the model demonstrated strong concordance with transcriptomic scoring systems, exhibiting a clear gradient across molecular subtypes (Fig. 4). Luminal-papillary, luminal-infiltrated, and luminal subtypes showed consistently high probability scores, while basal-squamous and neuronal tumors had the lowest scores. As expected from previous reports in all datasets, higher expression of PPARG was observed in cases predicted by both the model and RNA-seq to be a luminal subtype across datasets, suggesting that the model captured meaningful features associated with distinct luminal transcriptional programs.4,6
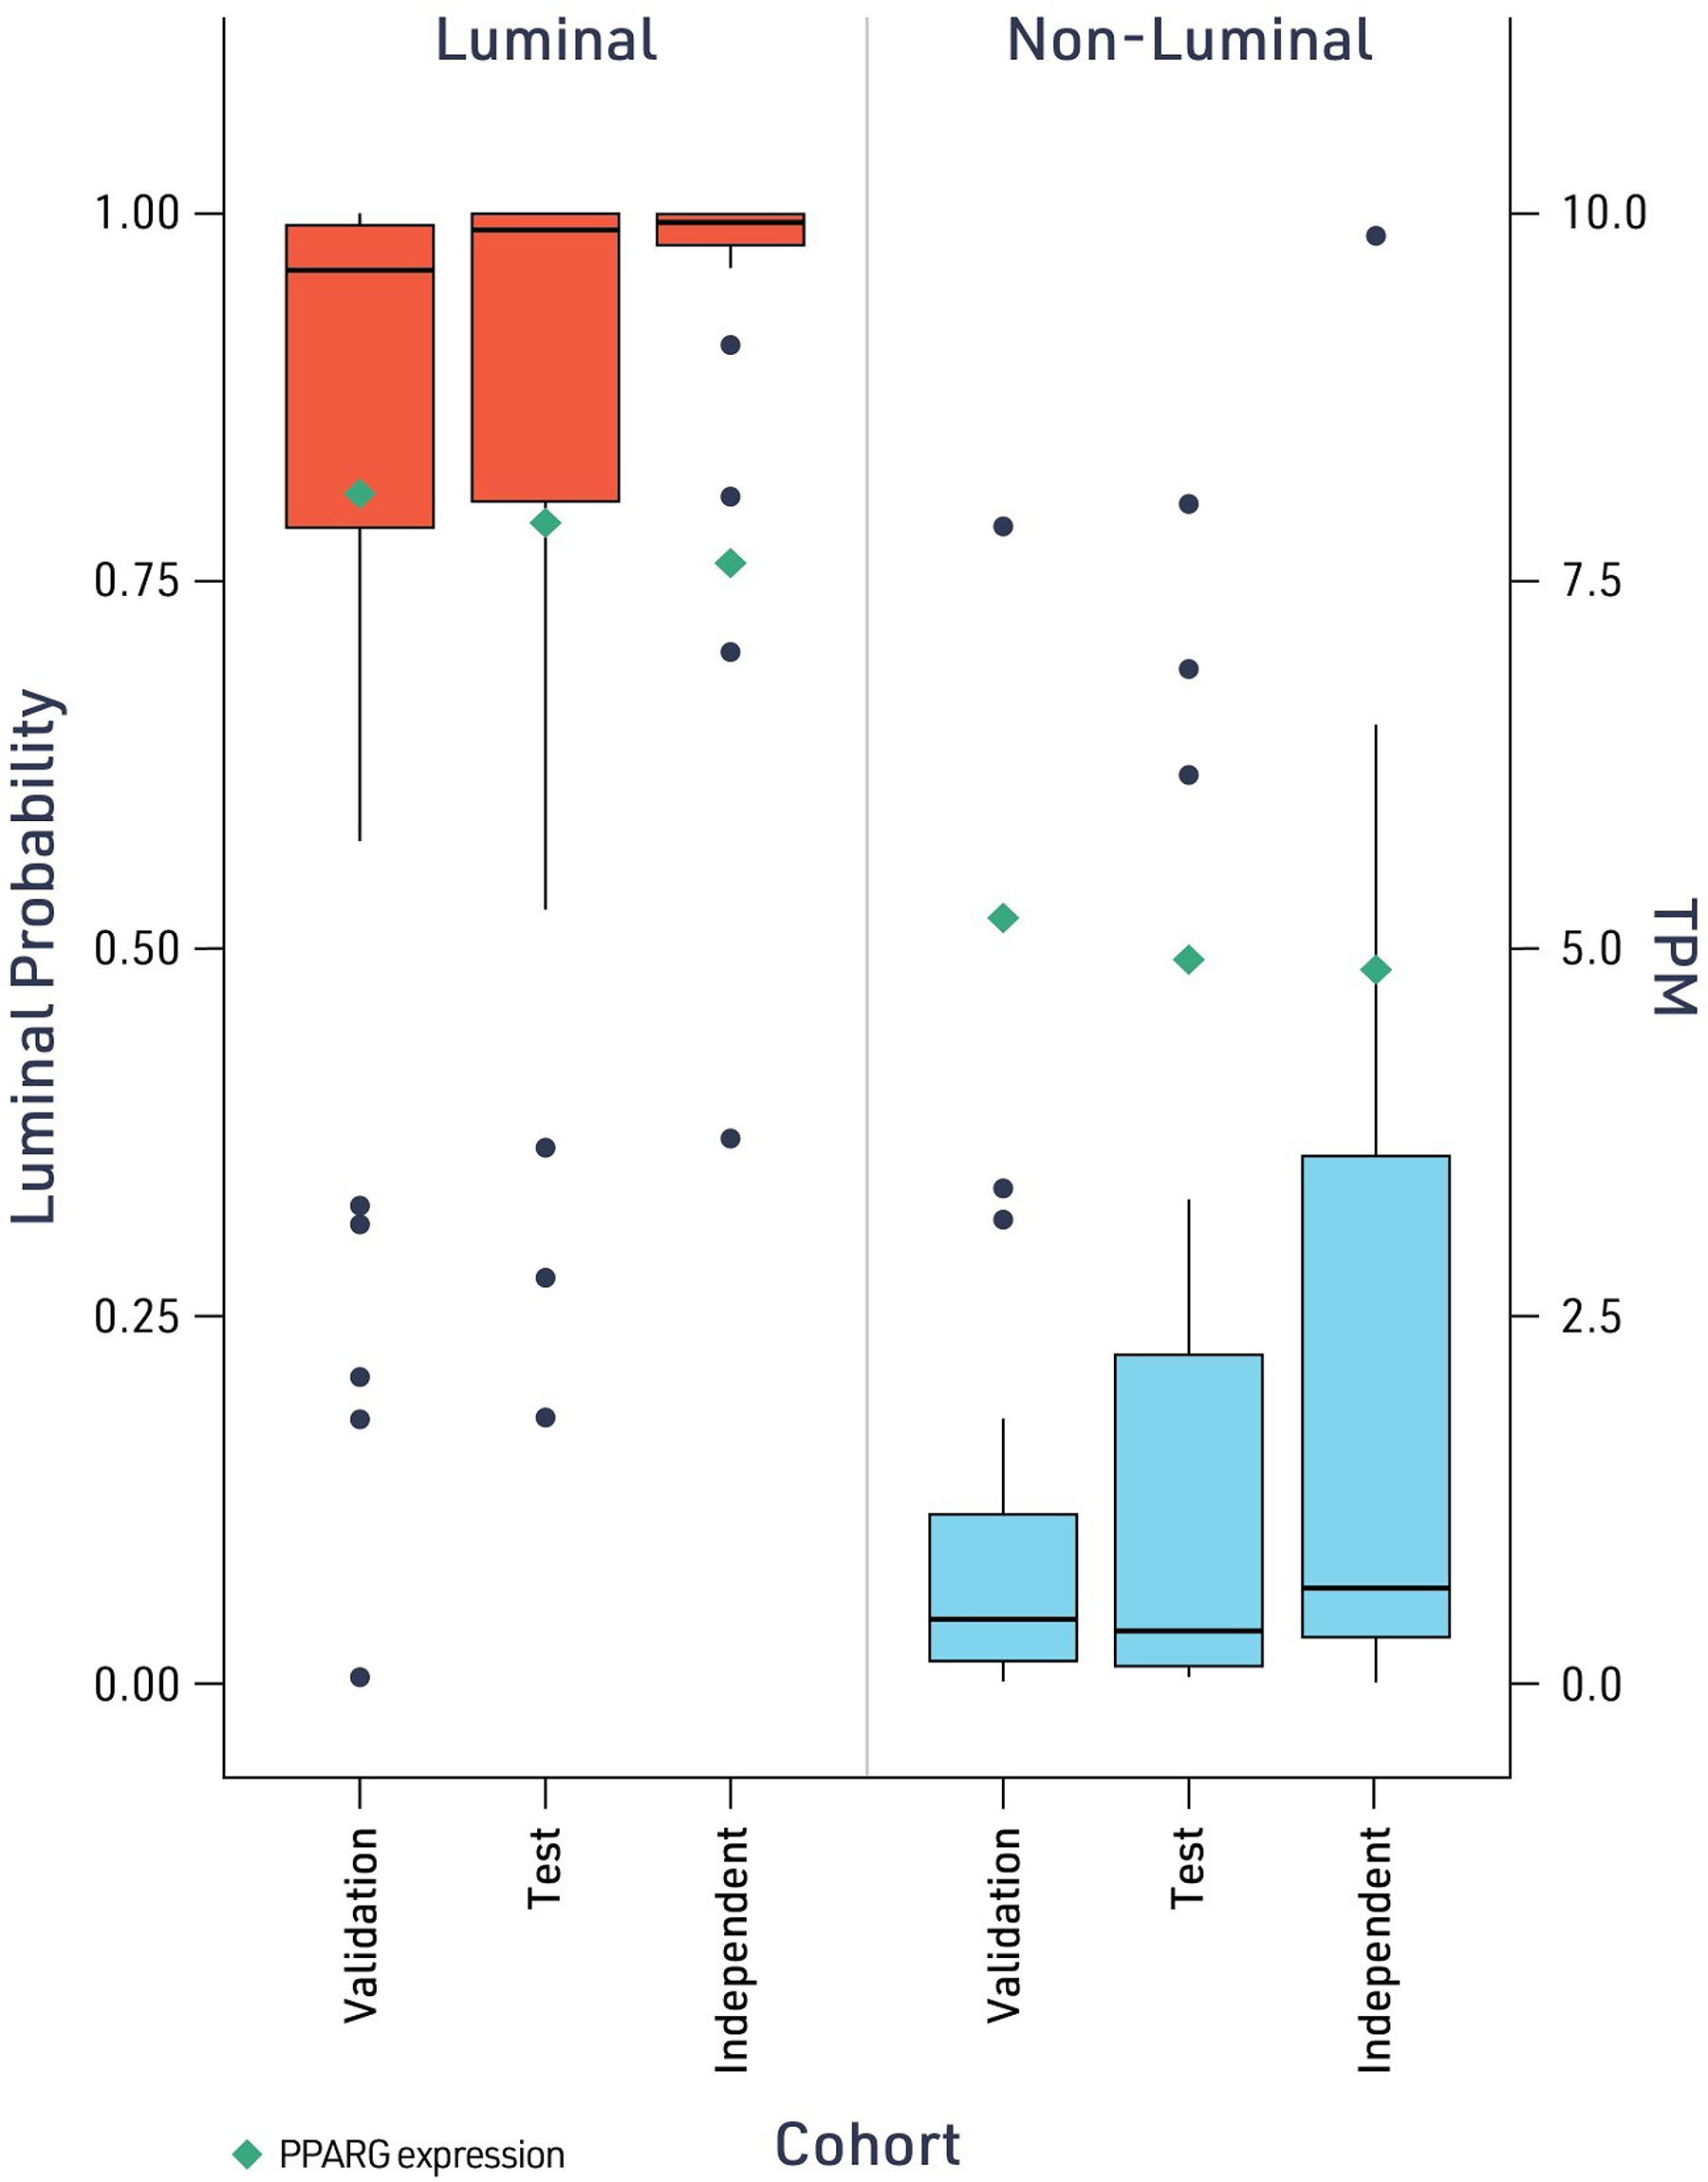
Model-predicted luminal status correlates with proliferator-activated receptor gamma (PPARG) transcript levels. Model-predicted luminal probability for cases classified as luminal (left, red) or nonluminal (right, blue) across the validation, test, and independent cohorts. Individual case predictions are shown as points. Green diamonds indicate PPARG transcript expression (TPM; right y-axis). TPM, Transcripts per million.
Model interpretability
The aMIL architecture of the luminal prediction model described herein generates attention heatmap overlays that highlight tissue regions contributing highly to model predictions (Fig. 5). In these visualizations, regions shaded red indicate areas contributing strongly to luminal classification, while blue-shaded regions drive nonluminal predictions. Eighteen WSIs from the TCGA test set were selected for pathologist review to identify histological features associated with the attention heatmaps. This case set consisted of the six slides with the highest predicted luminal score, six slides with the lowest predicted luminal score, and six slides that were misclassified by the model. Each of these slides was qualitatively reviewed by a board-certified pathologist (MGD).
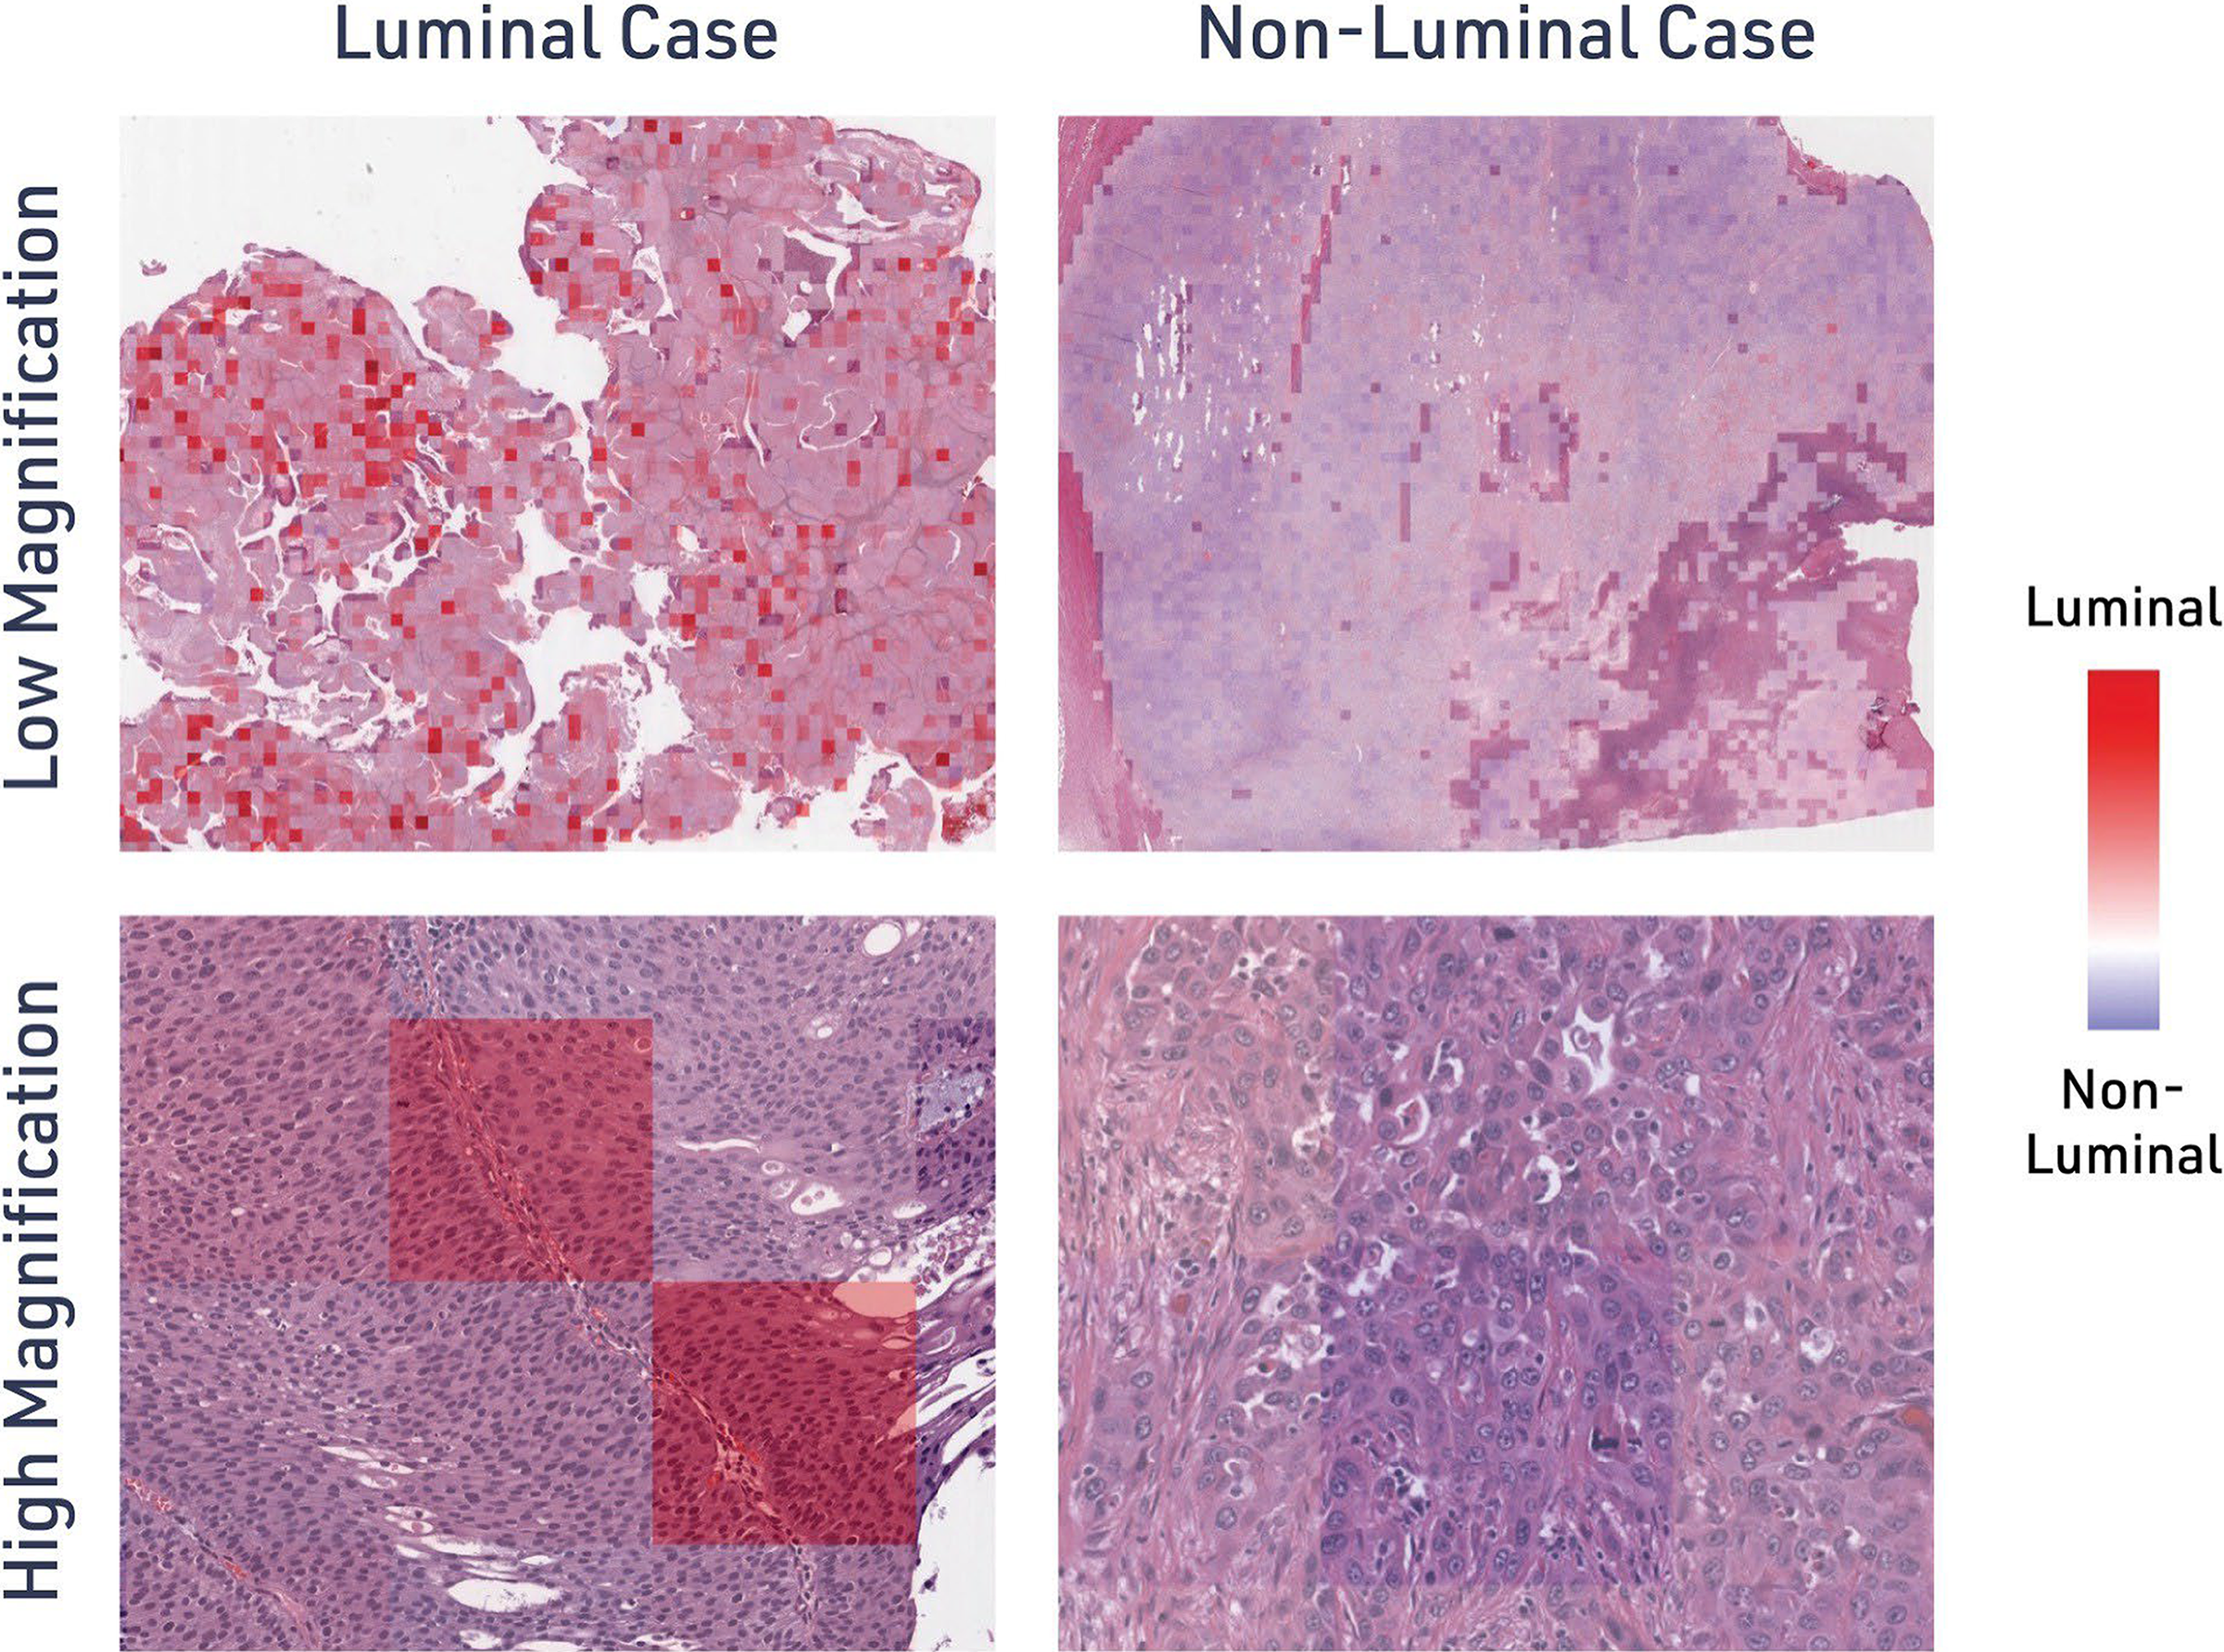
Model attribution maps highlight histological regions driving luminal predictions. Additive MIL luminal prediction models were deployed on H&E-stained UC WSIs. During inference, each image patch was assigned a luminal score and visualized as an attention heatmap for representative luminal and nonluminal cases at low and high magnification. Heatmaps indicate regions contributing most strongly to the luminal classification (red) versus nonluminal classification (blue).
Luminal predictions were associated with larger areas of solid tumor growth and papillary configuration with fibrovascular cores and/or micropapillary growth. Patches with a low luminal prediction score harbored greater intratumoral inflammation and/or admixture between tumor and stromal inflammatory cells. In addition, these patches showed pseudoglandular morphology, often containing debris or necrosis. Interestingly, common features were observed in the cases that were misclassified by the model. Of the five ground-truth luminal cases that were classified as non-luminal, each case showed patches with pseudoglandular configuration, while two cases demonstrated areas of necrosis and one contained neutrophils. The single ground-truth nonluminal case that was classified as luminal demonstrated a strongly nested growth pattern with discrete tumor-stroma boundaries and no necrosis. In this case, the patches that predicted luminal type harbored areas of adjacent tumor nests with narrow strips of intervening stroma, resulting in configuration reminiscent of papillary growth at the scale of the sample patch. These results suggest that tumor growth patterns and tumor-stromal admixture were features of particular importance for model attention.
Notably, in the qualitative review of the attention heatmaps, there was no evidence of the model predictions being skewed by artifactual parts of the WSI (e.g., tissue folds). This attention heatmaps enable pathologists to apply their domain expertise to understand the morphological basis of AI predictions, as well as confirm that artifacts within the WSI are not skewing predictions.
Discussion
As FX-909 advances toward clinical evaluation, the ability to reliably identify PPARG-dependent luminal UCs will be central to implementing precision treatment strategies in advanced UC. We developed an AI-driven computational pathology model capable of predicting molecular subtypes directly from routine H&E-stained sections, achieving robust classification accuracy with AUROC values exceeding 0.95 across multiple validation datasets. Importantly, observed differences in stage distribution and molecular subtype prevalence between TCGA and an independent validation cohort emphasize the potential challenges of generalizing models derived from early-stage datasets. These findings highlight the critical importance of external validation in diverse, advanced-stage patient populations to ensure translational robustness and clinical relevance.
Furthermore, the model demonstrated outstanding reproducibility, with 91.3% concordance in luminal versus non-luminal classification across multiple tissue specimens and 95.2% consistency at the individual specimen level. These results indicate that, in most cases, a single representative section is sufficient to determine the molecular subtype with high reliability. Such reproducibility is particularly encouraging for clinical translation, as it suggests that AI-based digital pathology could reduce the need for extensive tissue sampling while maintaining diagnostic precision. Nonetheless, intratumoral heterogeneity remains a recognized limitation and may account for discordant classifications in a minority of cases.
Importantly, the model’s ability to generate consistent predictions directly from routine H&E-stained WSIs supports the feasibility of AI-driven molecular subtyping as a practical and cost-effective alternative to RNA sequencing for tasks such as luminal subtype identification in UC. The high level of inter-specimen agreement observed here has direct clinical implications: in current pathology practice, multiple sections from transurethral resection specimens are often examined to address tumor heterogeneity. Our findings suggest that a single section may be sufficient in over 90% of cases, potentially streamlining diagnostic workflows and reducing analytical burden in clinical laboratories. Furthermore, the model’s reproducibility across technical replicates underscores its robustness to preanalytical variability factors that often affect immunohistochemical assays. Together, the algorithm’s quantitative probability outputs and consistent performance provide a standardized framework for molecular classification, offering a pathway toward greater diagnostic reproducibility and reduced interobserver variability across institutions.
We observed that the distribution of model-predicted luminal probability scores could be described by an S-shaped distribution of model-predicted luminal probability scores across the combined TCGA and independent cohorts. Most cases clustered at the extremes, with a smaller subset showing intermediate probabilities that may reflect partial or heterogeneous expression of luminal features. No significant association was found between the number of tumor clones in TCGA metadata and intermediate luminal probabilities, though this metric does not directly capture phenotypic heterogeneity. Further work is needed to determine the biological and clinical relevance of these intermediate cases.
Spatial and molecular heterogeneity are well-recognized challenges in advanced UC and other solid malignancies, contributing to variability in molecular classification depending on the sampled region.32–35 Nevertheless, our AI-based approach offers practical advantages: It operates on standard H&E-stained slides, produces quantitative and reproducible probability scores, and generates interpretable attention maps that highlight morphological correlates of model predictions.
The aMIL approach that we used herein builds upon established deep-learning methodologies in UC digital pathology while incorporating specific design choices optimized for PPARG-driven luminal subtype detection.17,31,36 Recent studies have demonstrated the feasibility of deep-learning approaches for molecular characterization in UC, including ResNet34-based attention MIL architectures for FGFR alteration detection and RetCCL-based feature extraction pipelines for the classification of basal/luminal subtypes.18,34 Previous deep-learning models have been described that predict luminal status in urothelial cancer, including algorithms that predict luminal status from inputs of immunohistochemical markers.38,39 One strength of the aMIL approach used herein is the ability to form accurate predictions from routine, H&E-stained images. It is worth noting that models predicting luminal status from H&E WSIs have been described previously. Angeloni and colleagues developed a model leveraging luminal and basal marker expression to predict molecular subtypes in a small cohort of tissue microarray samples. 40 The most similar model to ours was described by Woerl et al. While this model was trained on WSIs from TCGA and validated on an independent slide cohort, the model necessitated manual marking of the tumor area, followed by deployment of a deep-learning CNN model. Here, the deployment of a tissue region model to segment areas of cancer and cancer-associated stroma removes the need for manual tumor identification, yielding a fully end-to-end approach for luminal prediction. Furthermore, the aMIL framework employs a lightweight ShuffleNet backbone, which reduces computational requirements while maintaining performance for this binary classification task. 41 The additive nature of our MIL architecture generates attention heatmaps that highlight tissue regions contributing to luminal versus nonluminal predictions, providing pathologists with visual explanations for model decisions. Our end-to-end optimization of the feature extractor, attention module, and classifier yielded AUROCs of 0.95–0.97 across validation cohorts. Moreover, a variance-penalizing augmentation loss improved resilience to interlaboratory staining variability, a critical factor for broad clinical implementation. The inclusion of multiple tissue sections per case enabled assessment of reproducibility in the context of intratumoral heterogeneity, confirming reliable model performance in conditions representative of routine diagnostic workflows.
Despite strong performance, several limitations warrant consideration. The model was trained primarily on surgical resections of primary locally advanced UC from TCGA (>90% T2 stage), and although it generalized well to an advanced-stage cohort, performance in metastatic lesions and biopsies remains to be evaluated. While the model was developed using TCGA, external validation on larger, heterogeneous sets of data collected across cohorts from diverse scanner platforms will be required to fully establish clinical generalizability. The relatively limited size of the validation cohort in this study should be considered when interpreting performance estimates, and multisite validation should be planned as a next step. In addition, future work should incorporate metastatic and longitudinal samples to ensure reliable patient stratification and address preanalytical and intersite variability that may affect classification fidelity. Furthermore, the interpretability of model predictions was only assessed at a qualitative level. One benefit of aMIL approaches, such as the one used herein, is the ability to deploy them in conjunction with other digital pathology models to maximize the interpretability of predictions. This approach has been used for a model predicting slide-level TGF-CAF gene expression signature status in breast cancer: immune cell prevalence, nuclear morphology, and stromal subtype were associated with model attention in this context. 42 Additional study in this cohort is warranted to quantify similar histological features associated with model predictions of luminal status.
The successful development and validation of our AI-based molecular subtyping model opens promising avenues for its implementation as a companion diagnostic (CDx) assay to support the clinical development of PPARG-targeted therapies, including FX-909. The precedent for molecular subtyping driving therapeutic decisions is well-established across oncology, most notably in breast cancer, where human epidermal growth receptor 2 (HER2), estrogen receptor, and progesterone receptor status fundamentally alter treatment selection, and increasingly in other malignancies where molecular classification guides the use of targeted therapies and immunotherapy.43–46 Our AI-driven approach offers advantages for CDx development: It leverages universally available H&E staining without requiring additional tissue or specialized testing, provides standardized quantitative scores that minimize interlaboratory variability, and can be rapidly deployed across clinical trial sites through cloud-based infrastructure. Moving forward, key priorities include expanding the training dataset to encompass metastatic specimens, including from patients who received prior standard-of-care therapies and diverse clinical presentations, establishing clinically validated thresholds for patient stratification (potentially including a “mixed/intermediate” category), and conducting prospective validation studies linking model predictions to FX-909 treatment response. Additionally, the integration of this molecular classification tool with existing clinical parameters could enable more nuanced risk stratification and treatment selection algorithms. This AI-based subtyping platform has the potential to accelerate patient enrollment by prescreening archived tissues, reduce the need for repeat biopsies, and ultimately enable precision medicine approaches that match patients with luminal PPARG-driven tumors to the most appropriate targeted therapy, potentially transforming the treatment landscape for advanced UC.
Supplemental Material
sj-docx-1-aii-10.1177_2993091X261463923 — Supplemental material for Artificial Intelligence Analysis of Histological Images Accurately Identifies Luminal Subtype Urothelial Carcinomas Characterized by High Peroxisome Proliferator-Activated Receptor Gamma Expression
Supplemental material, sj-docx-1-aii-10.1177_2993091X261463923 for Artificial Intelligence Analysis of Histological Images Accurately Identifies Luminal Subtype Urothelial Carcinomas Characterized by High Peroxisome Proliferator-Activated Receptor Gamma Expression by Stefan Kirov, Evisa Gjini, Chintan Parmar, William W. Motley, Bijal C. Kakrecha, Michael G. Drage, Ben Glass, Syed Ashar Javed, Jacqueline Brosnan-Cashman, Ilan Wapinski, Michael Montalto, Andrew H. Beck, Matthew P. Bronnimann, and Michaela Bowden
Footnotes
Acknowledgments

Author Disclosure Statement
C.P., M.G.D., B.G., S.A.J., J.B.C., I.W., M.M., A.H.B., and M.P.B. are current or former employees of and receive salary and stock options from PathAI.
Funding Information
No funding was received for this article.
References
Supplementary Material
Please find the following supplemental material available below.
For Open Access articles published under a Creative Commons License, all supplemental material carries the same license as the article it is associated with.
For non-Open Access articles published, all supplemental material carries a non-exclusive license, and permission requests for re-use of supplemental material or any part of supplemental material shall be sent directly to the copyright owner as specified in the copyright notice associated with the article.
