
Abstract
Through two online experiments (N1 = 139, N2 = 250), this study tests the effects of attribution style in news articles. Student participants rated articles with “told the reporter” or the traditional “said” as higher in message and source credibility than articles with “told me,” but non-student participants did not perceive differences. Open-ended responses suggested that students found first-person attribution to be unprofessional while the other participants thought their preferences would vary based on context.
Journalistic style guides (e.g., Brooks et al., 2020; Froke et al., 2022) recommend the attribution word “said” in news articles because it allows reporters to show objectivity toward the information and distance from their sources. Words like “claim” or “assert” can imply journalists’ opinions toward the material, the argument goes, while phrases like “said to me” inappropriately insert the journalist into the article.
Some alternative journalism movements recommend a stronger “reporter presence” than this traditional style, including literary journalism (Tulloch, 2014), autoethnographic journalism (Lindgren, 2017) and confessional journalism (Vodanovic, 2023). Such trends, though not new (Coward, 2013; Singleton et al., 2024), suggest that different attribution styles might be accepted, or even preferred, by some news readers.
Amid concerns about media trust (Abdenour et al., 2021; Wilner et al., 2022) and AI-generated content (Henestrosa et al., 2023; Waddell, 2019), this study explores whether attributions with more reporter presence would increase content and source perceptions. If journalists reference themselves in quote attributions—with phrases like “told the reporter” or “told me”—would readers be more inclined to trust the content? Would they find the source to be more credible with these first-person constructions?
Through two online experiments, this study tests the effects of attribution style in news articles on readers’ content and source perceptions. It explores the extent to which readers notice quote-attribution style, and it also looks at how readers interpret first-person writing in news articles. Because the “said” quote-attribution convention is regularly taught in journalism classrooms, this study also considers whether effects differ between students and non-students.
Literature Review
Journalism-Presence Trends
Several alternative journalism movements emphasize the benefits of subjectivity and first-person language in news articles. As Coward (2013) explains,
[T]he personal voice, which is often disparaged in journalism teaching, is and always has been a prevalent form of journalism. Paradoxically, the aim of “objective” reporters is often to be known for a distinctive “voice.” This personal voice is becoming increasingly visible in the context of “the confessional society.”
Steensen (2017) similarly argues that subjectivity is necessary for objectivity (p. 44):
Journalists, editors and journalistic institutions should perhaps be more conscious of how they themselves view the world and how that affects their reporting, as well as be more involved with their sources and audiences, in order to fully understand what is important to the audience and the sources.
Several subfields specifically address this theme, often in the context of authenticity. Regarding literary journalism, for example, Tulloch (2014) writes about the “first-person narrator” and “its qualities of immediacy, intimacy and spontaneity” (p. 629). Lindgren (2017) writes about autoethnographic journalism and “the benefits and challenges of journalists putting themselves in the frame” (p. 183). Similarly, Vodanovic (2023) explains confessional journalism: “The reflective tone becomes a dialogical form of correspondence between the author and the reader, where authenticity is derived in the relationship between the writer, the text, and the audience” (p. 571). Singleton et al. (2024) explain traditional objectivity as an “awkward fit” for Black local journalists, particularly when covering protests related to police brutality (p. 157).
These trends suggest some desire for readers to have more personal relationships with media content creators, or at least some assumption that they want such connections (e.g., Gong & Eppler, 2022; Greer & Ferguson, 2011). Within the framework of parasocial relationships, media consumers perceive themselves as knowing the people they “meet” through specific media even though they likely have not had firsthand interactions or mediated two-way interactions with them (Levy, 1979; Perse & Rubin, 1989). While journalists’ main role is to provide vital information to the public, some news consumers forge and value emotional connections to specific journalists (e.g., Houlberg, 1984). This study considers whether first-person attribution language aids in forming those perceived personal relationships.
Sourcing and Attribution in News Content
Given these trends, this study explores whether attribution words with more reporter presence would increase content and source perceptions. Previous studies have shown that people do not always notice style deviations in news content (e.g., Ketterer et al., 2020), so this study first considers whether they notice deviations in attribution style.
Bock and Lazard (2022) explored the effects of first-person language and transparency efforts in broadcast journalism. They manipulated videos and print content into two transparency conditions: one with first-person pronouns throughout the story, and one that included first-person pronouns along with “process statements” (e.g., “I brought my camera,” or “When I visited the day care center”). They found that first-person language alone did not affect transparency perceptions; participants associated the process statements with higher transparency, but the pronouns on their own did not trigger that connection. This study considers whether first-person attributions throughout the article will be noticed, or whether they will similarly be overlooked. This leads to the study’s first question.
Effects of Attribution on Content and Source Perceptions
This study explores whether attribution words affect readers’ perceptions. In particular, it looks at the potential effects on message quality (Sundar, 1999), message credibility (Appelman & Sundar, 2016), enjoyment (Oliver et al., 2000), newsworthiness (Mayo & Leshner, 2000), informativeness (Mutz & Reeves, 2005), source perceptions (McCroskey & Teven, 1999) and behavioral intentions (modified from Du et al., 2019; Hu & Sundar, 2010). Studies have shown evidence that these types of measures are affected by other journalistic style elements—such as byline style (e.g., Jia et al., 2024), linguistic style (Appelman & Schmierbach, 2018) and headline style (e.g., Vultee et al., 2022)—so they are included here for the purpose of comparison.
This study also considers whether attribution words signal a type of perceived transparency by making it clear, for example, that the reporter spoke directly to the source, as opposed to reading it from another media outlet. The measure of perceived transparency used in this study comes from Rawlins (2008), where transparency is defined as follows (p. 75):
Transparency is the deliberate attempt to make available all legally releasable information—whether positive or negative in nature—in a manner that is accurate, timely, balanced, and unequivocal, for the purpose of enhancing the reasoning ability of publics and holding organizations accountable for their actions, policies, and practices.
Rawlins (2008) proposes a measure of transparency based on three transparency traits (integrity, respect for others, openness) and four transparency efforts (participation, substantial information, accountability and secrecy). This study specifically focuses on the proposed measure of secrecy: “Simply put, transparency is the opposite of secrecy” (p. 73). Rawlins (2008) cites a definition from Florini (1998; “Secrecy means deliberately hiding your actions; transparency means deliberately revealing them”) and notes the utility of this definition: “This definition as a guideline would allow organizations to gauge their level of transparency by asking, ‘Am I trying to hide something by this action, practice or policy’” (p. 73).
Studies have found conflicting evidence about the effects of transparency efforts on perceptions of credibility, in particular. Curry and Stroud (2021), for example, found a positive effect, where increasing transparency (through information about the newsgathering process and details about the author) led to higher credibility evaluations and higher intentions to engage with the news. Others have found minimal or negative effects. In the aforementioned study by Bock and Lazard (2022), for example, transparency did not significantly affect credibility perceptions. In Tandoc and Thomas (2017), non-transparent articles were rated as more credible than transparent ones, where transparency was operationalized as personal information about the author. Karlsson et al. (2017) found minimal significant effects of “disclosure transparency” and “participatory transparency” on credibility perceptions. They concluded, “Transparency will neither revolutionize nor reform journalism’s credibility in the short or middle-to-long terms. In the long run something might happen, but in order to assess such a possible outcome, a longitudinal approach, measuring accumulative effects, is needed” (p. 675). Koliska (2022) similarly differentiated between types of transparency (“production transparency” and “producer transparency”), yet also found minimal effects. Masullo et al. (2022) found minimal effects, as well. They conducted three experiments to test the effects of transparency boxes in news content; boxes did not affect credibility perceptions with a mock news site, but they did influence perceptions with a more prominent box on real news sites. They concluded that transparency boxes have limited effects on credibility perceptions. These conflicting findings lead to the study’s second research question.
Professional Norms and Communities of Practice
Finally, this study considers readers’ general attitudes toward this type of journalistic style. Research on communities of practice (Eckert & McConnell-Ginet, 1999) suggests that these attitudes might vary based on participants’ connection to the media industries (Ahva, 2017). Within journalism, specific guidelines exist for practitioners to demonstrate professional prowess to the public, but more specifically to demonstrate that expertise to other industry professionals (Ahva, 2017; Steiner, 2007). Mass communication students receive significant instruction on certain styles, and these styles and norms get replicated and passed down to future generations of practitioners (Cameron, 1996; Steiner, 2007). Thus, industry professionals and those receiving instruction on those norms likely notice style adherence and deviations more than members of the public who do not participate in the journalism community of practice. This leads to the study’s final research question.
Method
Study Design
Two online between-subjects experiments tested the effects of attribution style in news articles. After confirming eligibility, participants read a study overview and provided informed consent. They provided demographic information and answered questions about pre-existing media attitudes. They then read a news article that varied by the amount of “reporter presence” in its quote attribution. Finally, they answered questions about their perceptions of the article, their awareness of the quote attribution and their attitudes toward first-person writing in news articles. Both studies used the same stimulus article and the same questions, as described below. The study was approved by the relevant Institutional Review Board.
Participants
Demographics
For Study 1, participants (N = 139) were recruited from undergraduate journalism and mass communication courses at a large midwestern university in the United States. They received extra credit as compensation for their participation. (213 indicated consent; people who did not answer the post-manipulation questions [n = 23], duplicate participants [n = 12], and people who missed one or both attention checks [n = 39] were removed.) Ages ranged from 18 to 23 (M = 19.90, SD = 1.04). Based on free-response data, more identified as female (n = 109, 78.4%) than male (n = 30, 21.6%). For Study 1, online data collection ran in two rounds: December 1–14, 2023 and January 23–February 9, 2024. Independent samples t-tests were conducted to test for differences between the two batches of student data collection. There were no significant differences in their overall perceptions of the article or the time they spent on the article, so the two batches were grouped as one study for the purpose of this analysis.
For Study 2, participants (N = 250) were recruited from Prolific, an online research service. They were financially compensated for their participation. (251 indicated consent; one person missed an attention check and was removed from the study.) Participants were all located in the United States. No additional screeners were included because the researchers did not want to limit observations to readers with any specific characteristics. Ages ranged from 21 to 74 (M = 38.36, SD = 11.90). Based on free-response data, the sample was fairly evenly split between people who identified as female (n = 128, 51.2%) and male (n = 116, 46.4%). A few identified as nonbinary (n = 5, 2.0%), and one person did not respond to the question. When asked about their highest completed education level, the most common response was bachelor’s degree (n = 106), followed by some college (n = 86), a graduate degree (n = 34), a high school degree (n = 22) and less than high school (n = 2). For Study 2, online data collection ran on February 26, 2024.
Media Use
Participants were asked to indicate where they get the majority of their news, and they were given a list of seven options. In Study 1, the most common selection was social networking sites (n = 111), followed by online newspapers (n = 15), broadcast news (n = 6), news aggregate sites (n = 4), cable news (n = 2) and radio stations (n = 1). (None selected “printed newspapers.”) In Study 2, the most common was also social networking sites (n = 119), followed by online newspapers (n = 49), news aggregate sites (n = 37), cable news (n = 18), broadcast news (n = 16), radio stations (n = 6) and printed newspapers (n = 5). They were also asked to indicate how often they follow and pay attention to four types of news content (1 = rarely to 7 = frequently). In Study 1, the most frequently consumed type was national news (M = 4.83, SD = 1.54), followed by sports news (M = 4.62, SD = 2.10), local news (M = 4.35, SD = 1.71) and business news (M = 2.68, SD = 1.57). In Study 2, the most frequently consumed was national news (M = 5.05, SD = 1.57), followed by local news (M = 4.42, SD = 1.67), business news (M = 3.22, SD = 1.62) and sports news (M = 2.98, SD = 2.14).
Stimulus
In both studies, participants read a sample news article about a 17-year-old pilot’s record-breaking solo flight. The article was modified from an article in the Associated Press (Toshkov, 2022). The article was selected because of its neutral tone and its human-interest element. It was also selected because it included several quotes and paraphrases that would make sense with the manipulations. The modified article included eight instances of the manipulations; 70% of the paragraphs included at least one attribution. (See sample stimulus article in Appendix A.)
The article was written into three conditions that varied based on the quote attribution. Each condition included the same quotes and paraphrases. One condition followed the traditional convention, with the attribution word “said.” In the other conditions, all attributions were replaced with “told the reporter” or “told me.” Participants were equally distributed across conditions (Study 1: said [n = 50], told the reporter [n = 39], told me [n = 50]. Study 2: said [n = 79], told the reporter [n = 78], told me [n = 93]).
Attention Checks
To ensure high data quality, participants responded to two attention checks during the study, where they were asked to select specific answers to indicate that they were paying attention. As noted above, participants who missed one or both attention checks were removed from the study (39 were removed in Study 1; 1 was removed in Study 2). Participants also need to pass a Captcha check at the beginning of the study before they could continue. Attention checks, rather than manipulation checks, were used for data filtering because of the nature of the manipulation (O’Keefe, 2003) and because dropping participants who did not notice the manipulation could have led to additional validity concerns (Aronow et al., 2019).
Measures
Unless stated, items were measured from 1 = strongly disagree to 7 = strongly agree. Scale measures with Cronbach’s α values above .70 were considered reliable. Reverse-coded scale items are marked as “rev.”
Awareness of Quote Attribution
After reading the article, participants were directly asked, “How were the quotes attributed in the article you just read?” and they could select from three responses: “said,” “told the reporter” and “told me.”
Pre-Existing Media Attitudes
Self-perceived media literacy was measured with a six-item scale (Vraga et al., 2015), where participants were asked to indicate the extent to which they agree with the following: “I have a good understanding of the concept of media literacy,” “I have the skills to interpret news messages,” “I understand how news is made in the U.S.,” “I am confident in my ability to judge the quality of news,” “I’m not sure what people mean by media literacy (rev.)” and “I’m often confused about the quality of news and information (rev.)” (Study 1: Cronbach’s α = .77, M = 5.17, SD = 0.97. Study 2: Cronbach’s α = .84, M = 5.25, SD = 1.00).
General media trust was measured with a five-item scale (created by Newman et al., 2016; cited in Brosius et al., 2022): “I think you can trust the news most of the time,” “I think you can trust news organizations most of the time,” “I think you can trust journalists most of the time,” “The news media are independent from undue political or government influence most of the time” and “The news media are independent from undue business or commercial influence most of the time” (Study 1: Cronbach’s α = .87, M = 3.34, SD = 1.13. Study 2: Cronbach’s α = .91, M = 3.25, SD = 1.25).
News skepticism was measured with an eight-item scale (Maksl et al., 2015): “I think the news media are fair (rev.),” “I think the news media tell the whole story (rev.),” “I think the news media are accurate (rev.),” “I don’t think the news media can be trusted,” “I think the news media prioritize being first to report a story,” “I think the news media get in the way of society solving its problems,” “I trust the media to report the news fairly (rev.)” and “I have confidence in the people running the institutions of the press (rev.)” (Study 1: Cronbach’s α = .72, M = 4.48, SD = 0.78. Study 2: Cronbach’s α = .89, M = 4.67, SD = 1.10).
Content and Source Perceptions
Participants were asked for their overall quality ranking of the article, through a slider from 0 = low to 100 = high (Study 1: range = 0–91, M = 56.11, SD = 22.22. Study 2: range = 0–100, M = 65.01, SD = 19.99). They were also asked, “How well do you think each of the following terms describes the specific news story you just read?” Message quality was the average of coherent, clear, concise and well-written (Sundar, 1999; Study 1: Cronbach’s α = .84, M = 4.65, SD = 1.23. Study 2: Cronbach’s α = .83, M = 5.37, SD = 0.97). Message credibility was the average of accurate, believable and authentic (Appelman & Sundar, 2016; Study 1: Cronbach’s α = .82, M = 4.63, SD = 1.19. Study 2: Cronbach’s α = .85, M = 5.10, SD = 1.13). Source-related message credibility was the average of authoritative, reliable, reputable and trustworthy (Appelman & Sundar, 2016; Study 1: Cronbach’s α = .78, M = 3.96, SD = 1.15. Study 2: Cronbach’s α = .81, M = 4.49, SD = 1.06). Enjoyment was the average of enjoyable, boring (rev.) and entertaining (Oliver et al., 2000; Study 1: Cronbach’s α = .81, M = 4.33, SD = 1.38. Study 2: Cronbach’s α = .84, M = 4.93, SD = 1.25). Newsworthiness was meant to be the average of important, informative, interesting, serious and disturbing (Mayo & Leshner, 2000); however, internal reliability was low across both studies, so it was removed from further analysis (Study 1: Cronbach’s α = .63, Study 2: Cronbach’s α = .67).
Informativeness was measured with a six-item scale (Mutz & Reeves, 2005): “In general, I found the article to be informative,” “I learned new things about public issues from this article,” “This article gave me food for thought,” “If I needed information about public issues, I would visit this website,” “I felt like I got to know about the public issue by reading this article” and “As a result of reading this article, I am more comfortable talking to friends about this issue” (Study 1: Cronbach’s α = .89, M = 3.44, SD = 1.32. Study 2: Cronbach’s α = .86, M = 3.50, SD = 1.28).
To measure source perceptions, participants were asked, “How well do you think each of the following terms describes the author of the story you just read?”: intelligent, untrained (rev.), inexpert (rev.), informed, incompetent (rev.), bright, caring, interested in me, self-centered (rev.), concerned with me, insensitive (rev.), not understanding (rev.), honest, untrustworthy (rev.), honorable, moral, unethical (rev.) and phoney (rev.) (McCroskey & Teven, 1999; Study 1: Cronbach’s α = .896, M = 4.59, SD = 0.83. Study 2: Cronbach’s α = .90, M = 4.99, SD = 0.77).
Transparency was measured with a five-item secrecy subscale, where higher values indicate less transparency (Rawlins, 2008): “The reporter of this article provides only part of the story to people like me,” “The reporter of this article often leaves out important details in the information it provides to people like me,” “The reporter of this article provides information that is intentionally written in a way to make it difficult to understand,” “The reporter of this article is slow to provide information to people like me” and “The reporter of this article only discloses information when it is required” (Study 1: Cronbach’s α = .84, M = 3.31, SD = 1.19. Study 2: Cronbach’s α = .88, M = 2.71, SD = 1.25).
To measure behavioral intentions, participants were asked to indicate the extent to which they agree with the following (modified from Du et al., 2019; Hu & Sundar, 2010): “I would like to read news articles similar to this one in the future,” “I expect to look up news articles similar to this one in the future,” “I would like to read news articles from the same author in the future,” “I expect to look up news articles from the same author in the future,” “I would recommend this news article to my friends,” “I would share this news article with my friends,” “I would recommend this author to my friends” and “I would share news articles from this author to my friends” (Study 1: Cronbach’s α = .95, M = 2.88, SD = 1.33. Study 2: Cronbach’s α = .95, M = 3.12, SD = 1.40).
Open-Ended Questions
The study ended with three open-ended questions: (1) Was there anything that frustrated you about this article? (2) How do you feel when a reporter mentions themselves in a story? and (3) Do you think reporters should refer to themselves in the first-person (e.g., I, me)? Why or why not?
Results
RQ1: Do Readers Notice Deviations From Conventional Attribution Style in News Articles?
In both studies, about half of the participants correctly identified the attribution style they were shown (Study 1: n = 74, 53%; Study 2: n = 130, 52%). Follow-up analysis explored whether this depended on experimental condition or pre-existing media attitudes. In Study 1, analysis showed a significant difference between people in the “said” (70.0%), “told the reporter” (35.9%) and “told me” (50.0%) conditions in terms of their likelihood of a correct response, χ2 (2, N = 139) = 10.56, p = .005, Cramer’s V = .005. Awareness of the attribution was not significantly correlated with self-perceived media literacy, r(139) = .11, p = .22; media trust, r(139) = .07, p = .42; or news skepticism, r(139) = −.01, p = .94. In Study 2, analysis also showed a significant difference between people in the “said” (74.7%), “told the reporter” (51.3%) and “told me” (33.3%) conditions in terms of their likelihood of a correct response, χ2 (2, N = 250) = 29.29, p < .001, Cramer’s V < .001. Awareness of the attribution was significantly correlated with self-perceived media literacy, r(250) = .22, p = .001, but not with media trust, r(250) = .09, p = .18; or news skepticism, r(250) = −.10, p = .11.
RQ2: Does Quote-Attribution Style Affect Readers’ Content and Source Perceptions?
One-way MANOVAs were conducted to compare effects of the three conditions on readers’ perceptions in each study. Table 1 shows the means, standard deviations and ANOVA results for Study 1; Table 2 shows the results for Study 2. (See tables in Appendix B.)
For Study 1, the MANOVA results showed a significant effect for overall perceptions, Wilks’ Λ = .79, F(18, 256) = 1.79, p = .03, ηp2 = .11. The results showed significant effects of condition on quality, F(2, 136) = 4.54, p = .01, ηp2 = .06; message quality, F(2, 136) = 4.51, p = .01, ηp2 = .06; message credibility, F(2, 136) = 4.44, p = .01, ηp2 = .06; source-related message credibility, F(2, 136) = 7.23, p = .001, ηp2 = .10; source perceptions, F(2, 136) = 9.17, p < .001, ηp2 = .12; and behavioral intention, F(2, 136) = 3.48, p = .03, ηp2 = .05. In all cases, the “told me” condition was perceived more negatively than the others. Analysis did not show effects of condition on enjoyment, F(2, 136) = 1.25, p = .29, ηp2 = .02; informativeness, F(2, 136) = 1.72, p = .18, ηp2 = .03; or transparency, F(2, 136) = 2.25, p = .11, ηp2 = .03.
For Study 2, the MANOVA results showed no significant effect for overall perceptions, Wilks’ Λ = .92, F(18, 478) = 1.15, p = .30, ηp2 = .04. The results did not show significant effects of condition on any of the perceptions: quality, F(2, 247) = .71, p = .50, ηp2 = .006; message quality, F(2, 247) = .15, p = .86, ηp2 = .001; message credibility, F(2, 247) = .38, p = .69, ηp2 = .003; source-related message credibility, F(2, 247) = .73, p = .48, ηp2 = .006; enjoyment, F(2, 247) = .08, p = .92, ηp2 = .001; informativeness, F(2, 247) = .47, p = .62, ηp2 = .004; source perceptions, F(2, 247) = 1.02, p = .36, ηp2 = .008; transparency, F(2, 247) = 1.05, p = .35, ηp2 = .008; or behavioral intention, F(2, 247) = .28, p = .76, ηp2 = .002.
Power analyses were conducted using G*Power (version 3.0; Faul et al., 2007). Given the calculated p values, samples sizes and effect sizes, we conducted post-hoc power analyses for the MANOVA tests in each study. The tests show a power of 91.12% for the significant MANOVA findings in Study 1 and 74.36% for the non-significant MANOVA findings in Study 2. To detect a small effect size (.20) at the .05 level with three groups and nine measures, G*Power requires a sample size of 162; we are, therefore, confident that Study 2 (with N = 250) would have had enough participants to detect an effect if it existed.
RQ3: How Do Readers Interpret First-Person Writing in News Articles?
Qualitative responses to the three open-ended questions were thematically analyzed by two of the researchers. Overall, both researchers identified differences across the two studies, where the students seemed more bothered than the general public by the first-person attributions.
The student sample, which mostly consisted of mass communications students, largely wrote that visible reporter presence was “unprofessional.” One response said not to use first-person pronouns “because it sounds unprofessional. It also sounds like a personal paper they’re writing for themselves rather than for an audience of people.” Some students described first-person writing as “selfish” or “self-centered.” Another student wrote about the reporter inserting themselves into the story and using first-person language as a distraction:
It takes my attention off what is actually important. I’m imagining I’m watching a movie of a reporter interviewing someone instead of feeling like I’m in the movie, interviewing the person myself. It was just very odd. . . . Using the phrase “told me” just sounds like the reporter is so damn important that the interviewee just had to let them know the news. It should be the other way around.
Students also cited journalism guidelines such as Associated Press style as reasons for why first-person constructions should not be used. Another referenced their professional identity in explaining their disapproval of first-person writing: “As a journalist, I do not like it and it makes the author lose credibility in my eyes.” Some noted that they did not mind the style in the article they read for this study, but that the style would bother them more in a different context: “I feel like if it were more of a serious topic, an author should refrain from using first person because it almost insinuates or implies opinion sometimes.” Overall, students expressed a strong preference for third-person language in news articles.
The participants in the non-student sample seemed less bothered by the style variations than the students did. Some did respond negatively (e.g., “I feel that it is VERY unnecessary. The author is NOT the main character of a story that is written unless its an autobiography of themselves otherwise it is irrelevant”), but, in general, many noted that their opinions would depend on the article. As one participant explained,
I think it depends on the context and the style of the article. In some instances, it may be appropriate for a reporter to refer to themselves in the first person, especially if it adds a personal touch or perspective to the story. However, in other cases, it may be more professional and objective to refer to themselves in the third person. Ultimately, it is important for journalists to maintain ethical standards and avoid inserting themselves too much into the story.
Another participant responded that this was “unprofessional,” though went on to explain that their opinion would also vary by context:
Unless it is necessary in the situation, for example the interview takes a turn and the reporter is assaulted or something of the sort (that’s quite dark, but you get what I am saying). Then I suppose they could use themselves in the first-person, otherwise it seems unnecessary. Reporters are writing for a paper or news source, not for themselves.
The same participant continued,
I guess in sports news they do use their opinions, and in those cases first-person is appropriate. The more I think about it, it definitely depends on the case. For serious NEWS cases, no, for opinion cases, then sure, they can.
Some respondents also associated third-person language with more reputable news outlets.
The strongest theme among the non-students was indifference toward attribution styles. Participants expressed more concern about the quality of the article than about the first-person attribution. Responses included: “Doesn’t bug me really. Care more about the story or information” and
I don’t have strong feelings either way. If it weakens the overall impact of the story from using first person than maybe it should be rewritten. Otherwise for a story about a kid circumnavigating the world, it doesn’t seem like it would have that huge of an impact on the reporting.
Across both samples, participants who liked first-person language explained that it contributed to closeness and perceived personal relationships with the journalists. One participant in the non-student sample wrote:
I think if they’re conducting an interview with someone, saying something like “when I asked” or “I sat down with” is okay, because it feels more personal to read . . . almost like you’re actually there on the interview.
Additional non-student responses included: “Yes I think they should, especially if it’s something they are personally experiencing, because it adds relatability and another layer of humanity to the piece”; “I think it is okay for a reporter to say I or me when telling a story because then the viewer can feel like a friend is telling them the story and it is more personal. Any other way would feel distant and robotic”; and “I think they should refer to WE, because we the people want to know and the reporter is included so, We would like to know is fitting.” Similar student responses included: “It’s fine, it makes the reporter feel more personable, but it’s not what I’ve learned about journalism” and “It makes it feel more personal, as there is a direct bridge between the subject of the story and the reader.”
Discussion
Through two online experiments, this study tested the effects of attribution style in news articles on readers’ content and source perceptions. In response to RQ1, participants seemed to have difficulty noticing deviations from the conventional attribution style. Participants in the “said” conditions were the most likely to correctly identify the style they were shown, which suggests they had difficulty noticing deviations. In the non-student sample, participants with higher self-perceived media literacy were more likely to notice the correct attribution. In response to RQ2, quote-attribution style affected content and source perceptions for the student sample, but not for the non-student sample. Quote-attribution style affected content and source perceptions for the student sample, where readers perceived the “told me” condition more negatively than the others. No patterns were found for the non-student sample. In response to RQ3, readers interpret quote-attribution style in multiple ways—those who dislike these kinds of style deviations see them as unprofessional, and those who like them see them as adding a personal nature to the content. Many said they were indifferent, particularly given the context of the particular article. Notably, responses seemed to vary across the two studies, with students expressing a stronger dislike for first-person language than the general public did.
Theoretical Implications
Across both samples, many people did not notice the attribution word in the news article they read. This aligns with previous research where people did not associate pronouns with transparency efforts (e.g., Bock & Lazard, 2022), as well as studies where people did not notice other types of style deviations in news content (e.g., Ketterer et al., 2020). This study also found that quote-attribution style negatively affected some content and source perceptions for the student sample, but not for the non-student sample. Unlike Curry and Stroud (2021), this study did not find positive effects of transparency efforts. This aligns with previous studies that found negative effects of transparency efforts (e.g., Tandoc & Thomas, 2017), as well as previous studies that found minimal effects (e.g., Bock & Lazard, 2022; Karlsson et al., 2017; Koliska, 2022). Moreover, it could be that participants did not see attribution words as being related to transparency all; the non-significant effects on perceived transparency in both samples suggests that the attribution words might not have signaled transparency in the intended manner. Future studies could refine the stimuli to more clearly establish this connection, but, for example, distinguishing between “told me” and “as reported by a different media outlet.”
Attribution effects might have differed based on news consumers’ desire for parasocial relationships with journalists. In response to the open-ended questions, several participants who liked first-person language explained that it contributed to closeness and perceived personal relationships with the journalists. This study did not ask questions related to desire for or perceptions of parasocial relationships, but future studies could more directly include such measures.
The two samples differed in several significant ways: The Study 1 sample was on average younger than the Study 2 sample, and the Study 1 sample was recruited from journalism and mass communications courses, where Study 2 was not. It could be that the differences across samples relate to age, or it could be that the differences relate to journalism-education experience. As explained in research related to communities of practice (Ahva, 2017; Eckert & McConnell-Ginet, 1999), journalism students could be signaling their professionalism through a norm that few people outside of the profession notice or care about. Future work could consider student participants from other programs to see if the student findings were based on area of study. Vultee et al. (2022), for example, found differing effects of journalistic style on participants who were studying media and those who were not. They attribute findings to “a difference between aspirational perceptions—what participants see in writing that they and their peers like—and perceptions of what classroom training reflects” (Vultee et al., 2022, p. 16). The student responses also could relate to findings from Singleton et al. (2024), regarding the questioning of “traditional objectivity.” This particular stimulus article was not about a potentially charged or sensitive topic area, but the students might have been responding to the notion of first-person writing with those types of stories in mind.
Study 1 and Study 2 both used non-random samples; as explained in Basil et al. (2002), this is appropriate when the goal is to test multivariate values, as done in this study, particularly when researchers do not expect differences compared to the general population. However, future research could more directly assess whether specific characteristics moderate the relative effect of these types of manipulations on readers through a more generalizable sample.
Practical Implications
In the context of these experiments, variations in the traditional “said” did not seem to bother participants. However, we hesitate to conclude that journalists should eliminate the “said” convention altogether. Instead, we offer that journalists be open to the possibility of varying their quote-attribution words, depending on the context. Findings suggest that variations do not seem to bother most readers, at least with this type of news article. In the short-answer responses, some participants noted that deviations would bother them more in other contexts. The implication seemed to be that in stories like this, where the topic was not contentious and the facts were not in doubt, the quote-attribution style and use of first-person language did not matter to them. The corollary would be that in articles with more specific concerns about trust or clarity, readers might pay more attention to these types of cues. In breaking news situations, for example, readers might be more concerned with whether reporters directly interacted with the sources. Readers also might be more concerned with first-person language in articles on more sensitive topics, where they might worry about potential bias or overlooked perspectives. Attribution words could also be more relevant in stories where readers think sources are lying or would otherwise like more detailed information or verification about what interaction they had with the journalist. The findings here suggest more flexibility for journalists, where they could consider contextual factors when choosing an attribution word.
This recommendation has implications for educators, as well. Students were more bothered by the style deviation than non-students, which suggests they recognize the convention from the classroom. In fact, some specifically mentioned that this went against their instruction (e.g., “it’s not what I’ve learned about journalism”). Professors enforce these rules heavily in journalism classes (Brooks et al., 2020; Steiner, 2007), which students seem to pick up on here, but other people seem to be more comfortable with variation, as long as it does not distract from the story. Students are being taught to conform to an industry norm, while, at least in this study, the general public did not seem to notice or care. Professors could consider teaching students that there is some flexibility to this convention based on context. Again, the findings from this study could be limited to this particular context, so the researchers are not suggesting a complete change in the way attribution is taught. Instead, based on these findings, we suggest that professors could be more explicit with students that using “said” as the default attribution word is more of a guideline than a rigid “rule.” This nuance, however, might be better suited for more advanced students; professors could consider enforcing “said” in introductory classes while exploring other possibilities in higher-level classes.
Limitations and Future Research
As noted in response to RQ1, many participants did not correctly identify the attribution-style they were shown. Those participants were all kept in the study because noticing was part of the empirical question; however, it could be that the manipulation was not strong enough. A future study could make the manipulations more prominent (as was needed in Masullo et al., 2022), either through bolded or highlighted font, or through more repetition.
In addition, this study used only one stimulus news article, which was selected because of its neutral tone and its human-interest element. As noted above, it could be that the attribution word would matter more in a more contentious context. A future study could compare the effects of attribution style across different types of hard and soft news articles. The effect might also depend on other source factors, such as the type of news outlet or recognizability of the reporter. It could be, for example, that participants are comfortable with first-person attribution in an online-only platform (e.g., BuzzFeed) but not in a legacy publication (e.g., The New York Times). Different attribution words could also be tested, including ones with more first person (e.g., “When I asked,” “answered my question”) or ones that draw more attention to the specific source (e.g., “told the Associated Press,” “told the newspaper”). The article length could be varied, as well. As shown in the Appendix, this study included eight instances of the manipulation in a one-page article. Follow-up studies could consider multiple short news briefs that have fewer instances of the manipulation in each article, to test whether the attribution words are more or less noticeable in those contexts. This study also repeated the same manipulation for every attribution within the article. Future studies could vary the type of quote attribution within each article, based on context. This study also focused on a text-based online news article; it could be that media consumers are more comfortable with first-person content on other platforms, such as social media posts, podcasts, or broadcast. Follow-up studies with different types of media platforms could be helpful in addressing this possibility.
This study also focused on readers’ perceptions of attribution words. A future study could instead explore how journalists think about attribution words and whether that varies based on other characteristics. For example, maybe journalists who are developing their brands and launching freelance careers would prefer the more personal “told the reporter” while those who highly value notions of objectivity would prefer “said.” Future work could also compare journalists’ and non-journalists’ attitudes toward these terms.
Finally, additional individual differences could be explored as potential moderators in future studies. For example, this study did not ask any participants in either sample about their journalism industry experience, which might have been a factor in their responses. Participants in the Prolific sample with significant journalism experience or knowledge, for example, would likely provide different responses than those without that experience. Prolific participants were also not asked about additional demographic characteristics that might have been relevant factors, such as geographic location or income. Similarly, students were not specifically asked about their major or about how many media classes they had taken, which also might have affected their responses (as in Vultee et al., 2022); students taking their first journalism class would likely provide different responses than those who have taken several classes, had internships and worked for student media. As noted in the “Method” section, participants in both samples reported general media trust below the midpoint (Study 1: M = 3.34, Study 2: M = 3.25), news skepticism above the midpoint (Study 1: M = 4.48, Study 2: M = 4.67) and self-perceived media literacy above the midpoint (Study 1: M = 5.17; Study 2: M = 5.25); the similar responses across the two samples suggest that participants likely had similar levels of journalism experience or knowledge, but those factors were not measured. Social rank (Allan & Gilbert, 1995; Gilbert, 2000) might also be a relevant factor in explaining some of the student responses. Perhaps students who feel like they are outside the professional community (e.g., rural students, first-generation students) might have been more concerned about adhering to the “rules” than others. Future studies could directly ask participants about their media background and related demographic characteristics to control for these types of potential moderating effects. Such studies could help to explore the effects of quote-attribution style on readers’ perceptions.
Footnotes
Appendix A
The stimulus article for both experiments was modified from Toshkov (2022). The article was written into three conditions that varied by the amount of “reporter presence” in the quote attribution: told me, told the reporter and said. The article is shown below in the told me condition, with eight instances of the manipulation. The manipulation is bolded below for clarity; in the study, the manipulation was not identified to the participants.
Appendix B
Means, Standard Deviations and Analyses of Variance for Readers’ Perceptions in Study 2
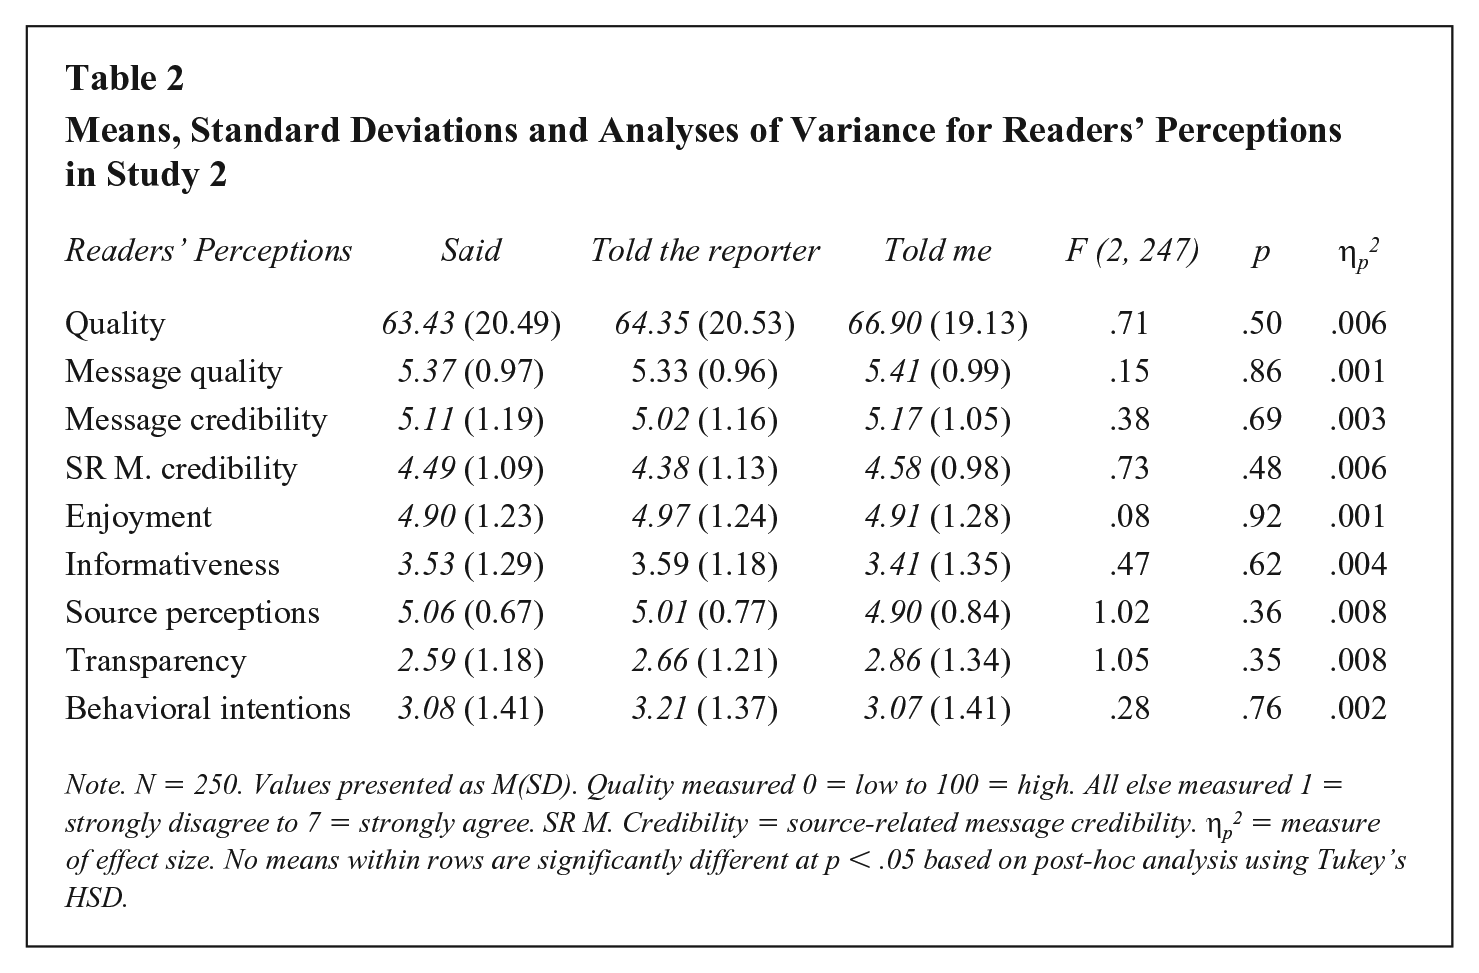
| Readers’ Perceptions | Said | Told the reporter | Told me | F (2, 247) | p | ηp2 |
|---|---|---|---|---|---|---|
| Quality | 63.43 (20.49) | 64.35 (20.53) | 66.90 (19.13) | .71 | .50 | .006 |
| Message quality | 5.37 (0.97) | 5.33 (0.96) | 5.41 (0.99) | .15 | .86 | .001 |
| Message credibility | 5.11 (1.19) | 5.02 (1.16) | 5.17 (1.05) | .38 | .69 | .003 |
| SR M. credibility | 4.49 (1.09) | 4.38 (1.13) | 4.58 (0.98) | .73 | .48 | .006 |
| Enjoyment | 4.90 (1.23) | 4.97 (1.24) | 4.91 (1.28) | .08 | .92 | .001 |
| Informativeness | 3.53 (1.29) | 3.59 (1.18) | 3.41 (1.35) | .47 | .62 | .004 |
| Source perceptions | 5.06 (0.67) | 5.01 (0.77) | 4.90 (0.84) | 1.02 | .36 | .008 |
| Transparency | 2.59 (1.18) | 2.66 (1.21) | 2.86 (1.34) | 1.05 | .35 | .008 |
| Behavioral intentions | 3.08 (1.41) | 3.21 (1.37) | 3.07 (1.41) | .28 | .76 | .002 |
Note. N = 250. Values presented as M(SD). Quality measured 0 = low to 100 = high. All else measured 1 = strongly disagree to 7 = strongly agree. SR M. Credibility = source-related message credibility. ηp2 = measure of effect size. No means within rows are significantly different at p < .05 based on post-hoc analysis using Tukey’s HSD.
Funding
This research was funded by the William Allen White School of Journalism and Mass Communications at the University of Kansas.