Neonatal disorders represent a significant global health challenge with a critical research gap in resource-constrained settings.
Objective
This study aimed to estimate the incidence, mortality, and years of life lost (YLLs) from neonatal disorders in the Eastern Sub-Saharan Africa (ESSA) region from 1990 to 2023.
Methods
The study used estimation methods from the Global Burden of Diseases 2023 study.
Results
In the region, there were an estimated 300,042 new cases of neonatal disorders per 100,000 live births (95% UI: 293,808, 305,567), 21,889 deaths per 100,000 live births (95% UI: 20,447, 22,993), and 1.9 million YLLs per 100,000 live births (95% UI: 1.8, 2.1) in 2023. There was a considerable decline in the rates between 1990 and 2023.
Conclusion
The ESSA region experienced considerably high rates of incidence, mortality, and YLLs from neonatal disorders. Targeted interventions, including primary prevention and quality maternal and newborn health services should be implemented.
Neonatal disorders are defined as illnesses and conditions occurring within the first 28 days of life. These mainly include neonatal preterm birth, neonatal encephalopathy due to birth asphyxia and trauma, neonatal sepsis and other neonatal infections, and hemolytic disease and other neonatal jaundice.1 In 2021, there were over 27 million cases of neonatal disorders, resulting in millions of years of life lost (YLLs).1 Despite a general downward trend in the global load of neonatal disorders, low Socio-Demographic Index (SDI) areas exhibited significant differences.2 Especially, sub-Saharan African countries are not on track to achieve sustainable development goal 3.2 targets by 2030 regarding neonatal disorders and deaths.3 There is substantial burden of neonatal disorders in this region, with preterm complications, birth asphyxia, neonatal infections, and congenital anomalies ranking the top causes of health loss in neonates.4 While some neonatal disorders and early neonatal deaths are higher among males than their female counterparts, the first day of life, followed by the first week after delivery, is the age group in which most of the neonatal disorders occur.5,6
Despite the existence of numerous policies and programs aimed at improving newborn care in the Eastern Sub-Saharan African (ESSA) region, obstacles such as inadequate planning for the implementation of interventions, insufficient monitoring of the planned programs, and a lack of evidence regarding their implementation and monitoring have been observed.7 Additionally, human resource restrictions, capital, equipment, and resource limitations, as well as process flaws in service delivery are among the top challenges in the region to mitigate neonatal conditions.8 Moreover, there remains a significant research gap in comprehensive, region-specific data on the burden of neonatal disorders that informs appropriate intervention.9
This comprehensive study aimed to quantify the incidence, mortality, and YLLs from neonatal disorders in the ESSA region from 1990 to 2023, using data and methods of the Global Burden of Diseases (GBD) 2023 study. The study findings may support health authorities and concerned bodies in identifying high priority areas for targeted intervention, ultimately contributing to improved neonatal health outcomes in the region.
Methods
Study Setting
This study covers the ESSA region, which consists of 15 countries, namely Burundi, Comoros, Djibouti, Eritrea, Ethiopia, Kenya, Madagascar, Malawi, Mozambique, Rwanda, Somalia, South Sudan, Uganda, Tanzania, and Zambia. The region is home to approximately 580 million persons and close to 70% of them live in rural settings where there is scarcity of quality health service delivery, skilled personnel, infrastructure and essential supplies.10,11 More than 50,000 babies are born every day across the region, which amounts to six babies every ten seconds.11
Data Sources
The data on the incidence, death, and YLLs of neonatal disorders were obtained from the global health data network, which is available at: https://ghdx.healthdata.org/gbd-2023/sources.
Patient and Public Involvement
It was not appropriate or possible to involve patients or the public in the design, or conduct, or reporting, or dissemination plans of our research.
Data Analysis
The study used statistical techniques and tools of the GBD 2023 study. Incidence was estimated by employing a Disease Modeling with Bayesian Meta-Regression (DisMod-MR 2.1), which combined multiple statistical models by weighting each based on its out-of-sample predictive validity. Models with lower root-mean-square error received higher weights in the final ensemble. Deaths and YLLs were estimated by using a Cause of Death Ensemble model (CODEm), which was adjusted to ensure internal consistency between cause-specific mortality and all-cause mortality estimates. Cause-specific deaths were multiplied by their life expectancy at the time of death to get the YLLs. Spatiotemporal Gaussian process regression (ST-GPR) was used to smooth variation in trend from 1990 to 2023. All estimates were presented with their 95% uncertainty intervals (UIs) to capture the total uncertainty stemming from sampling errors, data availability, and model specifications. Some rates exceeded 100,000 per 100,000 neonates because a single neonate may be diagnosed with multiple disorders simultaneously, causing the aggregate numerator to surpass the denominator. The age of an infant was grouped as a neonate when aged less than 28 days, an early neonate when aged less than 7 days, and a late neonate when aged 7 to 27 days. A significant net change in estimates between 1990 and 2023 was declared if the 95% uncertainty intervals (UIs) for the percentage change did not cross the zero value.
Results
Incidence of Neonatal Disorders
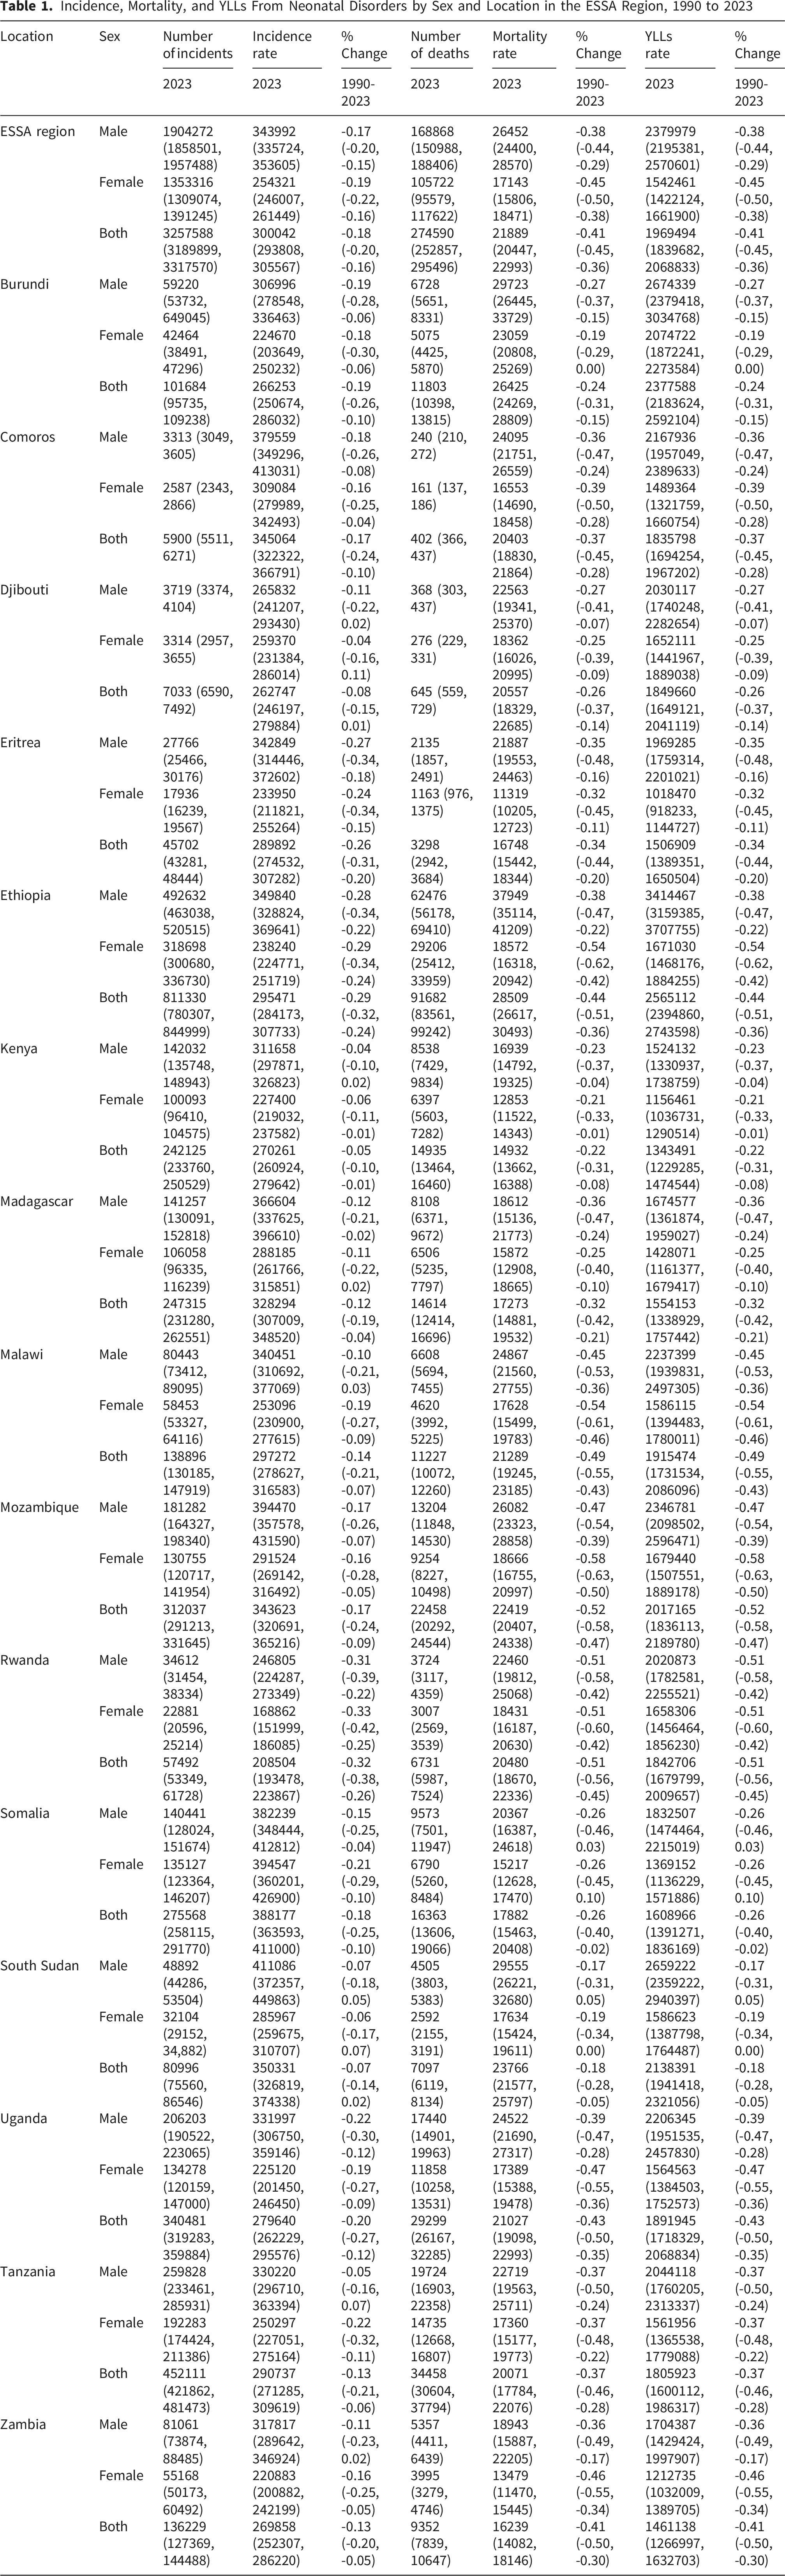
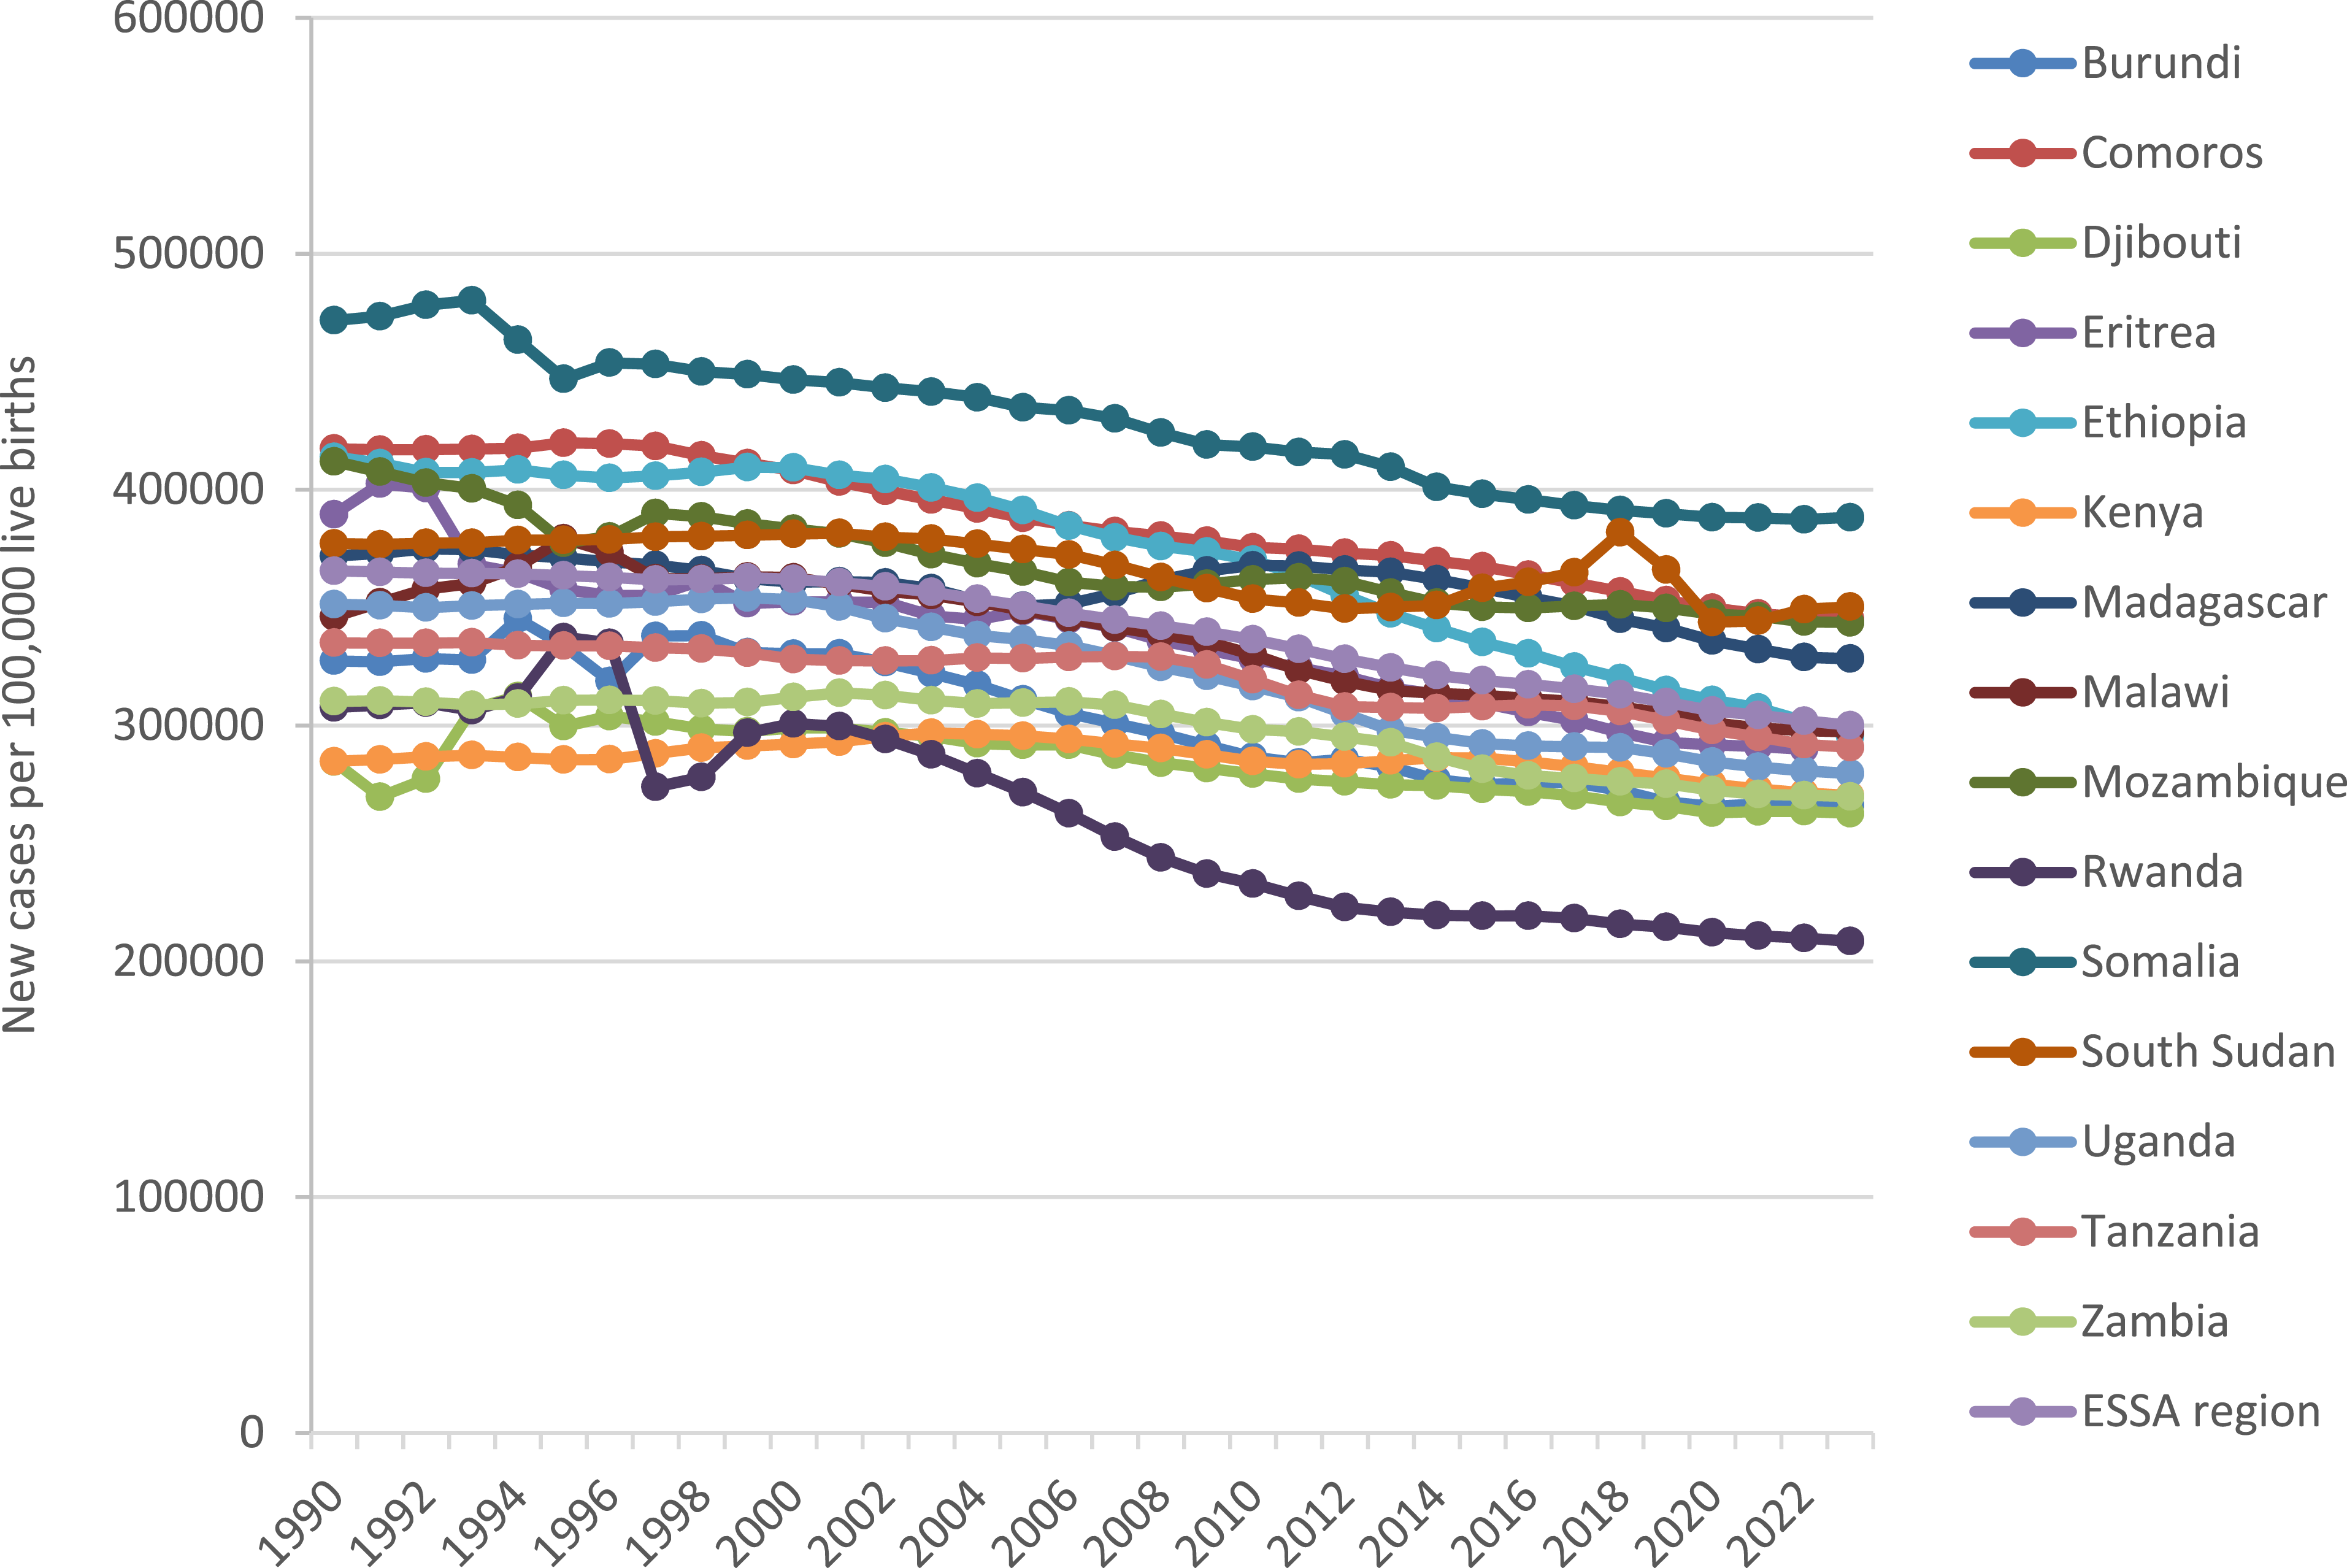
There were an estimated 3.3 million new cases (95% UI: 3.2, 3.3) of neonatal disorders in the ESSA region in 2023, with 1.9 million new cases (95% UI: 1.9, 2.0) among males and 1.3 million new cases (95% IU: 1.3, 1.4) among females. This was equivalent to an estimated 300,042 new cases per 100,000 live births (95% UI: 293,808, 305,567), with 343,992 new cases per 100,000 male live births (95% UI: 335,724, 353,605) and 254,321 new cases per 100,000 female live births (95% UI: 246,007, 261,449). The highest rate was estimated in Comoros [345,064 new cases per 100,000 live births (95% UI: 322,322, 366,791)], Mozambique [343,623 new cases per 100,000 live births (95% UI: 320,691, 365,216)], Somalia [388,177 new cases per 100,000 live births (95% UI: 363,593, 411,000)], and South Sudan [350,331 new cases per 100,000 live births (95% UI: 326,819, 374,338)], whereas the lowest rate was in Burundi [266,253 new cases per 100,000 live births (95% UI: 250,674, 286,032)], Djibouti [262,747 new cases per 100,000 live births (95% UI: 246,197, 279,884)], Kenya [270,261 new cases per 100,000 live births (95% UI: 260,924, 279,642)], and Rwanda [208,504 new cases per 100,000 live births (95% UI: 193,478, 223,867)]. Compared to the rate in 1990, there was an 18% decline (95% UI: -20, -16) in the rate in 2023 in the region. The highest decline was estimated in Rwanda [32% decline (95% UI: -38, -26)] and Ethiopia [29% decline (95% UI: -32, -24)]. However, no statistically significant decline was estimated in Djibouti [-8% (95% UI: -15, 1)] and South Sudan [-7% (95% UI: -14, 2)] since the percentage change estimates crossed the zero value (Table 1, Figure 1).
Incidence, Mortality, and YLLs From Neonatal Disorders by Sex and Location in the ESSA Region, 1990 to 2023
Location
Sex
Number of incidents
Incidence rate
% Change
Number of deaths
Mortality rate
% Change
YLLs rate
% Change
2023
2023
1990-2023
2023
2023
1990-2023
2023
1990-2023
ESSA region
Male
1904272 (1858501, 1957488)
343992 (335724, 353605)
-0.17 (-0.20, -0.15)
168868 (150988, 188406)
26452 (24400, 28570)
-0.38 (-0.44, -0.29)
2379979 (2195381, 2570601)
-0.38 (-0.44, -0.29)
Female
1353316 (1309074, 1391245)
254321 (246007, 261449)
-0.19 (-0.22, -0.16)
105722 (95579, 117622)
17143 (15806, 18471)
-0.45 (-0.50, -0.38)
1542461 (1422124, 1661900)
-0.45 (-0.50, -0.38)
Both
3257588 (3189899, 3317570)
300042 (293808, 305567)
-0.18 (-0.20, -0.16)
274590 (252857, 295496)
21889 (20447, 22993)
-0.41 (-0.45, -0.36)
1969494 (1839682, 2068833)
-0.41 (-0.45, -0.36)
Burundi
Male
59220 (53732, 649045)
306996 (278548, 336463)
-0.19 (-0.28, -0.06)
6728 (5651, 8331)
29723 (26445, 33729)
-0.27 (-0.37, -0.15)
2674339 (2379418, 3034768)
-0.27 (-0.37, -0.15)
Female
42464 (38491, 47296)
224670 (203649, 250232)
-0.18 (-0.30, -0.06)
5075 (4425, 5870)
23059 (20808, 25269)
-0.19 (-0.29, 0.00)
2074722 (1872241, 2273584)
-0.19 (-0.29, 0.00)
Both
101684 (95735, 109238)
266253 (250674, 286032)
-0.19 (-0.26, -0.10)
11803 (10398, 13815)
26425 (24269, 28809)
-0.24 (-0.31, -0.15)
2377588 (2183624, 2592104)
-0.24 (-0.31, -0.15)
Comoros
Male
3313 (3049, 3605)
379559 (349296, 413031)
-0.18 (-0.26, -0.08)
240 (210, 272)
24095 (21751, 26559)
-0.36 (-0.47, -0.24)
2167936 (1957049, 2389633)
-0.36 (-0.47, -0.24)
Female
2587 (2343, 2866)
309084 (279989, 342493)
-0.16 (-0.25, -0.04)
161 (137, 186)
16553 (14690, 18458)
-0.39 (-0.50, -0.28)
1489364 (1321759, 1660754)
-0.39 (-0.50, -0.28)
Both
5900 (5511, 6271)
345064 (322322, 366791)
-0.17 (-0.24, -0.10)
402 (366, 437)
20403 (18830, 21864)
-0.37 (-0.45, -0.28)
1835798 (1694254, 1967202)
-0.37 (-0.45, -0.28)
Djibouti
Male
3719 (3374, 4104)
265832 (241207, 293430)
-0.11 (-0.22, 0.02)
368 (303, 437)
22563 (19341, 25370)
-0.27 (-0.41, -0.07)
2030117 (1740248, 2282654)
-0.27 (-0.41, -0.07)
Female
3314 (2957, 3655)
259370 (231384, 286014)
-0.04 (-0.16, 0.11)
276 (229, 331)
18362 (16026, 20995)
-0.25 (-0.39, -0.09)
1652111 (1441967, 1889038)
-0.25 (-0.39, -0.09)
Both
7033 (6590, 7492)
262747 (246197, 279884)
-0.08 (-0.15, 0.01)
645 (559, 729)
20557 (18329, 22685)
-0.26 (-0.37, -0.14)
1849660 (1649121, 2041119)
-0.26 (-0.37, -0.14)
Eritrea
Male
27766 (25466, 30176)
342849 (314446, 372602)
-0.27 (-0.34, -0.18)
2135 (1857, 2491)
21887 (19553, 24463)
-0.35 (-0.48, -0.16)
1969285 (1759314, 2201021)
-0.35 (-0.48, -0.16)
Female
17936 (16239, 19567)
233950 (211821, 255264)
-0.24 (-0.34, -0.15)
1163 (976, 1375)
11319 (10205, 12723)
-0.32 (-0.45, -0.11)
1018470 (918233, 1144727)
-0.32 (-0.45, -0.11)
Both
45702 (43281, 48444)
289892 (274532, 307282)
-0.26 (-0.31, -0.20)
3298 (2942, 3684)
16748 (15442, 18344)
-0.34 (-0.44, -0.20)
1506909 (1389351, 1650504)
-0.34 (-0.44, -0.20)
Ethiopia
Male
492632 (463038, 520515)
349840 (328824, 369641)
-0.28 (-0.34, -0.22)
62476 (56178, 69410)
37949 (35114, 41209)
-0.38 (-0.47, -0.22)
3414467 (3159385, 3707755)
-0.38 (-0.47, -0.22)
Female
318698 (300680, 336730)
238240 (224771, 251719)
-0.29 (-0.34, -0.24)
29206 (25412, 33959)
18572 (16318, 20942)
-0.54 (-0.62, -0.42)
1671030 (1468176, 1884255)
-0.54 (-0.62, -0.42)
Both
811330 (780307, 844999)
295471 (284173, 307733)
-0.29 (-0.32, -0.24)
91682 (83561, 99242)
28509 (26617, 30493)
-0.44 (-0.51, -0.36)
2565112 (2394860, 2743598)
-0.44 (-0.51, -0.36)
Kenya
Male
142032 (135748, 148943)
311658 (297871, 326823)
-0.04 (-0.10, 0.02)
8538 (7429, 9834)
16939 (14792, 19325)
-0.23 (-0.37, -0.04)
1524132 (1330937, 1738759)
-0.23 (-0.37, -0.04)
Female
100093 (96410, 104575)
227400 (219032, 237582)
-0.06 (-0.11, -0.01)
6397 (5603, 7282)
12853 (11522, 14343)
-0.21 (-0.33, -0.01)
1156461 (1036731, 1290514)
-0.21 (-0.33, -0.01)
Both
242125 (233760, 250529)
270261 (260924, 279642)
-0.05 (-0.10, -0.01)
14935 (13464, 16460)
14932 (13662, 16388)
-0.22 (-0.31, -0.08)
1343491 (1229285, 1474544)
-0.22 (-0.31, -0.08)
Madagascar
Male
141257 (130091, 152818)
366604 (337625, 396610)
-0.12 (-0.21, -0.02)
8108 (6371, 9672)
18612 (15136, 21773)
-0.36 (-0.47, -0.24)
1674577 (1361874, 1959027)
-0.36 (-0.47, -0.24)
Female
106058 (96335, 116239)
288185 (261766, 315851)
-0.11 (-0.22, 0.02)
6506 (5235, 7797)
15872 (12908, 18665)
-0.25 (-0.40, -0.10)
1428071 (1161377, 1679417)
-0.25 (-0.40, -0.10)
Both
247315 (231280, 262551)
328294 (307009, 348520)
-0.12 (-0.19, -0.04)
14614 (12414, 16696)
17273 (14881, 19532)
-0.32 (-0.42, -0.21)
1554153 (1338929, 1757442)
-0.32 (-0.42, -0.21)
Malawi
Male
80443 (73412, 89095)
340451 (310692, 377069)
-0.10 (-0.21, 0.03)
6608 (5694, 7455)
24867 (21560, 27755)
-0.45 (-0.53, -0.36)
2237399 (1939831, 2497305)
-0.45 (-0.53, -0.36)
Female
58453 (53327, 64116)
253096 (230900, 277615)
-0.19 (-0.27, -0.09)
4620 (3992, 5225)
17628 (15499, 19783)
-0.54 (-0.61, -0.46)
1586115 (1394483, 1780011)
-0.54 (-0.61, -0.46)
Both
138896 (130185, 147919)
297272 (278627, 316583)
-0.14 (-0.21, -0.07)
11227 (10072, 12260)
21289 (19245, 23185)
-0.49 (-0.55, -0.43)
1915474 (1731534, 2086096)
-0.49 (-0.55, -0.43)
Mozambique
Male
181282 (164327, 198340)
394470 (357578, 431590)
-0.17 (-0.26, -0.07)
13204 (11848, 14530)
26082 (23323, 28858)
-0.47 (-0.54, -0.39)
2346781 (2098502, 2596471)
-0.47 (-0.54, -0.39)
Female
130755 (120717, 141954)
291524 (269142, 316492)
-0.16 (-0.28, -0.05)
9254 (8227, 10498)
18666 (16755, 20997)
-0.58 (-0.63, -0.50)
1679440 (1507551, 1889178)
-0.58 (-0.63, -0.50)
Both
312037 (291213, 331645)
343623 (320691, 365216)
-0.17 (-0.24, -0.09)
22458 (20292, 24544)
22419 (20407, 24338)
-0.52 (-0.58, -0.47)
2017165 (1836113, 2189780)
-0.52 (-0.58, -0.47)
Rwanda
Male
34612 (31454, 38334)
246805 (224287, 273349)
-0.31 (-0.39, -0.22)
3724 (3117, 4359)
22460 (19812, 25068)
-0.51 (-0.58, -0.42)
2020873 (1782581, 2255521)
-0.51 (-0.58, -0.42)
Female
22881 (20596, 25214)
168862 (151999, 186085)
-0.33 (-0.42, -0.25)
3007 (2569, 3539)
18431 (16187, 20630)
-0.51 (-0.60, -0.42)
1658306 (1456464, 1856230)
-0.51 (-0.60, -0.42)
Both
57492 (53349, 61728)
208504 (193478, 223867)
-0.32 (-0.38, -0.26)
6731 (5987, 7524)
20480 (18670, 22336)
-0.51 (-0.56, -0.45)
1842706 (1679799, 2009657)
-0.51 (-0.56, -0.45)
Somalia
Male
140441 (128024, 151674)
382239 (348444, 412812)
-0.15 (-0.25, -0.04)
9573 (7501, 11947)
20367 (16387, 24618)
-0.26 (-0.46, 0.03)
1832507 (1474464, 2215019)
-0.26 (-0.46, 0.03)
Female
135127 (123364, 146207)
394547 (360201, 426900)
-0.21 (-0.29, -0.10)
6790 (5260, 8484)
15217 (12628, 17470)
-0.26 (-0.45, 0.10)
1369152 (1136229, 1571886)
-0.26 (-0.45, 0.10)
Both
275568 (258115, 291770)
388177 (363593, 411000)
-0.18 (-0.25, -0.10)
16363 (13606, 19066)
17882 (15463, 20408)
-0.26 (-0.40, -0.02)
1608966 (1391271, 1836169)
-0.26 (-0.40, -0.02)
South Sudan
Male
48892 (44286, 53504)
411086 (372357, 449863)
-0.07 (-0.18, 0.05)
4505 (3803, 5383)
29555 (26221, 32680)
-0.17 (-0.31, 0.05)
2659222 (2359222, 2940397)
-0.17 (-0.31, 0.05)
Female
32104 (29152, 34,882)
285967 (259675, 310707)
-0.06 (-0.17, 0.07)
2592 (2155, 3191)
17634 (15424, 19611)
-0.19 (-0.34, 0.00)
1586623 (1387798, 1764487)
-0.19 (-0.34, 0.00)
Both
80996 (75560, 86546)
350331 (326819, 374338)
-0.07 (-0.14, 0.02)
7097 (6119, 8134)
23766 (21577, 25797)
-0.18 (-0.28, -0.05)
2138391 (1941418, 2321056)
-0.18 (-0.28, -0.05)
Uganda
Male
206203 (190522, 223065)
331997 (306750, 359146)
-0.22 (-0.30, -0.12)
17440 (14901, 19963)
24522 (21690, 27317)
-0.39 (-0.47, -0.28)
2206345 (1951535, 2457830)
-0.39 (-0.47, -0.28)
Female
134278 (120159, 147000)
225120 (201450, 246450)
-0.19 (-0.27, -0.09)
11858 (10258, 13531)
17389 (15388, 19478)
-0.47 (-0.55, -0.36)
1564563 (1384503, 1752573)
-0.47 (-0.55, -0.36)
Both
340481 (319283, 359884)
279640 (262229, 295576)
-0.20 (-0.27, -0.12)
29299 (26167, 32285)
21027 (19098, 22993)
-0.43 (-0.50, -0.35)
1891945 (1718329, 2068834)
-0.43 (-0.50, -0.35)
Tanzania
Male
259828 (233461, 285931)
330220 (296710, 363394)
-0.05 (-0.16, 0.07)
19724 (16903, 22358)
22719 (19563, 25711)
-0.37 (-0.50, -0.24)
2044118 (1760205, 2313337)
-0.37 (-0.50, -0.24)
Female
192283 (174424, 211386)
250297 (227051, 275164)
-0.22 (-0.32, -0.11)
14735 (12668, 16807)
17360 (15177, 19773)
-0.37 (-0.48, -0.22)
1561956 (1365538, 1779088)
-0.37 (-0.48, -0.22)
Both
452111 (421862, 481473)
290737 (271285, 309619)
-0.13 (-0.21, -0.06)
34458 (30604, 37794)
20071 (17784, 22076)
-0.37 (-0.46, -0.28)
1805923 (1600112, 1986317)
-0.37 (-0.46, -0.28)
Zambia
Male
81061 (73874, 88485)
317817 (289642, 346924)
-0.11 (-0.23, 0.02)
5357 (4411, 6439)
18943 (15887, 22205)
-0.36 (-0.49, -0.17)
1704387 (1429424, 1997907)
-0.36 (-0.49, -0.17)
Female
55168 (50173, 60492)
220883 (200882, 242199)
-0.16 (-0.25, -0.05)
3995 (3279, 4746)
13479 (11470, 15445)
-0.46 (-0.55, -0.34)
1212735 (1032009, 1389705)
-0.46 (-0.55, -0.34)
Both
136229 (127369, 144488)
269858 (252307, 286220)
-0.13 (-0.20, -0.05)
9352 (7839, 10647)
16239 (14082, 18146)
-0.41 (-0.50, -0.30)
1461138 (1266997, 1632703)
-0.41 (-0.50, -0.30)
Trends of incidence rate of neonatal disorders in the ESSA region, 1990 to 2023
There were 302,852 new cases (95% UI: 285,639, 320,766) of neonatal disorders among early neonates in the ESSA region in 2023. This was equivalent to 110,630 new cases per 100,000 live births (95% UI: 104,343, 117,174). The lowest rate was estimated in Kenya [144,598 new cases per 100,000 live births (95% UI: 118,925, 170,249)]. Between 1990 and 2023, the incidence rate among early neonates declined by 30% (95% UI: -36, -25) in the region. However, no statistically significant decline was estimated in Kenya [-6% (95% UI: -27, 16)] since the percentage change estimate crossed the zero value (Table 2).
Incidence, Mortality, and YLLs From Neonatal Disorders by Age and Location in the ESSA Region, 1990 to 2023
Location
Age
Number of incidents
Incidence rate
% of change
Number of deaths
Mortality rate
% of change
YLLs rate
% of change
2023
2023
1990-2023
2023
2023
1990-2023
2023
1990-2023
ESSA region
0-6 days
302852 (285639, 320766)
110630 (104343, 117174)
-0.30 (-0.36, -0.25)
208161 (195994, 218071)
76040 (71596, 79660)
-0.40 (-0.44, -0.35)
6841750 (6441850, 7167475)
-0.40 (-0.44, -0.35)
7-27 days
283962 (268032, 301589)
34972 (33011, 37143)
-0.39 (-0.43, -0.33)
29493 (24397, 33379)
3632 (3005, 4111)
-0.44 (-0.53, -0.31)
326816 (270349, 369873)
-0.44 (-0.54, -0.31)
<28 days
3257588 (3189899, 3317570)
300042 (293808, 305567)
-0.18 (-0.20, -0.16)
237654 (221990, 249641)
21889 (20447, 22993)
-0.41 (-0.45, -0.36)
1969494 (1839682, 2068833)
-0.41 (-0.45, -0.36)
Burundi
0-6 days
10481 (8995, 12391)
108755 (93331, 128574)
-0.32 (-0.46, -0.13)
8594 (8074, 9192)
89170 (83775, 95378)
-0.26 (-0.33, -0.18)
8023148 (7537673, 8581707)
-0.26 (-0.34, -0.19)
7-27 days
10133 (8471, 11763)
35488 (29666, 41196)
-0.37 (-0.50, -0.22)
1498 (1027, 2059)
5246 (3597, 7212)
0.00 (-0.28, 0.34)
472042 (323611, 648906)
0.00 (-0.28, 0.34)
<28 days
101684 (95735, 109238)
266253 (250674, 286032)
-0.19 (-0.26, -0.09)
10092 (9269, 11002)
26425 (24269, 28809)
-0.24 (-0.31, -0.15)
2377588 (2183624, 2592104)
-0.24 (-0.31, -0.15)
Comoros
0-6 days
496 (421, 573)
115059 (97776, 133001)
-0.32 (-0.46, -0.15)
292 (270, 310)
67707 (62610, 72003)
-0.39 (-0.46, -0.30)
6091935 (5633390, 6478508)
-0.39 (-0.46, -0.30)
7-27 days
433 (368, 509)
33817 (28777, 39831)
-0.40 (-0.52, -0.23)
57 (46, 68)
4473 (3598, 5286)
-0.25 (-0.47, 0.09)
402469 (323681, 475623)
-0.25 (-0.47, 0.09)
<28 days
5900 (5511, 6271)
345064 (322322, 366791)
-0.17 (-0.24, -0.10)
349 (322, 374)
20403 (18830, 21864)
-0.37 (-0.45, -0.27)
1835798 (1694254, 1967202)
-0.37 (-0.45, -0.28)
Djibouti
0-6 days
771 (645, 907)
114378 (95770, 134565)
-0.27 (-0.40, -0.10)
472 (426, 518)
70085 (63243, 76813)
-0.28 (-0.38, -0.17)
6305901 (5690279, 6911277)
-0.28 (-0.38, -0.17)
7-27 days
715 (608, 832)
35711 (30335, 41551)
-0.31 (-0.46, -0.10)
78 (63, 93)
3893 (3138, 4634)
-0.07 (-0.33, 0.33)
350222 (282341, 416936)
-0.08 (-0.33, 0.33)
<28 days
7033 (6590, 7492)
262747 (246197, 279884)
-0.08 (-0.15, 0.01)
550 (491, 607)
20557 (18329, 22685)
-0.26 (-0.37, -0.14)
1849660 (1649121, 2041119)
-0.26 (-0.37, -0.14)
Eritrea
0-6 days
4056 (3443, 4762)
102200 (86744, 119977)
-0.33 (-0.43, -0.19)
2107 (1943, 2282)
53088 (48955, 57496)
-0.37 (-0.46, -0.24)
4776601 (4404742, 5173269)
-0.37 (-0.46, -0.24)
7-27 days
3786 (3256, 4408)
32092 (27605, 37369)
-0.41 (-0.52, -0.28)
533 (441, 617)
4521 (3740, 5229)
-0.13 (-0.35, 0.30)
406801 (336463, 470454)
-0.13 (-0.35, 0.30)
<28 days
45702 (43281, 48444)
289892 (274532, 307282)
-0.26 (-0.31, -0.20)
2640 (2434, 2892)
16748 (15442, 18344)
-0.34 (-0.44, -0.20)
1506909 (1389351, 1650504)
-0.34 (-0.44, -0.20)
Ethiopia
0-6 days
75855 (64429, 88705)
109373 (92898, 127900)
-0.35 (-0.48, -0.20)
65288 (60702, 69695)
94136 (87524, 100491)
-0.41 (-0.48, -0.33)
8469904 (7875052, 9041742)
-0.41 (-0.48, -0.33)
7-27 days
75913 (64533, 87579)
36988 (31444, 42673)
-0.44 (-0.55, -0.30)
12995 (10649, 14664)
6332 (5189, 7145)
-0.54 (-0.65, -0.37)
569701 (466837, 642843)
-0.54 (-0.65, -0.37)
<28 days
811330 (780307, 844999)
295471 (284173, 307733)
-0.29 (-0.32, -0.24)
78283 (73087, 83730)
28509 (26617, 30493)
-0.44 (-0.51, -0.36)
2565112 (2394860, 2743598)
-0.44 (-0.51, -0.36)
Kenya
0-6 days
32582 (26797, 38362)
144598 (118925, 170249)
-0.06 (-0.27, 0.16)
12294 (11257, 13507)
54558 (49957, 59942)
-0.22 (-0.32, -0.09)
4908897 (4494874, 5393348)
-0.22 (-0.32, -0.09)
7-27 days
30510 (25857, 36055)
45499 (38561, 53767)
-0.15 (-0.32, 0.05)
1084 (900, 1271)
1616 (1343, 1895)
-.020 (-0.38, 0.07)
145410 (120812, 170528)
-0.20 (-0.38, 0.07)
<28 days
242125 (233760, 250529)
270261 (260924, 279642)
-0.05 (-0.10, -0.01)
13377 (12240, 14682)
14932 (13662, 16388)
-0.22 (-0.31, -0.08)
1343491 (1229285, 1474544)
-0.22 (-0.31, -0.08)
Madagascar
0-6 days
18843 (15852, 21826)
99200 (83450, 114902)
-0.32 (-0.45, -0.15)
12123 (10489, 13630)
63821 (55218, 71753)
-0.31 (-0.41, -0.21)
5742291 (4968229, 6455980)
-0.31 (-0.41, -0.21)
7-27 days
15974 (13658, 18365)
28354 (24242, 32598)
-0.44 (-0.54, -0.31)
889 (669, 1141)
1579 (1188, 2025)
-0.35 (-0.52, -0.14)
142042 (106875, 182222)
-0.35 (-0.52, -0.14)
<28 days
247314 (231280, 262551)
328294 (307009, 348520)
-0.12 (-0.19, -0.04)
13012 (11210, 14714)
17273 (14881, 19532)
-0.32 (-0.42, -0.21)
1554153 (1338929, 1757442)
-0.32 (-0.42, -0.21)
Malawi
0-6 days
12075 (10157, 14117)
102573 (86278, 119921)
-0.31 (-0.44, -0.13)
9075 (8223, 9801)
77088 (69855, 83260)
-0.49 (-0.54, -0.43)
6936029 (6285219, 7491371)
-0.49 (-0.54, -0.43)
7-27 days
11067 (9422, 13008)
31663 (26956, 37218)
-0.36 (-0.48, -0.20)
872 (645, 1113)
2495 (1844, 3185)
-0.43 (-0.58, -0.22)
224524 (165921, 286609)
-0.43 (-0.58, -0.22)
<28 days
138896 (130185, 147919)
297272 (278627, 316583)
-0.14 (-0.21, -0.06)
9947 (8992, 10833)
21289 (19245, 23185)
-0.49 (-0.55, -0.43)
1915474 (1731534, 2086096)
-0.49 (-0.55, -0.43)
Mozambique
0-6 days
25035 (21269, 28888)
109358 (92906, 126191)
-0.35 (-0.47, -0.19)
18879 (17369, 20445)
82469 (75871, 89306)
-0.52 (-0.56, -0.46)
7420210 (6826545, 8035379)
-0.52 (-0.56, -0.46)
7-27 days
22275 (19257, 26553)
32798 (28355, 39097)
-0.48 (-0.58, -0.35)
1479 (1114, 1767)
2178 (1640, 2601)
-0.57 (-0.66, -0.42)
195923 (147518, 234040)
-0.57 (-0.66, -0.42)
<28 days
312037 (291213, 331645)
343623 (320691, 365216)
-0.17 (-0.24, -0.09)
20358 (18531, 22100)
22419 (20407, 24338)
-0.52 (-0.58, -0.47)
2017165 (1836113, 2189780)
-0.52 (-0.58, -0.47)
Rwanda
0-6 days
7229 (6292, 8557)
104241 (90717, 123382)
-0.37 (-0.50, -0.21)
4918 (4536, 5369)
70914 (65404, 77414)
-0.52 (-0.57, -0.46)
6380489 (5884732, 6965360)
-0.52 (-0.57, -0.46)
7-27 days
7184 (6136, 8484)
34809 (29730, 41108)
-0.44 (-0.55, -0.32)
729 (578, 884)
3532 (2802, 4282)
-0.41 (-0.55, -0.22)
317828 (252090, 385296)
-0.41 (-0.55, -0.22)
<28 days
57492 (53349, 61728)
208504 (193478, 223867)
-0.32 (-0.38, -0.26)
5647 (5148, 6159)
20480 (18670, 22336)
-0.51 (-0.56, -0.45)
1842706 (1679799, 2009657)
-0.51 (-0.56, -0.45)
Somalia
0-6 days
20327 (17502, 23618)
113238 (97503, 131572)
-0.28 (-0.43, -0.11)
9527 (8281, 10843)
53075 (46135, 60406)
-0.31 (-0.44, -0.10)
4775461 (4150984, 5435037)
-0.31 (-0.44, -0.10)
7-27 days
21332 (17683, 24475)
40220 (33339, 46144)
-0.34 (-0.48, -0.18)
3168 (2429, 3793)
5972 (4579, 7151)
-0.01 (-0.37, 0.66)
537321 (411990, 643420)
-0.01 (-0.37, 0.66)
<28 days
275568 (258115, 291770)
388177 (363593, 411000)
-0.18 (-0.25, -0.10)
12695 (10977, 14487)
17882 (15463, 20408)
-0.26 (-0.40, -0.02)
1608966 (1391271, 1836169)
-0.26 (-0.40, -0.02)
South Sudan
0-6 days
7229 (6138, 8327)
123845 (105156, 142664)
-0.22 (-0.38, -0.03)
4706 (4280, 5083)
80627 (73323, 87078)
-0.22 (-0.30, -0.09)
7254421 (6597233, 7834916)
-0.22 (-0.30, -0.09)
7-27 days
7138 (6080, 8268)
41302 (35179, 47838)
-0.26 (-0.41, -0.09)
789 (592, 985)
4564 (3425, 5700)
0.21 (-0.13, 0.76)
410639 (308114, 512827)
0.21 (-0.13, 0.76)
<28 days
80996 (75560, 86546)
350331 (326819, 374338)
-0.07 (-0.14, 0.02)
5495 (4989, 5964)
23766 (21577, 25797)
-0.18 (-0.28, -0.05)
2138391 (1941418, 2321056)
-0.18 (-0.28, -0.05)
Uganda
0-6 days
32274 (26989, 38579)
105167 (87947, 125711)
-0.31 (-0.46, -0.13)
23507 (21369, 25566)
76599 (69631, 83308)
-0.42 (-0.49, -0.35)
6892014 (6265091, 7495720)
-0.42 (-0.49, -0.35)
7-27 days
29837 (25159, 34731)
32764 (27626, 38138)
-0.40 (-0.53, -0.25)
2095 (1651, 2615)
2301 (1813, 2871)
-0.43 (-0.59, -0.20)
207013 (163146, 258305)
-0.43 (-0.59, -0.20)
<28 days
340481 (319283, 359884)
279640 (262229, 295576)
-0.20 (-0.27, -0.12)
25602 (23253, 27996)
21027 (19098, 22993)
-0.43 (-0.50, -0.35)
1891945 (1718329, 2068834)
-0.43 (-0.50, -0.35)
Tanzania
0-6 days
42400 (35778, 50572)
108329 (91409, 129206)
-0.29 (-0.43, -0.14)
28824 (25665, 31655)
73642 (65571, 80874)
-0.36 (-0.44, -0.26)
6625974 (5899799, 7276715)
-0.36 (-0.44, -0.26)
7-27 days
35778 (30347, 42020)
30747 (26079, 36111)
-0.40 (-0.51, -0.27)
2388 (1775, 2941)
2052 (1525, 2528)
-0.48 (-0.63, -0.30)
184658 (137252, 227429)
-0.48 (-0.63, -0.30)
<28 days
452111 (421862, 481473)
290737 (271285, 309619)
-0.13 (-0.21, -0.06)
31212 (27655, 34330)
20071 (17784, 22076)
-0.37 (-0.46, -0.28)
1805923 (1600112, 1986317)
-0.37 (-0.46, -0.28)
Zambia
0-6 days
12948 (11163, 15255)
101834 (87795, 119975)
-0.28 (-0.41, -0.11)
7384 (6518, 8167)
58072 (51265, 64235)
-0.40 (-0.49, -0.29)
5225063 (4612556, 5779538)
-0.40 (-0.49, -0.29)
7-27 days
11652 (9980, 13607)
30851 (26425, 36030)
-0.38 (-0.49, -0.23)
814 (564, 1033)
2155 (1493, 2736)
-0.45 (-0.59, -0.23)
193918 (134296, 246151)
-0.45 (-0.59, -0.23)
<28 days
136229 (127369, 144488)
269858 (252307, 286220)
-0.13 (-0.20, -0.05)
8198 (7109, 9160)
16239 (14082, 18146)
-0.41 (-0.50, -0.30)
1461138 (1266997, 1632703)
-0.41 (-0.50, -0.30)
Among late neonates, 283,962 new cases (95% UI: 268,032, 301,589) of neonatal disorders were estimated in the ESSA region in 2023. This was equivalent to 34,972 new cases per 100,000 live births (95% UI: 33,011, 37,143). The highest rate was estimated in Kenya [45,499 new cases per 100,000 live births (95% UI: 38,561, 53,767)], whereas the lowest rate was in Madagascar [28,354 new cases per 100,000 live births (95% UI: 24,242, 32,598)]. The incidence rate of neonatal disorders declined by 39% (95% UI: -43, -33) in 2023 compared to the rate in 1990. The highest decline was estimated in Mozambique, with a 48% decline (95% UI: -58, -35). However, there was no statistically significant decline in Kenya [-15% (95% UI -32, 5)] since the percentage change estimate crossed the zero value (Table 2).
Among neonates, there were 221,955 new cases of preterm births per 100,000 live births (95% UI: 216889, 226769), with 252,720 new cases per 100,000 male live births (95% UI: 244,914, 261,004) and 189,951 new cases per 100,000 female live births (95% UI: 183,344, 196,454). The highest rate was estimated in Comoros [270,705 new cases per 100,000 live births (95% UI: 248,836, 292,384)], Madagascar [259,747 new cases per 100,000 live births (95% UI: 240,110, 279,601)], Mozambique [266,358 new cases per 100,000 live births (95% UI: 246,117, 286,936)], Somalia [289,871 new cases per 100,000 live births (95% UI: 264,607, 312,157)], and South Sudan [261,357 new cases per 100,000 live births (95% UI: 240,308, 283,640)], whereas the lowest rate was in Burundi [183,931 new cases per 100,000 live births (95% UI: 167,981, 202,378)], Dibouti [187,773 new cases per 100,000 live births (95% UI: 172,309, 205,147)], Kenya [178,551 new cases per 100,000 live births (95% UI: 175,601, 181,592)], and Rwanda [136,454 new cases per 100,000 live births (95% UI: 124,496, 148,795)]. The incidence rate declined by 10% (95% UI: -13, -8) in the region in 2023 compared to the rate in 1990. Rwanda and Ethiopia experienced the highest decline, with a 27% decline (95% UI: -35, -18) and 23% decline (95% UI: -28, -19), respectively. However, there was no statistically significant change in the rate in Comoros [-10% (95% UI: -18, 0)], Djibouti [1% (95% UI: -9, 17)], Kenya [2% (95% UI: -1, 4)], Madagascar [-3% (95% UI: -13, 8)], Malawi [-6% (95% UI: -16, 7)], Mozambique [-6% (95% UI: -16, 5)], South Sudan [-1% (95% UI: -11, 10)], Tanzania [-4% (95% UI: -16, 8)], and Zambia [-3% (95% UI: -14, 8)] (Table 3).
Incidence Rate of Neonatal Disorders by Location, Sex, and Type in the ESSA Region, 1990 to 2023
Location
Sex
Neonatal preterm birth
% of change
Neonatal encephalopathy due to birth asphyxia and trauma
% of change
Neonatal sepsis and other neonatal infections
% of change
Hemolytic disease and other neonatal jaundice
% of change
2023
1990-2023
2023
1990-2023
2023
1990-2023
2023
1990-2023
ESSA region
Male
252720 (244914, 261004)
-0.09 (-0.13, -0.06)
23587 (23061, 24112)
-0.26 (-0.29, -0.24)
65001 (61209, 68689)
-0.36 (-0.41, -0.31)
2684 (1918, 3734)
-0.33 (-0.45, -0.10)
Female
189951 (183344, 196454)
-0.12 (-0.16, -0.07)
19112 (18346, 19786)
-0.38 (-0.41, -0.34)
42655 (40151, 44929)
-0.33 (-0.37, -0.28)
2603 (1819, 3711)
-0.33 (-0.45, -0.09)
Both
221955 (216889, 226769)
-0.10 (-0.13, -0.08)
21394 (20941, 21813)
-0.32 (-0.34, -0.30)
54049 (51725, 56371)
-0.35 (-0.38, -0.31)
2645 (1867, 3711)
-0.33 (-0.45, -0.10)
Burundi
Male
212808 (187499, 238340)
-0.13 (-0.26, 0.07)
25936 (24390, 27596)
-0.12 (-0.21, -0.04)
64808 (53764, 75053)
-0.36 (-0.49, -0.20)
3443 (2527, 4629)
-0.13 (-0.31, 0.31)
Female
154460 (135165, 176586)
-0.14 (-0.29, 0.04)
23945 (21509, 26708)
-0.16 (-0.27, -0.03)
42923 (36669, 49337)
-0.33 (-0.45, -0.18)
3343 (2415, 4593)
-0.12 (-0.31, 0.37)
Both
183931 (167981, 202378)
-0.13 (-0.23, -0.01)
24951 (23434, 26379)
-0.14 (-0.22, -0.07)
53977 (48335, 59866)
-0.35 (-0.44, -0.23)
3393 (2474, 4608)
-0.13 (-0.31, 0.35)
Comoros
Male
291747 (263737, 322232)
-0.11 (-0.21, 0.05)
19325 (18144, 20671)
-0.31 (-0.37, -0.25)
65201 (55484, 77015)
-0.38 (-0.49, -0.21)
3286 (1522, 5843)
-0.40 (-0.59, -0.19)
Female
248757 (219582, 280915)
-0.09 (-0.21, 0.06)
14234 (12736, 15832)
-0.45 (-0.53, -0.35)
42896 (36763, 49336)
-0.34 (-0.46, -0.19)
3197 (1426, 5794)
-0.39 (-0.59, -0.18)
Both
270705 (248836, 292384)
-0.10 (-0.18, 0.00)
16833 (15845, 18059)
-0.37 (-0.43, -0.31)
54284 (47517, 60673)
-0.36 (-0.45, -0.25)
3243 (1491, 5817)
-0.40 (-0.59, -0.19)
Djibouti
Male
176757 (156470, 201210)
-0.03 (-0.17, 0.18)
20644 (19329, 22024)
0.12 (0.03, 0.22)
66180 (55600, 78445)
-0.30 (-0.45, -0.14)
2251 (1202, 3532)
-0.28 (-0.58, 0.17)
Female
199831 (174090, 224629)
0.06 (-0.12, 0.26)
13499 (12124, 15024)
-0.17 (-0.27, -0.03)
43843 (37689, 50457)
-0.28 (-0.41, -0.10)
2197 (1140, 3505)
-0.29 (-0.59, 0.19)
Both
187773 (172309, 205147)
0.01 (-0.09, 0.17)
17233 (16287, 18232)
-0.01 (-0.08, 0.08)
55516 (49965, 62452)
-0.29 (-0.40, -0.18)
2225 (1176, 3520)
-0.29 (-0.59, 0.18)
Eritrea
Male
257178 (229547, 286365)
-0.24 (-0.33, -0.13)
23089 (21569, 24642)
-0.22 (-0.29, -0.15)
59624 (50460, 69489)
-0.40 (-0.50, -0.25)
2957 (2139, 4035)
-0.19 (-0.36, 0.50)
Female
175999 (156065, 197037)
-0.20 (-0.34, -0.06)
15777 (14188, 17520)
-0.39 (-0.48, -0.29)
39302 (33728, 45378)
-0.34 (-0.46, -0.21)
2871 (2036, 3995)
-0.20 (-0.37, 0.52)
Both
217701 (202672, 234691)
-0.22 (-0.29, -0.14)
19533 (18473, 20808)
-0.30 (-0.35, -0.24)
49742 (44130, 54858)
-0.37 (-0.45, -0.29)
2916 (2098, 3977)
-0.19 (-0.37, 0.50)
Ethiopia
Male
255673 (239310, 270719)
-0.23 (-0.29, -0.17)
23478 (21989, 25058)
-0.36 (-0.42, -0.30)
68323 (58057, 79027)
-0.41 (-0.54, -0.27)
2366 (1622, 3432)
-0.41 (-0.59, 0.27)
Female
175659 (165515, 186793)
-0.24 (-0.30, -0.17)
18680 (16809, 20969)
-0.47 (-0.54, -0.37)
41532 (35430, 48149)
-0.38 (-0.49, -0.25)
2369 (1607, 3438)
-0.40 (-0.57, 0.33)
Both
216692 (207248, 225647)
-0.23 (-0.28, -0.19)
21141 (19895, 22599)
-0.41 (-0.46, -0.35)
55271 (49543, 61235)
-0.40 (-0.48, -0.30)
2367 (1615, 3435)
-0.41 (-0.58, 0.29)
Kenya
Male
204327 (200041, 208676)
0.02 (-0.01, 0.05)
17782 (16687, 18875)
-0.19 (-0.27, -0.12)
85631 (73488, 100254)
-0.12 (-0.30, 0.08)
3918 (2916, 5085)
-0.29 (-0.35, -0.22)
Female
151863 (147748, 155460)
0.02 (-0.02, 0.05)
17046 (15356, 18838)
-0.40 (-0.48, -0.30)
54679 (46804, 63972)
-0.09 (-0.27, 0.13)
3811 (2787, 5107)
-0.29 (-0.36, -0.22)
Both
178551 (175601, 181592)
0.02 (-0.01, 0.04)
17420 (16445, 18486)
-0.31 (-0.37, -0.23)
70424 (62448, 79057)
-0.11 (-0.25, 0.02)
3865 (2854, 5062)
-0.29 (-0.36, -0.22)
Madagascar
Male
288413 (261666, 315100)
-0.03 (-0.17, 0.11)
23375 (21974, 24867)
-0.18 (-0.25, -0.10)
53566 (46114, 62179)
-0.41 (-0.53, -0.27)
1249 (600, 2146)
-0.39 (-0.61, -0.08)
Female
229733 (205071, 254641)
-0.02 (-0.17, 0.15)
18755 (16854, 20822)
-0.32 (-0.41, -0.20)
38524 (33301, 44330)
-0.35 (-0.45, -0.21)
1172 (506, 2132)
-0.34 (-0.58, 0.03)
Both
259747 (240110, 279601)
-0.03 (-0.13, 0.08)
21118 (19898, 22490)
-0.24 (-0.30, -0.18)
46218 (41803, 51415)
-0.38 (-0.47, -0.28)
1211 (563, 2135)
-0.37 (-0.59, -0.04)
Malawi
Male
259388 (227258, 292615)
0.01 (-0.13, 0.19)
21342 (20028, 22727)
-0.25 (-0.31, -0.19)
56999 (47576, 66632)
-0.36 (-0.49, -0.21)
2722 (1971, 3699)
-0.32 (-0.41, -0.17)
Female
189687 (169003, 213150)
-0.13 (-0.26, 0.02)
18900 (17017, 20891)
-0.36 (-0.45, -0.26)
41885 (35698, 48416)
-0.30 (-0.41, -0.13)
2624 (1864, 3672)
-0.32 (-0.42, -0.17)
Both
224935 (205899, 244068)
-0.06 (-0.16, 0.07)
20135 (18910, 21301)
-0.31 (-0.37, -0.25)
49528 (43586, 55855)
-0.34 (-0.43, -0.21)
2673 (1918, 3683)
-0.32 (-0.42, -0.17)
Mozambique
Male
305943 (272181, 341076)
-0.06 (-0.18, 0.07)
23207 (21726, 24640)
-0.32 (-0.38, -0.25)
61916 (51555, 72244)
-0.44 (-0.54, -0.31)
3404 (2237, 4706)
-0.17 (-0.39, 0.05)
Female
225799 (203552, 251460)
-0.05 (-0.22, 0.11)
20480 (18412, 22943)
-0.43 (-0.51, -0.35)
42041 (35649, 48650)
-0.39 (-0.50, -0.25)
3205 (2022, 4581)
-0.18 (-0.42, 0.04)
Both
266358 (246117, 286936)
-0.06 (-0.16, 0.05)
21860 (20676, 23226)
-0.38 (-0.42, -0.32)
52099 (47216, 57562)
-0.42 (-0.50, -0.33)
3306 (2174, 4666)
-0.18 (-0.40, 0.05)
Rwanda
Male
161911 (142041, 185230)
-0.26 (-0.37, -0.14)
19515 (18290, 20721)
-0.32 (-0.38, -0.26)
62990 (54288, 71634)
-0.42 (-0.54, -0.29)
2390 (1617, 3437)
-0.36 (-0.53, 0.19)
Female
110106 (94263, 124213)
-0.30 (-0.42, -0.15)
15243 (13622, 16983)
-0.40 (-0.49, -0.31)
41181 (35540, 47528)
-0.40 (-0.51, -0.26)
2332 (1536, 3444)
-0.36 (-0.54, 0.20)
Both
136454 (124496, 148795)
-0.27 (-0.35, -0.18)
17416 (16395, 18397)
-0.36 (-0.41, -0.31)
52273 (47172, 58220)
-0.41 (-0.50, -0.31)
2362 (1582, 3440)
-0.36 (-0.54, 0.20)
Somalia
Male
274222 (244117, 306396)
-0.10 (-0.23, 0.06)
34549 (32437, 36681)
-0.02 (-0.11, 0.07)
69267 (58800, 82297)
-0.33 (-0.46, -0.16)
4201 (2358, 6266)
-0.11 (-0.40, 0.34)
Female
306658 (273029, 339218)
-0.21 (-0.31, -0.08)
36432 (32480, 40371)
-0.06 (-0.19, 0.10)
47328 (40772, 55285)
-0.29 (-0.40, -0.14)
4129 (2300, 6211)
-0.11 (-0.41, 0.33)
Both
289871 (264607, 312157)
-0.16 (-0.25, -0.06)
35457 (33088, 37625)
-0.04 (-0.11, 0.06)
58683 (51576, 65770)
-0.32 (-0.42, -0.19)
4166 (2333, 6239)
-0.11 (-0.40, 0.33)
South Sudan
Male
305558 (268759, 343573)
-0.02 (-0.16, 0.13)
27130 (25476, 29022)
-0.04 (-0.13, 0.05)
75089 (63163, 91928)
-0.25 (-0.39, -0.08)
3309 (2299, 4550)
-0.16 (-0.37, 0.36)
Female
214530 (190708, 238887)
0.01 (-0.15, 0.17)
19815 (17851, 21897)
-0.18 (-0.29, -0.04)
48422 (41577, 55324)
-0.23 (-0.36, -0.06)
3200 (2160, 4499)
-0.16 (-0.38, 0.41)
Both
261357 (240308, 283640)
-0.01 (-0.11, 0.10)
23578 (22333, 24883)
-0.10 (-0.18, -0.03)
62140 (54749, 70078)
-0.24 (-0.36, -0.12)
3256 (2230, 4515)
-0.16 (-0.37, 0.41)
Uganda
Male
238996 (215322, 263697)
-0.13 (-0.25, 0.02)
29714 (27840, 31533)
-0.36 (-0.41, -0.30)
61426 (51879, 70822)
-0.37 (-0.49, -0.21)
1861 (1131, 2761)
-0.49 (-0.64, -0.37)
Female
165655 (145514, 186000)
-0.08 (-0.21, 0.11)
17537 (15778, 19489)
-0.46 (-0.53, -0.36)
40169 (34423, 47434)
-0.35 (-0.46, -0.20)
1759 (1015, 2807)
-0.52 (-0.68, -0.38)
Both
203067 (187853, 219183)
-0.11 (-0.21, -0.01)
23749 (22415, 25197)
-0.40 (-0.44, -0.35)
51013 (45111, 56641)
-0.36 (-0.45, -0.26)
1811 (1080, 2779)
-0.51 (-0.65, -0.38)
Tanzania
Male
247900 (218376, 280590)
0.10 (-0.06, 0.29)
19845 (18612, 21142)
-0.23 (-0.29, -0.16)
59882 (50949, 70401)
-0.36 (-0.49, -0.20)
2593 (1672, 3714)
-0.33 (-0.51, -0.17)
Female
191483 (168422, 214869)
-0.17 (-0.30, -0.01)
15879 (14124, 17753)
-0.39 (-0.48, -0.29)
40433 (34811, 47325)
-0.32 (-0.44, -0.19)
2502 (1576, 3709)
-0.33 (-0.52, -0.17)
Both
220029 (201501, 239068)
-0.04 (-0.16, 0.08)
17886 (16841, 19026)
-0.31 (-0.37, -0.25)
50274 (45084, 55780)
-0.35 (-0.44, -0.24)
2548 (1637, 3712)
-0.33 (-0.52, -0.17)
Zambia
Male
241090 (211450, 267946)
-0.02 (-0.17, 0.16)
17745 (16656, 18879)
-0.27 (-0.32, -0.20)
56591 (47762, 68039)
-0.32 (-0.45, -0.13)
2391 (1553, 3441)
-0.31 (-0.49, -0.11)
Female
165085 (146305, 184523)
-0.05 (-0.19, 0.11)
12882 (11447, 14302)
-0.42 (-0.51, -0.33)
40703 (34976, 46126)
-0.35 (-0.47, -0.21)
2214 (1356, 3362)
-0.32 (-0.52, -0.12)
Both
203486 (186671, 219334)
-0.03 (-0.14, 0.08)
15339 (14553, 16141)
-0.34 (-0.39, -0.29)
48730 (43040, 55208)
-0.33 (-0.43, -0.21)
2303 (1467, 3410)
-0.32 (-0.50, -0.11)
The rate of neonatal encephalopathy due to birth asphyxia and trauma was estimated to be 21,394 new cases per 100,000 live births (95% UI: 20,941, 21,813), with 23,587 new cases per 100,000 male live births (95% UI: 23,061, 24,112) and 19,112 new cases per 100,000 female live births (95% UI: 18,346, 19,786). The highest rate was estimated in Burundi [24,951 new cases per 100,000 live births (95% UI: 23,434, 26,379)], South Sudan [23,578 new cases per 100,000 live births (95% UI: 22,333, 24,883)], and Uganda [23,749 new cases per 100,000 live births (95% UI: 22,415, 25,197)], whereas the lowest rate was in Comoros [16,833 new cases per 100,000 live births (95% UI: 15,845, 18,059)], Djibouti [17,233 new cases per 100,000 live births (95% UI: 16,287, 18,232)], Eritrea [19,533 new cases per 100,000 live births (95% UI: 18,473, 20,808)], Kenya [17,420 new cases per 100,000 live births (95% UI: 16,445, 18,486)], Rwanda [17,416 new cases per 100,000 live births (95% UI: 16,395, 18,397)], Tanzania [17,886 new cases per 100,000 live births (95% UI: 16,841, 19,026)], and Zambia [15,339 new cases per 100,000 live births (95% UI: 14,553, 16,141)]. Among the neonates, the incidence rate of neonatal encephalopathy due to birth asphyxia and trauma declined by 32% (95% UI: -34, -30) in the region in 2023 compared to the rate in 1990. Ethiopia and Uganda had the highest decline in the region, with a 41% decline (95% UI: -46, -35) and 40% decline (95% UI: -44, -35), respectively. However, Djibouti [-1% (95% UI: -8, 8)] and Somalia [-4% (95% UI: -11, 6)] had no statistically significant decline in the rate (Table 3).
There were an estimated 54,049 new cases of neonatal sepsis and other neonatal infections per 100,000 live births (95% UI: 51,725, 56,371), with 65,001 new cases per 100,000 male live births (95% UI: 61,209, 68,689) and 42,655 new cases per 100,000 female live births (95% UI: 40,151, 44,929). The highest rate was estimated in Kenya [70,424 new cases per 100,000 live births (95% UI: 62,448, 79,057)], whereas the lowest rate was in Madagascar [46,218 new cases per 100,000 live births (95% UI: 41,803, 51,415)]. Between 1990 and 2023, the incidence rate declined by 35% (95% UI: -38, -31) among the neonates in the region. However, there was no statistically significant decline in Kenya [-11% (95% UI: -25, 2)] (Table 3).
Hemolytic disease and other neonatal jaundice were estimated to be 2645 new cases per 100,000 live births (95% UI: 1867, 3711), with 2684 new cases per 100,000 male live births (95% UI: 1918, 3734) and 2603 new cases per 100,000 female live births (95% UI: 1819, 3711). All of the countries in the region exhibited no significant variation in the distribution of the rate. The incidence rate declined by 33% (95% UI: -45, -10) in 2023 compared to the rate in 1990. However, no statistically significant decline was estimated in Burundi [-13% (95% UI: -31, 35)], Djibouti [-29% (95% UI: -59, 18)], Eritrea [-19% (95% UI: -37, 50)], Ethiopia [-41% (95% UI: -58, 29)], Mozambique [-18% (95% UI: -40, 5)], Rwanda [-36% (95% UI: -54, 20)], Somalia [-11% (95% UI: -40, 33)], and South Sudan [-16% (95% UI: -37, 41)] (Table 3).
Mortality From Neonatal Disorders
There were an estimated 274,590 neonatal deaths (95% UI: 252,857, 295,496) from neonatal disorders in the ESSA region in 2023, with 168,868 deaths (95% UI: 150,988, 188,406) among males and 105,722 deaths (95% UI: 95,579, 117,622) among females. This was equivalent to an estimated 21,889 deaths per 100,000 live births (95% UI: 20,447, 22,993), with 26,452 deaths per 100,000 male live births (95% UI: 24,400, 28,570) and 17,143 deaths per 100,000 female live births (95% UI: 15,806, 18,471). The highest rate was estimated in Burundi [26,425 deaths per 100,000 live births (95% UI: 24,269, 28,809)] and Ethiopia [28,509 deaths per 100,000 live births (95% UI: 26,617, 30,493)], whereas the lowest rate was in Eritrea [16,748 deaths per 100,000 live births (95% UI: 15,442, 18,344)], Kenya [14,932 deaths per 100,000 live births (95% UI: 13,662, 16,388)], Madagascar [17,273 deaths per 100,000 live births (95% UI: 14,881, 19,532)], and Zambia [16,239 deaths per 100,000 live births (95% UI: 14,082, 18,146)]. In the region, the mortality rate declined by 41% (95% CI: -45, -36) between 1990 and 2023. The highest decline was estimated in Mozambique [52% decline (95% UI: -58, -47)], whereas the lowest decline was in Burundi [24% decline (95% UI: -31, -15)], Kenya [22% decline (95% UI: -31, -8)], and South Sudan [18% decline (95% UI: -28, -5)] (Table 1).
There were an estimated 208,161 deaths (95% UI: 195,994, 218,071) among early neonates in the ESSA in 2023. This was equivalent to 76,040 deaths per 100,000 live births (95% UI: 71,596, 79,660). The highest rate was estimated in Burundi [89,170 deaths per 100,000 live births (95% UI: 83,775, 95,378)], whereas the lowest rate was in Eritrea [53,088 deaths per 100,000 live births (95% UI: 48,955, 57,496), Ethiopia [65,288 deaths per 100,000 live births (95% UI: 60,702, 69,695)], Kenya [54,558 deaths per 100,000 live births (95% UI: 49,957, 59,942)], and Zambia [58,072 deaths per 100,000 live births (95% UI: 51,265, 64,235)]. The mortality rate declined by 40% (95% UI: -44, -35) in the region in 2023 compared to the rate in 1990. Mozambique [52% decline (95% UI: -56, -46)] and Rwanda [52% decline (95% UI: -57, -46)] experienced the highest decline in the region, whereas Burundi [0.26% decline (UI: -33, -18)], Djibouti [28% decline (95% UI: -38, -17)], Kenya [22% decline (95% UI: -32, -9)], and South Sudan [18% decline (95% UI: -28, -5)] had the slowest decline (Table 2).
There were an estimated 29,493 deaths (95% UI: 24,397, 33,379) among late neonates. This was equivalent to 3632 deaths (95% UI: 3005, 4111) per 100,000 live births. The highest rate was estimated in Ethiopia [12,995 deaths per 100,000 live births (95% UI: 10,649, 14,664)] and Somalia [5972 deaths per 100,000 live births (95% UI: 4579, 7151)], whereas the lowest rate was estimated in Kenya [1616 deaths per 100,000 live births (95% UI: 1343, 1895)], Mozambique [2178 deaths per 100,000 live births (95% UI: 1640, 2601)], Uganda [2301 deaths per 100,000 live births (95% UI: 1813, 2871)], Tanzania [2052 deaths per 100,000 live births (95% UI: 1525, 2528)], and Zambia [2155 deaths per 100,000 live births (95% UI: 1493, 2736)]. Between 1990 and 2023, there was a 44% decline (95% UI: -53, -31) in the mortality rate in the region. However, no statistically significant decline was estimated in Burundi [0 (-28, 34)], Comoros [-25% (95% UI: -47, 9)], Djibouti [-7% (95% UI: -33, 33)], Eritrea [-13% (95% UI: -35, 30)], Kenya [-2% (95% UI: -38, 7)], Somalia [-1% (95% UI: -37, 66)], and South Sudan [21% (95% UI: -13, 76)] (Table 2).
Neonatal mortality rate from preterm birth was estimated to be 6095 deaths per 100,000 live births (95% UI: 4893, 7517), with 7169 deaths per 100,000 male live births (95% UI: 5184, 9460) and 4978 deaths per 100,000 female live births (95% UI: 3695, 6601). No statistically significant difference was estimated in the distribution of the rate by location. The mortality rate declined by 45% (95% UI: -63, -21) in the region in 2023 compared to the rate in 1990. However, no statistically significant change was estimated in Djibouti [-34% (95% UI: -59, 4)], Kenya [-11% (95% UI: -45, 45)], and Somalia [-35% (95% UI: -61, 16)] (Table 4).
Mortality Rate of Neonatal Disorders by Location, Sex, and Type in ESSA Region, 1990 to 2023
Location
Sex
Neonatal preterm birth
% of change
Neonatal encephalopathy due to birth asphyxia and trauma
% of change
Neonatal sepsis and other neonatal infections
% of change
Hemolytic disease and other neonatal jaundice
% of change
2023
1990-2023
2023
1990-2023
2023
1990-2023
2023
1990-2023
ESSA region
Male
7169 (5184, 9460)
-0.42 (-0.65, 0.10)
10229 (7892, 12814)
-0.39 (-0.60, -0.06)
3785 (1760, 6102)
-0.36 (-0.73, 0.60)
481 (180, 1015)
-0.69 (-0.89, -0.07)
Female
4978 (3695, 6601)
-0.49 (-0.65, -0.22)
6354 (4694, 8052)
-0.46 (-0.65, -0.15)
2455 (1494, 3618)
-0.34 (-0.62, 0.45)
232 (58, 598)
-0.63 (-0.88, 0.27)
Both
6095 (4893, 7517)
-0.45 (-0.63, -0.21)
8330 (6985, 9976)
-0.42 (-0.56, -0.16)
3133 (2086, 4747)
-0.35 (-0.62, 0.13)
359 (170, 675)
-0.67 (-0.86, -0.19)
Burundi
Male
7266 (3620, 12701)
-0.48 (-0.76, 0.03)
11745 (6327, 18196)
-0.20 (-0.62, 0.64)
5137 (1596, 9731)
0.00 (-0.74, 1.64)
540 (129, 1770)
-0.66 (-0.89, 0.00)
Female
6060 (2905, 9980)
-0.37 (-0.68, 0.11)
8851 (4568, 14094)
-0.11 (-0.54, 0.65)
4215 (1507, 7405)
0.22 (-0.44, 1.69)
342 (36, 1410)
-0.47 (-0.89, 0.64)
Both
6669 (4222, 9885)
-0.44 (-0.65, -0.08)
10313 (6805, 14802)
-0.16 (-0.49, 0.41)
4681 (2208, 7352)
0.09 (-0.48, 0.94)
442 (125, 1102)
-0.60 (-0.87, 0.04)
Comoros
Male
7501 (4408, 11138)
-0.48 (-0.73, 0.01)
8252 (4658, 12176)
-0.31 (-0.69, 0.53)
3685 (1689, 6283)
-0.14 (-0.73, 1.41)
329 (136, 576)
-0.76 (-0.93, -0.17)
Female
5779 (3588, 8569)
-0.47 (-0.70, -0.09)
5235 (2970, 7875)
-0.37 (-0.71, 0.40)
2427 (1335, 3931)
-0.11 (-0.58, 1.04)
152 (40, 404)
-0.72 (-0.90, -0.05)
Both
6658 (4618, 9036)
-0.47 (-0.67, -0.17)
6776 (4547, 9377)
-0.34 (-0.63, 0.18)
3069 (1822, 4795)
-0.13 (-0.59, 0.68)
242 (124, 443)
-0.75 (-0.90, -0.38)
Djibouti
Male
7618 (3794, 12536)
-0.36 (-0.70, 0.20)
8757 (4505, 13586)
-0.21 (-0.60, 0.68)
3361 (1377, 5978)
-0.09 (-0.66, 1.48)
448 (193, 831)
-0.62 (-0.89, 0.27)
Female
7010 (4417, 10381)
-0.31 (-0.06, 0.17)
6179 (2985, 9830)
-0.23 (-0.61, 0.47)
2206 (951, 4107)
-0.08 (-0.53, 0.94)
195 (67, 401)
-0.56 (-0.86, 0.28)
Both
7328 (4741, 10640)
-0.34 (-0.59, 0.04)
7526 (4666, 11252)
-0.22 (-0.52, 0.33)
2810 (1592, 4725)
-0.09 (-0.52, 0.69)
327 (173, 575)
-0.61 (-0.83, -0.05)
Eritrea
Male
6884 (3857, 10301)
-0.45 (-0.73, 0.09)
8017 (4694, 11506)
-0.28 (-0.65, 0.69)
3424 (1651, 5688)
-0.26 (-0.71, 1.24)
469 (184, 914)
-0.68 (-0.91, 0.31)
Female
3657 (2355, 5599)
-0.39 (-0.67, 0.18)
3867 (2257, 5380)
-0.25 (-0.62, 0.53)
1677 (933, 2631)
-0.14 (-0.58, 1.10)
143 (32, 425)
-0.58 (-0.86, 0.74)
Both
5315 (3549, 7240)
-0.43 (-0.67, -0.05)
5999 (4053, 8047)
-0.27 (-0.57, 0.39)
2574 (1491, 4021)
-0.22 (-0.61, 0.63)
311 (140, 554)
-0.66 (-0.88, 0.11)
Ethiopia
Male
10139 (7147, 14701)
-0.38 (-0.68, 0.22)
15258 (11380, 19589)
-0.38 (-0.62, 0.10)
5121 (2626, 8128)
-0.48 (-0.78, 0.62)
680 (266, 1303)
-0.74 (-0.92, 0.03)
Female
5122 (3398, 7088)
-0.59 (-0.77, -0.27)
7121 (4855, 9740)
-0.52 (-0.71, -0.16)
2570 (1500, 4104)
-0.47 (-0.73, 0.50)
258 (71, 734)
-0.62 (-0.90, 2.40)
Both
7695 (5693, 10321)
-0.47 (-0.70, -0.19)
11294 (9007, 14228)
-0.43 (-0.58, -0.08)
3878 (2375, 5669)
-0.47 (-0.71, 0.04)
474 (224, 891)
-0.72 (-0.88, -0.08)
Kenya
Male
4999 (2903, 7487)
-0.14 (-0.59, 0.79)
7270 (4524, 10232)
-0.31 (-0.63, 0.29)
1874 (822, 3377)
-0.26 (-0.71, 0.82)
165 (61, 349)
-0.57 (-0.85, 0.78)
Female
4457 (2949, 6238)
-0.07 (-0.51, 0.65)
5219 (3670, 7106)
-0.34 (-0.60, 0.18)
1293 (743, 2155)
-0.06 (-0.54, 1.22)
84 (28, 172)
-0.57 (-0.84, 0.37)
Both
4733 (3335, 6378)
-0.11 (-0.45, 0.45)
6262 (4696, 7857)
-0.32 (-0.55, 0.03)
1589 (1006, 2488)
-0.19 (-0.58, 0.47)
125 (61, 219)
-0.57 (-0.81, 0.08)
Madagascar
Male
6779 (4286, 9860)
-0.52 (-0.72, -0.25)
3800 (1967, 7323)
-0.34 (-0.68, 0.27)
3006 (1274, 5408)
-0.08 (-0.68, 1.29)
397 (122, 1163)
-0.60(-0.88, 0.00)
Female
5881 (3684, 8350)
-0.43 (-0.68, -0.12)
3293 (1718, 5556)
-0.22 (-0.61, 0.43)
2606 (1466, 4554)
0.12 (-0.45, 1.58)
284 (68, 890)
-0.40 (-0.80, 0.72)
Both
6340 (4457, 8505)
-0.48 (-0.64, -0.29)
3552 (2101, 5539)
-0.29 (-0.57, 0.12)
2811 (1683, 4438)
0.00 (-0.48, 0.90)
342 (144, 709)
-0.53 (-0.82, -0.02)
Malawi
Male
5761 (3188, 9008)
-0.61 (-0.82, -0.16)
9224 (5177, 13730)
-0.45 (-0.72, 0.15)
4185 (1454, 7666)
-0.27 (-0.74, 0.98)
435 (157, 1083)
-0.70 (-0.92, 0.10)
Female
4338 (2395, 7070)
-0.67 (-0.85, -0.41)
6609 (3997, 9720)
-0.54 (-0.76, -0.08)
3017 (1437, 4775)
-0.31 (-0.67, 0.68)
221 (33, 748)
-0.72 (-0.91, -0.20)
Both
5058 (3207, 7152)
-0.64 (-0.79, -0.41)
7931 (5459, 10658)
-0.49 (-0.68, -0.14)
3608 (1813, 5836)
-0.29 (-0.63, 0.29)
329 (132, 692)
-0.71 (-0.89, -0.28)
Mozambique
Male
8099 (5735, 10999)
-0.33 (-0.63, 0.31)
11853 (7462, 15597)
-0.45 (-0.69, -0.04)
2856 (1458, 4708)
-0.59 (-0.84, -0.04)
629 (200, 1725)
-0.69 (-0.90, 0.01)
Female
5989 (4119, 8452)
-0.51 (-0.71, -0.14)
8260 (5022, 11134)
-0.53 (-0.74, -0.15)
2001 (1203, 3155)
-0.64 (-0.82, -0.16)
271 (46, 910)
-0.80 (-0.93, -0.38)
Both
7057 (5313, 9019)
-0.42 (-0.62, -0.06)
10079 (6870, 12448)
-0.48 (-0.68, -0.22)
2433 (1651, 3461)
-0.62 (-0.80, -0.31)
452 (182, 1019)
-0.74 (-0.90, -0.37)
Rwanda
Male
5589 (2988, 9230)
-0.65 (-0.84, -0.27)
8366 (4669, 13202)
-0.47 (-0.75, 0.22)
3450 (1293, 6214)
-0.39 (-0.81, 0.82)
310 (119, 658)
-0.83 (-0.95, -0.47)
Female
4449 (2403, 7099)
-0.63 (-0.81, -0.27)
6810 (3929, 10638)
-0.47 (-0.74, 0.05)
3293 (1748, 5269)
-0.27 (-0.64, 0.64)
250 (49, 606)
-0.72 (-0.92, 0.00)
Both
5029 (3269, 7290)
-0.64 (-0.80, -0.40)
7602 (5117, 10714)
-0.47 (-0.69, -0.06)
3373 (1989, 5215)
-0.33 (-0.65, 0.23)
281 (121, 535)
-0.80 (-0.92, -0.54)
Somalia
Male
5364 (2949, 8271)
-0.36 (-0.69, 0.42)
7002 (4095, 9681)
-0.26 (-0.61, 0.86)
4022 (1559, 6969)
-0.19 (-0.64, 1.23)
618 (139, 1998)
0.08 (-0.74, 2.38)
Female
5057 (2910, 7669)
-0.34 (-0.65, 0.35)
4536 (2780, 6434)
-0.22 (-0.58, 0.79)
2690 (990, 4673)
-0.13 (-0.56, 1.19)
342 (41, 1452)
-0.26 (-0.78, 3.21)
Both
5216 (3593, 7468)
-0.35 (-0.61, 0.16)
5812 (4134, 7387)
-0.25 (-0.54, 0.48)
3379 (2000, 5321)
-0.17 (-0.51, 0.52)
485 (131, 1362)
-0.07 (-0.74, 1.61)
South Sudan
Male
8166 (4422, 12656)
-0.44 (-0.75, 0.11)
11520 (7003, 16934)
-0.02 (-0.60, 1.74)
4280 (2039, 7124)
0.16 (-0.62, 2.69)
678 (200, 1830)
-0.56 (-0.88, 0.34)
Female
4996 (2854, 7854)
-0.42 (-0.72, 0.02)
6172 (3649, 8972)
-0.06 (-0.56, 1.42)
2359 (1194, 4110)
0.30 (-0.55, 2.55)
257 (61, 721)
-0.31 (-0.84, 2.07)
Both
6627 (4331, 9476)
-0.44 (-0.67, -0.06)
8923 (5995, 11845)
-0.04 (-0.48, 1.03)
3347 (2127, 5053)
0.20 (-0.45, 1.58)
473 (192, 1119)
-0.52 (-0.81, 0.16)
Uganda
Male
6232 (3392, 9568)
-0.42 (-0.73, 0.35)
9639 (6076, 13997)
-0.44 (-0.69, 0.21)
3519 (1435, 6340)
-0.31 (-0.73, 0.84)
344 (115, 829)
-0.62 (-0.87, 0.54)
Female
4682 (2872, 7183)
-0.46 (-0.72, 0.03)
6852 (4403, 9513)
-0.52 (-0.73, -0.08)
2514 (1388, 4373)
-0.37 (-0.68, 0.51)
198 (52, 529)
-0.71 (-0.91, 0.22)
Both
5473 (3713, 7649)
-0.44 (-0.67, -0.02)
8273 (6128, 10996)
-0.48 (-0.66, -0.10)
3026 (1902, 4865)
-0.34 (-0.63, 0.25)
273 (123, 562)
-0.66 (-0.87, -0.04)
Tanzania
Male
5988 (2893, 9026)
-0.41 (-0.76, 0.21)
8050 (4647, 11683)
-0.43 (-0.68, 0.07)
3397 (1480, 5779)
-0.30 (-0.7, 0.65)
369 (149, 737)
-0.68 (-0.89, 0.19)
Female
4827 (2695, 7512)
-0.40 (-0.71, 0.16)
6337 (3850, 9082)
-0.43 (-0.69, 0.02)
2473 (1368, 4234)
-0.29 (-0.65, 0.67)
213 (60, 536)
-0.66 (-0.89, 0.32)
Both
5414 (3568, 7468)
-0.41 (-0.66, -0.02)
7204 (5063, 9585)
-0.43 (-0.62, -0.03)
2941 (1885, 4268)
-0.30 (-0.6, 0.32)
292 (150, 558)
-0.67 (-0.86, -0.20)
Zambia
Male
3782 (2019, 6088)
-0.45 (-0.76, 0.27)
8406 (5035, 12005)
-0.41 (-0.70, 0.10)
2884 (1351, 4848)
-0.15 (-0.66, 1.13)
307 (128, 532)
-0.71 (-0.91, -0.01)
Female
3371 (1995, 5110)
-0.49 (-0.74, -0.07)
5220 (3229, 7249)
-0.52 (-0.73, -0.09)
1952 (1066, 3276)
-0.31 (-0.65, 0.62)
126 (34, 288)
-0.72 (-0.90, -0.17)
Both
3578 (2362, 5101)
-0.47 (-0.70, -0.09)
6830 (5123, 8758)
-0.45 (-0.63, -0.14)
2423 (1510, 3682)
-0.22 (-0.61, 0.46)
218 (115, 360)
-0.71 (-0.87, -0.29)
The death rate from neonatal encephalopathy due to birth asphyxia and trauma was estimated to be 8330 deaths per 100,000 live births (95% UI: 6985, 9976), with 10,229 deaths per 100,000 male live births (95% UI: 7892, 12,814) and 6354 deaths per 100,000 female live births (95% UI: 4694, 8052). The lowest rate was estimated in Madagascar [3552 deaths per 100,000 live births (95% UI: 2101, 5539)]. The mortality rate declined by 42% (95% UI: -56, -16) in the region in 2023 compared to the rate in 1990. However, there was no statistically significant decline in the distribution of the rate in Burundi [-16% (95% UI: -49, 41)], Comoros [-34% (95% UI: -63, 18)], Djibouti [-22% (95% UI: -52, 33)], Eritrea [27% (95% UI: -57, 39)], Kenya [-32% (95% UI: -55, 3)], Madagascar [-29% (UI: -57, 12)], Somalia [-25% (95% UI: -54, 48)], and South Sudan [-4% (95% UI: -48, 103)] (Table 4).
There were 3133 deaths per 100,000 live births (95% CI: 2086, 4747) from neonatal sepsis and other neonatal infections, with 3785 deaths per 100,000 male live births (95% CI: 1760, 6102) and 2455 deaths per 100,000 female live births (95% CI: 1494, 3618). There was no statistically significant variation in the distribution of the rate by location in the region. Moreover, the mortality rate remains unchanged [-35% (95% UI: -62, 13)] in the region between 1990 and 2023. Only Mozambique had a statistically significant decline [62% decline (95% UI: -80, -31)] (Table 4).
Mortality from hemolytic disease and other neonatal jaundice was estimated to be 359 deaths per 100,000 live births (95% UI: 170, 675), with 481 deaths per 100,000 male live births (95% UI: 180, 1015) and 232 deaths per 100,000 female live births (95% UI: 58, 598). There was no statistically significant difference in the distribution of the rate by location. Between 1990 and 2023, the mortality rate declined by 67% (95% UI: -86, -19) in the region. No statistically significant decline was estimated in Burundi [-60% (95% UI: -87, 4)], Eritrea [-66% (95% UI: -88, 11)], Kenya [-57% (95% UI: -81, 8)], Somalia [-7% (95% UI: -74, 161)], and South Sudan [-52% (95% UI: -81, 16)] (Table 4).
Years of Life Lost From Neonatal Disorders
There were an estimated 1.9 million YLLs per 100,000 live births (95% UI: 1.8, 2.1) in the ESSA region in 2023, with 2.4 million YLLs per 100,000 male live births (95% UI: 2.2, 2.6) and 1.5 million YLLs per 100,000 female live births (95% UI: 1.4, 1.7). The highest rate was estimated in Burundi [2.4 million YLLs per 100,000 live births (95% UI: 2.2, 2.6)] and Ethiopia [2.6 million YLLs per 100,000 live births (95% UI: 2.4, 2.7)], whereas the lowest rate was in Eritrea [1.5 million YLLs per 100,000 live births (95% UI: 1.4, 1.7)], Kenya [1.3 million YLLs per 100,000 live births (95% UI: 1.3, 1.5)], Madagascar [1.5 million YLLs per 100,000 live births (95% UI: 1.3, 1.8)], and Zambia [1.5 million YLLs per 100,000 live births (95% UI: 1.2, 1.6)]. Between 1990 and 2023, the YLLs rate declined by 41% (95% UI: -45, -36) in the region. Mozambique had the highest decline in the region [52% decline (95% UI: -58, -47)], whereas Burundi [24% decline (95% UI: -31, -15)], Kenya [22% decline (95% UI: -80, -31)], and South Sudan [18% decline (95% UI: -28, -5)] experienced the lowest decline (Table 1).
There were an estimated 6.8 million YLLs per 100,000 live births (95% UI: 6.4, 7.2) among early neonates in the ESSA region in 2023. The highest rate was estimated in Burundi [8 million YLLs per 100,000 live births (95% UI: 7.5, 8.6)] and Ethiopia [8.5 million YLLs per 100,000 live births (95% UI: 7.9, 9.0)], whereas the lowest rate was in Eritrea [4.8 million YLLs per 100,000 live births (95% UI: 4.4, 5.2)], Kenya [4.9 million YLLs per 100,000 live births (95% UI: 4.5, 5.4)], Madagascar [5.7 million YLLs per 100,000 live births (95% UI: 5.0, 6.5)], and Zambia [5.2 million YLLs per 100,000 live births (95% UI: 4.6, 5.8)]. There was a 40% decline (95% UI: -44, -35) in the rate in the region between 1990 and 2023. The highest decline was estimated in Rwanda [52% decline (95% UI: -57, -46)], Mozambique [52% decline (95% UI: -56, -46)], and Malawi [49% decline (95% UI: -54, -43)], whereas the lowest decline was in Burundi [26% decline (95% UI: -34, -19)], Djibouti [28% decline (95% UI: -38, -17)], Kenya [22% decline (95% UI: -32, -9)], and South Sudan [22% decline (95% UI: -30, -9)] (Table 2).
Among late neonates, there were 326,816 YLLs per 100,000 live births (95% UI: 270,349, 369,873). Higher than the regional rate was estimated in Ethiopia [569,701 YLLs per 100,000 live births (95% UI: 466,837, 642,843)]. A lower-than-regional rate was estimated in Kenya [145,410 YLLs per 100,000 live births (95% UI: 120,812, 170,528)], Madagascar [142,042 YLLs per 100,000 live births (95% UI: 106,875, 1,822,220)], Uganda [207,013 YLLs per 100,000 live births (95% UI: 163,146, 258,305)], Tanzania [184,658 YLLs per 100,000 live births (95% UI: 137,252, 227,429)], and Zambia [193,918 YLLs per 100,000 live births (95% UI: 134,296, 246,151)]. Between 1990 and 2023, the YLLs rate declined by 44% (95% UI: -54, -31). The highest decline was estimated in Mozambique [57% decline (95% UI: -66, -42)]. However, the rate remained stable in Burundi [0 (95% UI: -28, 34)], Comoros [-25% (95% UI: -47, 9)], Djibouti [-8% (95% UI: -33, 33)], Eritrea [-13% (95% UI: -35, 30)], Kenya [-20% (95% UI: -38, 7)], Somalia [-1% (95% UI: -37, 66)], and South Sudan [21% (95% UI: -13, 76)] (Table 2).
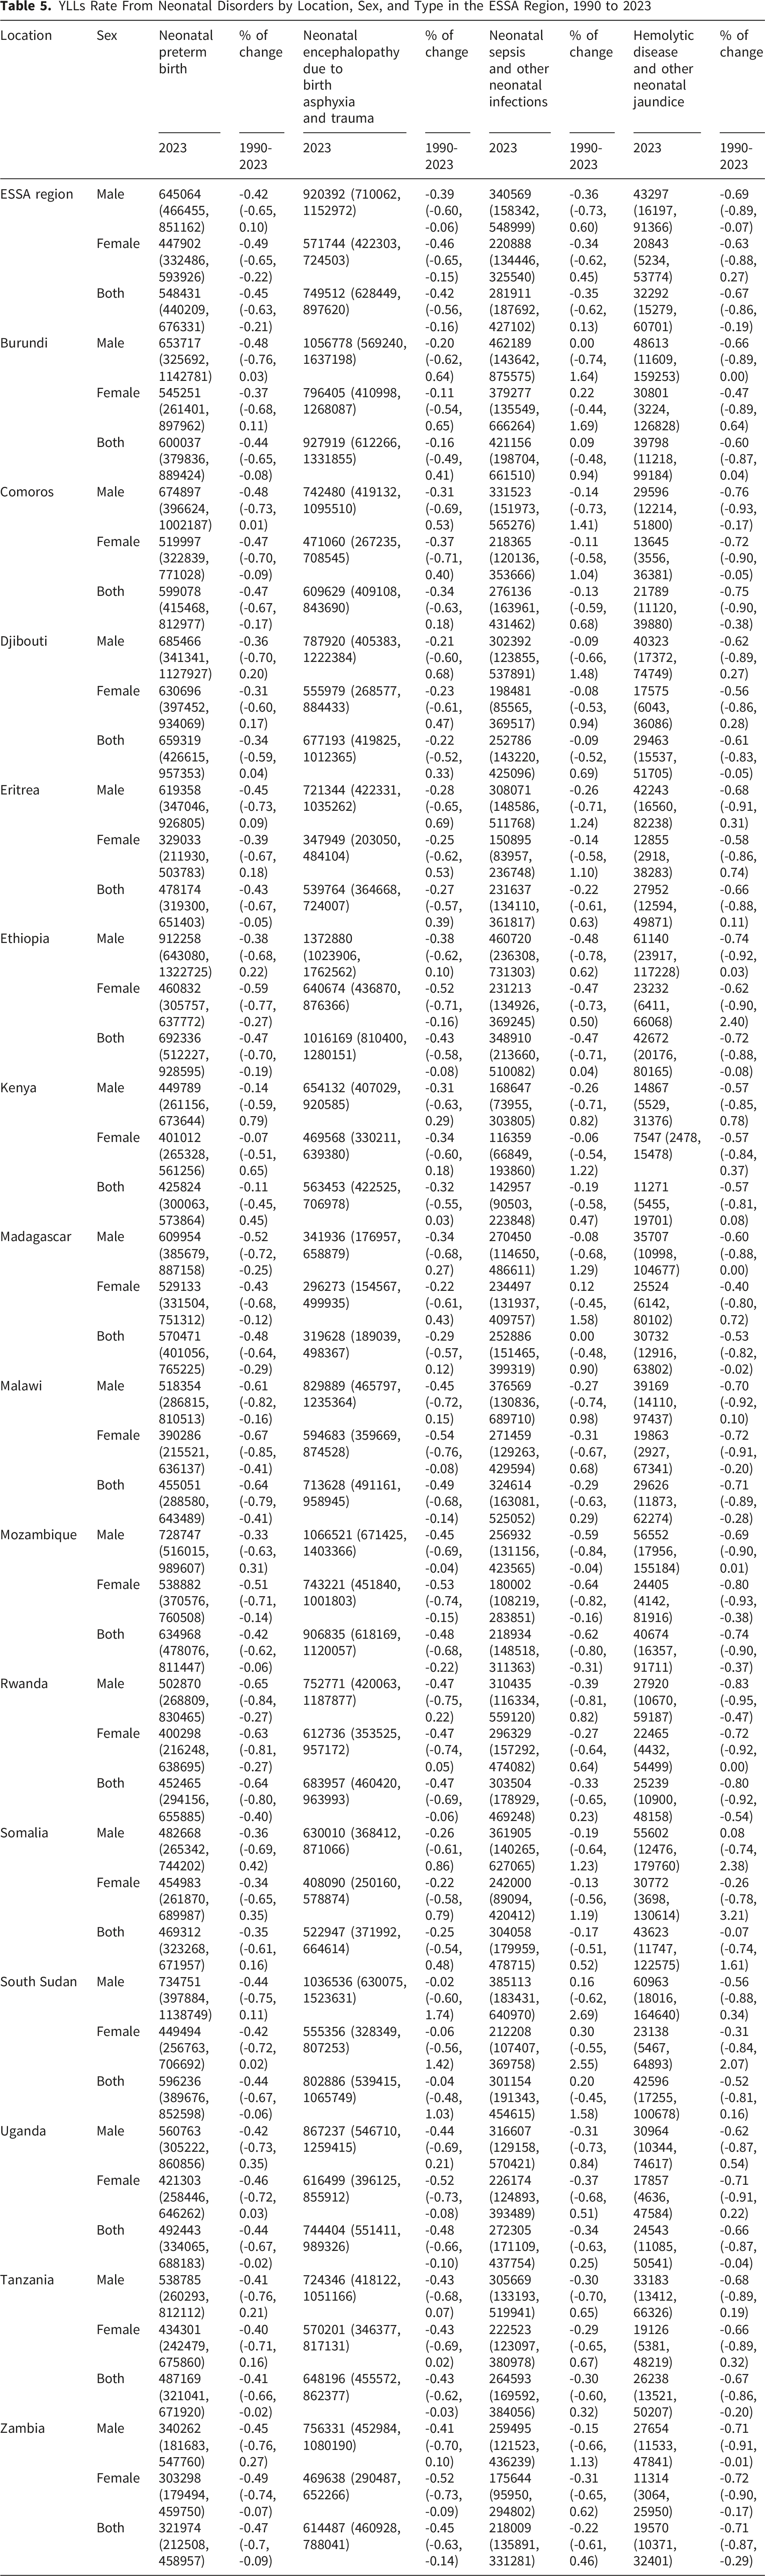
Neonatal preterm birth accounted for 548,431 YLLs per 100,000 live births (95% UI: 440,209, 676,331), with 645,064 YLLs per 100,000 male live births (95% UI: 466,455, 851,162) and 447,902 YLLs per 100,000 female live births (95% UI: 332,486, 593,926). There was no statistically significant variation in the distribution of the rate by location. Moreover, the YLLs rate declined by 45% (95% UI: -63, -21) in the region in 2023 compared to the rate in 1990. However, there was no statistically significant decline in the rate in Djibouti [-34% (95% UI: -59, 4)], Kenya [-11% (95% UI: -45, 45)], and Somalia [-35% (95% UI: -61, 16)] (Table 5).
YLLs Rate From Neonatal Disorders by Location, Sex, and Type in the ESSA Region, 1990 to 2023
Location
Sex
Neonatal preterm birth
% of change
Neonatal encephalopathy due to birth asphyxia and trauma
% of change
Neonatal sepsis and other neonatal infections
% of change
Hemolytic disease and other neonatal jaundice
% of change
2023
1990-2023
2023
1990-2023
2023
1990-2023
2023
1990-2023
ESSA region
Male
645064 (466455, 851162)
-0.42 (-0.65, 0.10)
920392 (710062, 1152972)
-0.39 (-0.60, -0.06)
340569 (158342, 548999)
-0.36 (-0.73, 0.60)
43297 (16197, 91366)
-0.69 (-0.89, -0.07)
Female
447902 (332486, 593926)
-0.49 (-0.65, -0.22)
571744 (422303, 724503)
-0.46 (-0.65, -0.15)
220888 (134446, 325540)
-0.34 (-0.62, 0.45)
20843 (5234, 53774)
-0.63 (-0.88, 0.27)
Both
548431 (440209, 676331)
-0.45 (-0.63, -0.21)
749512 (628449, 897620)
-0.42 (-0.56, -0.16)
281911 (187692, 427102)
-0.35 (-0.62, 0.13)
32292 (15279, 60701)
-0.67 (-0.86, -0.19)
Burundi
Male
653717 (325692, 1142781)
-0.48 (-0.76, 0.03)
1056778 (569240, 1637198)
-0.20 (-0.62, 0.64)
462189 (143642, 875575)
0.00 (-0.74, 1.64)
48613 (11609, 159253)
-0.66 (-0.89, 0.00)
Female
545251 (261401, 897962)
-0.37 (-0.68, 0.11)
796405 (410998, 1268087)
-0.11 (-0.54, 0.65)
379277 (135549, 666264)
0.22 (-0.44, 1.69)
30801 (3224, 126828)
-0.47 (-0.89, 0.64)
Both
600037 (379836, 889424)
-0.44 (-0.65, -0.08)
927919 (612266, 1331855)
-0.16 (-0.49, 0.41)
421156 (198704, 661510)
0.09 (-0.48, 0.94)
39798 (11218, 99184)
-0.60 (-0.87, 0.04)
Comoros
Male
674897 (396624, 1002187)
-0.48 (-0.73, 0.01)
742480 (419132, 1095510)
-0.31 (-0.69, 0.53)
331523 (151973, 565276)
-0.14 (-0.73, 1.41)
29596 (12214, 51800)
-0.76 (-0.93, -0.17)
Female
519997 (322839, 771028)
-0.47 (-0.70, -0.09)
471060 (267235, 708545)
-0.37 (-0.71, 0.40)
218365 (120136, 353666)
-0.11 (-0.58, 1.04)
13645 (3556, 36381)
-0.72 (-0.90, -0.05)
Both
599078 (415468, 812977)
-0.47 (-0.67, -0.17)
609629 (409108, 843690)
-0.34 (-0.63, 0.18)
276136 (163961, 431462)
-0.13 (-0.59, 0.68)
21789 (11120, 39880)
-0.75 (-0.90, -0.38)
Djibouti
Male
685466 (341341, 1127927)
-0.36 (-0.70, 0.20)
787920 (405383, 1222384)
-0.21 (-0.60, 0.68)
302392 (123855, 537891)
-0.09 (-0.66, 1.48)
40323 (17372, 74749)
-0.62 (-0.89, 0.27)
Female
630696 (397452, 934069)
-0.31 (-0.60, 0.17)
555979 (268577, 884433)
-0.23 (-0.61, 0.47)
198481 (85565, 369517)
-0.08 (-0.53, 0.94)
17575 (6043, 36086)
-0.56 (-0.86, 0.28)
Both
659319 (426615, 957353)
-0.34 (-0.59, 0.04)
677193 (419825, 1012365)
-0.22 (-0.52, 0.33)
252786 (143220, 425096)
-0.09 (-0.52, 0.69)
29463 (15537, 51705)
-0.61 (-0.83, -0.05)
Eritrea
Male
619358 (347046, 926805)
-0.45 (-0.73, 0.09)
721344 (422331, 1035262)
-0.28 (-0.65, 0.69)
308071 (148586, 511768)
-0.26 (-0.71, 1.24)
42243 (16560, 82238)
-0.68 (-0.91, 0.31)
Female
329033 (211930, 503783)
-0.39 (-0.67, 0.18)
347949 (203050, 484104)
-0.25 (-0.62, 0.53)
150895 (83957, 236748)
-0.14 (-0.58, 1.10)
12855 (2918, 38283)
-0.58 (-0.86, 0.74)
Both
478174 (319300, 651403)
-0.43 (-0.67, -0.05)
539764 (364668, 724007)
-0.27 (-0.57, 0.39)
231637 (134110, 361817)
-0.22 (-0.61, 0.63)
27952 (12594, 49871)
-0.66 (-0.88, 0.11)
Ethiopia
Male
912258 (643080, 1322725)
-0.38 (-0.68, 0.22)
1372880 (1023906, 1762562)
-0.38 (-0.62, 0.10)
460720 (236308, 731303)
-0.48 (-0.78, 0.62)
61140 (23917, 117228)
-0.74 (-0.92, 0.03)
Female
460832 (305757, 637772)
-0.59 (-0.77, -0.27)
640674 (436870, 876366)
-0.52 (-0.71, -0.16)
231213 (134926, 369245)
-0.47 (-0.73, 0.50)
23232 (6411, 66068)
-0.62 (-0.90, 2.40)
Both
692336 (512227, 928595)
-0.47 (-0.70, -0.19)
1016169 (810400, 1280151)
-0.43 (-0.58, -0.08)
348910 (213660, 510082)
-0.47 (-0.71, 0.04)
42672 (20176, 80165)
-0.72 (-0.88, -0.08)
Kenya
Male
449789 (261156, 673644)
-0.14 (-0.59, 0.79)
654132 (407029, 920585)
-0.31 (-0.63, 0.29)
168647 (73955, 303805)
-0.26 (-0.71, 0.82)
14867 (5529, 31376)
-0.57 (-0.85, 0.78)
Female
401012 (265328, 561256)
-0.07 (-0.51, 0.65)
469568 (330211, 639380)
-0.34 (-0.60, 0.18)
116359 (66849, 193860)
-0.06 (-0.54, 1.22)
7547 (2478, 15478)
-0.57 (-0.84, 0.37)
Both
425824 (300063, 573864)
-0.11 (-0.45, 0.45)
563453 (422525, 706978)
-0.32 (-0.55, 0.03)
142957 (90503, 223848)
-0.19 (-0.58, 0.47)
11271 (5455, 19701)
-0.57 (-0.81, 0.08)
Madagascar
Male
609954 (385679, 887158)
-0.52 (-0.72, -0.25)
341936 (176957, 658879)
-0.34 (-0.68, 0.27)
270450 (114650, 486611)
-0.08 (-0.68, 1.29)
35707 (10998, 104677)
-0.60 (-0.88, 0.00)
Female
529133 (331504, 751312)
-0.43 (-0.68, -0.12)
296273 (154567, 499935)
-0.22 (-0.61, 0.43)
234497 (131937, 409757)
0.12 (-0.45, 1.58)
25524 (6142, 80102)
-0.40 (-0.80, 0.72)
Both
570471 (401056, 765225)
-0.48 (-0.64, -0.29)
319628 (189039, 498367)
-0.29 (-0.57, 0.12)
252886 (151465, 399319)
0.00 (-0.48, 0.90)
30732 (12916, 63802)
-0.53 (-0.82, -0.02)
Malawi
Male
518354 (286815, 810513)
-0.61 (-0.82, -0.16)
829889 (465797, 1235364)
-0.45 (-0.72, 0.15)
376569 (130836, 689710)
-0.27 (-0.74, 0.98)
39169 (14110, 97437)
-0.70 (-0.92, 0.10)
Female
390286 (215521, 636137)
-0.67 (-0.85, -0.41)
594683 (359669, 874528)
-0.54 (-0.76, -0.08)
271459 (129263, 429594)
-0.31 (-0.67, 0.68)
19863 (2927, 67341)
-0.72 (-0.91, -0.20)
Both
455051 (288580, 643489)
-0.64 (-0.79, -0.41)
713628 (491161, 958945)
-0.49 (-0.68, -0.14)
324614 (163081, 525052)
-0.29 (-0.63, 0.29)
29626 (11873, 62274)
-0.71 (-0.89, -0.28)
Mozambique
Male
728747 (516015, 989607)
-0.33 (-0.63, 0.31)
1066521 (671425, 1403366)
-0.45 (-0.69, -0.04)
256932 (131156, 423565)
-0.59 (-0.84, -0.04)
56552 (17956, 155184)
-0.69 (-0.90, 0.01)
Female
538882 (370576, 760508)
-0.51 (-0.71, -0.14)
743221 (451840, 1001803)
-0.53 (-0.74, -0.15)
180002 (108219, 283851)
-0.64 (-0.82, -0.16)
24405 (4142, 81916)
-0.80 (-0.93, -0.38)
Both
634968 (478076, 811447)
-0.42 (-0.62, -0.06)
906835 (618169, 1120057)
-0.48 (-0.68, -0.22)
218934 (148518, 311363)
-0.62 (-0.80, -0.31)
40674 (16357, 91711)
-0.74 (-0.90, -0.37)
Rwanda
Male
502870 (268809, 830465)
-0.65 (-0.84, -0.27)
752771 (420063, 1187877)
-0.47 (-0.75, 0.22)
310435 (116334, 559120)
-0.39 (-0.81, 0.82)
27920 (10670, 59187)
-0.83 (-0.95, -0.47)
Female
400298 (216248, 638695)
-0.63 (-0.81, -0.27)
612736 (353525, 957172)
-0.47 (-0.74, 0.05)
296329 (157292, 474082)
-0.27 (-0.64, 0.64)
22465 (4432, 54499)
-0.72 (-0.92, 0.00)
Both
452465 (294156, 655885)
-0.64 (-0.80, -0.40)
683957 (460420, 963993)
-0.47 (-0.69, -0.06)
303504 (178929, 469248)
-0.33 (-0.65, 0.23)
25239 (10900, 48158)
-0.80 (-0.92, -0.54)
Somalia
Male
482668 (265342, 744202)
-0.36 (-0.69, 0.42)
630010 (368412, 871066)
-0.26 (-0.61, 0.86)
361905 (140265, 627065)
-0.19 (-0.64, 1.23)
55602 (12476, 179760)
0.08 (-0.74, 2.38)
Female
454983 (261870, 689987)
-0.34 (-0.65, 0.35)
408090 (250160, 578874)
-0.22 (-0.58, 0.79)
242000 (89094, 420412)
-0.13 (-0.56, 1.19)
30772 (3698, 130614)
-0.26 (-0.78, 3.21)
Both
469312 (323268, 671957)
-0.35 (-0.61, 0.16)
522947 (371992, 664614)
-0.25 (-0.54, 0.48)
304058 (179959, 478715)
-0.17 (-0.51, 0.52)
43623 (11747, 122575)
-0.07 (-0.74, 1.61)
South Sudan
Male
734751 (397884, 1138749)
-0.44 (-0.75, 0.11)
1036536 (630075, 1523631)
-0.02 (-0.60, 1.74)
385113 (183431, 640970)
0.16 (-0.62, 2.69)
60963 (18016, 164640)
-0.56 (-0.88, 0.34)
Female
449494 (256763, 706692)
-0.42 (-0.72, 0.02)
555356 (328349, 807253)
-0.06 (-0.56, 1.42)
212208 (107407, 369758)
0.30 (-0.55, 2.55)
23138 (5467, 64893)
-0.31 (-0.84, 2.07)
Both
596236 (389676, 852598)
-0.44 (-0.67, -0.06)
802886 (539415, 1065749)
-0.04 (-0.48, 1.03)
301154 (191343, 454615)
0.20 (-0.45, 1.58)
42596 (17255, 100678)
-0.52 (-0.81, 0.16)
Uganda
Male
560763 (305222, 860856)
-0.42 (-0.73, 0.35)
867237 (546710, 1259415)
-0.44 (-0.69, 0.21)
316607 (129158, 570421)
-0.31 (-0.73, 0.84)
30964 (10344, 74617)
-0.62 (-0.87, 0.54)
Female
421303 (258446, 646262)
-0.46 (-0.72, 0.03)
616499 (396125, 855912)
-0.52 (-0.73, -0.08)
226174 (124893, 393489)
-0.37 (-0.68, 0.51)
17857 (4636, 47584)
-0.71 (-0.91, 0.22)
Both
492443 (334065, 688183)
-0.44 (-0.67, -0.02)
744404 (551411, 989326)
-0.48 (-0.66, -0.10)
272305 (171109, 437754)
-0.34 (-0.63, 0.25)
24543 (11085, 50541)
-0.66 (-0.87, -0.04)
Tanzania
Male
538785 (260293, 812112)
-0.41 (-0.76, 0.21)
724346 (418122, 1051166)
-0.43 (-0.68, 0.07)
305669 (133193, 519941)
-0.30 (-0.70, 0.65)
33183 (13412, 66326)
-0.68 (-0.89, 0.19)
Female
434301 (242479, 675860)
-0.40 (-0.71, 0.16)
570201 (346377, 817131)
-0.43 (-0.69, 0.02)
222523 (123097, 380978)
-0.29 (-0.65, 0.67)
19126 (5381, 48219)
-0.66 (-0.89, 0.32)
Both
487169 (321041, 671920)
-0.41 (-0.66, -0.02)
648196 (455572, 862377)
-0.43 (-0.62, -0.03)
264593 (169592, 384056)
-0.30 (-0.60, 0.32)
26238 (13521, 50207)
-0.67 (-0.86, -0.20)
Zambia
Male
340262 (181683, 547760)
-0.45 (-0.76, 0.27)
756331 (452984, 1080190)
-0.41 (-0.70, 0.10)
259495 (121523, 436239)
-0.15 (-0.66, 1.13)
27654 (11533, 47841)
-0.71 (-0.91, -0.01)
Female
303298 (179494, 459750)
-0.49 (-0.74, -0.07)
469638 (290487, 652266)
-0.52 (-0.73, -0.09)
175644 (95950, 294802)
-0.31 (-0.65, 0.62)
11314 (3064, 25950)
-0.72 (-0.90, -0.17)
Both
321974 (212508, 458957)
-0.47 (-0.7, -0.09)
614487 (460928, 788041)
-0.45 (-0.63, -0.14)
218009 (135891, 331281)
-0.22 (-0.61, 0.46)
19570 (10371, 32401)
-0.71 (-0.87, -0.29)
There were 749,512 YLLs rate per 100,000 live births (95% UI: 628,449, 897,620) from neonatal encephalopathy due to birth asphyxia and trauma, with 920,392 YLLs per 100,000 male live births (95% UI: 710,062, 1,152,972) and 571,744 YLLs per 100,000 female live births (95% UI: 422,303, 724,503). There was no statistically significant difference in the distribution of the rate by location. Between 1990 and 2023, the YLLs rate declined by 42% (95% UI: -56, -16) in the region. However, the rate remains unchanged in Burundi [-16% (-49, 41)], Comoros [-34% (95% UI: -63, 18)], Djibouti [-22% (95% UI: -52, 33)], Eritrea [-27% (95% UI: -57, 39)], Kenya [-32% (95% UI: -55, 3)], Madagascar [-29% (95% UI: -57, 12)], Somalia [-25% (95% UI: -54, 48)], and South Sudan [-4% (95% UI: -48, 103)] (Table 5).
Neonatal sepsis and other neonatal infections accounted for 281,911 YLLs per 100,000 live births (95% UI: 187,692, 427,102), with 340,569 YLLs per 100,000 male live births (95% UI: 158,342, 548,999) and 220,888 YLLs per 100,000 female live births (95% UI: 134,446, 325,540). There was no statistically significant variation in the distribution of the rate by location. Moreover, the rate remained stable [-35% (95% UI: -62, 13)] throughout the region between 1990 and 2023. Only Mozambique had a significant decline in the rate [62% decline (95% UI: -80%, -31%)] (Table 5).
There were an estimated 32,292 YLLs per 100,000 live births (95% UI: 15,279, 60,701) from hemolytic disease and other neonatal jaundice, with 43,297 YLLs per 100,000 male live births (95% UI: 16,197, 91,366) and 20,843 YLLs per 100,000 female live births (95% UI: 5234, 53,774). There was no statistically significant difference in the distribution of the rate by location. The rate declined by 67% (95% UI: -86, -19) in the region in 2023 compared to the rate in 1990. However, Burundi [-60% (95% UI: -0.87, 4)], Eritrea [-66% (95% UI: -88, 11)], Kenya [-57% (95% UI: -81, 8)], Somalia [-7% (95% UI: -74, 161)], and South Sudan [-52% (95% UI: -81, 16)] did not exhibit a statistically significant decline in the rate between 1990 and 2023 (Table 5).
Discussion
This study aimed to estimate the incidence, mortality, and YLLs from neonatal disorders in the ESSA region from 1990 to 2023. The study revealed that there were an estimated 300,042 new cases per 100,000 live births (95% UI: 293,808, 305,567), 21,889 deaths per 100,000 live births (95% UI: 20,447, 22,993), and 1.9 million YLLs per 100,000 live births (95% UI: 1.8, 2.1) in the region in 2023. Early neonates were disproportionately affected by neonatal disorders compared to late neonates. Neonatal preterm birth, neonatal encephalopathy due to birth asphyxia and trauma, neonatal sepsis and other neonatal infections, and hemolytic disease and other neonatal jaundice were the leading neonatal disorders in the region. In most countries, males had higher estimates of neonatal disorders compared to females. Significant inter-country variations were estimated in the overall rates across the region. However, there were no statistically significant differences in the distribution of mortality and YLLs rates by types of neonatal disorders. Between 1990 and 2023, there was considerable decline in the rates.
The estimated incidence rate of neonatal disorders in the ESSA region was considerably high and signals widespread challenges in neonatal health, necessitating a re-evaluation of current preventive and care strategies across the region. The finding aligns with previous evidence demonstrating a high burden of neonatal disorders in the region.1,12 This markedly higher incidence may be attributed to a confluence of factors, including prevalent socioeconomic challenges, higher burden of neonatal infections, limited access to and utilization of maternal and newborn care, lower educational attainment, insufficient awareness of pregnancy danger signs, and deficiencies in antenatal care services throughout the region.13-15 The incidence rate demonstrated a marked variation across the region, with Somalia, South Sudan, Comoros, and Mozambique exhibiting rates significantly higher than the regional average. This can be attributed to a confluence of factors such as prolonged political instability, conflict, and severe socioeconomic challenges, which critically undermine the development and functionality of robust health systems.16,17 These may lead to limited access to quality antenatal care, a scarcity of skilled birth attendants, inadequate emergency obstetric services, poor infrastructure for early postnatal care, and insufficient basic neonatal care units.18 These findings reveal the presence of a significant challenge to the achievement of Sustainable Development Goal (SDG) 3.2, which aims to reduce neonatal mortality to at least as low as 12 deaths per 1,000 live births.19 This implies the need for a highly targeted approach and intensified investments in maternal and neonatal health programs.
Conversely, countries like Rwanda, Kenya, Burundi, and Djibouti showed notably lower incidence rates, with Rwanda demonstrating the lowest at 208,504 new cases per 100,000 live births. This success can be justified by their greater focus on strengthening primary healthcare, expanding community health worker programs, and improving access to essential maternal and newborn health interventions.20,21 The success of these countries may offer valuable lessons, so their strategies for health system strengthening, community engagement and policy implementation can be studied and adapted by other nations in the region. Additionally, there was significant sex disparity, with male neonates experiencing a much higher incidence rate of neonatal disorders compared to female neonates. This biological vulnerability of male infants to various neonatal conditions, including prematurity, respiratory distress syndrome, and infections, is well-documented in literature and is often attributed to developmental and immunological differences.22
Neonatal preterm birth was the leading neonatal disorder in the region, followed by neonatal sepsis and other neonatal infections. This finding aligns with previous studies that consistently identified preterm birth as the leading neonatal disorder with the highest incidence rate.1,14,23 Likewise, it has been estimated to account for over 40% of neonatal deaths in sub-Saharan Africa, underscoring its disproportionate contribution to the neonatal mortality burden in the region.24 This implies the critical need to prioritize the prevention and management of premature birth within any strategy aimed at reducing neonatal disorders.
The incidence rate of neonatal disorders estimated among early neonates was significantly higher than that of late neonates. This finding is consistent with previous studies showing that the first week of life is the most vulnerable period for neonatal morbidity and complications.25 This indicates the fragility of newborns immediately after birth and during their initial adaptation to extra-uterine life, highlighting the crucial importance of high-quality care in the first week.26
The estimated neonatal death rate in the ESSA region (21,889 deaths per 100,000 neonates) was notably high and significantly off-track from SDG target 3.2, which aims to reduce neonatal mortality to at least as low as 12 deaths per 1,000 live births by 2030.19 Although the estimated mortality rate exceeds global averages, it remains consistent with existing evidence characterizing the region as a high-burden setting.1,27 The elevated rate in the region may be attributed to the high prevalence of prematurity, low rates of health facility deliveries, poor access to skilled birth attendants, insufficient neonatal intensive care units, and inadequate antenatal care follow-up.28,29 Consistent with the incidence of neonatal disorders, there was a notable gender disparity in mortality, with higher male neonatal deaths compared to females. This aligns with the findings of previous studies.3,30 This underscores the presence of specific biological or socio-economic vulnerabilities that disproportionately affect male neonates.31 Furthermore, there were variations in neonatal mortality rates across the region, with Ethiopia and Burundi exhibiting significantly higher rates than the regional average; that may be because the countries are likely struggling with weaker primary health infrastructure, low-quality service delivery, and greater socio-economic barriers to neonatal care.32,33 Conversely, Eritrea, Kenya, and Zambia showed comparatively lower rates, although these figures are still extremely high when measured against global best practices and the SDG target.34 This points out the presence of inequalities in access to quality maternal and neonatal healthcare, health infrastructure, and socio-economic determinants across the region.35,36
There was a significantly higher death rate from neonatal disorders among early neonates when compared to late neonates. This is consistent with previous findings, as the early neonatal period is recognized as the most vulnerable time for newborns, and the vast majority of neonatal deaths occur within the first 24-48 hours and certainly within the first week.37,38 Especially birth asphyxia, prematurity, and low birth weight significantly contribute to the death of early neonates in low-income countries.39
Even though the global and regional decline of death from neonatal encephalopathy due to birth asphyxia and trauma was reported in previous studies,40-42 this study demonstrated that the disorder is still the leading cause of mortality in the region, followed by neonatal preterm birth. Consistent with this finding, it was previously reported as the leading cause of premature death and disability among neonates, especially in low-income settings.42-44 Achieving universal coverage of obstetric care, good supportive post-partum care and neonatal resuscitation is thus crucial, as these interventions are pivotal in averting a significant number of deaths and disabilities from the disorder.45
The estimated 1.9 million YLLs per 100,000 neonates across the ESSA region are alarmingly high, illustrating that millions of potential future contributions, workforces, and innovations are lost at the very beginning of life. This finding aligns with previous studies showing that neonatal disorders remain among the leading causes of YLLs, particularly in low-resource settings.12,46 Consistent with incidence and death rate, there is a significant and concerning gender disparity regarding YLLs. A significantly higher burden of YLLs was estimated among male neonates compared to females, emphasizing the need for sex-specific strategies in neonatal health initiatives and targeted public health interventions that address sex-specific vulnerabilities. Like incidence and mortality rates, the YLLs rate was also not uniform, with stark variations in YLLs across countries within the ESSA region, with Ethiopia and Burundi bearing the heaviest burden. Conversely, Kenya, Eritrea, Madagascar, and Zambia showed comparatively lower YLLs rates. While still representing a massive loss of life, these rates, relative to other countries in the region, suggest slightly stronger health interventions.47,48 This inter-country disparity means that the path to achieving SDG 3.2 is highly uneven, demanding a concerted effort that channels resources and expertise to where the YLLs burden is highest, while simultaneously accelerating progress across all nations to prevent these early losses of potential life.
The finding of this study revealed that early neonates experienced higher YLLs when compared to late neonates, highlighting the profound vulnerability of newborns immediately post-birth. This burden is predominantly driven by acute, time-sensitive conditions directly linked to labor, delivery, and immediate physiological adaptation, such as birth asphyxia, severe prematurity complications, and early-onset sepsis.39 While mortality may persist into the later neonatal period, the most acutely lethal events are concentrated in the first week, leading to a disproportionate loss of potential life years during this initial critical period.37
Neonatal encephalopathy due to birth asphyxia and trauma constituted the leading cause of YLLs in the region, followed closely by neonatal preterm birth, which aligns with the observed patterns of neonatal mortality from these disorders. Studies have consistently shown that neonatal encephalopathy due to birth asphyxia and birth traumas remain among the leading contributors to neonatal deaths and YLLs.41,44 This disproportionate burden of YLLs highlights that these conditions are not only common but also result in deaths occurring at very early ages, thus maximizing the loss of potential life years. This necessitates a strategic and targeted response focusing on the universal provision of high-quality maternal and neonatal service delivery, particularly strengthening intrapartum care to avert birth-related complications, alongside comprehensive interventions for managing prematurity.19,37
There was considerable decline in the estimates of incidence, mortality, and YLLs from neonatal disorders across the ESSA region between 1990 and 2023. These findings are consistent with previous studies reporting a downward trend of the burden of neonatal disorders in resource-limited settings.1,27 The estimated percentage decline is promising and indicates the visible improvement in maternal and child health care in the region over the years.21,49 However, substantial disparities were estimated across countries. Djibouti and South Sudan experienced no significant decline in the incidence rates, while South Sudan, Kenya, and Burundi had the lowest reductions in mortality and YLLs rates, likely due to weak health systems, conflict, poverty, and limited access to quality maternal and neonatal care.50-54 In contrast, Mozambique, Rwanda, and Ethiopia showed greater decline, possibly reflecting stronger maternal and child health interventions and healthcare system improvements.55-57 Overall, the findings highlight that there is still a need to strengthen equitable maternal and newborn healthcare services.
The findings on incidence, mortality, and YLLs of neonatal disorders in the ESSA region presented an undeniable call to action. Achieving SDG 3.2 by 2030 will necessitate transformation of health policy, grounded in primary prevention, resilient health systems, equity, and substantial investment.58 The consistent male predominance in the incidence, mortality, and YLLs from neonatal disorders highlights the need for sex-specific interventions and strategies in neonatal health initiatives. Despite decades of effort, causes of neonatal disorders have not been sufficiently addressed.58,59 The overwhelming burden, evidenced by high incidence of preventable disorders, devastating mortality rates, and millions of years of life prematurely lost, demands immediate policy attention. Policies must therefore prioritize robust primary prevention strategies to reduce the occurrence of neonatal disorders, rather than solely focusing on treatment.60 These include improving antenatal care, promoting skilled facility-based deliveries, expanding postnatal care services, strengthening infection prevention and control measures, neonatal resuscitation programs, access to antenatal corticosteroids, and Kangaroo Mother Care.59,61,62 Moreover, valuable lessons in health system strengthening, community engagement, and policy implementation should be adapted from countries with comparatively lower incidence, YLLs, or mortality rates. Policies should facilitate sharing these strategies while critically adapting them to local contexts.63
This study has some limitations. Although our study includes a range of neonatal disorders, it lacks detailed information regarding modifiable risk factors critical for designing targeted preventive interventions.1 The estimates are derived from the GBD study and depend on the underlying modeling assumptions as well as the availability data across countries in the region.64,65 In countries with limited surveillance and incomplete health information systems, the estimates may be subject to greater uncertainty. Weak health information systems may also result in underreporting and misclassification of neonatal disorders and deaths, potentially leading to underestimation or inaccurate characterization of the burden and trends of neonatal disorders.64,66,67 Although the models are invaluable, they inherently introduce a degree of uncertainty and may be biased by the quality and representativeness of underlying data.1,64 Future studies are also recommended to track the progress in reducing the burden of neonatal disorders in the region.
Conclusion
The ESSA region experienced considerably high incidence rates, mortality rates, and YLLs from neonatal disorders in 2023, which collectively represent a critical public health concern. These estimated measures are not uniformly distributed, exhibiting significant inter-country variation, as well as distinct disparities by gender and across the critical early and late neonatal periods, highlighting sex-specific and localized challenges in newborn health. Moreover, there was a remarkable decline in the incidence, mortality, and YLLs from the disorders throughout the region from 1990 to 2023. Consequently, comprehensive and transformative interventions and strategies are essential. These efforts should prioritize robust primary prevention and quality maternal and newborn health services and implement targeted actions that address both specific disorders and identified gender and geographical disparities across the region. Interventions, particularly in high-burden countries, should focus on preventing preterm birth, strengthening neonatal infection prevention and control efforts, and improving the availability and quality of essential newborn care.
Footnotes
Acknowledgements
The authors would like to thank the Institute for Health Metrics and Evaluation for coordinating the GBD 2023 study.
ORCID iDs
Bekam Yambo Jofa
Gelgelo Wodessa
Teshome Gensa
Abera Mersha
Maleda Tefera
Haymanot Mezmur
Abadi Kidanemariam Berhe
Yemane Berhane Tesfau
Embaba Tekelaye Welesemayat
Boko Loka Safayi
Miesa Gelchu
Anteneh Fikrie Tekola
Ethical Considerations
The study used secondary data from the GBD 2023 study. Not applicable.
Author Contributions
ST conceived and designed the study. ST, BYJ, TG, BK, AM, AG, MT, HM, AKB, YBT, ETW, BLS, BNB, KL, MG, and AFT were involved in the analysis and interpretation of the findings. ST acted as a guarantor. All authors have approved the final version of the manuscript.
Funding
The authors received no financial support for the research, authorship, and/or publication of this article.
Declaration of Conflicting Interests
The authors declared no potential conflicts of interest with respect to the research, authorship, and/or publication of this article.
Data Availability Statement
All data relevant to the study are included in the article. The GBD 2023 data are publicly available at: .
Patient and Public Involvement
It was not appropriate or possible to involve patients or the public in the design, or conduct, or reporting, or dissemination plans of our research.
References
1.
QinCGaoXYinL, et al.Global, regional and national disease burden of neonatal disorders from 2000 to 2021 and the comparison before and during COVID-19: a systematic analysis. BMC Public Health. 2025;25(1):3790.
2.
QiuY-TWeiYMaR, et al.National Burden of Neonatal Disorders, 1990–2021: A Systematic Analysis from the Global Burden of Disease Study 2021. Available at SSRN. doi:10.2139/ssrn.5103690.
3.
PaulsonKRKamathAMAlamT, et al.Global, regional, and national progress towards Sustainable Development Goal 3.2 for neonatal and child health: all-cause and cause-specific mortality findings from the Global Burden of Disease Study 2019. The Lancet. 2021;398(10303):870-905.
4.
PengRTongYYangM, et al.Global burden and inequality of maternal and neonatal disorders: based on data from the 2019 Global Burden of Disease study. QJM: An International Journal of Medicine. 2023;117(1):24-37.
5.
AghaiZHGoudarSSPatelA, et al.Gender variations in neonatal and early infant mortality in India and Pakistan: a secondary analysis from the Global Network Maternal Newborn Health Registry. Reproductive Health. 2020;17(3):178.
6.
ErchickDJLacknerJBMullanyLC, et al.Causes and age of neonatal death and associations with maternal and newborn care characteristics in Nepal: a verbal autopsy study. Archives of Public Health. 2022;80(1):26.
7.
RonoJKamauLMangwanaJWaruguruJAluochPNjorogeM. A policy analysis of policies and strategic plans on Maternal, Newborn and Child Health in Ethiopia. International Journal for Equity in Health. 2022;21(1):73.
8.
SarikhaniYNajibiSMRazaviZ. Key barriers to the provision and utilization of maternal health services in low-and lower-middle-income countries; a scoping review. BMC Women’s Health. 2024;24(1):325.
9.
MogesNDessieAMAnleyDT, et al.Burden of early neonatal mortality in Sub-Saharan Africa. A systematic review and meta-analysis. PloS one. 2024;19(7):e0306297.
10.
WillcoxMPeersmanWDaouP, et al.Human resources for primary health care in sub-Saharan Africa: Progress or stagnation?Human resources for health. 2015;13:76.
11.
UNICEF. Demographic Fast Facts about Eastern and Southern 2023 Update; 2023.
12.
XinJLuoYXiangW, et al.Measurement of the burdens of neonatal disorders in 204 countries, 1990–2019: a global burden of disease-based study. Frontiers in Public Health. 2024:11-2023.
13.
BechCMStensgaardCNLundS, et al.Risk factors for neonatal sepsis in Sub-Saharan Africa: a systematic review with meta-analysis. BMJ Open. 2022;12(9):e054491.
14.
MabroukAAbubakarATooEKChongwoEAdetifaIM. A Scoping Review of Preterm Births in Sub-Saharan Africa: Burden, Risk Factors and Outcomes. International Journal of Environmental Research and Public Health. 2022;19(17):10537. [Internet].
15.
AyeleBHollidayEHassenTAChojentaC. Maternal and neonatal health service access and utilisation in sub-Saharan Africa (2015–2023): a systematic review and meta-analysis. BMC Health Services Research. 2026.
16.
NikoloskiZMohamoudMMMossialosE. Universal health coverage in fragile and conflict-affected States: insights from Somalia. International Journal for Equity in Health. 2025;24(1):125.
17.
HidigSHanfiMAliAGoodAEgeh. The challenges facing the healthcare system in Somalia: A review and The Way Forward. 2024;03:06-16.
18.
WilundaCScanagattaCPutotoG, et al.Barriers to utilisation of antenatal care services in South Sudan: a qualitative study in Rumbek North County. Reproductive Health. 2017;14(1):65.
TuyisengeGCrooksVABerryNS. Facilitating equitable community-level access to maternal health services: exploring the experiences of Rwanda’s community health workers. International Journal for Equity in Health. 2019;18(1):181.
21.
SerbanescuFKrukMEDominicoSNimakoK. Context Matters: Strategies to Improve Maternal and Newborn Health Services in Sub-Saharan Africa. Global Health: Science and Practice. 2022;10(2):e2200119.
22.
AlurPHollaIHussainN. Impact of sex, race, and social determinants of health on neonatal outcomes. Frontiers in Pediatrics. 2024:12-2024.
23.
ChengX-ETangJGeM, et al.Global landscape of neonatal disorders attributed to environmental and maternal risks over three decades. Ecotoxicology and Environmental Safety. 2025;299:118411.
24.
Population-based rates, risk factors and consequences of preterm births in South-Asia and sub-Saharan Africa: A multi-country prospective cohort study. J Glob Health. 2022;12:04011.
25.
DolJHughesBBonetM, et al.Timing of neonatal mortality and severe morbidity during the postnatal period: a systematic review. JBI evidence synthesis. 2022. Publish Ahead of Print.
26.
MichelALoweN. The Successful Immediate Neonatal Transition to Extrauterine Life. Biological Research For Nursing. 2017;0:109980041668517.
27.
OuZYuDLiangY, et al.Global trends in incidence and death of neonatal disorders and its specific causes in 204 countries/territories during 1990–2019. BMC Public Health. 2022;22(1):360.
28.
BezieMMFenteBMAsmareZA, et al.Impact of health facility delivery and antenatal care on neonatal mortality in Sub-Saharan Africa: a propensity score matching analysis. BMC Pregnancy Childbirth. 2025;25(1):440.
29.
KimutaiGChirchirJOyooSMuktharV. Determinants of Neonatal Mortality in Sub-Saharan Africa: A Scoping Review. East African Journal of Health and Science. 2026;9:113-133.
30.
GuDZhengXZhouY, et al.Neonatal mortality trends in the 21st century: findings from the Global Burden of Disease Study 2021. Jornal de Pediatria. 2026;102(2):101519.
31.
VuHDDickinsonCKandasamyY. Sex Difference in Mortality for Premature and Low Birth Weight Neonates: A Systematic Review. Am J Perinatol. 2018;35(8):707-715.
32.
BiadgoALegesseAEstifanosAS, et al.Quality of maternal and newborn health care in Ethiopia: a cross-sectional study. BMC Health Services Research. 2021;21:679.
33.
HabonimanaDBaturaN. Empirical analysis of socio-economic determinants of maternal health services utilisation in Burundi. BMC Pregnancy Childbirth. 2021;21(1):684.
34.
SaugstadOD. Reducing global neonatal mortality is possible. Neonatology. 2011;99(4):250-257.
35.
Yihune TeshaleMBanteAGedefaw BeleteACrutzenRSpigtMStutterheimSE. Barriers and facilitators to maternal healthcare in East Africa: a systematic review and qualitative synthesis of perspectives from women, their families, healthcare providers, and key stakeholders. BMC Pregnancy Childbirth. 2025;25(1):111.
36.
TekebaBTTTZegeyeAF. Non-utilization of selected newbornpostnatal care and associated factors among postpartum women in East Africa: a multilevel mixed-effect analysis using the most recent DHS data 2016–2023. BMC Pregnancy and Childbirth. 2025;25(470).
37.
LehtonenLGimenoAParra-LlorcaAVentoM. Early neonatal death: A challenge worldwide. Seminars in Fetal and Neonatal Medicine. 2017;22(3):153-160.
38.
GessesseADBeleteMBTadesseF. Time, cause of early neonatal death, and its predictors among neonates admitted to neonatal intensive care units at Bahir Dar City public hospitals, northwest Ethiopia: a prospective follow-up study. Frontiers in Pediatrics. 2024:12-2024.
39.
ZuluTJacobsCBiembaGMusondaP. Prevalence of early neonatal mortality and its predictors in sub-Saharan Africa: A Systematic review and Meta-Analysis. medRxiv. 2024. 2024.08.06.24311554.
40.
LiuTMeiHZhengJChenMShiLChenZ. Global, Regional, and National Burden of Neonatal Encephalopathy due to Birth Asphyxia and Trauma, Its Attributable Risk Factors, 1990-2021: Results from the Global Burden of Disease Study 2021. Neuroepidemiology. 2025:1-23.
41.
DuFGuLWangJ, et al.Neonatal encephalopathy due to birth asphyxia and trauma: global trends and disparities. Front Public Health. 2025;13:1583572.
42.
LauK. Global trends in incidence and mortality of neonatal encephalopathy due to birth asphyxia and trauma. European Journal of Public Health. 2019;29(Supplement_4):ckz187.118.
43.
JenaBHJaldoMM. Determinants of neonatal mortality in sub-Saharan Africa: systematic review and meta-analysis of adverse newborn conditions. BMC Public Health. 2025;25(1):3058.
44.
JiXXiongZPengT, et al.Global, regional, and national burden of neonatal encephalopathy due to birth asphyxia and trauma, 1990-2019. Chinese medical journal; 2025.
45.
KrishnanVKumarVVarianeGFT, et al.Need for more evidence in the prevention and management of perinatal asphyxia and neonatal encephalopathy in low and middle-income countries: A call for action. Semin Fetal Neonatal Med. 2021;26(5):101271.
46.
AbateBNaTNaMNaSFantahunA. Burden and Health Loss Due to Neonatal Disorders in Ethiopia:20192023.
47.
KamangaANgosaLAladesanmiO, et al.Reducing maternal and neonatal mortality through integrated and sustainability-focused programming in Zambia. PLOS Global Public Health. 2022;2(12):e0001162.
48.
OmbereSO. Can “the expanded free maternity services” enable Kenya to achieve universal health coverage by 2030: qualitative study on experiences of mothers and healthcare providers. Frontiers in Health Services. 2024;4:4-2024.
49.
Edu-MensahMFeeleyCWalkerSStaceyT. Interventions to improve skilled birth attendance in sub-Saharan Africa. What has been done, and what has worked? A narrative synthesis. Midwifery. 2025;147:104426.
50.
NajjuukoCXuZKizitoSLuCSsewamalaFM. Patterns of maternal and child health services utilization and associated socioeconomic disparities in sub-Saharan Africa. Nature Communications. 2025;16(1):7840.
51.
SamiSMayaiASheehyG, et al.Maternal and child health service delivery in conflict-affected settings: a case study example from Upper Nile and Unity states, South Sudan. Conflict and Health. 2020;14(1):34.
52.
BelaidLBayoPKamauL, et al.Health policy mapping and system gaps impeding the implementation of reproductive, maternal, neonatal, child, and adolescent health programs in South Sudan: a scoping review. Conflict and Health. 2020;14(1):20.
53.
MwangiANangamiMTabuJAyukuDWereEFabianE. A system approach to improving maternal and child health care delivery in Kenyan communities and primary care facilities: baseline survey on maternal health. Afr Health Sci. 2019;19(2):1841-1848.
54.
KisianganiIElmiMBakibingaP, et al.Persistent barriers to the use of maternal, newborn and child health services in Garissa sub-county, Kenya: a qualitative study. BMC Pregnancy and Childbirth. 2020;20(1):277.
55.
MelesseDYTadeleAMuluS, et al.Learning from Ethiopia's success in reducing maternal and neonatal mortality through a health systems lens. BMJ Glob Health. 2024;9(Suppl 2):e011911.
56.
PiresPDDNMupuelequeMZakusD, et al.Maternal and child health implementation research in Mozambique: effective community interventions to promote sexual and reproductive health; 2020.
57.
SamuelsFAmayaABBalabanovaD. Drivers of health system strengthening: learning from implementation of maternal and child health programmes in Mozambique, Nepal and Rwanda. Health Policy and Planning. 2017;32(7):1015-1031.
58.
MollerA-BPattenJHansonCEssénBJacobssonB. Five decades of advancing global maternal and newborn health and rights: Milestones and initiatives. International Journal of Gynecology & Obstetrics. n/a(n/a).
59.
NieuwoudtLMackayCAMdaSCauses of and Modifiable Factors Contributing to Neonatal Deaths at Dora Nginza Hospital in the Eastern Cape, 9. South Africa: Global Pediatric Health; 2022:2333794X221139413.
60.
LeeHRRehmanSSihotaD, et al.Prevention and Treatment of Neonatal Infections in Facility and Community Settings of Low- and Middle-Income Countries: A Descriptive Review. Neonatology. 2025;122(Suppl 1):173-208.
61.
ZelkaMAYalewAWDebelewGT. Effectiveness of a continuum of care in maternal health services on the reduction of maternal and neonatal mortality: Systematic review and meta-analysis. Heliyon. 2023;9(6):e17559.
62.
HuynhLTTranHTVanhaesebrouckS. Review of Low-Cost Interventions for Reducing Neonatal Mortality and Morbidity in Low- and Middle-Income Countries. Acta Paediatrica. 2025;114(9):2124-2132.
63.
BreneolSCurranJAMartenR, et al.Strategies to adapt and implement health system guidelines and recommendations: a scoping review. Health Res Policy Syst. 2022;20(1):64.
64.
LouJXiangZZhuX, et al.Trends and levels of the global, regional, and national burden of injuries from 1990 to 2021: findings from the global burden of disease study 2021. Ann Med. 2025;57(1):2537917.
65.
LiYYeRJYangSQ, et al.Global, regional, and national burden of neonatal disorders and subtypes attributable to air pollution from 1990 to 2021: a systematic analysis of the Global Burden of Disease Study 2021. J Health Popul Nutr. 2025;44(1):157.
66.
Abdul-RahmanTGhoshSLukmanL, et al.Inaccessibility and low maintenance of medical data archive in low-middle income countries: Mystery behind public health statistics and measures. Journal of Infection and Public Health. 2023;16(10):1556-1561.
67.
LawrenceMFullerBIsabiryeH, et al.Health Data Reporting Challenges in the Age of DHIS2: a Mixed-Methods Review in the Teso Sub-Region of Uganda2024.