
Abstract
We develop a site amplification model for a regional geologic condition that includes surficial deposits of peaty organic soils in Hokkaido, Japan. We use ground motion data from national Japanese networks along with local data from the study region. We apply a non-reference site approach to infer site effects from misfits of reference ground motion models to data from 10 subduction zone earthquakes. Application of this approach requires removal of source-specific biases and careful consideration of source-to-site path effects. These considerations are essential to avoid mapping source- or path-related model misfits into estimates of site response. We consider three subduction ground motion models as reference models. By paying special attention to the conditions for which the path models are effective, and making adjustments for between-island path misfits (Hokkaido to Honshu and vice versa), we identify regional site effects that are insensitive to the ground motion models used in their derivation. Observed site responses are characterized by strong resonances at first-mode site frequencies, and as a result the regional model is conditioned on peak frequency from horizontal-to-vertical spectral ratios.
Introduction
The application of ergodic site terms in ground motion models (GMMs) to regions having very soft, peaty organic soils is a process that carries large epistemic uncertainty. One substantial driver of this uncertainty is that the ground conditions at such sites can have very slow time-averaged shear wave velocities in the upper 30 m (VS30), perhaps 100 m/s or less. Figure 1 shows VS30 histograms from site databases in the NGA-West2 and NGA-Subduction projects. The lowest VS30 values in these histograms are in the range of 100–200 m/s. As a result, the application of ergodic models to soft peat sites represents an extrapolation beyond the data range—the ergodic mean site response is simply unknown.
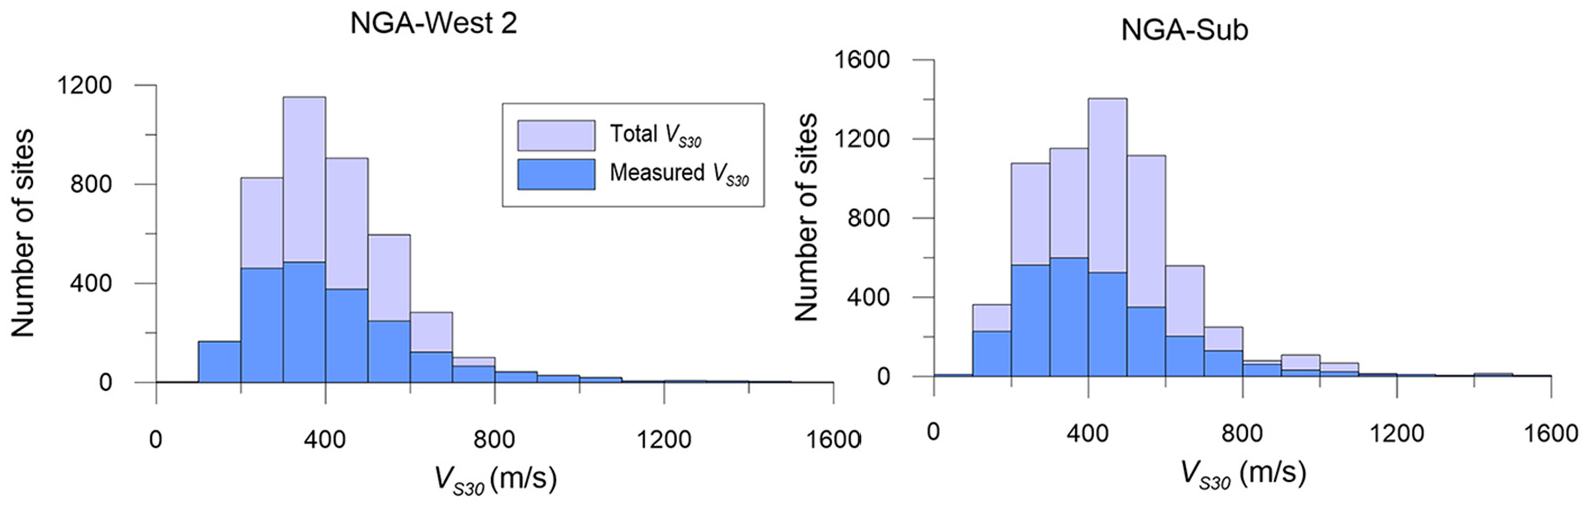
Histograms of total and measured VS30 values for sites in NGA-West2 database (left) and NGA-subduction database (right). From Seyhan et al. (2014) and Ahdi et al. (2020), respectively.
A second driver of large uncertainty can be anticipated because soft peats usually overlie relatively firm, non-organic soils at depth. As a result, there likely exists within the site profile steep velocity gradients that can give rise to more pronounced impedance and resonance effects than would be typical at non-peat sites. Such effects produce site response transfer functions with strong peaks at one or more site frequencies. These features of site response cannot be fully captured by VS30-based models as used in typical GMMs, although they could potentially be captured by a model that combines VS30-scaling terms with site resonance terms that take the peak frequency (
As a result of these issues, the ergodic site terms in current GMMs for subduction earthquakes in Japan, whether based on VS30 (Abrahamson et al., 2018; Parker et al., 2022; denoted Aea18 and Pea22) or site classes defined from VS30 and site period (four such classes are used in Zhao et al., 2016a, 2016b; denoted Zea16) are expected to have bias and large uncertainty when applied to peaty organic soil sites with very low VS30 such as those in Hokkaido. In this study, we develop region-specific site amplification models based on features of local site response derived from non-ergodic analyses. The developed site amplification model is specific to the Hokkaido region, but the procedure used in its development is fully general and as such could be applied to other regions with ground motion recordings.
The approach taken in this article is to develop a linear site amplification model using relatively low-amplitude recordings, for which significant nonlinear effects are not expected. We then examine nonlinear effects through residuals analysis using data from one event that produced stronger shaking.
Data sources
The region-specific analysis performed in this study applies to the portion of the Tokachi River in Hokkaido, Japan passing through peaty organic soil layers that extend roughly from the river mouth to 40 km upstream of the river mouth, as shown in Figure 2. This region contains seven strong motion stations operated by Obihiro Development and Construction Department (ODCD), for which we have obtained recordings from ten earthquakes in the NGA-subduction database. This section discusses the data compiled for analysis of non-ergodic site responses at these seven stations.
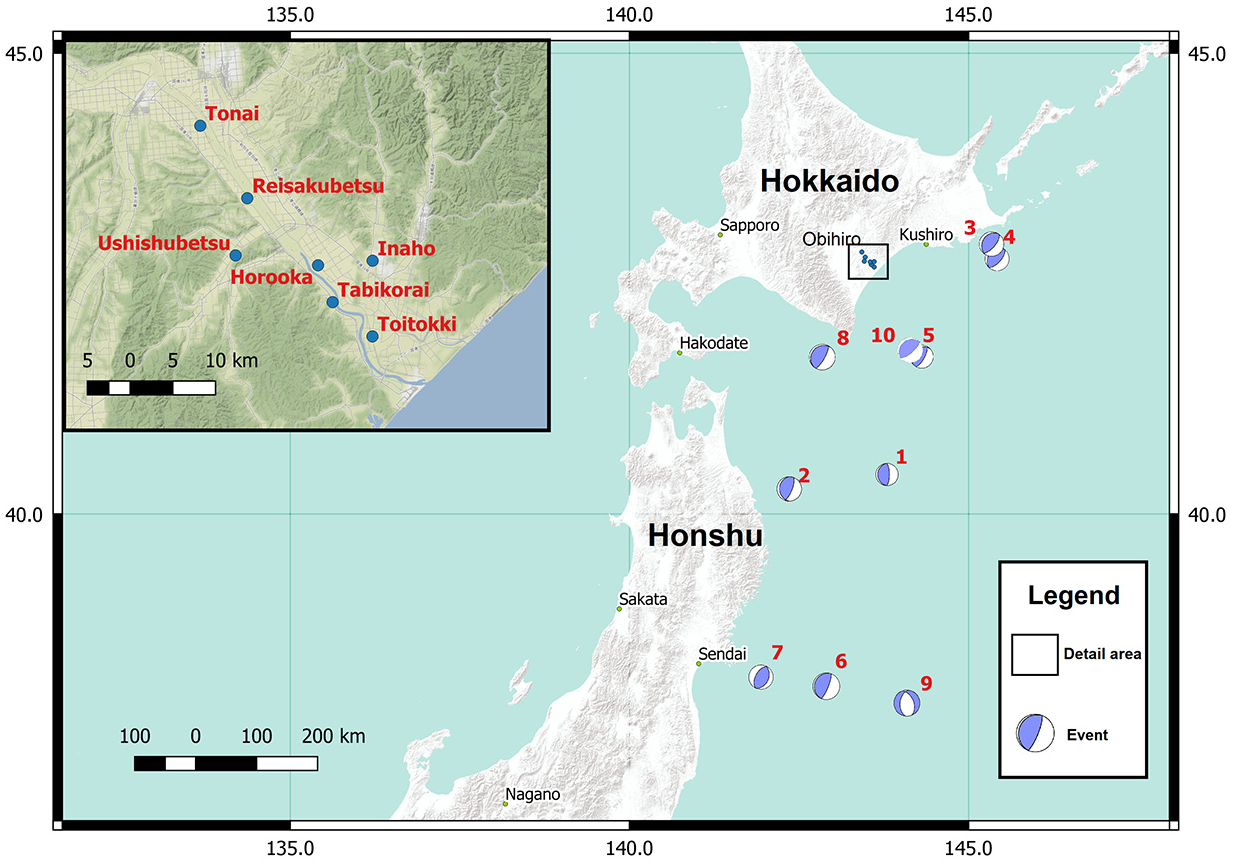
Map of northern Japan showing event locations considered in this study and location of Tokachi River study region. Detail map of study region shows locations of local ground motion stations.
Ground motions and related metadata
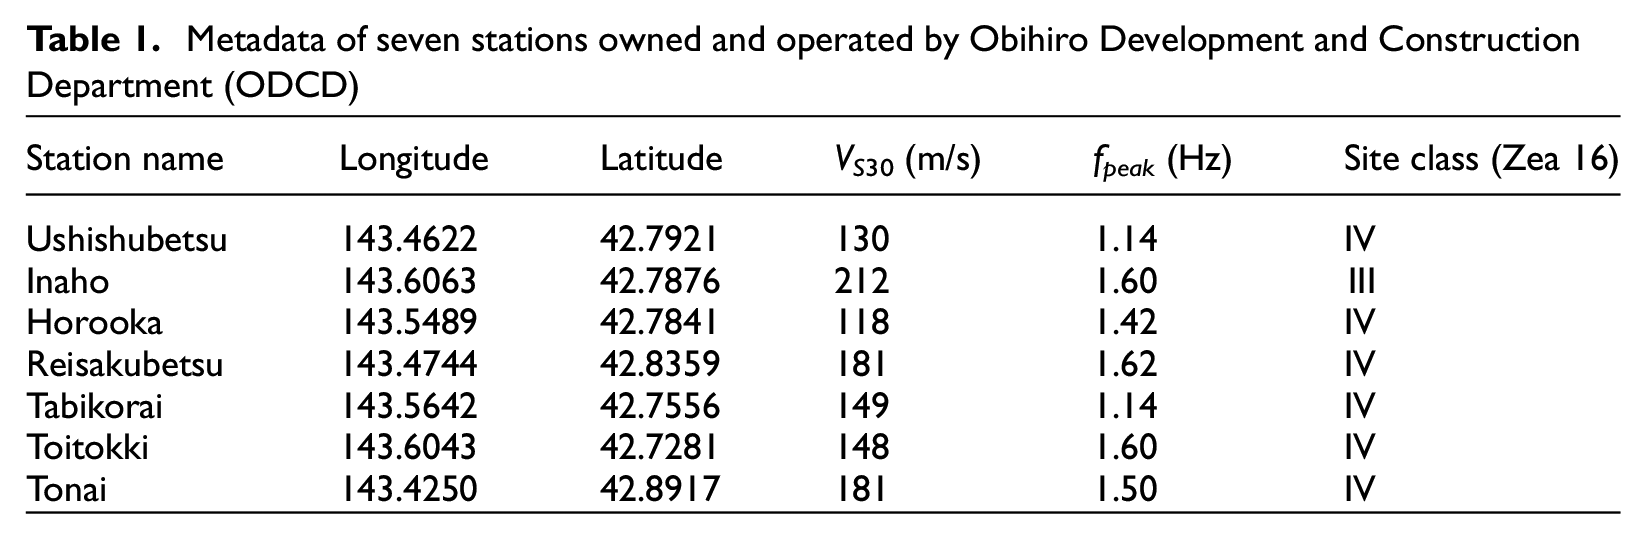
Table 1 provides metadata for the seven ODCD stations in the study region. The station locations were provided by ODCD and the basis for the site information (VS30 and classification) is provided in the following section. As shown in Figure 2, the station locations are roughly evenly distributed across the study region.
Metadata of seven stations owned and operated by Obihiro Development and Construction Department (ODCD)
The stations in Table 1 have recorded 10 earthquakes. Figure 2 shows the epicenter locations of these events, each of which has ground motion data that is incorporated into the NGA-subduction database (Kishida et al., 2020). Metadata for the 10 events is provided in Table 2 along with the numbers of processed recordings produced by each event in the NGA-subduction database. The numbers of records per event range from 13 to 1293; there is a dramatic increase in station density and data quality since the 1995 Kobe earthquake.
Summary of event metadata and numbers of recordings for the 10 considered earthquakes
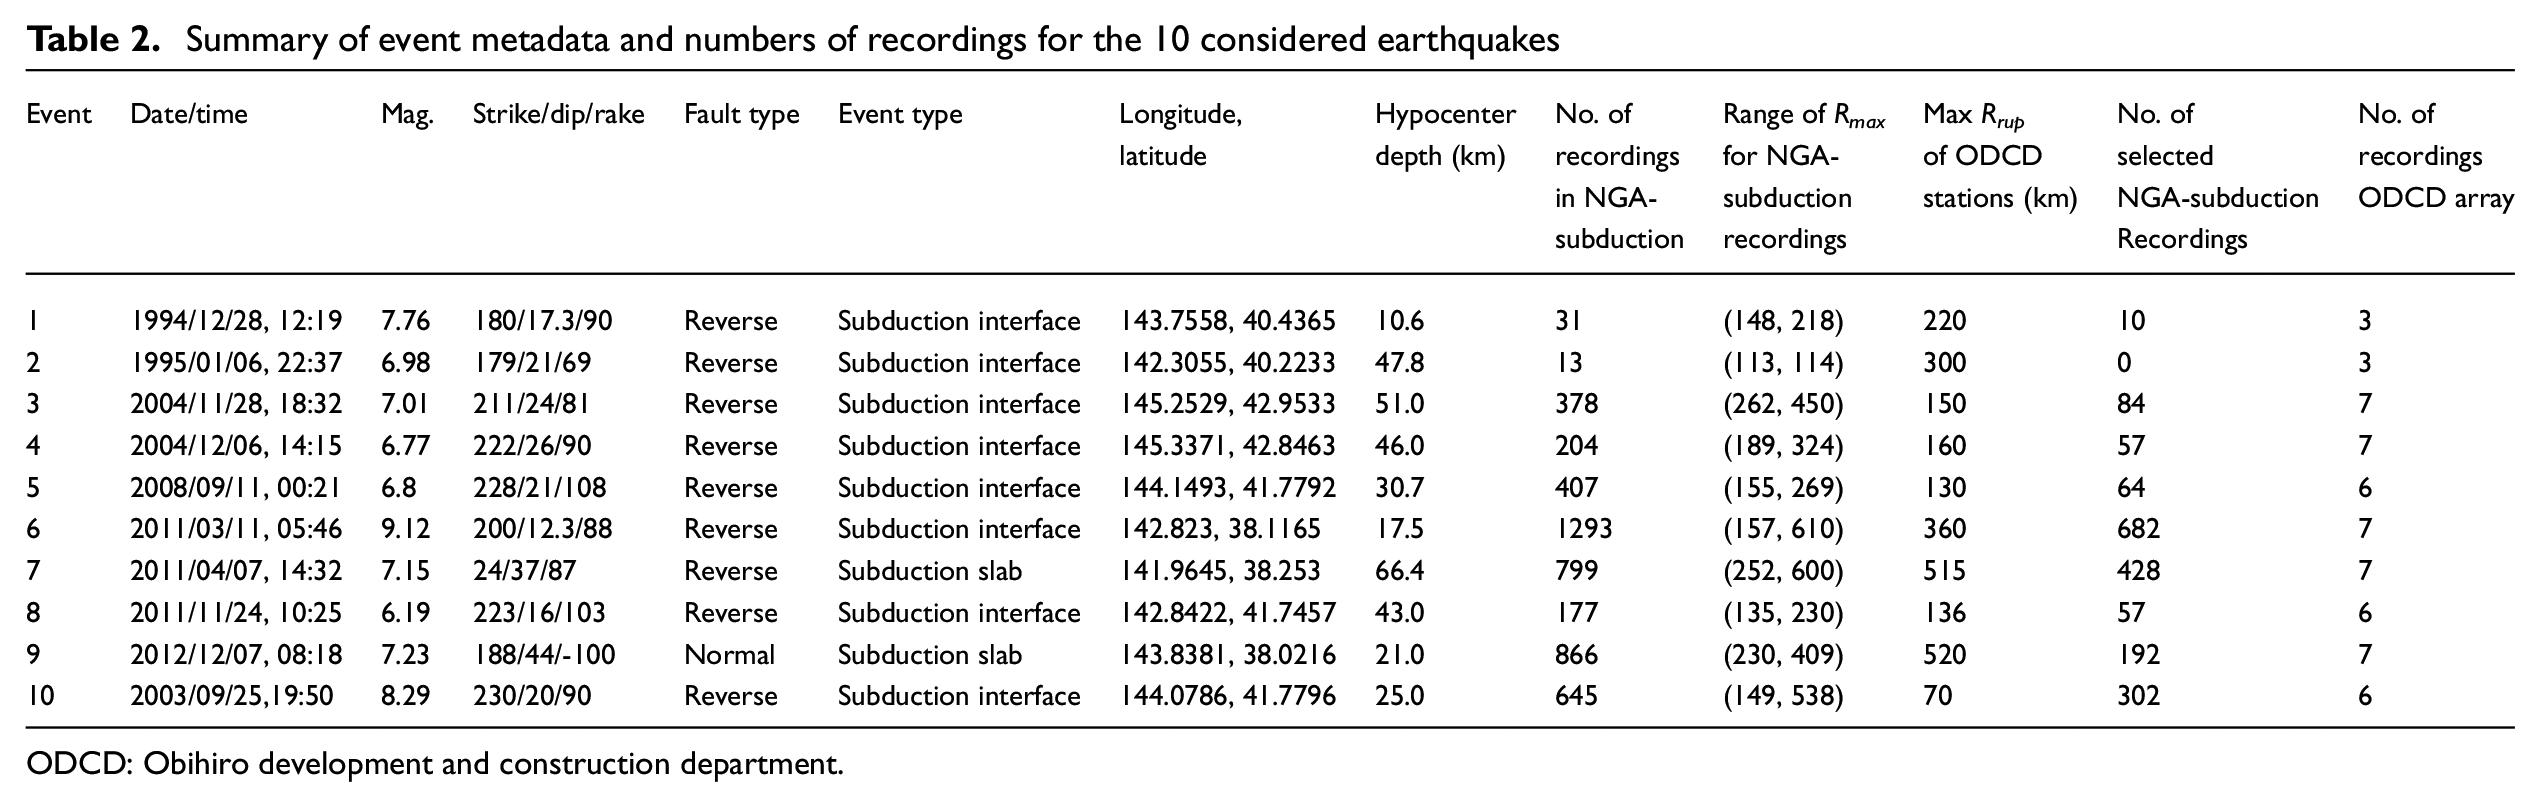
ODCD: Obihiro development and construction department.
We apply data screening for each event in which recordings beyond a limiting distance, Rmax, are removed owing to concerns of incomplete data sampling (i.e. an appreciable fraction of recordings may not appear in the data as a result of having amplitudes below the trigger/detection threshold). The NGA-subduction project developed Rmax criteria that depend on earthquake magnitude and instrument type (Contreras et al., 2022). When those criteria are applied to the 10 events considered in this study, the range of Rmax are as given in Table 2. As also shown in Table 2, the maximum rupture distance (Rrup) of ODCD stations is within or beyond the Rmax range for 6 of the 10 events, thus strict application of the NGA-Subduction criteria would severely restrict the dataset. Because those Rmax criteria are intentionally strict (conservative), they were relaxed for the present application to allow the inclusion of recordings having modestly larger distance than Rmax (by no more than 40%) when doing so extends the distance range for an event sufficiently to encompass Rrup for ODCD stations. Backarc stations are not used because the Obihiro sites of interest in this study are located in forearc regions, and our principal interest is source-site wave paths within the forearc region. Moreover, by excluding backarc stations, we also avoid complex backarc path effects (Ghofrani and Atkinson, 2011; Skarlatoudis and Papazachos, 2012; and Cramer and Jambo, 2020). Event 2 data were excluded in our analyses because of the 13 recordings in the NGA-subduction database, 11 do not meet either the weaker Rmax criteria or are backarc stations, and the remaining two have rupture distances much less than those for ODCD stations (113 km vs 300 km). Despite not using Event 2, we do not renumber other events (i.e. we use Events 1 and 3–10).
The NGA-subduction data for the 10 events did not include recordings at the ODCD stations. We were provided with raw (digital but unprocessed) recordings from the seven ODCD stations by T. Sato (last update 10 November 2017, personal communication). The data were processed following standard procedures as given in Kishida et al. (2020), which include instrument correction, application of both high- and low-pass acausal filters at operator-determined corner frequencies, and baseline correction of the processed signals. Following the application of this processing, we computed median-component intensity measures RotD50 (Boore, 2010) for peak acceleration, peak velocity, and 5% damped pseudo-spectral accelerations (PSA) using the R package by Wang et al. (2017).
As shown in Figure 3, Events 1–9 produced relatively weak motion recordings at the ODCD stations, which are useful for developing the linear component of a regional site amplification model. In contrast, Event 10 (2003 Tokachi-Oki Earthquake) produces appreciably stronger shaking. Accordingly, our approach for model development is to develop a linear model using data from Events 1–9, and then to perform residuals analysis using data from Event 10 to investigate potential nonlinearity effects.
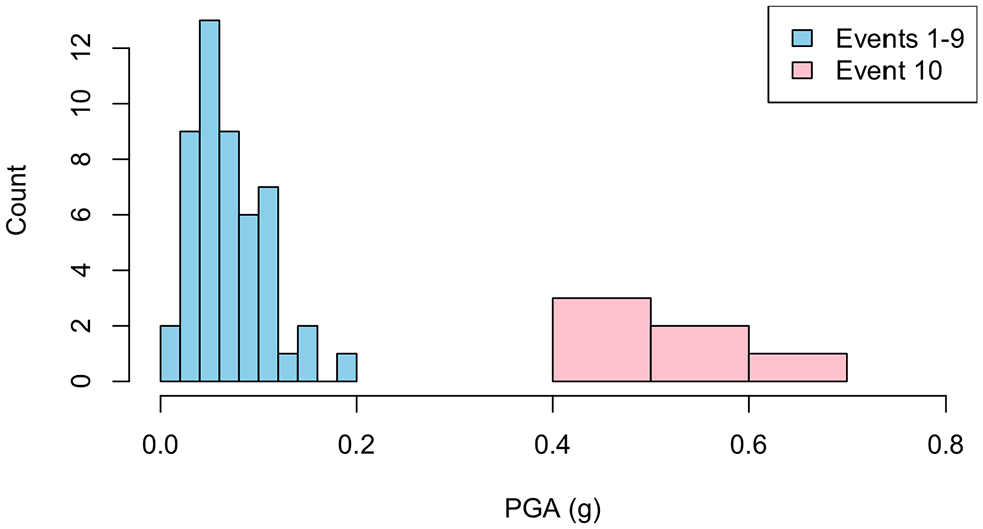
Histogram of median-component peak accelerations at ODCD sites.
Site conditions
Each of the seven ODCD sites in the study region is underlain by peaty organic soils in the Tokachi River basin (Hokkaido River Disaster Prevention Research Center (HRDPRC), 2004; Tsai, 2018). The geomorphic terrain class for six of the seven sites per the Japanese Engineering Geomorphologic Classification scheme (Wakamatsu and Matsuoka, 2013) is “back marsh” (the seventh, in the furthest downstream area, is “delta and coastal lowland”). Based on boring logs at strong motion accelerograph sites and other areas from HRDPRC (2004), summarized and translated to English by Tsai (2018), the peaty organic soils extend to depths of 2–6 m, and are underlain by alluvial deposits of sandy, silty and clayey sediments. Under the levees, the peat layer is typically 0.5–1.0 m thinner. One typical geotechnical and VS profile at a site adjacent to the Tabikorai ODCD station is shown in Figure 4. The classification of materials as peats in these logs is based on visual assessments and/or lab tests for organic content. Penetration resistance measured during cone penetration tests and standard penetration tests, as well as shear wave velocities, are low in the area. Relatively firm material, likely Pleistocene in age, is located at greater depths generally around 35–40 m. Because the peaty organic soils are of modest thickness at the ODCD sites, the wave propagation path through the sediments occurs mainly in non-peat materials. As such, while the site response evaluated from these sites may be only modestly impacted by the peaty soils themselves, it is controlled by the depositional environment of the region, which produced surficial peats and low seismic velocities. The site class as given by Zhao et al. (2016b) is mainly IV (Table 1), which is described as soft soils with VS30 < 200 m/s and site period T ≥ 0.6 s. The site class for US codes (Building Seismic Safety Council (BSSC), 2020) would be F for most of the study region, based on peat thickness >3 m.
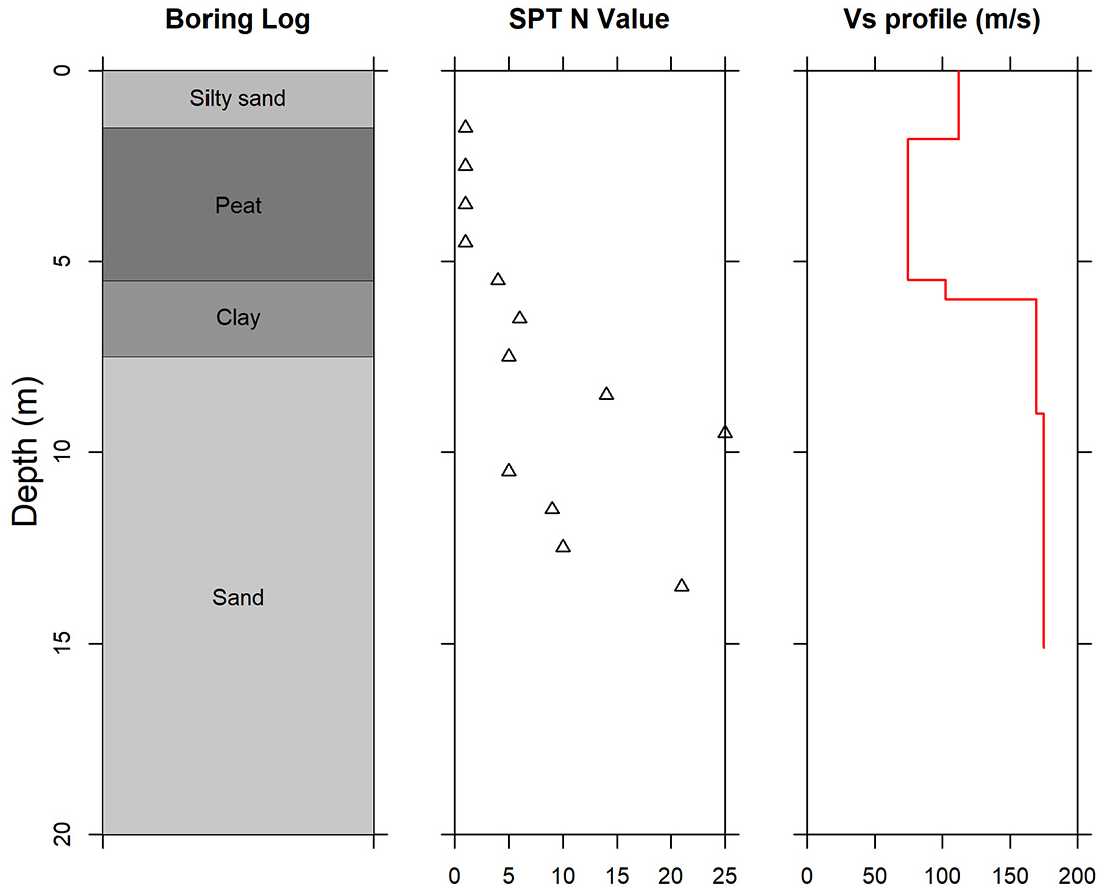
Geologic log at a site adjacent to Tabikorai ODCD station.
We performed geophysical testing at or in the vicinity of the Toitokki, Horooka, Tabikorai, Reisakubtsu, and Ushishubetsu stations using spectral analysis of surface wave (SASW) and ambient noise techniques (full results in Tsai, 2018). Rayleigh wave dispersion curves and horizontal-to-vertical spectral ratio versus frequency plots (HVSR plots) were obtained from these tests. The dispersion curves are provided in Electronic Supplement Figure S1 in the Appendix and the HVSR plots are provided in Figure 5. We use Geopsy (Wathelet et al., 2020) and a joint inversion approach (García-Jerez et al., 2016; Griffiths et al., 2016), which fits the lowest-frequency peak of the Raleigh wave ellipticity curve to the peak of HVSR, to derive the VS profiles and calculate VS30 for the five sites.
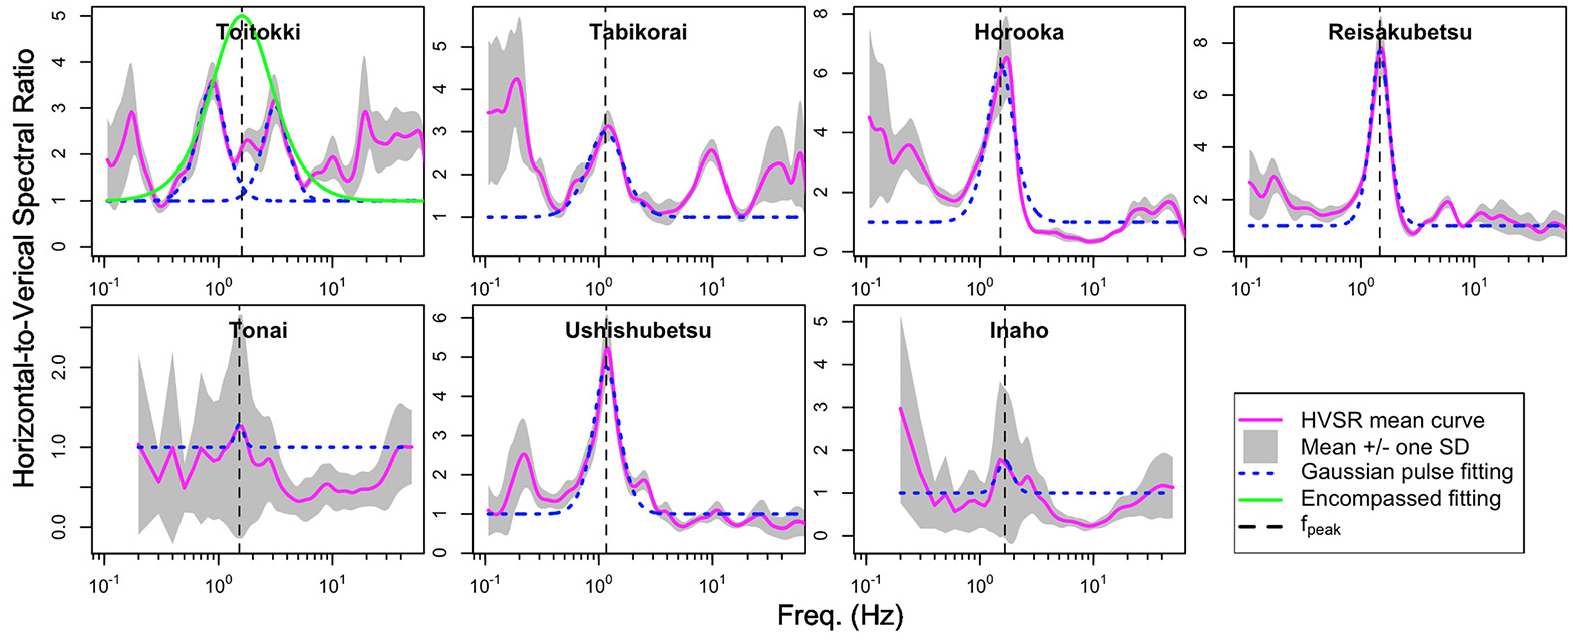
HVSR versus frequency plots for ODCD sites as established from microtremor or pre-event noise data, and fitted pulse with identified peak frequencies.
Sites Tonai and Inaho were not part of the site exploration program. For these sites, HVSR plots were developed using pre-event noise signals by first estimating the p-wave arrival time, and then taking preceding portions of the signals for use in analysis. Prior comparisons of HVSR from ground motion recording stations (using time intervals without earthquake shaking) and temporarily deployed sensors (as used in site characterization) have shown similar results (Wang et al., 2021), which supports the use of non-seismic signals for the Tonai and Inaho sites. VS30 values were estimated from a geomorphology and slope proxy-based model (Wakamatsu and Matsuoka, 2013).
The HVSR data was processed as described in Wang et al. (2022), which is revised somewhat from earlier protocols in Site Effects Assessment Using Ambient Excitations (SESAME, 2004). These procedures involve windowing and low-cut filtering the data, removing windows with anomalous features, smoothing the resulting spectral ratios, and plotting the data for the selected windows along with the arithmetic mean and mean ± one standard deviation.
Figure 5 plots HVSR versus frequency for the seven Obihiro stations. Gaussian pulses were fitted to prominent peaks in the HVSR (Ghofrani and Atkinson, 2014; Kwak et al., 2017) and the resulting
Ground motion data analysis
This section presents our analyses of ground motion recordings to support model development. We first describe the analysis of residuals and the main data trends. Next we evaluate event-specific biases and regional (between-island) complexities in path. The intent of those analyses is to provide region-adjusted, within-event residuals for each event and recording at the seven ODCD sites. Finally, we evaluate non-ergodic site responses for each site.
Residuals analysis and trends
Our approach to data analysis operates on residuals, which are the difference between the natural log of an observation and its prediction from a GMM. “Observation” in this case is a computed RotD50 intensity measure from a ground motion recording. As shown in Table 2, we consider all recordings that meet data selection criteria (not just those in the study region). The GMMs applied in these analyses are Zea16, which is specifically intended for use with Japan subduction earthquakes, Aea18 applied with Japan-regionalized path correction terms, and the Pea22 NGA-Subduction ground motion model. The three GMMs are used to investigate sensitivity of derived site terms to the alternate reference GMMs. The maximum rupture distances recommended for use are 300 km for Zea16 and Aea18 and 1000 km for Pea22. We consider data at distances beyond 300 km, although measures are taken (limiting the maximum distances for event terms, using only forearc stations, and adjusting models for between-island effects) to minimize path biases at larger distances.
Total residuals are computed using the reference GMMs as

where Yij is an observed RotD50 intensity measure for site j from event i, and
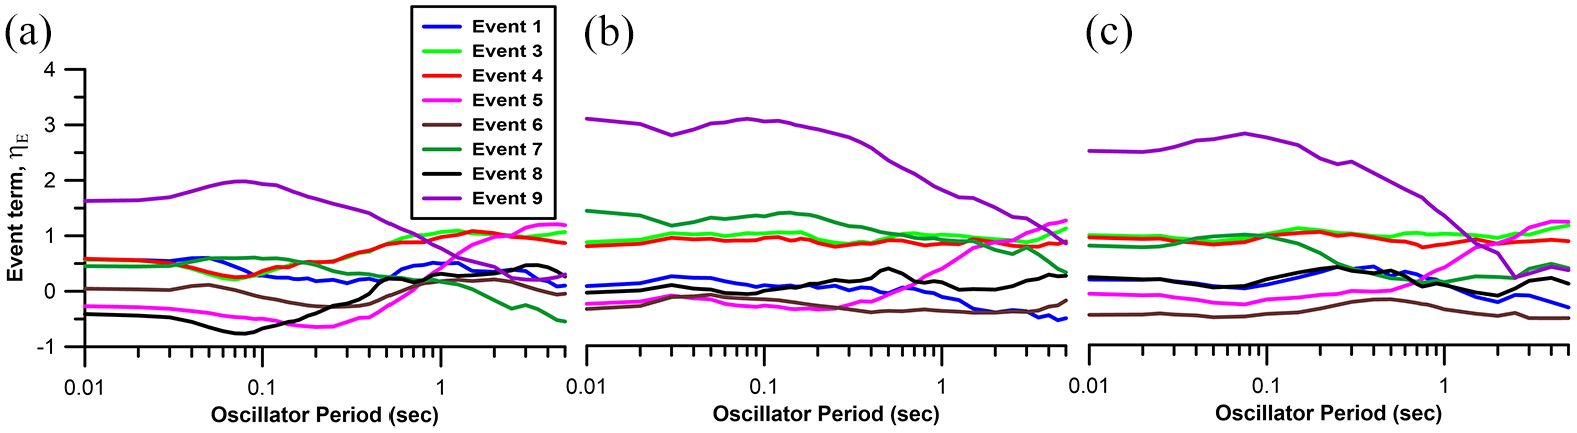
Figure 6 plots total residuals vs distance for four events and at four oscillator periods (0.005, 0.08, 0.8, and 5.0 s) from the Pea22 GMM (qualitatively similar results are obtained for other events and from the Aea18 and Zea16 GMMs; results provided in Electronic Supplement A Figure S2). The figure is organized by event location; Part (a) applies to events off the coast of Hokkaido, Part (b) to Honshu. Important attributes of the data to consider in Figure 6 are (1) the slope of the data relative to distance and (2) offsets in residuals between islands or different attenuation rates for ground motions recorded on the two islands. Based on Figure 6 and Electronic Supplemental A Figure S2, we find the following:
A flat slope of residuals for a particular island indicates an unbiased GMM path term, whereas a gradient indicates path term bias. Events 6 and 7 exhibit downward gradients in short-period (0.005 and 0.08 s) residuals from recordings on the event-adjacent island. Events 3 and 4 lack gradient features for most periods, with the exception of upward gradients at 0.8 s. for Hokkaido stations. The gradients observed in Figure 6 are mainly associated with large-distance attenuation. Data for other events (Electronic Supplemental A Figure S2) lack gradient features.
The data show diverging trends for Hokkaido and Honshu stations beyond about 300 km for events recorded on both islands (Events 3, 4, 6, and 7). This suggests the presence of between-island regional attenuation effects not captured by the GMMs.
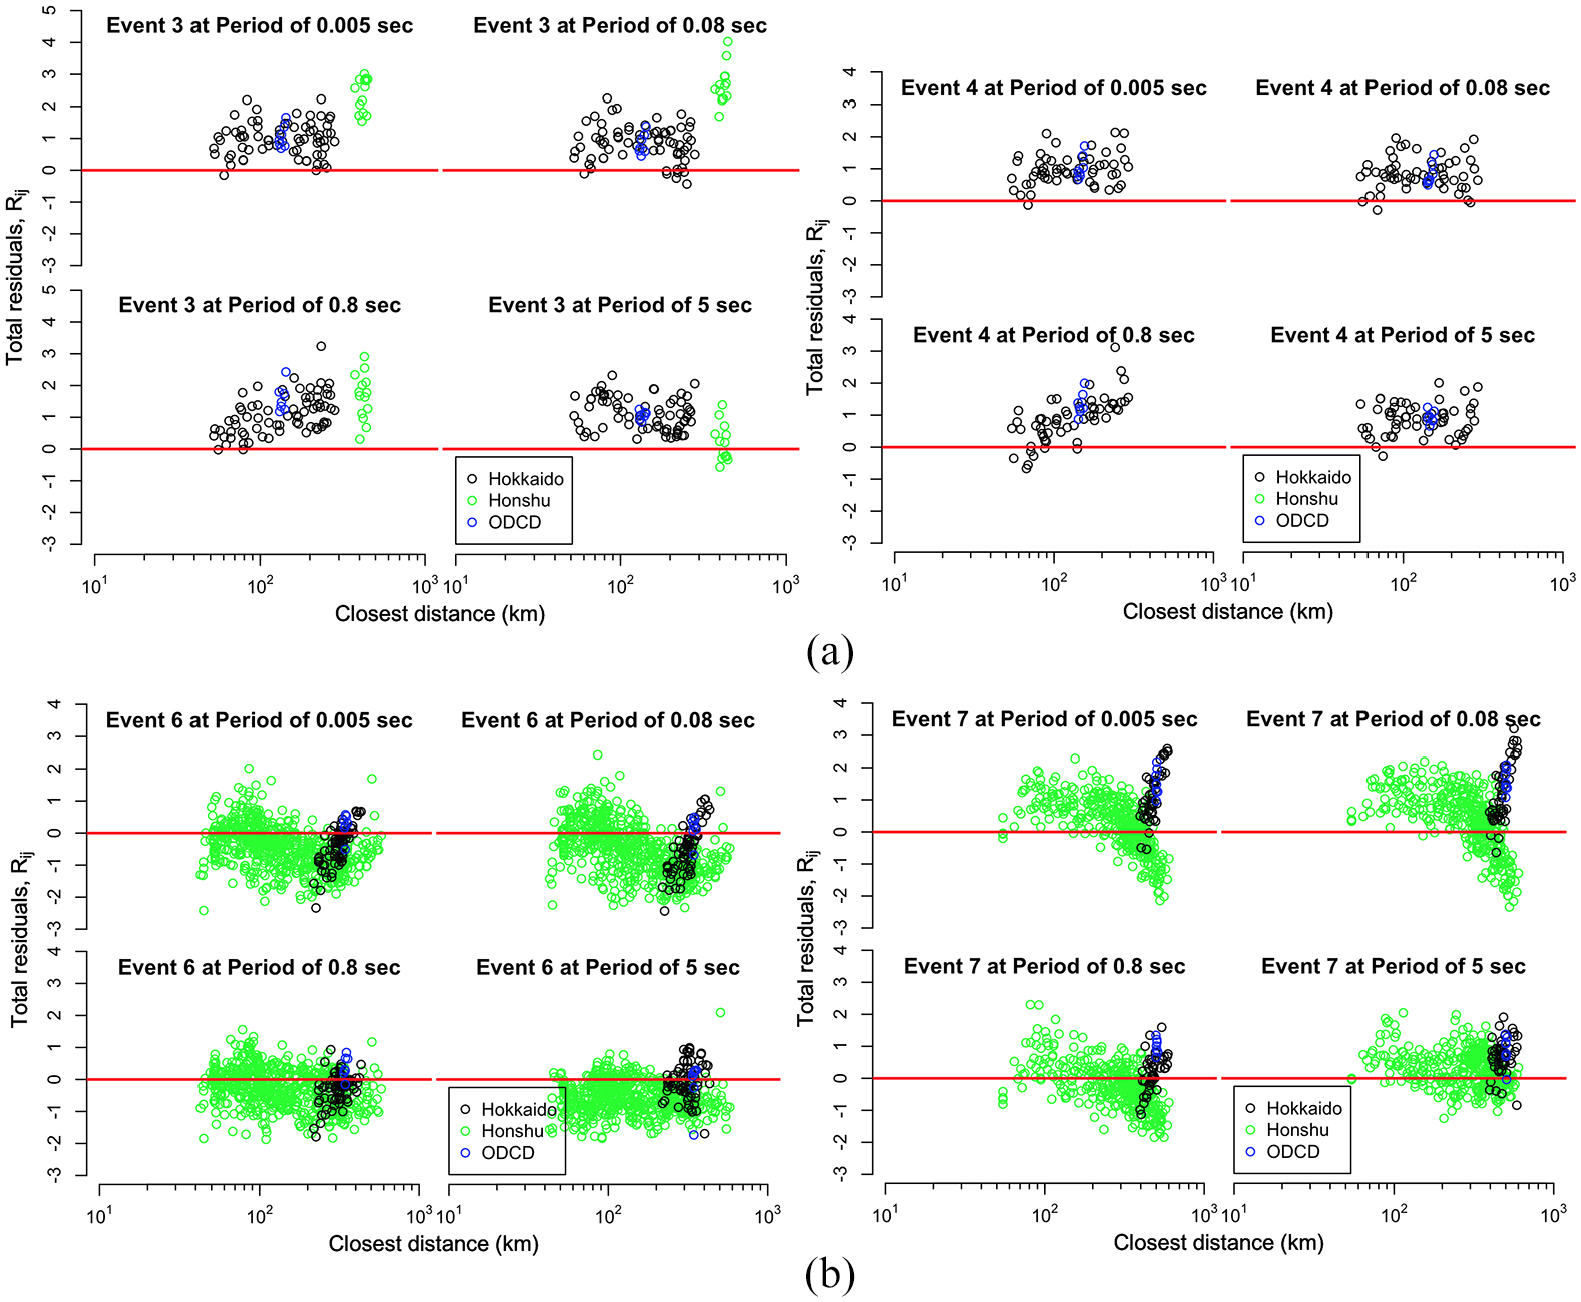
Variation of Pea22 total residuals with distance for four events at periods 0.005, 0.08, 0.8, and 5 s: (a) events off coast of Hokkaido and (b) events off coast of Honshu.
These issues motivated the application of distance limits for the analysis of event terms, as described in the following section.
Event terms
The vertical offset from zero of the total residuals in Figure 6 is an event attribute referred to as an event term. Event terms are computed during GMM development when mixed effects regression methods are applied (Bates et al., 2015). Event terms computed in this manner reflect model-to-data misfits resulting from all model components, but mainly the source and path components. For the present application, we require an event term estimate that reflects source model misfit to the extent practical, because path errors are addressed separately. For this reason, we do not use directly the event terms from Pea22, but instead take the event term for a given event i as the average of the residuals
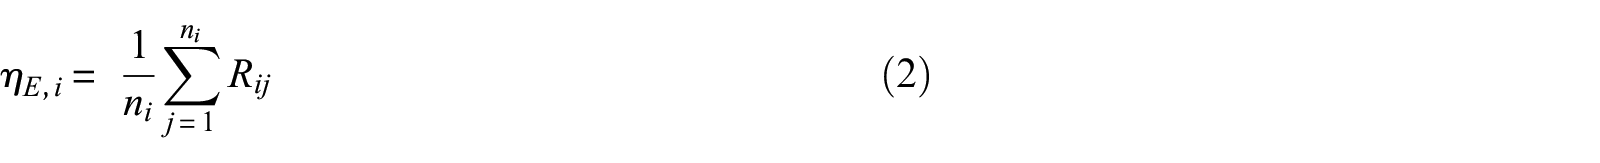
where
As described in the previous section, several events exhibit gradients in total residuals with distance, indicating problems with the GMM path model. To avoid mapping path errors into event terms, we limit the maximum considered distances for the calculation of event terms with Equation 2. From examination of Figures 6 and S2 in the Electronic Supplement, considering results from all three GMMs, we used maximum distances of 200 km (Events 3 and 4) and 300 km (Events 6 and 7). Within these distances, residuals for event-adjacent islands are reasonably flat in most cases. For the other considered events where residual gradients did not occur, no data screening was applied beyond that used for all data, which involves (1) removal of stations in the backarc and (2) removal of stations with
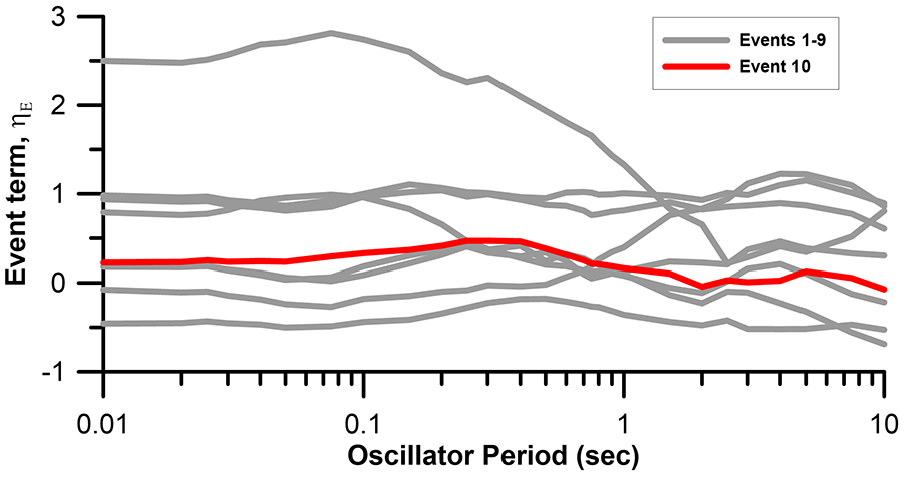
Event terms obtained from Equation 2 are shown in Figure 7. Positive and negative event terms indicate under- and overprediction, respectively, and both conditions are encountered. The event terms for Event 9 are very large—values above 1.5 for periods less than about 0.3 s.
Event terms (PSA) for the eight events recorded in the ODCD array from (a) Zea16 GMM, (b) Aea18 GMM, and (c) Pea22 GMM.
Regional (between-island) terms
Japan is known to have strong regional variations in anelastic attenuation (e.g. Ghofrani and Atkinson, 2011). These effects, if not included in a GMM, can introduce large differences in residuals for recordings on opposite sides of the volcanic front (i.e. forearc vs backarc sites), and potentially for recordings on different islands. The effects of paths crossing the volcanic front were addressed in our analysis by screening out backarc data. Additional regional complexities in the forearc, where encountered (Events 3, 4, and 7) were addressed with application of distance cutoffs. The remaining issue considered here is potential effects of source-to-site paths passing between islands, specifically Honshu to Hokkaido and vice versa. To investigate this, we first compute within-event residuals as

Next, we plot
Event-corrected within-event residuals for eight events, separated by region, derived using Pea22 GMM.
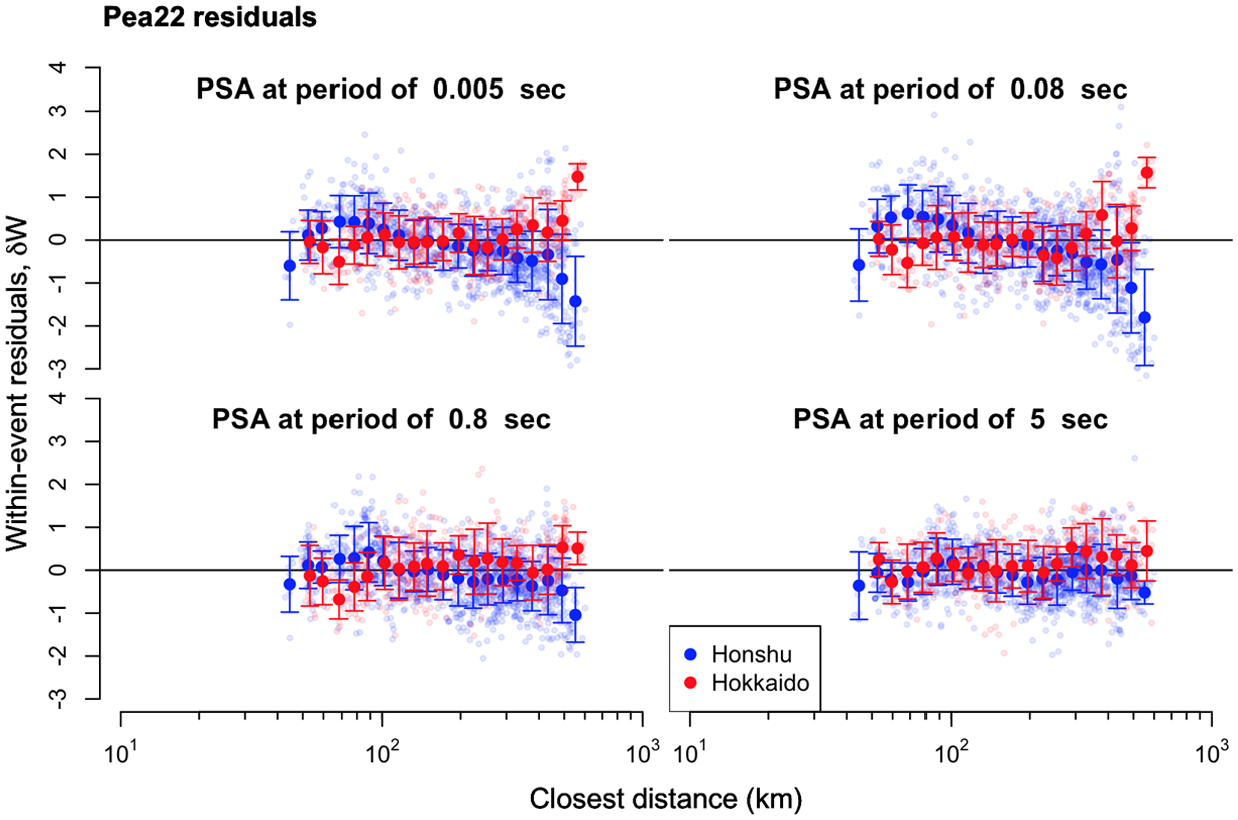
Region terms are computed for each combination of event and station regions as the average of within-event residuals

where the ∀ symbol in combination with ∈ (e.g.
Region terms for Hokkaido and Honshu stations from South and North regional events, as derived from (a) Zea16 GMM, (b) Aea18 GMM, and (c) Pea22 GMM.
The results in Figure 9 show that for common source-station regions, such as South events and Honshu stations (index
To incorporate the between-island regional terms into residuals analyses, we adjust the within-event residuals from Equation 4 as follows

where
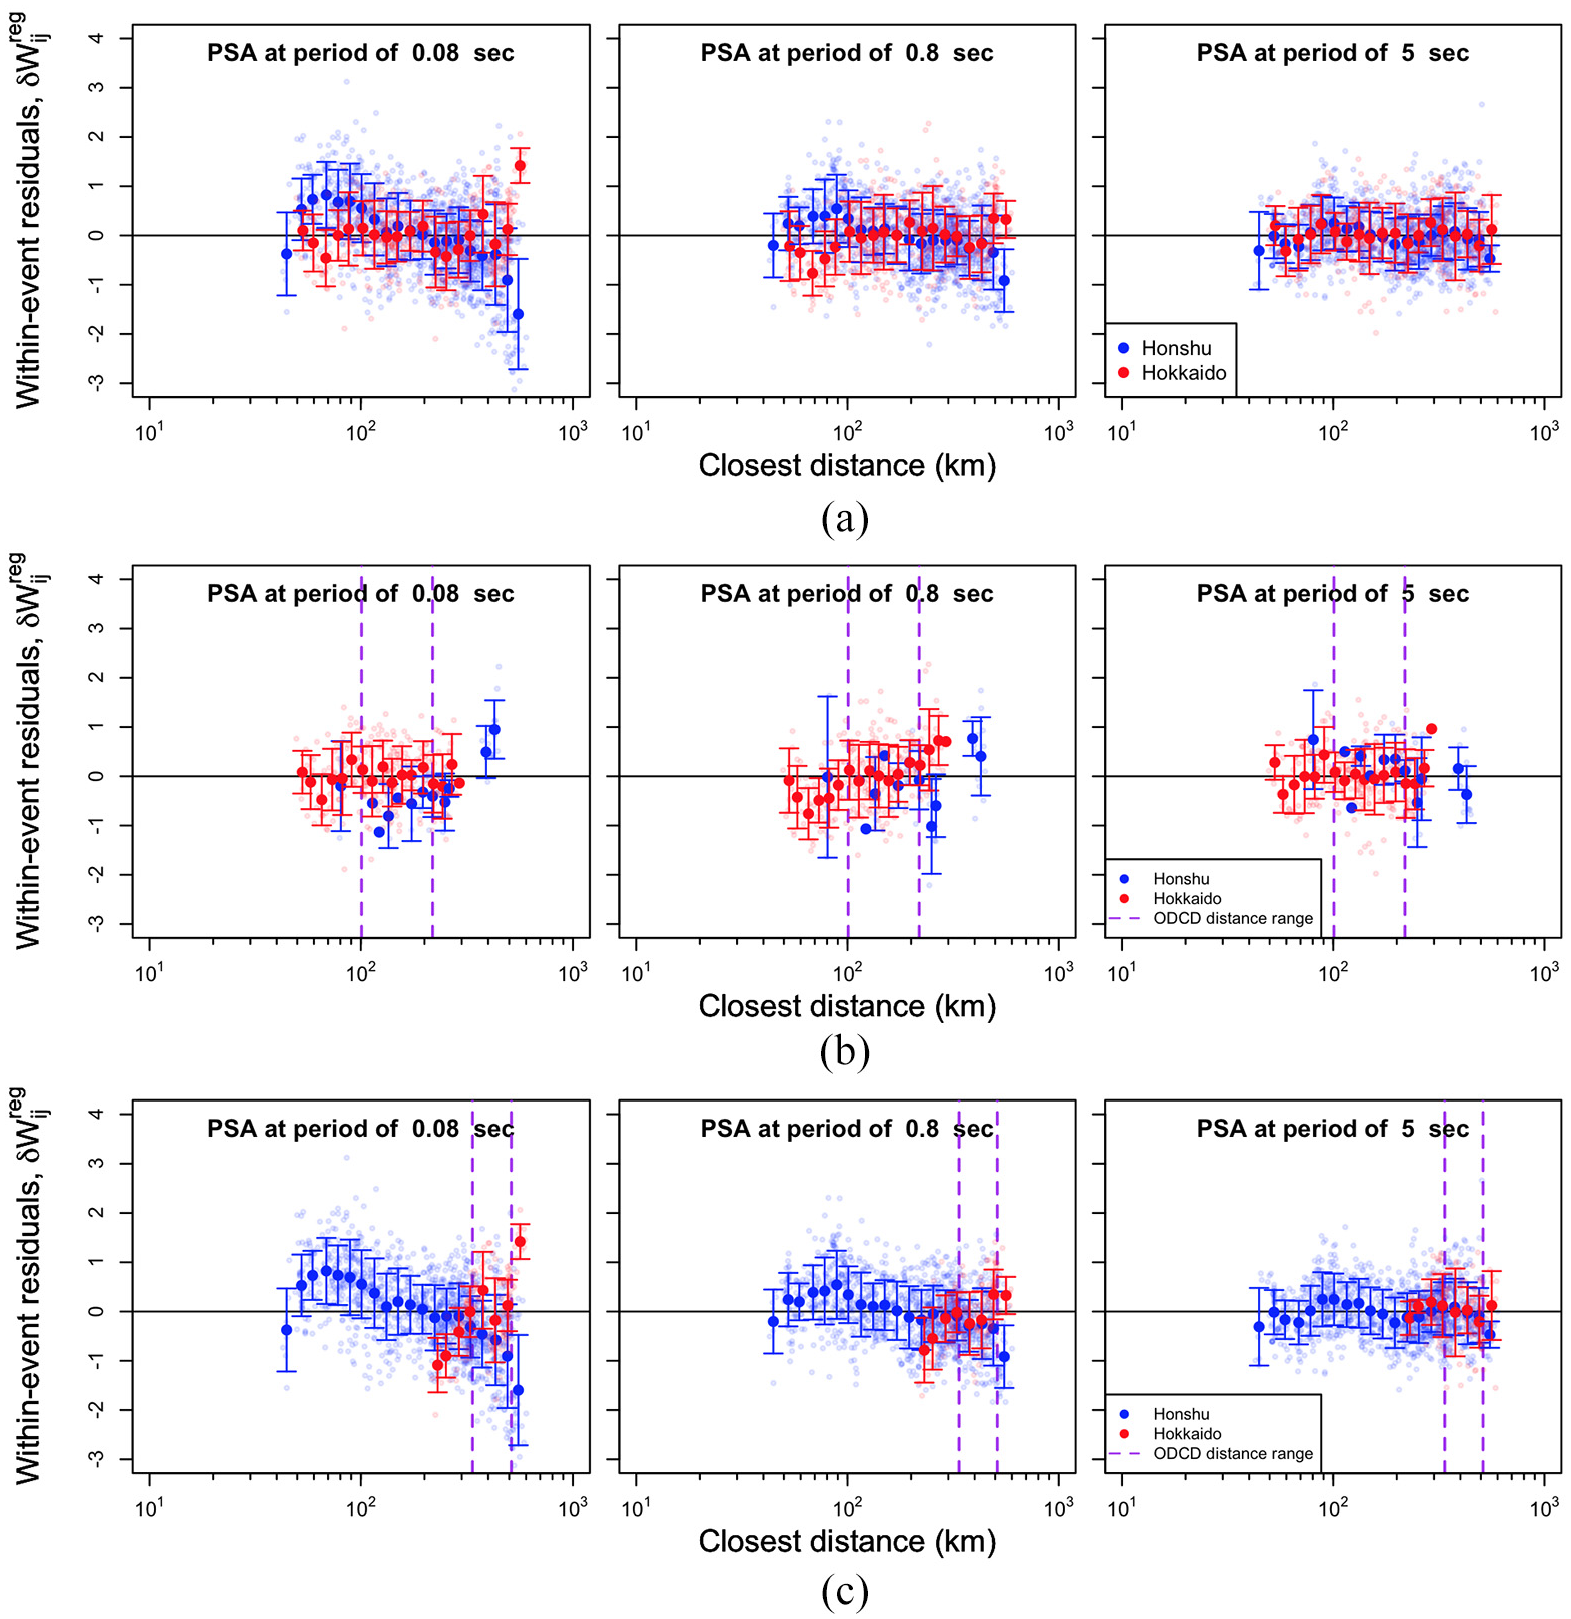
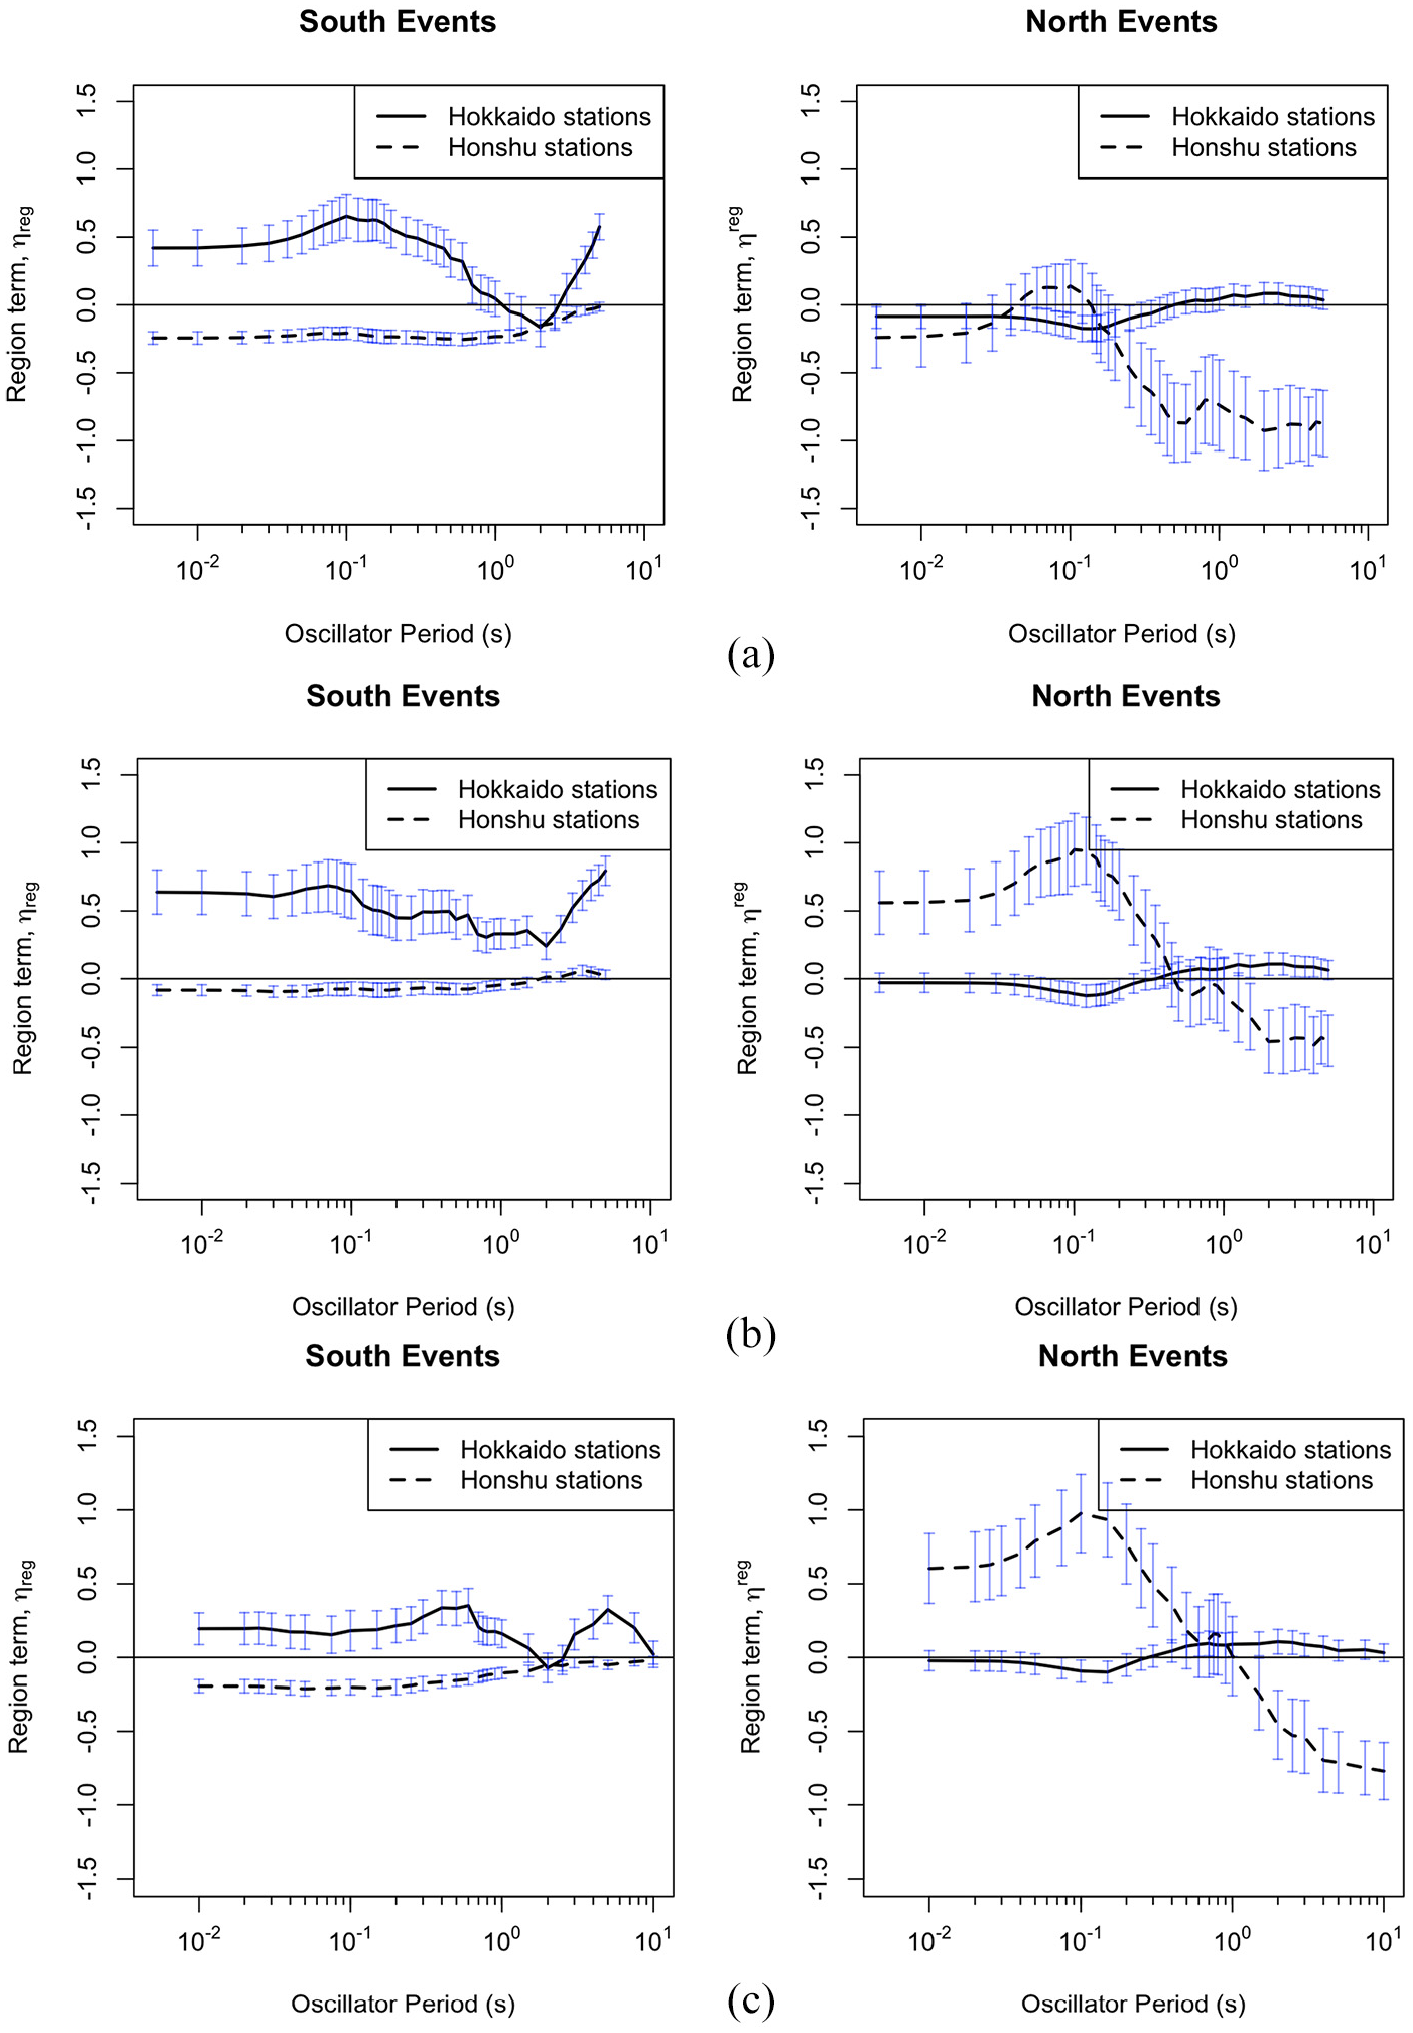
Trend of Pea22 region-corrected within-event residuals with closest distance at periods of 0.08, 0.8, and 5 s for (a) all data, (b) North events only, and (c) South events only. Distance range of ODCD stations marked. Similar results for Aea18 and Zea16 GMM appear in the electronic supplement.
The results in Figure 10a can be compared with those in Figure 8 to see the effect of the regional terms on residuals trends—those trends are slightly reduced but not eliminated. While the residual trends for North events are generally flat (Figure 10b), the much better-recorded South events produce mixed results (Figure 10c). The Pea22 residuals are reasonably flat for Hokkaido stations in the distance range of interest. The Aea18 GMMs (Electronic Supplement A Figure S4c) produces an upward trend for some periods (0.08 s) and a trends for other periods that is generally flat within the distance range, but trends upward at the upper limit of the range (approximate 500 km or greater). To address this, we apply a 450-km cutoff to the Aea18 model for the case of South events and Hokkaido recordings. No further adjustments to the three path models are applied for the analysis of site terms.
Site terms
By adjusting residuals for event biases,
where
The site response model assumed to apply for a given intensity measure at a given site is taken as (Stewart et al., 2017)

where FS is site amplification in natural log units,
The site term in Equation 6 represents the misfit between the observed site response and the site response predicted by the ergodic model in the GMM. If the observations are primarily from weak ground motions that do not introduce a significant nonlinear response, the only site response coefficient from Equation 7 that can be evaluated empirically is f1, which is taken as

where
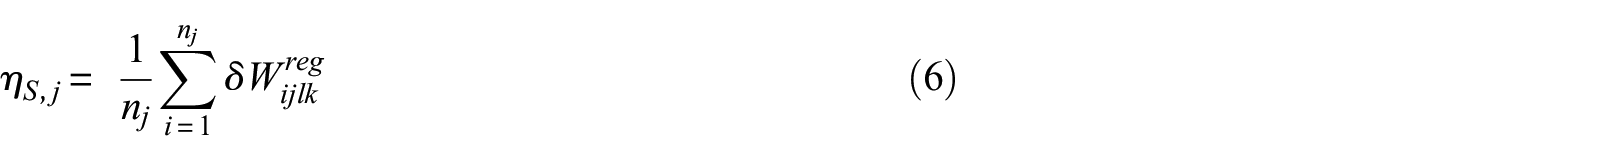
Figure 11 shows for each of the seven sites the region-adjusted within-event residuals
Region-adjusted within-event residuals (a) and estimated site responses (b) for the seven Obihiro stations as derived from Pea22 GMM. Similar results obtained for other GMMs as shown in the electronic supplement (a) δWreg and (b) linear amplification.
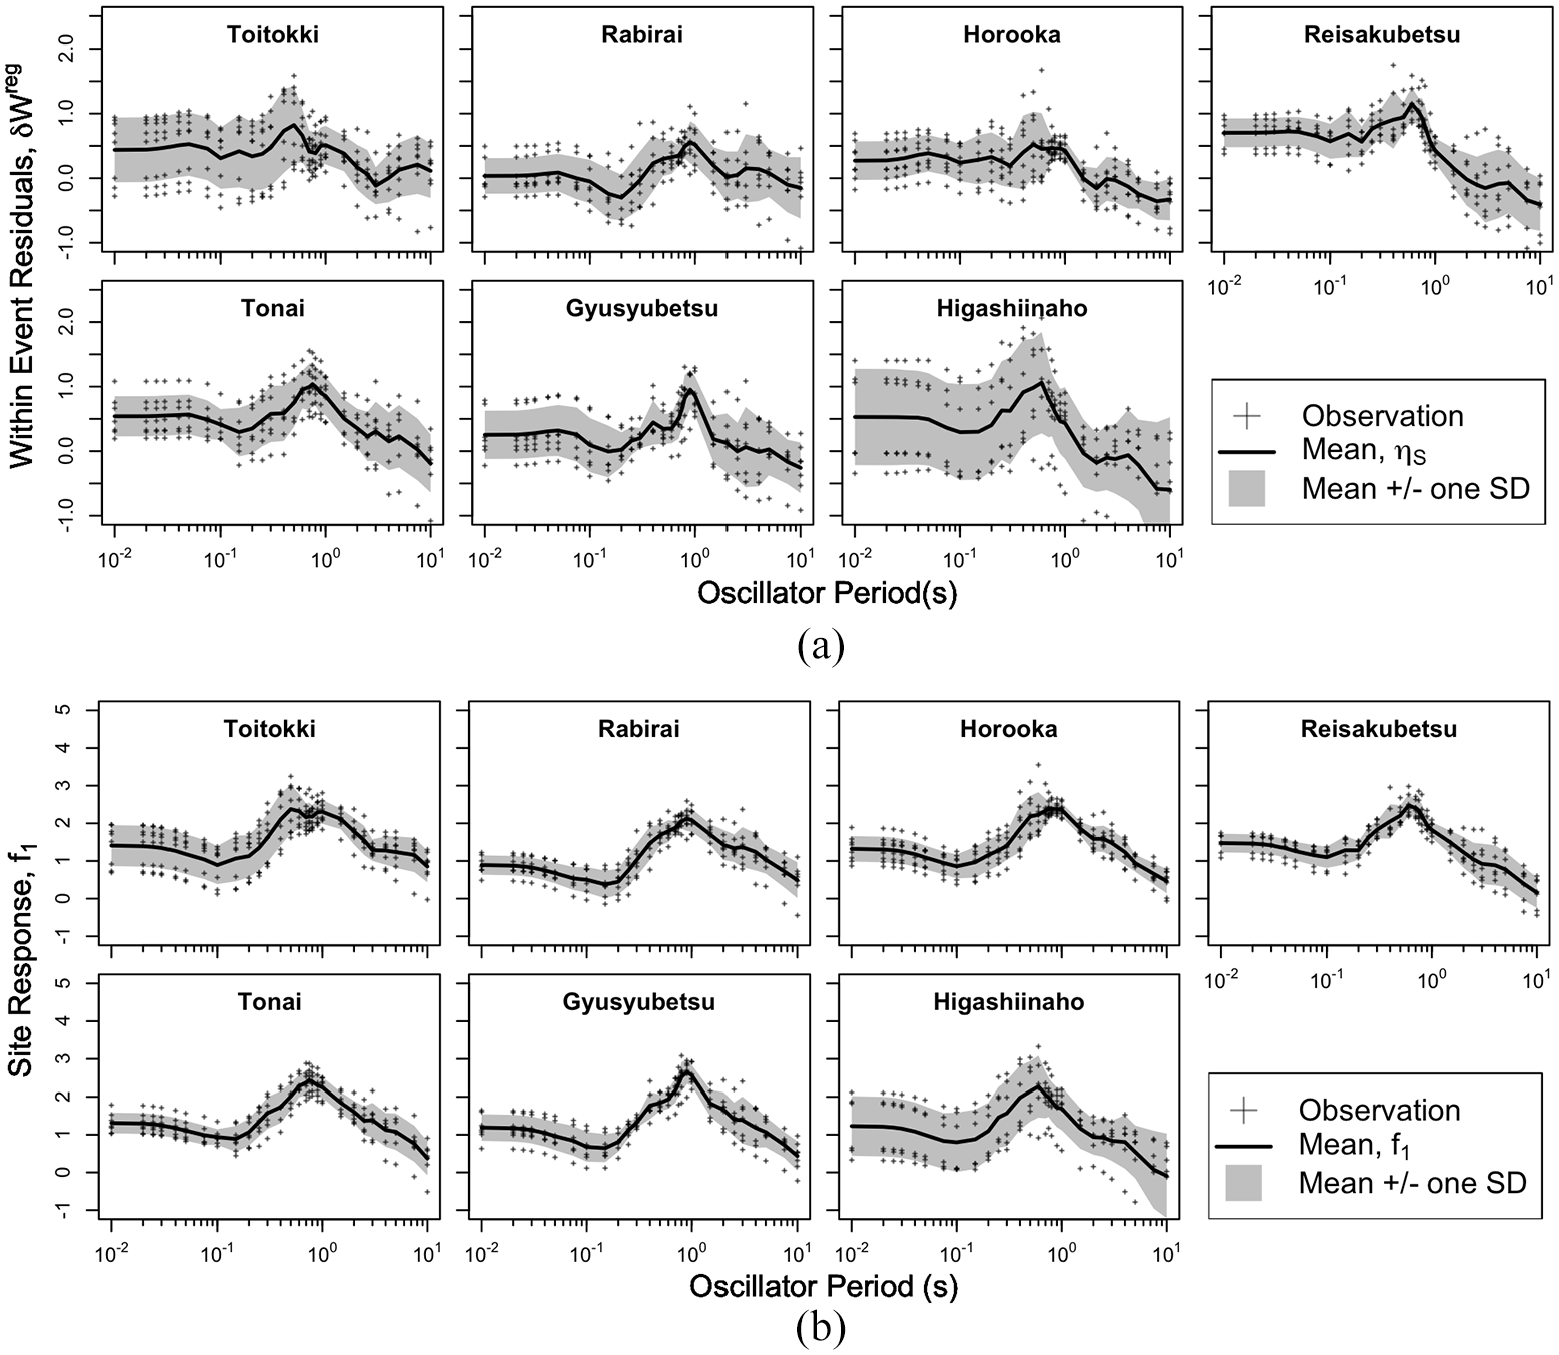
Figure 12 compares linear site response terms (
Comparison of site-specific linear site responses as derived using the Zea16, Aea18, and Pea22 GMMs.
Site amplification model development
We develop a site amplification function that takes site frequency as derived from microtremor-based HVSR (
Site parameters
Because the very soft sites (with peaty organic soils and clays) in the study region exhibit site amplification effects suggestive of a resonant ground response effect at a site frequency, we sought to use HVSR to estimate the frequency of the peak response (
Mean amplification
In order to capture the peaked shape of site amplification observed at the ODCD sites, we selected a Mexican hat wavelet function (adapted from Ricker Wavelet function; Ryan, 1994). This function is intended to capture site resonance effects that dominate amplification shapes at short to intermediate periods (T < 2 s). A linear decay function is used at longer periods (T > 2 s). The recommended site amplification function for linear conditions is as follows
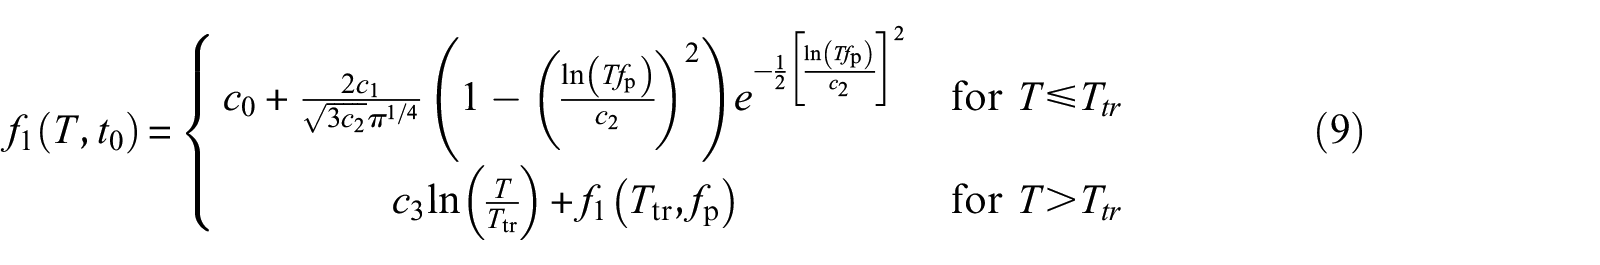
where c0 controls the overall level of site amplification, c1 scales the amplitude of the hat function, c2 describes the width of the PSA peak in natural log period space, Ttr = 2 s is the transition period between the Mexican hat and linear functions, and c3 describes the linear decay of amplification with log period beyond Ttr. Frequency
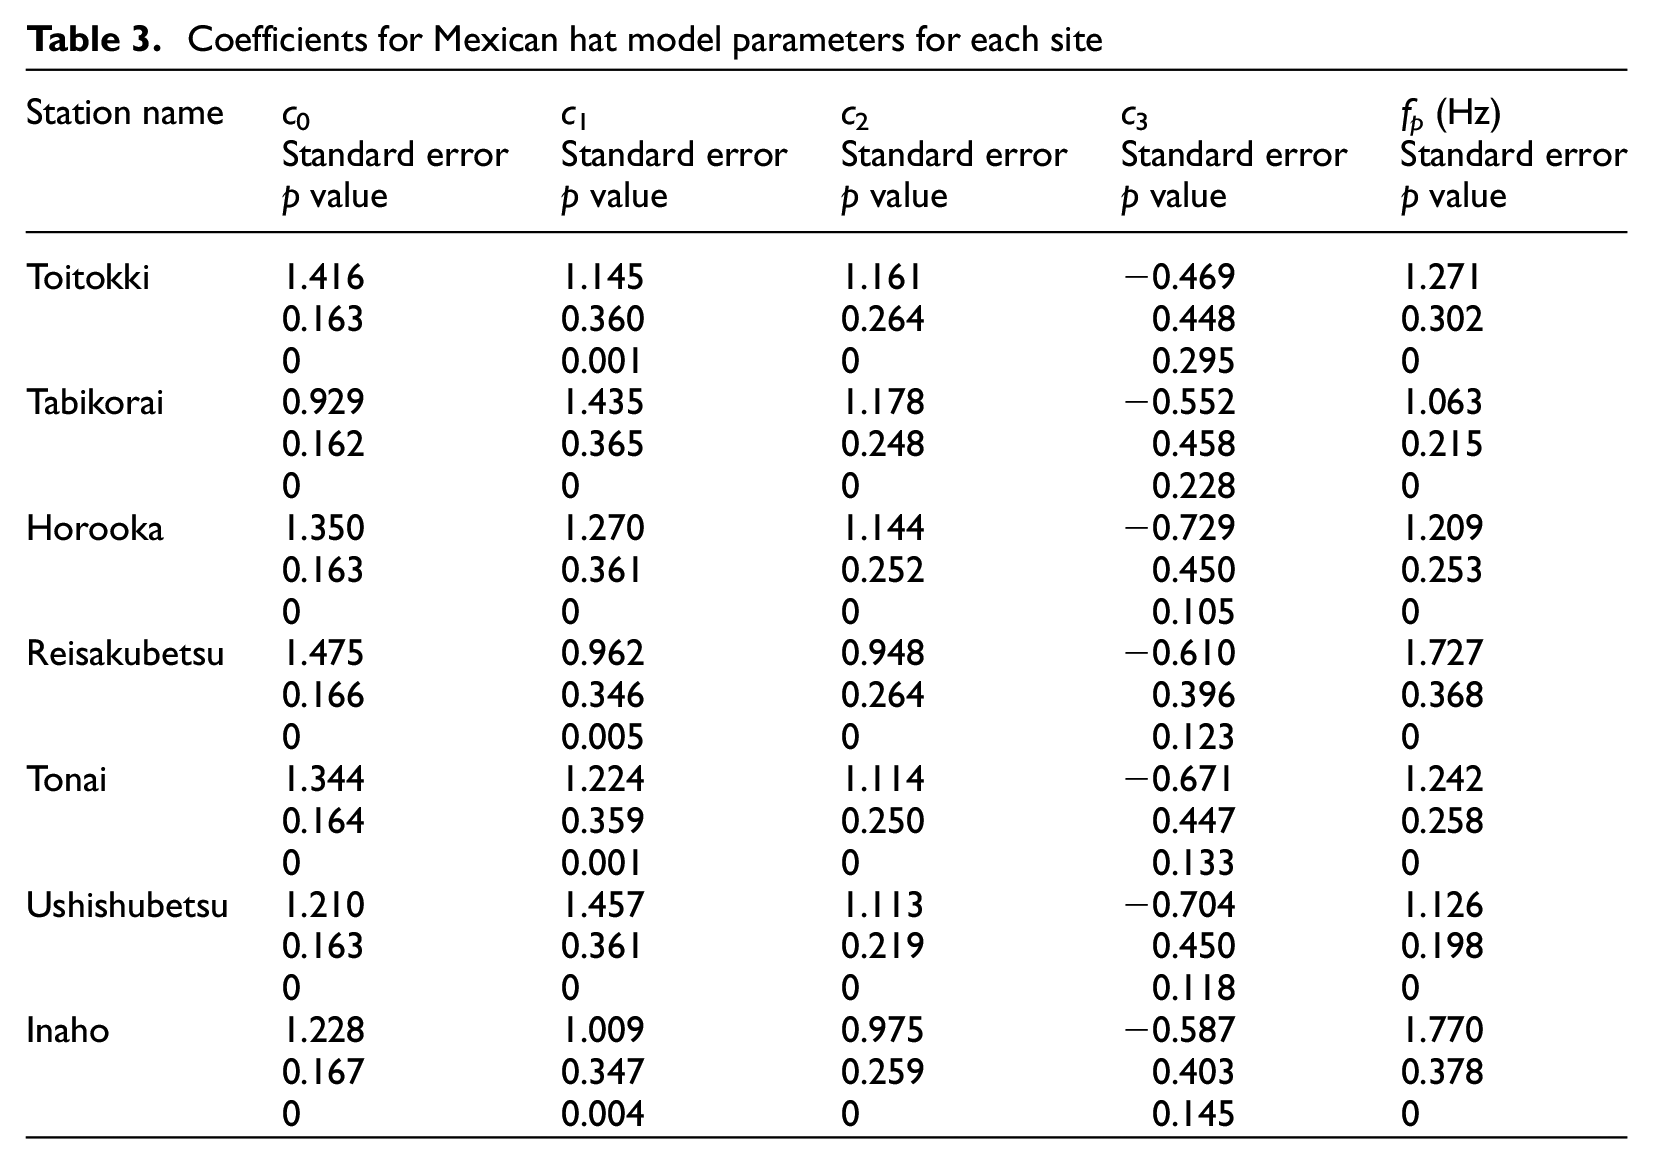
We performed a least squares fit of Equation 9 to the observed amplification for each of the seven sites, with the results in Figure 13 and Table 3. Potential realizations of the coefficients are assumed to be normally distributed; p-values in Table 3 are estimated using estimated mean values and standard errors. The p values indicate that all coefficients are statistically significant except for
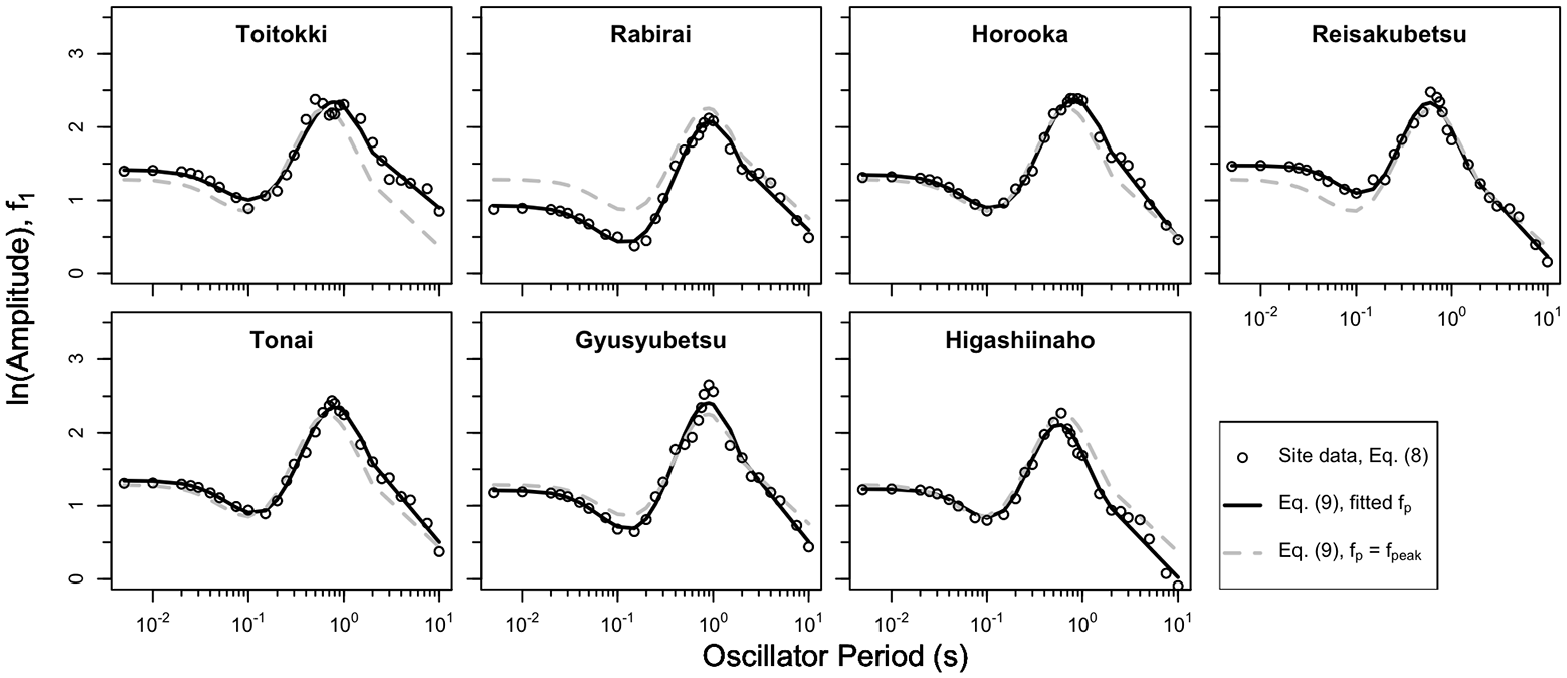
Fit of model to observed amplification when model coefficients are taken from site-specific optimization.
Coefficients for Mexican hat model parameters for each site
To develop the model for sites other than the seven stations in the study region, we examined the relationship between
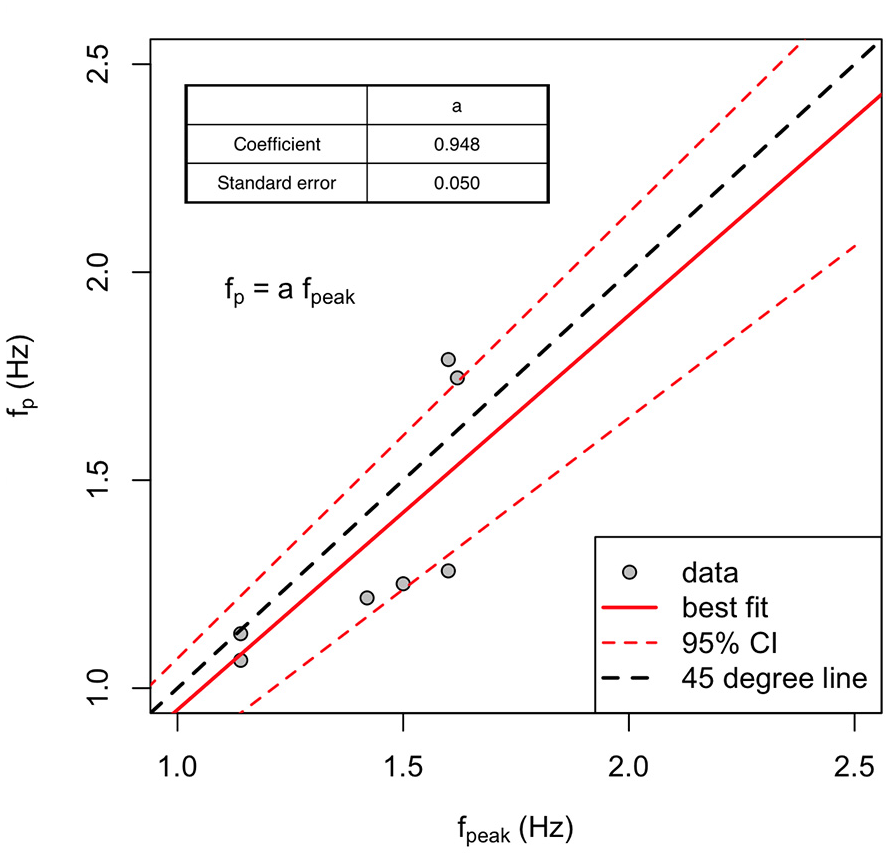
Relationship between HVSR peak frequency (
Coefficients for Mexican hat model parameters
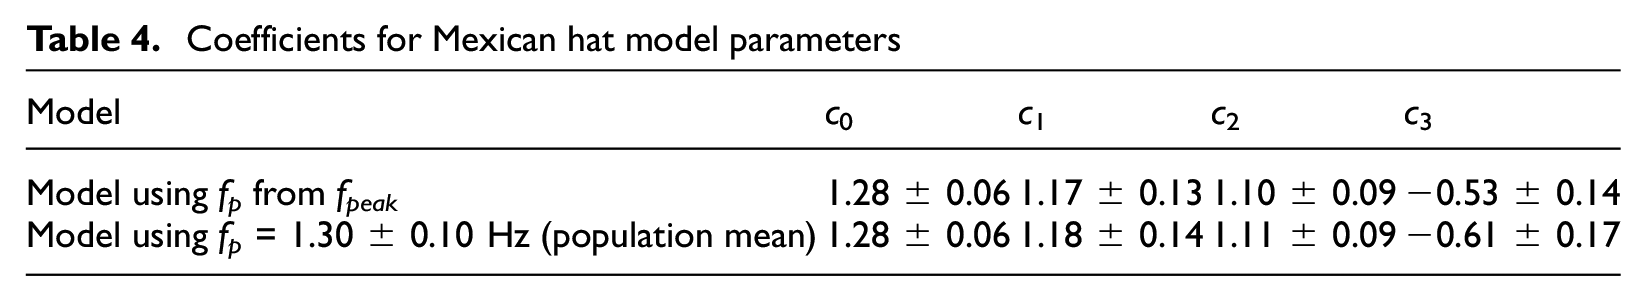
We also develop a model for the case in which
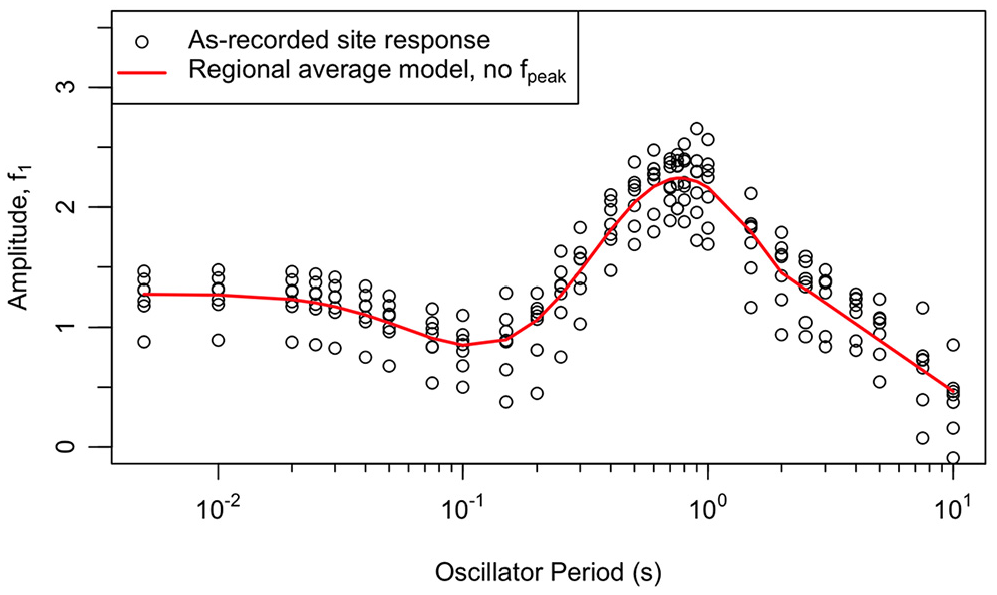
Fit of model to observed amplification when model coefficients are taken from regional average model.
Aleatory variability model and model bias
The standard deviation terms to use with the proposed site amplification model are

where
These standard deviations are shown in Figure 16 for both the model employing regional average parameters and site-specific
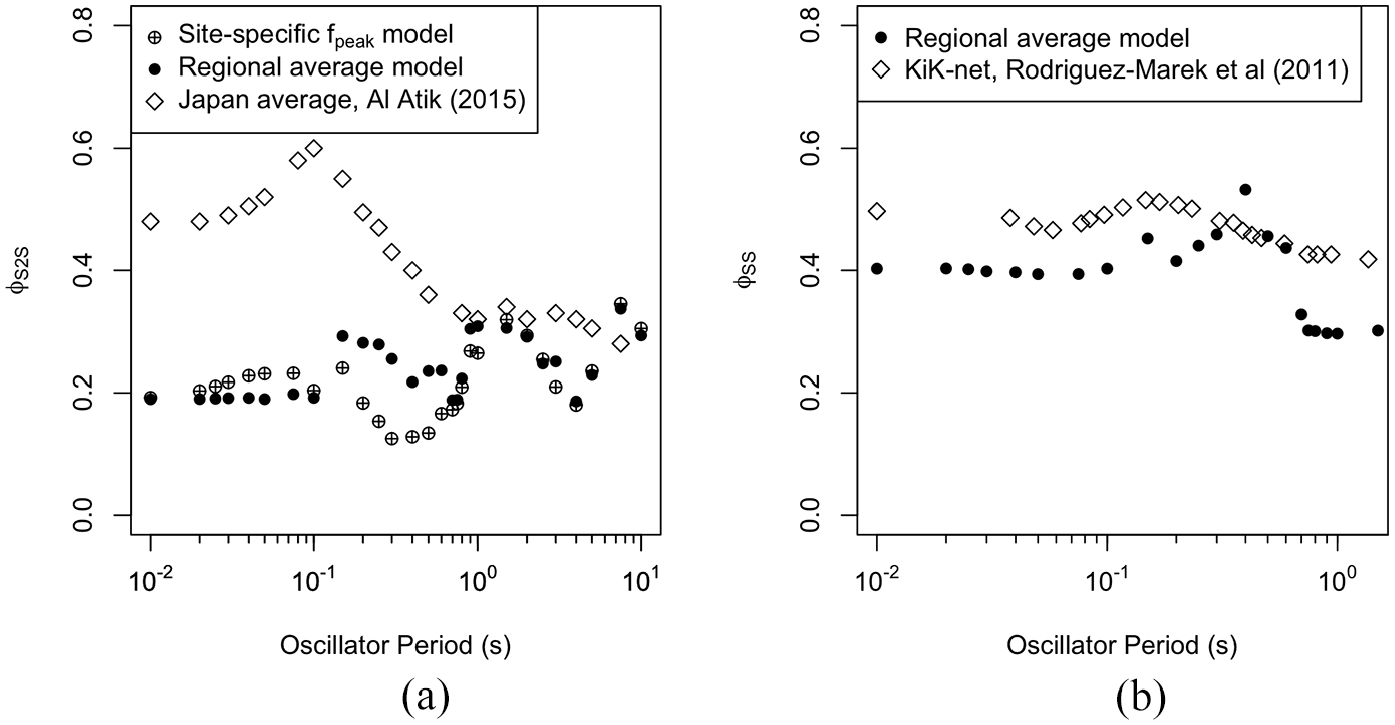
Comparison of within-event standard deviation terms from Obihiro stations (this study) and Japan averages: (a) site-to-site standard deviations as compared with Japan-average from Al Atik (2015) and (b) single-station standard deviation as compared with Japan-average from Rodriguez-Marek et al. (2011).
Figure 17 compares the model bias for the regional average and site-specific models, both of which are effectively zero. Also shown for comparative purposes is the bias obtained using the site term in the Pea22 GMM, which is very large (indicating underprediction). The substantial bias of the GMM for the Obihiro sites demonstrates the need for site-specific site factors for these very soft sites with strong impedance contrasts.
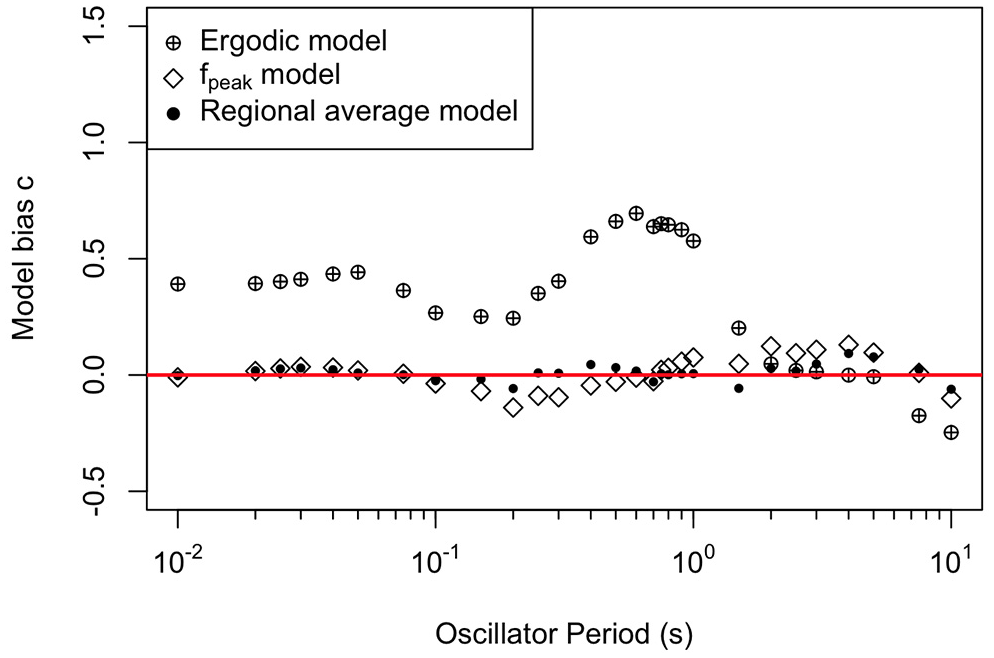
Comparison of model bias for the ergodic model of Pea22 GMM and the Pea22 GMM combined with the two proposed region-specific site amplification models.
Nonlinearity
The previously developed models for mean site response (Equation 9, Figure 13) are based on relatively weak ground motions from 8 events, and hence provide linear site amplification. To investigate nonlinear effects, we examine model misfits relative to the data from Event 10 (the 2003 Tokachi-Oki Earthquake), which produces significantly stronger ground motions than the other considered events at the ODCD stations (Figure 3).
The analysis of Event 10 follows the process used for other events. Equation 1 is used to compute total residuals, and Equation 2 is used to compute the event terms (

where
Event term by Pea22 for Event 10 compared with those for Events 1–9.
Region-adjusted within event residuals are computed using Equation 5. Figure 19 plots
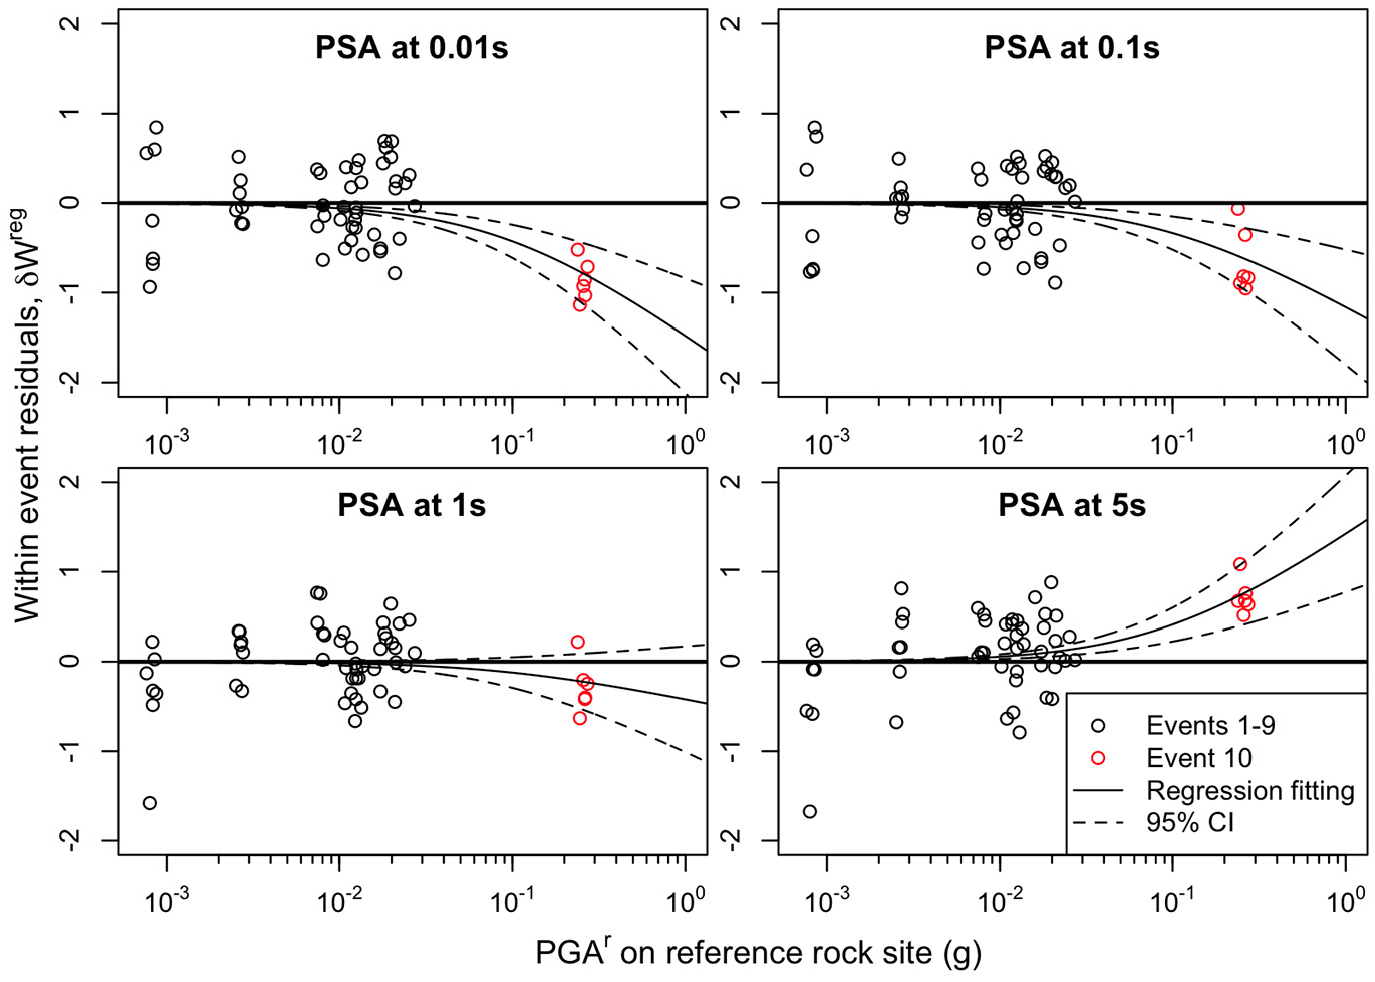
Region adjusted within event-residuals for data recorded at ODCD stations versus reference rock site PGAr.
The trends of the results in Figure 19 are fit by regression using the relation in Equation 7 with
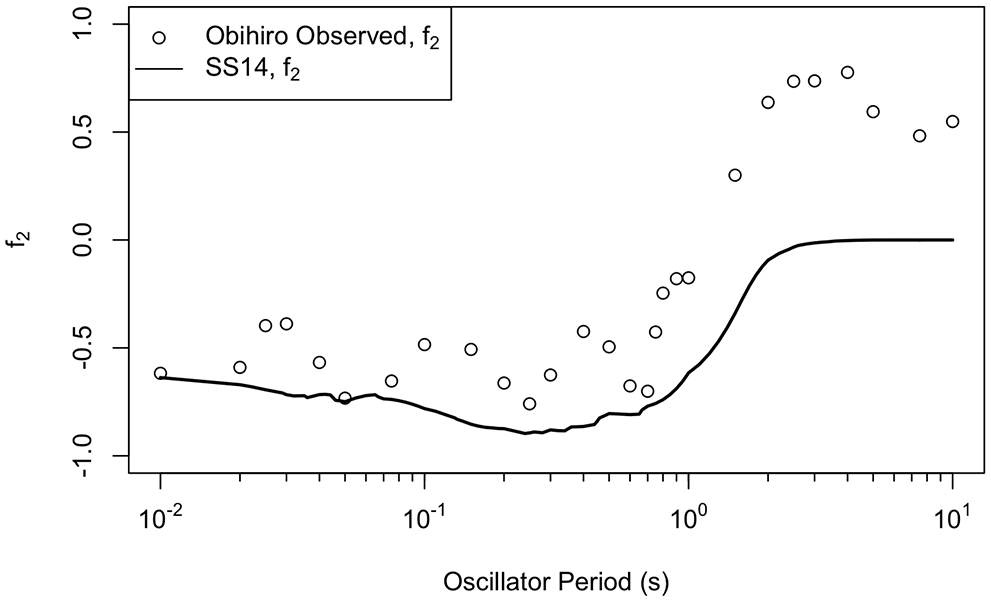
Nonlinear term f2 as function of period as regressed from Obihiro data and from ergodic model for active regions (applied for VS30 = 150 m/s).
Summary and recommendations
GMMs generally include site terms intended for application over a range of VS30≈ 200–1500 m/s. These limits naturally lead to questions of how to model site response for sites with conditions that fall outside of this range. We address this question for a very soft soil region (Ohibiro) in Hokkaido Japan underlain by peaty organic soils and other, non-organic, recent sediments. The range of VS30 in the study region is 100–210 m/s (geometric mean 150 m/s).
We evaluate non-ergodic site responses at seven Obihiro sites using data from nine earthquakes. This analysis required removing regional biases in path effects identified for conditions when ground motions propagate between islands (e.g. event is off the coast of Honshu and ground motions are recorded on Hokkaido). After correcting for these effects, and applying event term adjustments tailored to account for source misfits, site responses for the seven sites are found to have common characteristics, which include peaks at periods of 0.5–0.9 s that are associated with resonances and impedance contrasts of the soft and weak surficial soils (e.g. peats and clays) in the region relative to stiffer underlying soils.
The recommended site response model consists of a modified Mexican Hat wavelet function (Equation 9), the most important parameter of which is a peak frequency
The regional model for mean site response and within-event standard deviation is applicable to the Tokachi River flood plain in the Obihiro region of Japan, as shown in Figure 2. The model is based on data from seven sites with relatively similar
Supplemental Material
sj-docx-1-eqs-10.1177_87552930221082965 – Supplemental material for Region-specific linear site amplification model for peaty organic soil sites in Hokkaido, Japan
Supplemental material, sj-docx-1-eqs-10.1177_87552930221082965 for Region-specific linear site amplification model for peaty organic soil sites in Hokkaido, Japan by Pengfei Wang, Yi Tyan Tsai, Jonathan P Stewart, Atsushi Mikami and Scott J Brandenberg in Earthquake Spectra
Supplemental Material
sj-docx-2-eqs-10.1177_87552930221082965 – Supplemental material for Region-specific linear site amplification model for peaty organic soil sites in Hokkaido, Japan
Supplemental material, sj-docx-2-eqs-10.1177_87552930221082965 for Region-specific linear site amplification model for peaty organic soil sites in Hokkaido, Japan by Pengfei Wang, Yi Tyan Tsai, Jonathan P Stewart, Atsushi Mikami and Scott J Brandenberg in Earthquake Spectra
Footnotes
Acknowledgements
The authors thank Takashi Sato at Civil Engineering Research Institute for Cold Region, PWRI for providing access to the ground motion data files, OCDC for providing access to the sites for field measurements, and Tadahiro Kishida for providing advance access to NGA-subduction ground motion data in support of this work. Robert Kayen of USGS was of great assistance with the geophysical testing, both in the field and in guiding subsequent data analysis.
Declaration of conflicting interests
The author(s) declared no potential conflicts of interest with respect to the research, authorship, and/or publication of this article.
Funding
The author(s) disclosed receipt of the following financial support for the research, authorship, and/or publication of this article: This research was supported by California Department of Water Resources (Contract No. 4600010406). Partial support was also provided by the UCLA Civil & Environmental Engineering Department. This support is gratefully acknowledged.
Supplemental material
Supplemental material for this article is available online.
References
Supplementary Material
Please find the following supplemental material available below.
For Open Access articles published under a Creative Commons License, all supplemental material carries the same license as the article it is associated with.
For non-Open Access articles published, all supplemental material carries a non-exclusive license, and permission requests for re-use of supplemental material or any part of supplemental material shall be sent directly to the copyright owner as specified in the copyright notice associated with the article.