
Abstract
A 4-story steel moment-frame building designed according to ASCE 7 was used in a numerical parameter study to assess the effects of modeling features on peak drift demands. Features studied included strength, stiffness, ductility, and degradation along with several hysteretic models. Attention was given to ASCE 41-type backbone curves. Of particular interest was exploring the effects of degradation, in which an adaptive backbone curve was used to capture both in-cycle and cyclic degradations. Incremental dynamic analyses (IDAs) were performed using a suite of earthquake records to assess the response over a range of shaking intensities. It was found that in-cycle degradation had more influence on the response compared to cyclic degradation for the set of ground motion records that were employed. Moreover, use of the monotonic backbone alone, with its in-cycle degradation, was sufficient. In addition, it was found that increasing strength, stiffness, and/or ductility resulted in decreased peak drift demands, whereas modifying the hysteretic type (elasto-plastic, stiffness-degrading, and pinching) had little effect on peak drifts. These findings indicate that using backbone curves based on envelopes of first-cycle test data, as done in ASCE 41, can result in overly conservative seismic response predictions.
Keywords
Introduction
Performance-based engineering, in which a structure is proportioned to meet certain predictable performance objectives, requires knowledge of component (e.g. steel beam-to-column connection) inelastic behavior during earthquakes. The ASCE 41 performance-based standard (American Society of Civil Engineers (ASCE), 2017), Seismic Evaluation and Retrofit of Existing Buildings uses a force-deformation backbone curve to describe component ultimate force over a range of deformations as depicted in Figure 1. ASCE 41 modeling and acceptance requirements for deformation-controlled components are based on backbones usually taken as envelopes from multiple cyclic tests, thereby implicitly including cyclic deterioration.
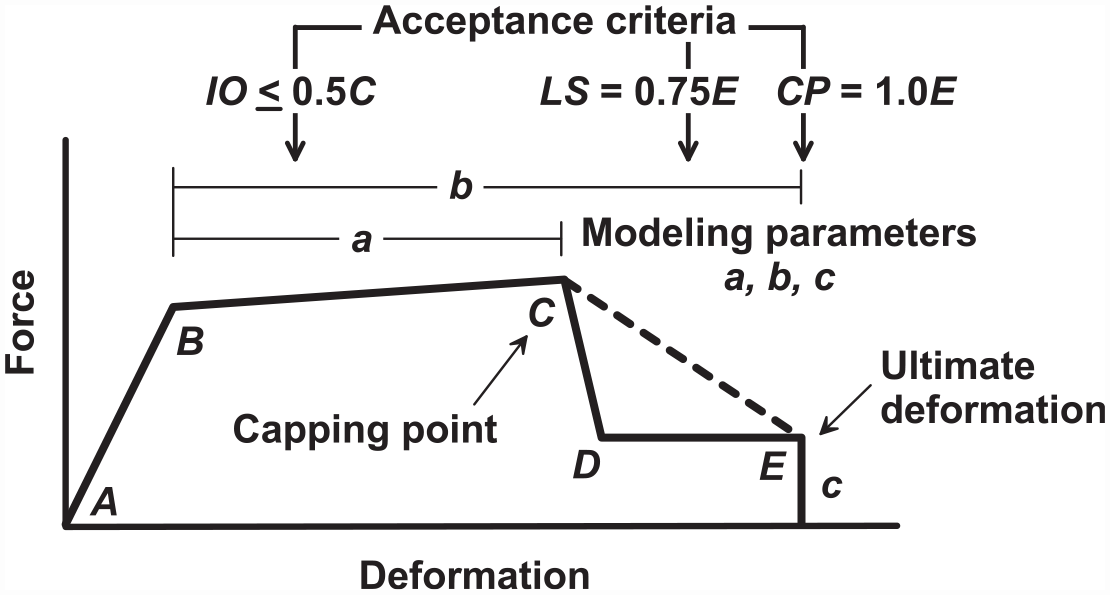
ASCE 41 component backbone curve (force-deformation relationship). IO, LS, and CP indicate acceptable deformation limits for immediate occupancy, life safety, and collapse prevention structural performance objectives, respectively. Acceptance criteria are dependent on capping point (C) and ultimate deformation (E).
For building evaluation using the nonlinear dynamic procedure (NDP), various structural components are modeled using backbone curves that influence response predictions and in turn determine whether components have acceptable seismic performance. Backbone curves are key factors in ASCE 41.
This article examines the influence of modeling features on the peak drift demands obtained using the NDP. A parameter study is conducted using a single-degree-of-freedom (SDOF) approximation of a 4-story steel moment-frame case study building. Conclusions are drawn regarding the impact of modeling variations on computed peak building drifts. The information presented herein is intended to inform performance-based engineering practice.
Case study building
Numerous archetype steel buildings were studied extensively as part of the National Institute of Standards and Technology (NIST) project Assessment of First Generation Performance-Based Seismic Design Methods for New Steel Buildings. NIST evaluated the buildings using ASCE 41 and P695 criteria. ASCE 41 evaluations used the ASCE 41 prescribed modeling (backbone curves) and acceptance rules. The P695 evaluations used modeling techniques intended to best capture actual building behaviors and defined acceptance by a particular probability of collapse (Federal Emergency Management Agency (FEMA), 2009a; NIST, 2017). It was found that ASCE 7–10 (ASCE, 2010) designed buildings were rejected by ASCE 41 but passed evaluations using the P695 guidelines. It was then concluded ASCE 41 can be overly conservative.
The building considered here was the 4-story moment-frame building having reduced beam section (RBS) connections (Figure 2). Full details can be found in NIST reports (Harris and Speicher, 2015; Speicher et al., 2020).
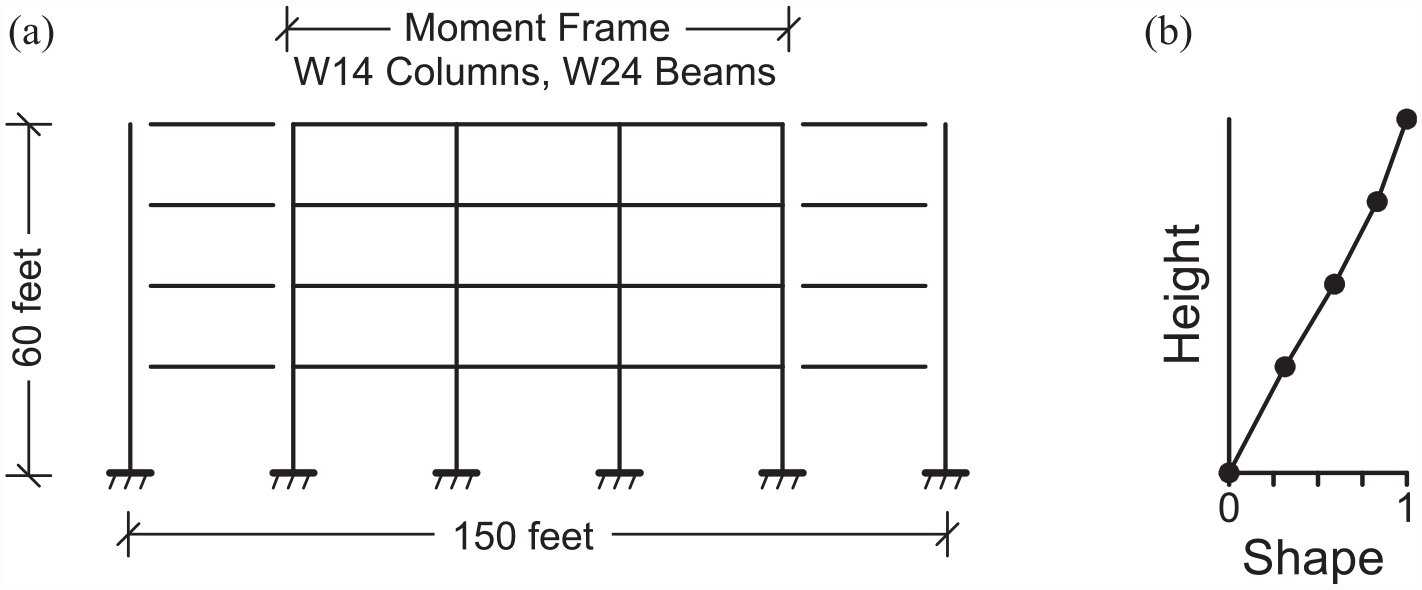
Case study building. (a) Elevation view depicting structural system located on building exterior column line. (b) Shape function (Ψ) taken as fundamental mode shape (Period = 1.8 s).
Nonlinear model
The P695 evaluation by NIST analyzed a detailed member-by-member building model using the OpenSees software (McKenna and Fenves, 2016). A simplified model based on the detailed model was used here. It allowed for efficient execution of numerous NDP computer runs. The simplified model used the first mode (Figure 2b) as a shape function to define the building lateral displacements. This was deemed appropriate since the OpenSees analyses found negligible column hinge yielding except at the fixed end first story columns. Because the columns stayed mostly elastic, the lateral sway pattern was similar to a first mode shape. Most inelastic actions occurred in the RBS connections with much less yielding in column panel zones.
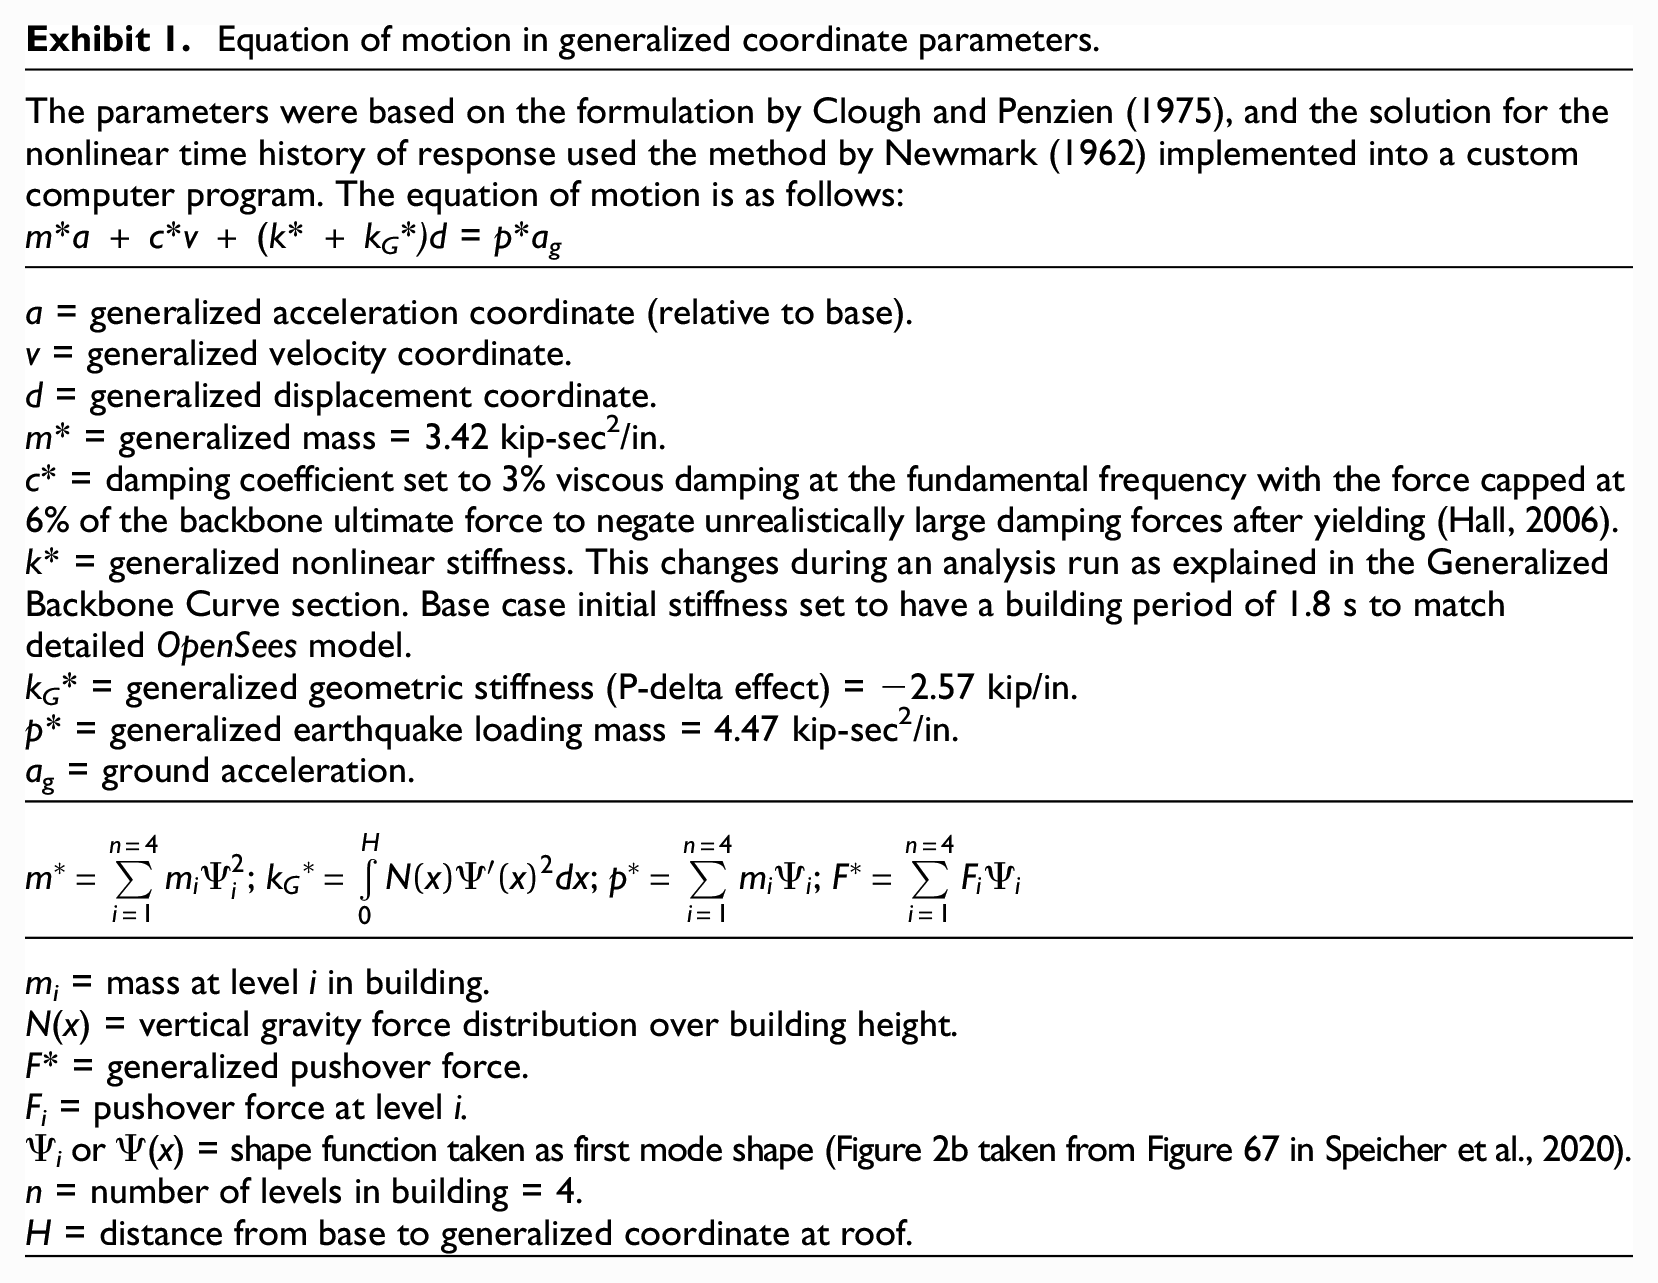
The simplified model was thus a generalized nonlinear SDOF approximation of the detailed OpenSees model. The generalized coordinate was set at the building roof, and the building inelastic actions were conveniently accounted for by a single generalized backbone curve describing the building global nonlinear behavior. Since RBS connection inelastic actions predominated, the global backbone curve mostly reflects the aggregated RBS connection behaviors. Response measures were median peak transient forward and reverse building deformations taken as roof drifts (roof displacement divided by the building height, expressed as a percentage). The forward direction was defined as that having the largest roof drift. Model properties are explained in Exhibit 1.
Equation of motion in generalized coordinate parameters.
Strength degradation models
The detailed OpenSees model used adaptive modeling via the modified Ibarra–Medina–Krawinkler (IMK) formulation in which a component starts with a reference monotonic backbone curve that is degraded during the NDP analysis according to the accumulated inelastic deformation history (Ibarra et al., 2005; Lignos and Krawinkler, 2012). It captured both in-cycle and cyclic degradations in flexural strength and unloading stiffness. In-cycle degradation (FEMA, 2009b) is characterized by loss of strength occurring within a single cycle (e.g. during a monotonic push). Cyclic degradation is defined as loss of strength and stiffness from reversed cyclic displacements.
It should be noted that the OpenSees model was formulated to best capture actual building response and was not an ASCE 41 model. Adaptive modeling is not often used in engineering practice. ASCE 41 prescribed backbone curves are typically based on first-cycle envelopes of standard fully reversed cyclic test data, thereby including cyclic degradation (Krawinkler, 1996; NIST, 2017). They are intended for use in customary state-of-practice analysis software that lacks adaptive modeling capabilities. As shown later, building earthquake response resulted in negligible cyclic degradation, thereby making the ASCE 41 backbones very conservative (too pessimistic).
The generalized nonlinear SDOF model here also used an adaptive approach via a simple yet effective empiric model (Maison et al., 2020). The adaptive model separated in-cycle and cyclic effects as explained below. Validation was demonstrated by comparison to physical component tests in Appendix 1 and Supplemental Materials file.
In-cycle
Strength degradation was controlled by a backbone curve acting as a capacity boundary (Figure 3a). The hysteretic behavior was elasto-plastic and as the deformation increased, the ultimate force progressively decreased according to the backbone curve. The backbone was taken as the curve from a monotonic loading, or a skeleton curve constructed from the decomposition of cyclic lab test data. A skeleton curve consists of an envelope of horizontally shifted hysteretic loops resembling a monotonic curve as explained by Maison et al. (2020).
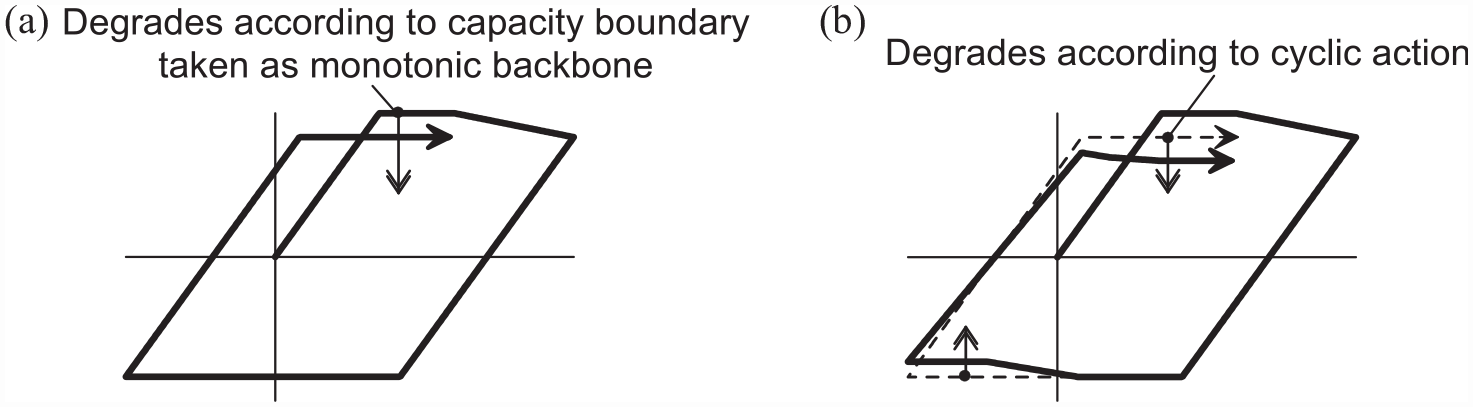
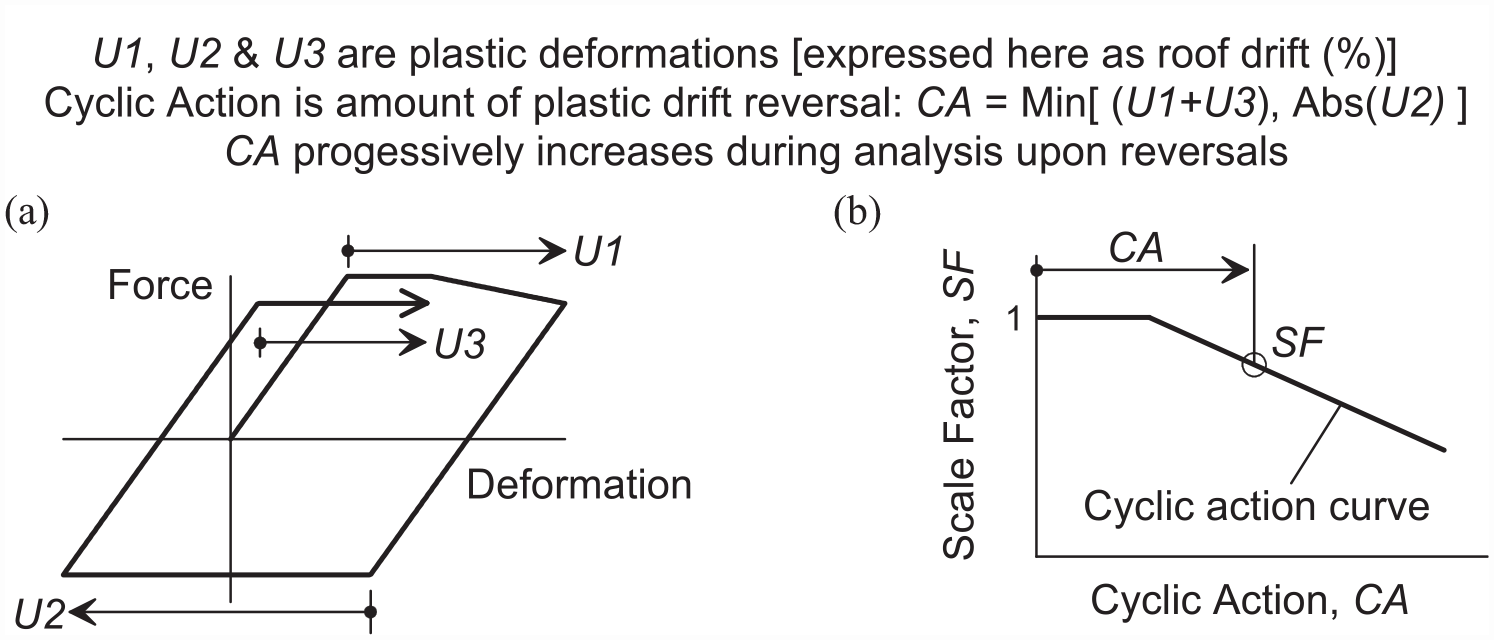
Illustration of adaptive model (a) in-cycle and (b) cyclic strength degradation features.
Cyclic
Strength degradation was modeled as a force reduction dependent on the amount of cyclic action (CA) (Figure 3b). CA was defined as the minimum of the cumulative plastic deformations in the positive and negative directions as the analysis proceeded. In essence, CA was a measure of the amount of plastic deformation reversal. The force from the in-cycle part above was scaled by a factor (SF) taken from a CA curve (Figure 4). Scaling occurred continuously as the plastic deformations accumulated during the NDP analysis run. It was found that the CA curve can be conveniently based on the part of the backbone curve beyond point B (Figure 1) as illustrated in Appendix 1.
Example depicting how adaptive model cyclic degradation algorithm works for determination of force scale factor (SF). SF is applied to in-cycle force part to get component force. (a) In-cycle hysteresis example. (b) Scale factor calculation example.
Generalized backbone curve
The generalized stiffness (k*) was modified during an analysis according to the adaptive model described above. In-cycle degradation was accounted for by the backbone derived via the monotonic pushover from the detailed OpenSees model that used a lateral force pattern according to the first mode shape (Figure 5a). The pushover curve was transformed to the generalized coordinate as explained in Exhibit 1 (equation for F*). The generalized backbone mostly reflected the aggregated RBS connection monotonic behaviors. Cyclic degradation was accounted for by the CA curve as shown in Figure 5b.
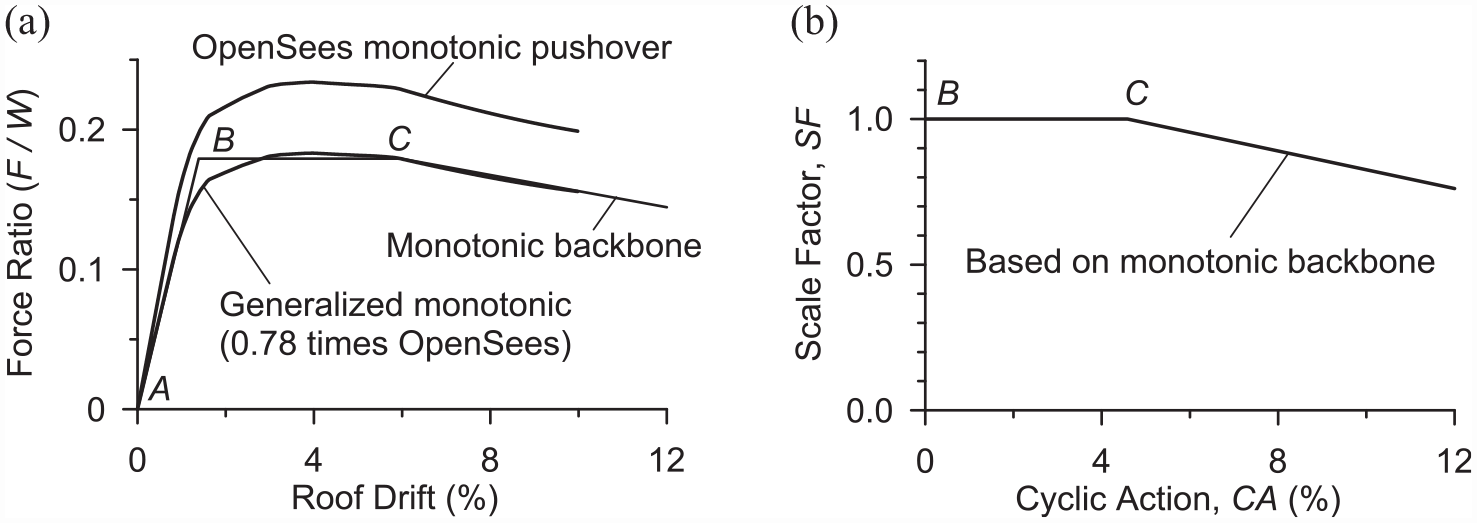
Base case building generalized stiffness (k*). (a) Monotonic backbone curve is the piecewise linear representation of generalized monotonic pushover. OpenSees curve is the pushover without P-delta effects because P-delta is applied separately in the generalized building model. The 0.78 factor transforms the OpenSees pushover forces to an equivalent force at the generalized coordinate per equation for F* in Exhibit 1. W = total building weight. (b) Cyclic action curve. The cyclic action curve shape is taken as that part of the backbone curve beyond point B.
Ground motions
A suite of ground acceleration records was used representing a high-seismicity site that might experience strong ground motions from mid- to large-magnitude earthquakes at close distances. The suite, which is comprised of 80 horizontal records, represents earthquakes having a 2% probability of exceedance in 50 years (2500-year events) at a soil site (site class C/D) in the city of Oakland, California (Baker et al., 2011). The site was close enough to the governing fault thus potentially experiencing directivity effects, and 19 records (1 in 4 records) have velocity pulses with pulse periods between 1 and 7 s. The median spectrum greatly exceeded the design basis earthquake (0.67 times the maximum considered earthquake) used for the building (Figure 6).
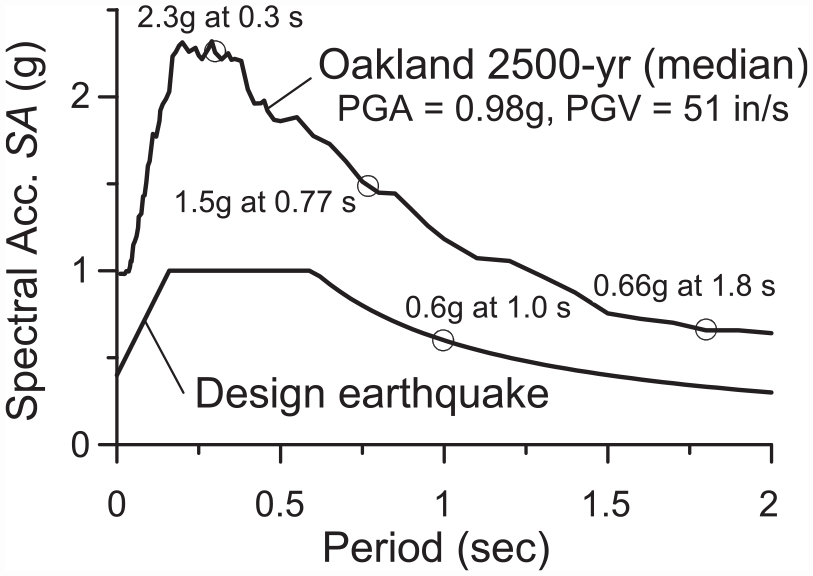
Response spectra (5% damping). PGA and PGV are median peak ground acceleration and velocity, respectively. Building was designed by the equivalent lateral force method using a period of 1.0 s.
Since the acceleration records varied, the computed peak building responses had scatter. Thus, the counted medians of the peak values were used as best estimates (the peak value in the middle).
In-cycle versus cyclic degradation
The base case simplified SDOF model used adaptive modeling and was intended to mimic actual building behaviors. It did not use ASCE 41 prescribed backbone curves. The simplified model was subjected to the suite of 80 records scaled to the 2500-year intensity. The building responded with pronounced one-direction bias (i.e. ratcheting behavior). The median peak forward roof drift of 4.6% was about three-times that of the reverse direction (Figure 7a). The numbers of inelastic cycles during the response history (cumulative plastic deformation reversals) were small, and thus, there was no cyclic degradation at the median run (Figure 7b). Hence, cyclic degradation was minimal and the response essentially followed the in-cycle (monotonic) backbone. Sample analyses of the detailed OpenSees building model had the same conclusion when re-run with the cyclic degradation feature turned off. This corroborates with findings of shake table and quasi-static collapse tests of a scale model of a 4-story steel moment-frame specimen having similar strength characteristics (Del Carpio et al., 2016; Lignos et al., 2011). Lack of significant fully reversed CA in building seismic response was also noted previously (e.g. Krawinkler, 2009; Maison and Speicher, 2016).
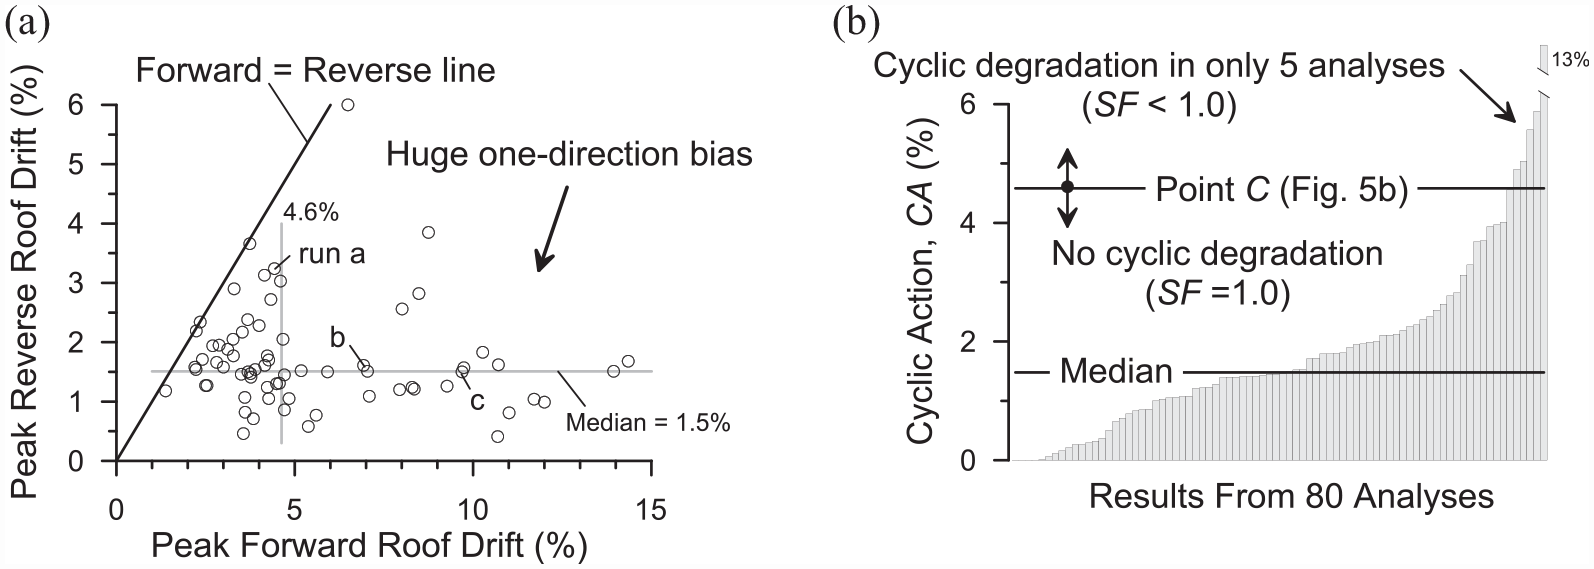
Results from base case model subjected to 80 records from Oakland 2500-year earthquake suite. (a) Peak forward and reverse drifts exhibiting a one-direction bias via ratcheting response as explained in text. Eleven runs had building collapse and data points not shown (large forward drifts). (b) Cyclic degradation (see Figure 5b for cyclic action curve).
Figure 8 shows response history results from three analysis runs illustrating representative response patterns. Peak reverse drift occurred early in the response after which the building experienced an inelastic reversal to the forward direction. The behavior exhibited a ratcheting response in that the building progressively drifted in one direction via relatively few incremental inelastic excursions interspersed with mostly elastic cycles. The destabilizing effects of gravity (kG*) bolstered ratcheting after yielding in the forward direction by reducing the effective yield force in the forward direction while increasing it in the reverse direction (creating asymmetric forces). Longer duration records would be more hazardous provided the shaking had sufficient intensity to cause additional inelastic excursions. Response was like a one-sided cyclic pattern or monotonic push rather than standard fully reversed symmetric cyclic loading patterns (protocols) commonly used in component lab tests that served as the basis of many ASCE 41 prescribed backbone curves.
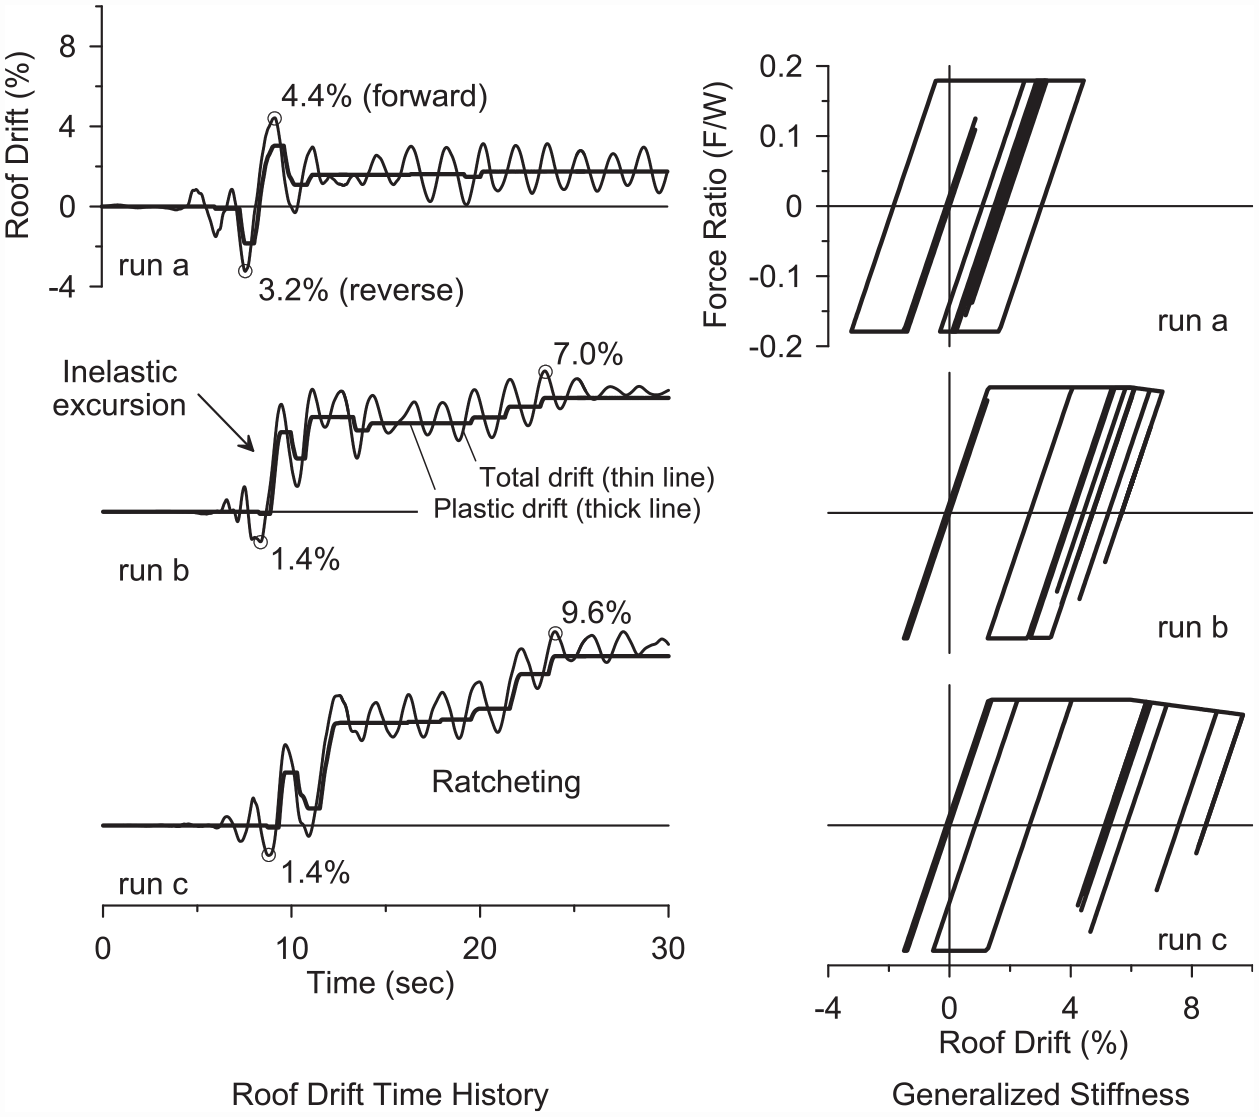
Sample time history results from three earthquake analyses of the generalized building model. Notice how the plastic drift response resembles a monotonic pushover. Runs selected are indicated in Figure 7a.
Variations in model properties
Additional NDP analyses of the simplified SDOF building model were performed to assess the effects of model property variations on median computed peak roof drift demands. CA curves were set corresponding to the particular backbone curves even though cyclic degradation was found to be insignificant. To provide insights about response over a range of shaking intensities, incremental dynamic analysis (IDA) was performed via scaling the earthquake suite. Median results were reported here, since it is customary to use best estimates of peak response in performance-based engineering (e.g. ASCE 41 uses average peak values in NDP). Variability about the median at particular shaking intensities was not studied, although it is expected to be similar across the different cases studied.
Ductility
The results from three models were compared: (1) base case with the backbone explained above, (2) RBS case having the backbone based on ASCE 41 prescribed parameters for RBS connections (a, b, c in Figure 1), and (3) WUF case having the backbone based on ASCE 41 prescribed parameters for welded unreinforced flange (WUF) connections. Figure 9a show the backbones. The RBS and WUF backbones can be considered to represent upper and lower bounds, respectively, on ASCE 41 prescribed connection ductility. They have much less ductility than the base case because cyclic degradation was implicitly included.
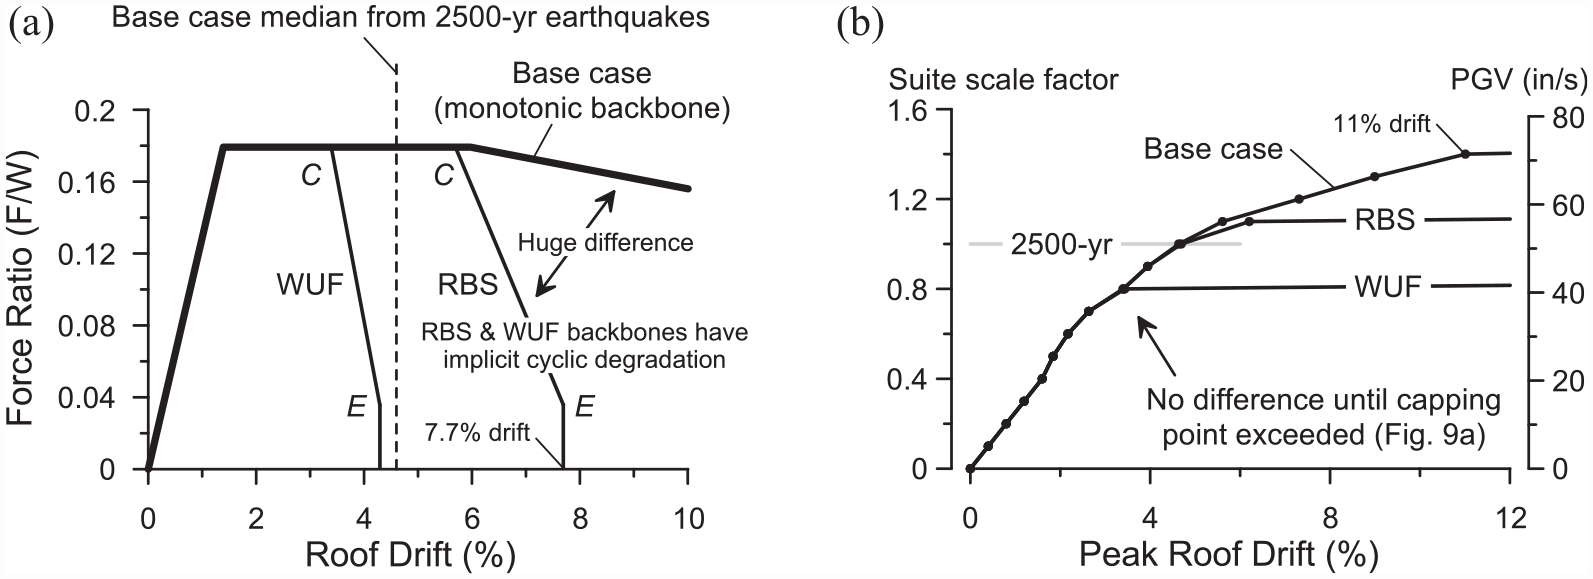
Effect of ductility on median peak drifts. (a) Building generalized backbone curves. RBS and WUF capping point C and ultimate point E based on ASCE 41 modeling parameters (Table 9-7.2 in ASCE 41) for RBS (a = 0.043 rad, b = 0.063 rad, c = 0.2) and WUF (a = 0.02 rad, b = 0.029 rad, c = 0.2) connections, respectively. Roof drift ratio was taken as equivalent to connection hinge rotation. (b) IDA results. Each data point (dot) is the median of 80 computer runs at the particular Oakland suite scale factor. For example, when the suite was scaled by 0.8 (80% of the 2500-year intensity), all models had the same median peak roof drift of 3.4%. Graph represents results from more than 1400 runs.
Figure 9b shows the IDA results. All three models had the same median peak drifts until capping points were exceeded. The base case model governed by the monotonic backbone had 1.3-times and 1.8-times greater ultimate shaking intensity and drift capacity than the RBS case, respectively (comparing base case to RBS in Figure 9b).
The base case withstood shaking intensities larger than those for the RBS and WUF cases because of its greater ductility. The base case and RBS case had about the same capping points (point C); hence, the better base case response at high intensity shaking was due to the more gradual post-capping slope of the backbone. Thus, component ductility depended on both the capping point deformation and the slope of the backbone beyond the capping point. This underscores the importance of backbone ductility.
Moreover, suppose the building was analyzed using adaptive modeling, but evaluated under current ASCE 41 acceptance criteria. The collapse prevention (CP) deformation limit would be about 7.7% roof drift given that RBS connections govern (Figure 9a), whereas the base case adaptive model was able to sustain at least 1.4-times greater drift without collapse (11% roof drift, Figure 9b). The building could be rejected because the ASCE 41 CP acceptance criterion was based on standard tests. Therefore, ASCE 41 acceptance criteria should be based on backbones derived from physical tests representative of actual earthquake demands.
Hysteretic type
Results from three models using different hysteretic behaviors (all using base case backbone) were compared: (1) base case using elasto-plastic hysteretic type, (2) stiffness-degrading case, and (3) pinching case. Figure 10a depicts the hysteretic types. Elasto-plastic is often used to describe steel component behavior. Stiffness-degrading (sometimes called peak-oriented) is often used for concrete components such as beams and columns. Pinching is often used for squat concrete shear walls, and for wood components such as plywood shear walls.
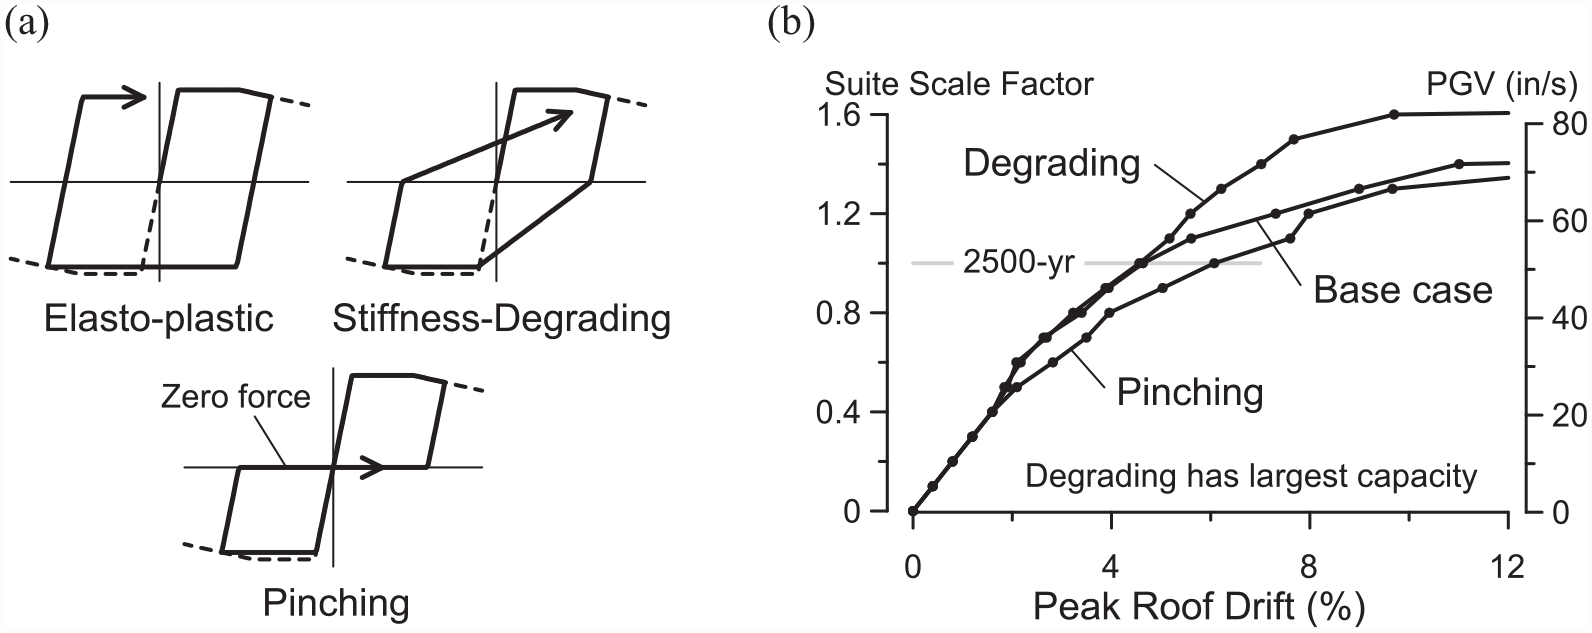
Effect of hysteretic type on median peak drifts. (a) Three different types of hysteretic behaviors. Base case used elasto-plastic. (b) IDA results. Each data point (dot) is the median of 80 computer runs at the particular Oakland suite scale factor.
Hysteretic type had only modest impact on median peak drifts (Figure 10b). This was because the inelastic response consisted mostly of a series of one-sided excursions that follow the initial elasto-plastic backbone shape (Figure 8) rather than large fully reversed hysteretic loops depicted in Figure 10a. Ibarra and Krawinkler’s (2005) numerical studies of generic frames suggest the same conclusion. For the severe pinching model used here (having zero strength upon load reversal), the median peak drifts were about 30% greater than the base case at the 2500-year intensity. Stiffness-degrading had virtually the same median drifts as the base case at the 2500-year intensity. Ironically, stiffness-degrading performed better (smaller drifts) than the base case under very high intensity shaking. This is likely due to stiffness-degrading mitigation of ratcheting by having reduced stiffness upon load reversals, thereby allowing a building self-centering effect, which is consistent with prior findings (Ibarra and Krawinkler, 2005).
Lateral strength
The results from two models were compared: (1) base case with the backbone explained above and (2) reduced-strength case having ultimate lateral strength (ultimate base shear) set at two-thirds of the base case. Figure 11 shows the backbones and IDA results. The median peak drifts progressively diverged with increasing deformations beyond the yield drift (Figure 11b). The reduced-strength building experienced greater ductility demands at a given intensity than the base case. It had a median shaking intensity causing side-sway collapse about 30% less than that for the base case. Hence, greater strength translated into better performance.
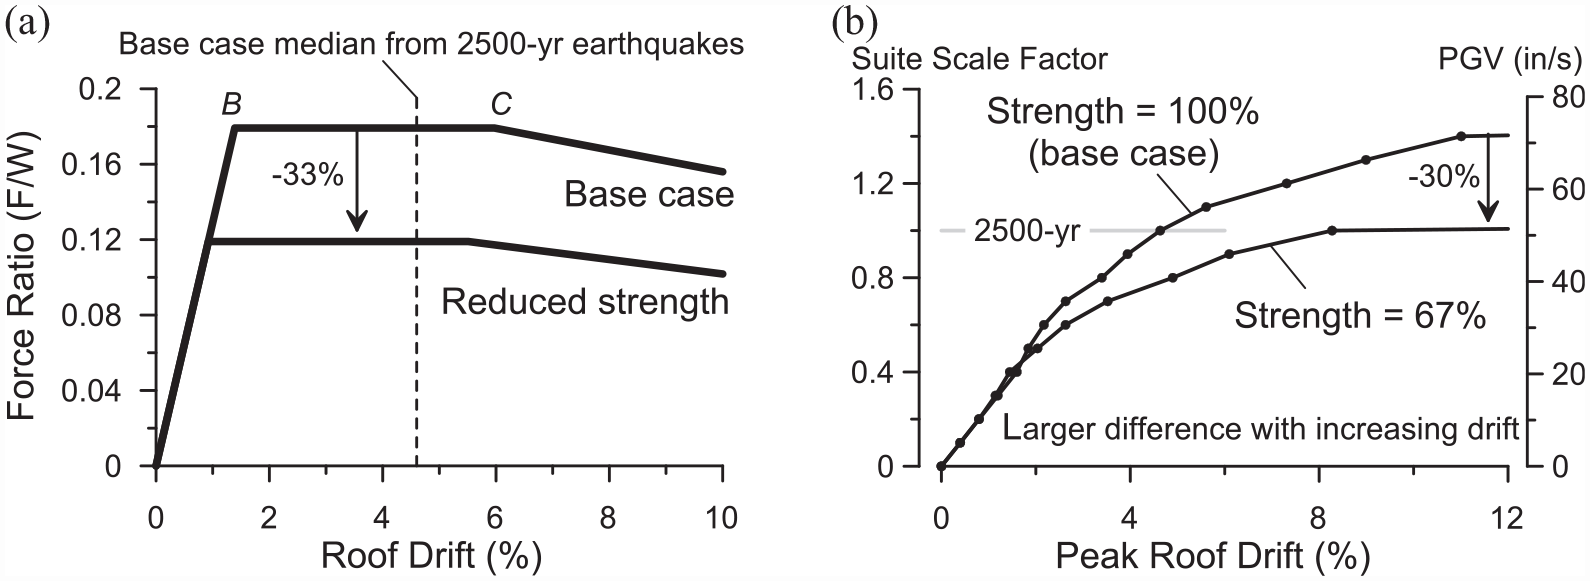
Effect of ultimate lateral strength on median peak drifts. (a) Backbone curves. (b) IDA results. Each data point (dot) is the median of 80 computer runs at the particular Oakland suite scale factor.
Building period
The base case model had fundamental natural period of 1.8 s that was considerably greater than that from the ASCE 7 formula (CuTa = 1.0 s) and regression equations from actual building measurements (0.74 s (lower) to 1.2 s (upper) per Goel and Chopra (1997)). Possible reasons for discrepancy include customary practice of ignoring stiffness contributions from slab-girder composite action, gravity frames, and nonstructural components. Such features can contribute significantly to the lateral stiffness of a steel frame building (e.g. see Elkady and Lignos, 2014, 2015; Flores et al., 2016; Maison and Neuss, 1985).
The results from three models having different periods were compared: (1) base case with period T = 1.8 s case (set to match the detailed OpenSees model), (2) T = 0.77 s case having five-times the base case stiffness, and (3) T = 0.3 s case having 36 times the base case stiffness. Figure 6 illustrates the wide variation in spectral accelerations associated with the different periods.
Figure 12 shows the backbone curves and IDA results. The T = 0.77 s case resulted in smaller median peak drifts at all shaking intensities versus the base case (Figure 12b). It had 36% less drift at the 2500-year intensity. The T = 0.3 s case resulted with the smallest median peak drifts at all shaking intensities. Greater stiffness more than offset the increase in spectral values (Figure 6). Hence, ignoring stiffness contributions in NDP evaluation produced conservative drift estimates (i.e. on the high side).
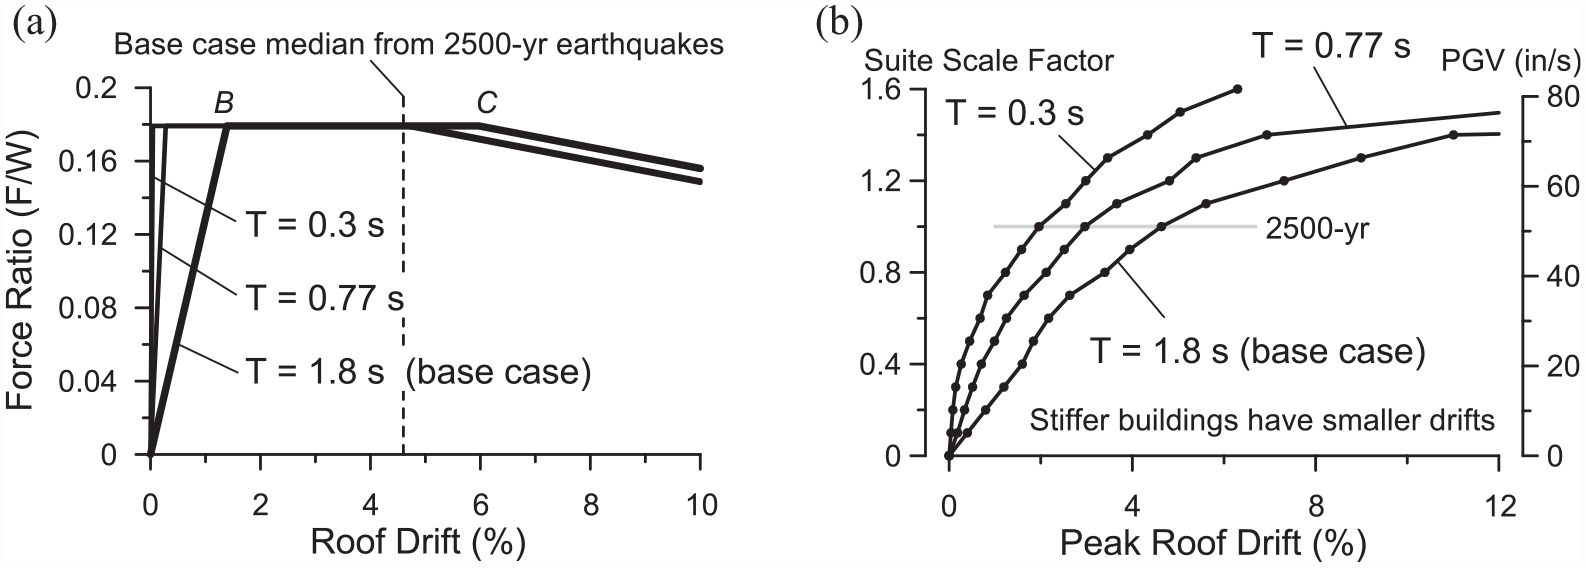
Effect of building period (stiffness) on median peak drifts. (a) Backbone curves. (b) IDA results. Each data point (dot) is the median of 80 computer runs at the particular Oakland suite scale factor.
Discussion
Many of the findings here were reported previously by other researchers (see reference sources in Maison and Spiecher, 2016; Speicher and Maison, 2020). The prior work was motivation for this study to validate and underscore key findings for the benefit of practicing engineers. Two important aspects are highlighted below.
Adaptive modeling
It was found here that adaptive component modeling was not needed for the cases considered. CAs were minimal thus leading to little cyclic degradation (Figure 7b). Accordingly, building behavior was governed by in-cycle degradation represented as the monotonic backbone. Previously, authors of the IMK adaptive model did extensive parameter studies and found that backbone ductility capacity (capping point C deformation) and post-capping stiffness were most influential in building side-sway collapse when compared to cyclic degradation that had smaller effect (Ibarra and Krawinkler, 2005). Likewise, the Applied Technology Council ATC-62 project, Effects of Strength and Stiffness Degradation on Seismic Response, found in most cases, the effects of in-cycle strength degradation dominate the nonlinear dynamic behavior suggesting that effects of cyclic degradation can often be neglected (FEMA, 2009b).
ASCE 41 backbones
Many (perhaps most) of the ASCE 41 component criteria were based on physical tests using standard fully reversed symmetric cyclic loading patterns (e.g. ATC, 1992 protocol). It was noted here that such protocols produce cyclic degradation that is more demanding than representative seismic response (Figure 13), and building models using ASCE 41 backbones having implicit cyclic degradation can be overly conservative (too pessimistic). Previously, Lignos and Krawinkler (2012) found the use of standard protocols provides insufficient information for component degradation modeling near collapse and that alternative loading protocols were needed. This led to Suzuki and Lignos (2020, 2021) proposing a collapse-consistent protocol representing realistic earthquake demands. The use of protocols representative of actual earthquake demands likely will result in backbone curves having more ductility than many of those prescribed in ASCE 41.
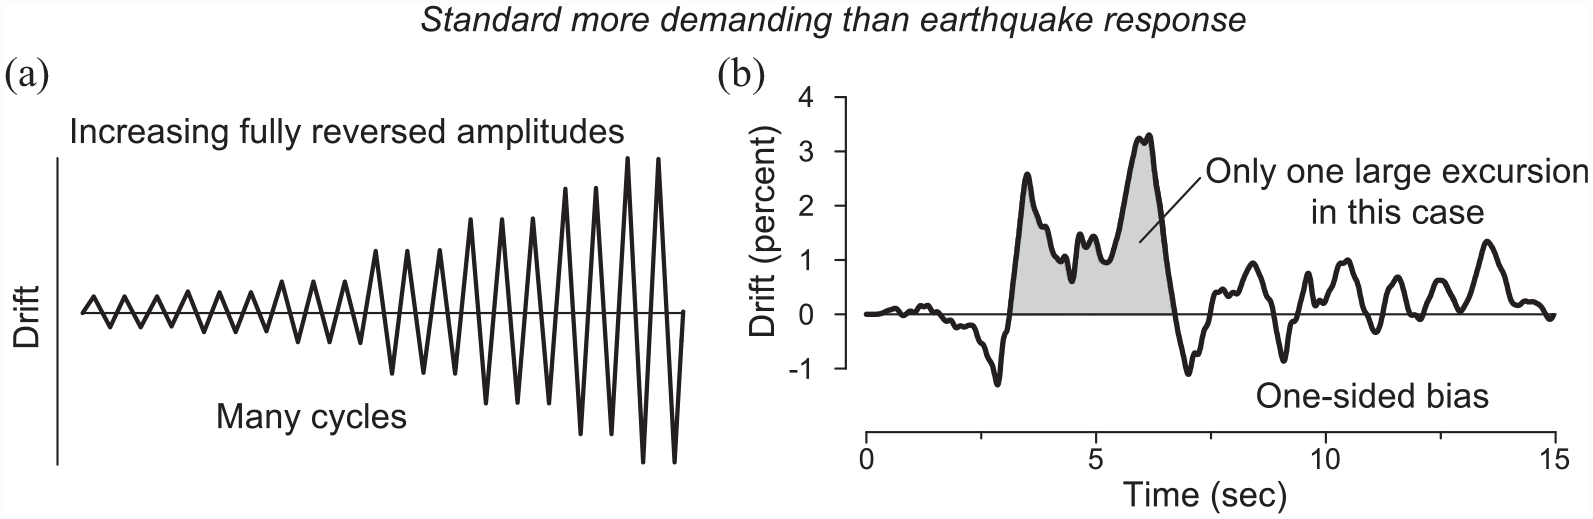
Comparison of standard loading protocol to representative building seismic response for an 8-story EBF steel frame building (Maison and Speicher, 2016). (a) Standard Protocol and (b) representative earthquake response.
Moreover, the Applied Technology Council ATC-116 project, Short-Period Building Collapse Performance and Recommendations for Improving Seismic Design necessitated use of backbone curves having much more ductility than those of ASCE 41 in order to explain the observed better-than-expected performance of short-period buildings (FEMA, 2020). Conservative modeling was one of the reasons for the “short-period paradox.” It also recommended that a study be undertaken to review and update existing cyclic-load testing protocols to better reflect real earthquake loading conditions.
It follows that modeling and acceptance criteria can be overly conservative when based only on standard tests (i.e. understate component ductility during earthquakes). This undoubtedly contributed to ASCE 7 designed buildings being rejected by ASCE 41 (Harris and Speicher, 2015).
Conclusion
A 4-story steel moment-frame building designed according to ASCE 7 was used in a parameter study to assess the effects of modeling variations in NDP evaluation for best estimate (median) peak building drift demands. The building model incorporated an adaptive component formulation to account for in-cycle and cyclic strength degradation. It is reasonable to expect the following apply to similar buildings in analogous seismic settings, thereby informing performance-based engineering practice:
The case study building’s inelastic strength degradation was mostly from component in-cycle effects (Figure 3a). Cyclic degradation was minimal (Figure 7b), and thus, in-cycle degradation governed the response. Hence, adaptive modeling was not needed. It was adequate to use the monotonic backbone curve alone rather than a backbone from envelope of standard tests that includes cyclic degradation.
Better performance (smaller median peak drifts) was obtained when the building backbone curve had larger ductility (larger capping point deformation and more gradual post-capping slope). The case study building capping point was at about 6% roof drift (Figure 9).
Hysteretic behavior type had relatively small effect on median peak drifts (Figure 10, elasto-plastic, stiffness-degrading, pinching). Stiffness-degrading hysteretic behavior had the best performance (often used to model concrete components), which was likely due to the mitigation of ratcheting by having reduced stiffness upon load reversals.
Better performance was obtained when the building had larger ultimate lateral strength (ultimate base shear) and/or shorter period (Figures 11 and 12). This implies it was conservative to ignore features contributing strength and stiffness to the building (i.e. resulting drift predictions on the high side).
The building experienced ratcheting where it progressively drifted in one direction via relatively few incremental inelastic impulsive excursions (Figure 8). Such behavior was better described as a one-sided cyclic pattern or monotonic push rather than standard fully reversed symmetric cyclic loading patterns (protocols) commonly used in component physical tests.
The distinctive sharp decline in ASCE 41 backbones (beyond the capping point) was largely artifacts of the standard protocols used in component tests (Figure 1). Standard protocols produce component cyclic degradation not characteristic of actual earthquake demands. Resulting modeling and acceptance criteria likely underestimate component seismic performance. This undoubtedly contributed to the case study building being rejected by ASCE 41.
Future component physical tests in support of performance-based engineering should include protocols representative of earthquake response (e.g. Suzuki and Lignos, 2020) to supplement standard tests. The results at large inelastic (post-capping) deformations can be expected to be closer to those from monotonic tests as opposed to standard tests. Latest editions of ASCE 41 now encourage use of protocols representative of earthquake demands to supplement standard tests.
Supplemental Material
sj-pdf-1-eqs-10.1177_87552930231172529 – Supplemental material for Backbone curve variations on steel building seismic response
Supplemental material, sj-pdf-1-eqs-10.1177_87552930231172529 for Backbone curve variations on steel building seismic response by Bruce Maison, Matthew S. Speicher and Dimitrios Lignos in Earthquake Spectra
Footnotes
Appendix 1
Acknowledgements
The authors are members of the Lab Testing Working Group within the ASCE/SEI Standards Committee responsible for ASCE 41. The authors appreciate valuable input provided by members of the Standards Committee. The authors also appreciate the thorough critiques provided by Dr Siamak Sattar (NIST) and the two anonymous peer reviewers. Certain commercial software has been used in the preparation of information contributing to this paper. Identification in this paper is not intended to imply recommendation or endorsement by NIST nor is it intended to imply that such software is necessarily the best available for the purpose.
Declaration of conflicting interests
The authors declared no potential conflicts of interest with respect to the research, authorship, and/or publication of this article.
Funding
The authors received no financial support for the research, authorship, and/or publication of this article.
Supplemental material
Supplemental material for this article is available online.
References
Supplementary Material
Please find the following supplemental material available below.
For Open Access articles published under a Creative Commons License, all supplemental material carries the same license as the article it is associated with.
For non-Open Access articles published, all supplemental material carries a non-exclusive license, and permission requests for re-use of supplemental material or any part of supplemental material shall be sent directly to the copyright owner as specified in the copyright notice associated with the article.