
Abstract
The ShakeAlert Earthquake Early Warning (EEW) system aims to issue an advance warning to residents on the West Coast of the United States seconds before the ground shaking arrives, if the expected ground shaking exceeds a certain threshold. However, residents in tall buildings may experience much greater motion due to the dynamic response of the buildings. Therefore, there is an ongoing effort to extend ShakeAlert to include the contribution of building response to provide a more accurate estimation of the expected shaking intensity for tall buildings. Currently, the supposedly ideal solution of analyzing detailed finite element models of buildings under predicted ground-motion time histories is not theoretically or practically feasible. The authors have recently investigated existing simple methods to estimate peak floor acceleration (PFA) and determined these simple formulas are not practically suitable. Instead, this article explores another approach by extending the Pacific Earthquake Engineering Research Center (PEER) performance-based earthquake engineering (PBEE) to EEW, considering that every component involved in building response prediction is uncertain in the EEW scenario. While this idea is not new and has been proposed by other researchers, it has two shortcomings: (1) the simple beam model used for response prediction is prone to modeling uncertainty, which has not been quantified, and (2) the ground motions used for probabilistic demand models are not suitable for EEW applications. In this article, we address these two issues by incorporating modeling errors into the parameters of the beam model and using a new set of ground motions, respectively. We demonstrate how this approach could practically work using data from a 52-story building in downtown Los Angeles. Using the criteria and thresholds employed by previous researchers, we show that if peak ground acceleration (PGA) is accurately estimated, this approach can predict the expected level of human comfort in tall buildings.
Introduction
After the initiation of an earthquake, ShakeAlert Earthquake Early Warning (EEW) system estimates the earthquake magnitude and location based on the signals recorded by seismic stations near the epicenter. It then predicts ground-motion intensities across the region using standard empirical ground-motion models. An early warning is issued if the predicted ground-motion intensity surpasses a predefined threshold for a given area, which can provide several seconds to tens of seconds of advance notice before the arrival of ground shaking, depending on the distance between the site and the earthquake epicenter (Given et al., 2014, 2018). More detailed information about the existing ShakeAlert workflow can be found in other published works, such as Böse et al. (2023), Kohler et al. (2020), and McGuire et al. (2021).
Currently, the earthquake intensity prediction is limited to ground-level motion, while residents in multi-story buildings may experience significantly different, and likely amplified, shaking (Çelebi et al., 2016a, 2016b; Çelebi et al., 2020, 2021). This amplification effect is particularly relevant because the EEW system has greater benefits for long-distance earthquakes (Wald, 2020), where the dominant long-period ground-motion components significantly impact the response of tall buildings. However, there is currently no ideal solution that involves precise ground-motion time history and accurate finite element (FE) models of buildings to carry out nonlinear time-history analysis for accurate building response prediction. Consequently, several researchers have attempted to explore alternative approaches to extend the EEW system to include building structures. In a recent study by Ghahari et al. (2022a), the empirical formulas available in FEMA P-58 (2018) and ASCE/SEI 1 7-16 (2017) for estimating peak floor acceleration (PFA) were evaluated using data recorded from instrumented buildings through the California Strong Motion Instrumentation Program (CSMIP). It was demonstrated that these simple formulas are unable to reliably predict PFA, and their accuracy significantly diminishes when the peak ground acceleration (PGA) estimates are inaccurate. Another potential approach is the use of response spectrum (RS) methods; however, this requires an accurate estimation of the modal properties of buildings and the ground-motion RS. While such properties can be inferred from recorded data in instrumented buildings (see, e.g. Cruz and Miranda, 2021), this approach cannot be extended to other buildings that are not instrumented. In addition, the associated uncertainty in these estimations has not been quantified.
Alternatively, the extension of EEW to building response prediction can be considered within a framework similar to the performance-based earthquake engineering (PBEE) methodology of the Pacific Earthquake Engineering Research Center (PEER) (Porter, 2003), aiming to establish a probability-based decision-making framework (Grasso et al., 2007; Iervolino et al., 2007; Wu et al., 2013). Nonetheless, detailed numerical models of buildings on a regional scale are currently unavailable, and even if they were available, it would be computationally infeasible to individually run all of these models in the time-limited EEW setting. A potential solution to this problem is the use of simplified beam models, which can adequately represent the dynamic behavior of tall building structures (Ameri Fard Nasrand et al., 2023; Miranda, 1999; Rostami et al., 2021; Shirzad-Ghaleroudkhani et al., 2017; Taciroglu et al.,2016, 2017). For instance, Cheng et al. (2014) employed a coupled shear-flexural beam (Miranda and Taghavi, 2005) to obtain the probability density function (PDF) of engineering demand parameters (EDPs), such as PFA. Although this performance-based earthquake early warning (PBEEW) approach appears promising, it suffers from several shortcomings, some of which are mentioned in the work by Cheng et al. (2014) as follows:
The beam model is a simplified representation in which several factors, including torsional effects, structural nonlinearity, non-uniform mass/stiffness distribution, soil–structure interaction, variable modal damping ratios, and so on, are neglected. Its results are susceptible to modeling uncertainty, which has not been quantified.
The existing PDF of PFA conditioned on PGA, generated by Taghavi-Ardakan (2006), is developed by analyzing a deterministic beam model, that is, certain parameters, under a set of ground motions recorded at short source-to-site distances, which may not be appropriate for EEW applications.
There may be a more suitable intensity measure (IM) for PBEEW applications, considering that the seismic response of tall buildings is more sensitive to long-period components of the ground motion, which PGA may not adequately capture.
This article addresses the first two issues to enhance the applicability of PBEEW. The authors recently developed a method to quantify the modeling uncertainty associated with the beam model by incorporating errors into the parameters (Ghahari et al., 2022b). While the simple beam still suffers from the mentioned limitations, in this article, we employ this new technique to modify the PDF of PFA conditioned on PGA considering all these sources of uncertainties. Also, as this method is implemented within a Bayesian calibration, the parameter uncertainty is taken into account. It is worth mentioning that the proposed solution for considering modeling/parameter uncertainty is not limited to the beam model and can be applied to any numerical model of a building. Therefore, if detailed FE models of buildings and the necessary computational resources are available, these models can be used within this framework. However, as pointed out earlier, there is currently no such capability for a regional-scale application. To tackle the second issue, a new set of ground motions is collected, which will be used to generate a new set of PDFs. The third point, that is, the selection of an optimal IM, is beyond the scope of this article. The readers can find more details on the optimal IM selection in these references (Baker and Cornell, 2008; Dehghanpoor et al., 2021; Kazantzi and Vamvatsikos, 2015; Zhang et al., 2018).
In the following section, the overall PBEEW framework is described, starting with a concise overview of the PEER PBEE approach. Subsequently, the necessary components to construct this framework are presented. To illustrate the construction of the PDF of PFA conditioned on PGA, a 52-story building located in Downtown Los Angeles serves as the example. Actual strong-motion data recorded by this building during several significant events, particularly the
PBEEW
PEER PBEE
Due to the massive economic losses after the 1994 Northridge earthquake, the seismic design philosophy evolved from force-based to performance-based seismic design (SEAOC, 1995). After deterministic approaches were used in seismic evaluation documents such as FEMA 356 (2000), PEER established a probabilistic framework for PBEE to account for uncertainties associated with various sources (Cornell and Krawinkler, 2000). The idea behind the PEER PBEE is to probabilistically estimate the structural performance by propagating all sources of uncertainties from seismic hazard to decision-making using the total probability theorem. The PEER PBEE process is shown in Figure 1 (Porter, 2003). The objective of this process is to estimate the frequencies at which a particular performance metric would exceed various levels for a given design of a structure. This process consists of four main steps. In the first step (hazard analysis), the seismic hazard at the structure site is evaluated considering the seismic environment (e.g. nearby faults), the structure location, and other information jointly denoted as D. The result of this probabilistic seismic hazard analysis (PSHA) is a hazard curve that describes the annual frequency at which an IM, for example, PGA, exceeds various levels. This term is mathematically represented by a conditional PDF

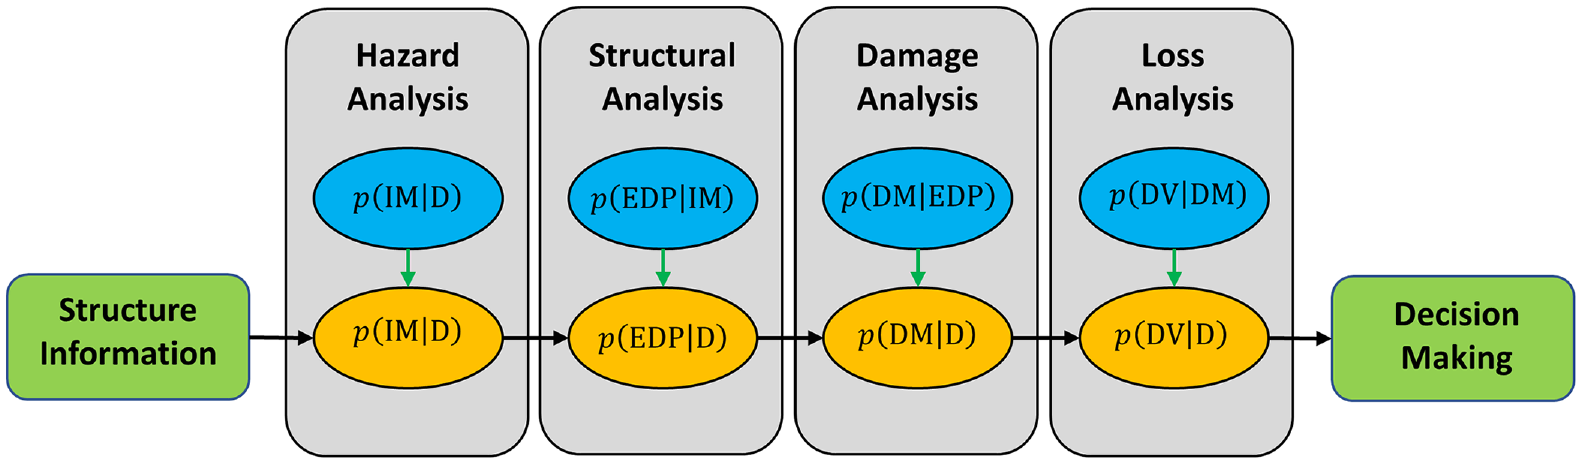
The general framework of PEER PBEE after Porter (2003).
PBEEW
As initially proposed by Grasso et al. (2007) and later extended by Cheng et al. (2014), the PEER PBEE can be modified for use in EEW, as shown in Figure 2. First, PBEEW begins once an earthquake event occurs, eliminating the need for PSHA since the seismic source and properties of the event, such as Magnitude (M), source-to-site distance (R), and site conditions, are known. Instead, a new module (EEW) is added to the PBEE framework, representing source estimation, that is,

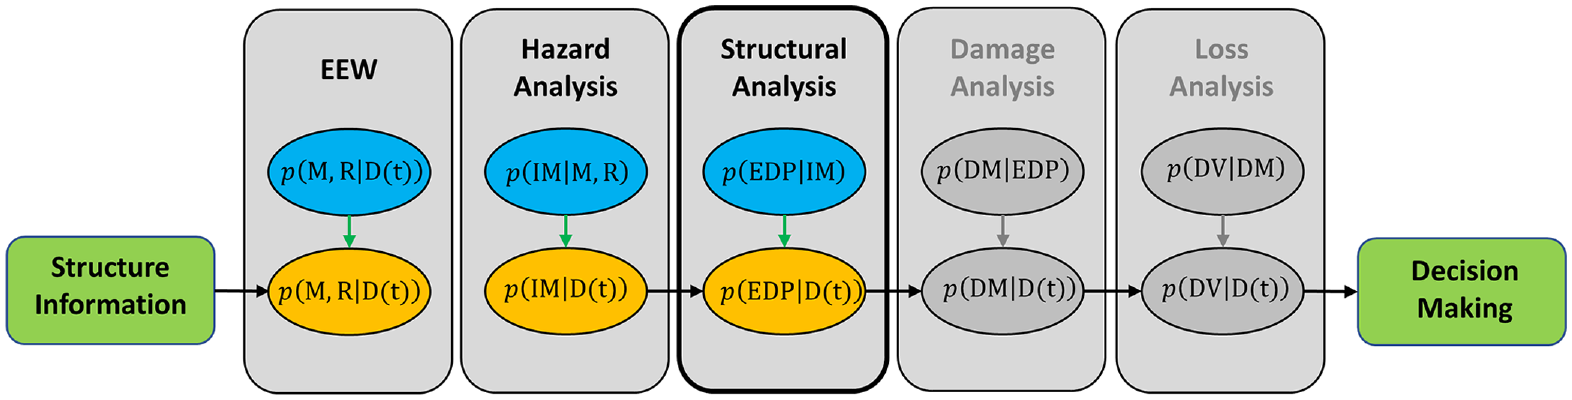
The general framework of PBEEW after Cheng et al. (2014).
Theoretical background
Simple beam model
In this article, PFA is extracted from the absolute acceleration response of a floor and used as an EDP for EEW application. The absolute acceleration response of a building at a normalized height

where

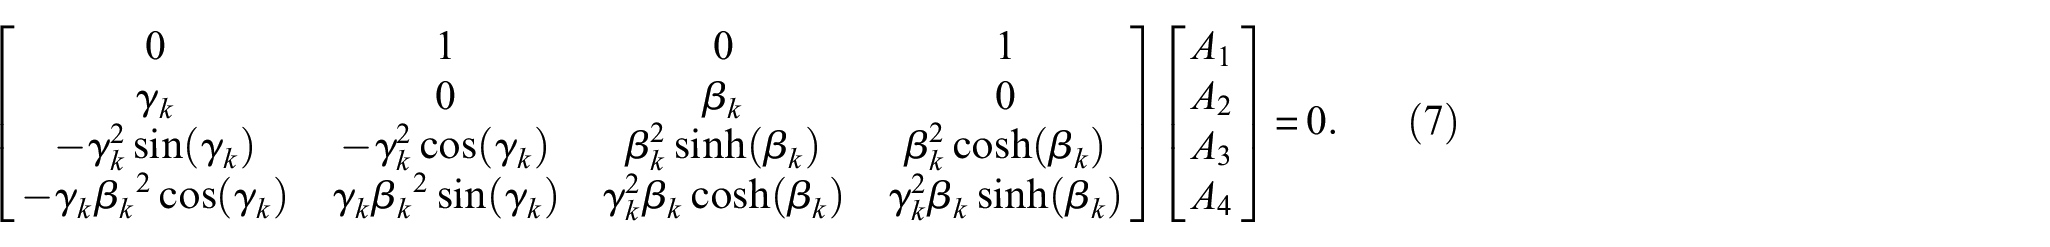
where coefficients

Finally,

where coefficients
Having mode shapes calculated, modal contribution factors are then obtained as:

GMPE
GMPEs, formerly known as attenuation relationships, have played an essential role in seismic hazard analysis (SHA) since 1960 (Esteva and Rosenblueth, 1964). Douglas (2021) summarized these equations, covering the period from 1964 to 2021. GMPEs are statistical models that provide the median (or mean of the logarithm) estimate of the expected ground-motion IM, such as PGA, and its standard deviation for a given earthquake scenario because observed ground-motion intensities exhibit a log-normal distribution. In other words, it assumes that the IM of interest follows a log-normal distribution expressed as:

where
Bayesian model calibration with embedded model error
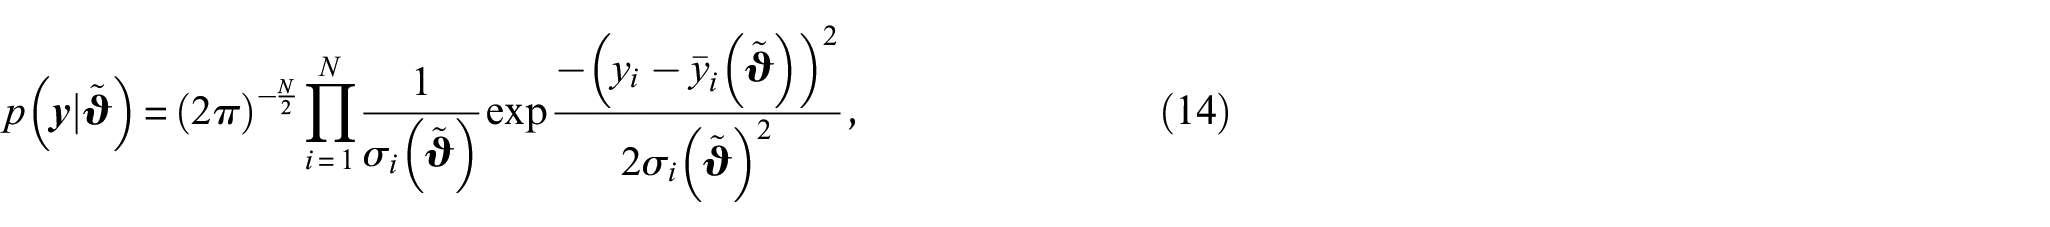
Based on the idea originally developed by Sargsyan et al. (2015, 2019), the authors proposed embedding the modeling error/uncertainty into the parameters of the beam model to quantify the uncertainty associated with any prediction generated by this simplified model (Ghahari et al., 2022b). In this approach, model parameters

where the embedded error term

where

where, in this study,

The function
where


where
In this study, the fundamental period of the structures is assumed to be known and certain to simplify the analyses. This is a reasonable assumption, as the fundamental period can be well predicted or measured. In the case of non-instrumented buildings, it is still recommended to exclude the fundamental period from the parameters into which the modeling error is embedded. This is because it is a physical parameter that can be observed, unlike modal damping ratios, which are inherently uncertain, and α, which is not a directly observable parameter.
AAF
Validation of the beam model
To validate the applicability of the beam model calibrated through the embedded model calibration method, we use data from a 52-story building located in Downtown Los Angeles, which is instrumented through CSMIP (CSMIP Station No. 24602) and has been well studied (Çelebi et al., 2016c; Ventura and Ding, 2000). This calibrated model will subsequently demonstrate the effectiveness of the proposed PBEEW work in real life.
The 52-story building, depicted in Figure 3 (left), was designed in 1990. It comprises 52 stories above the ground and includes 5 levels below the ground. The lateral force-resisting system consists of concentrically braced steel frames at the core, supplemented by outrigger moment-resisting frames. The building has a square-shaped plan, measuring
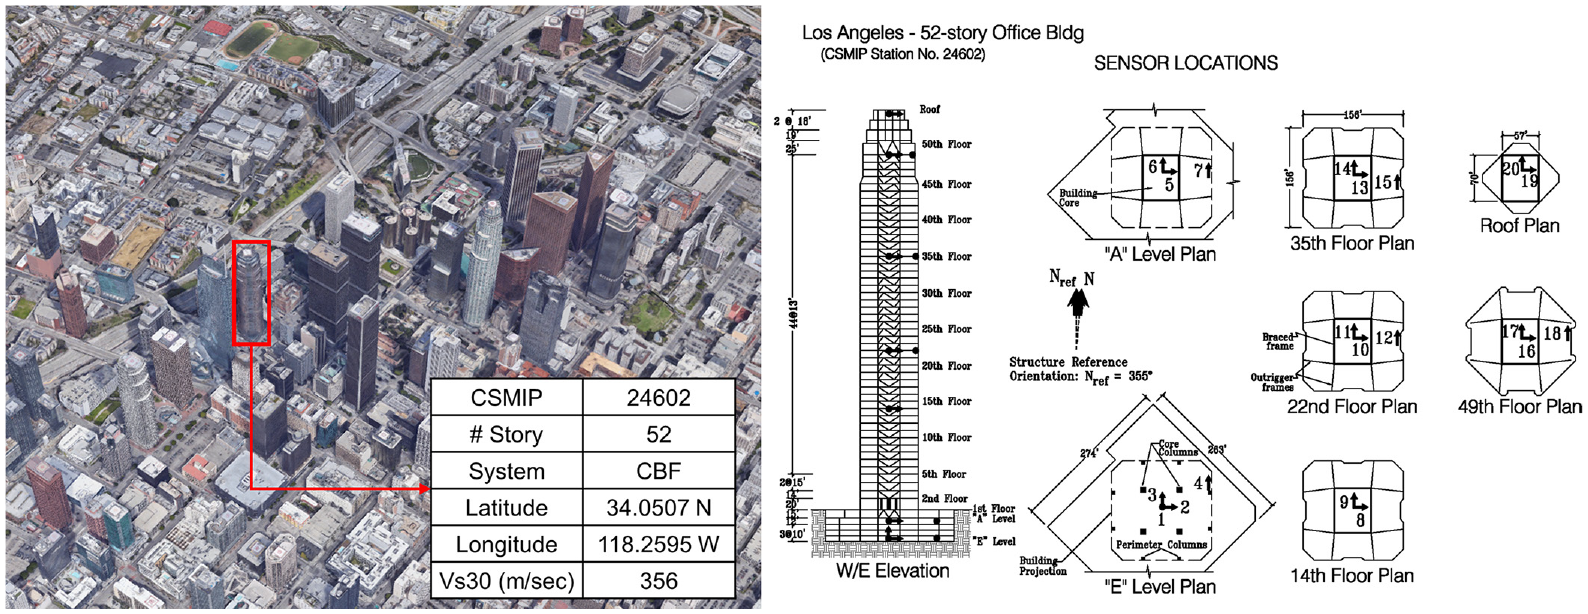
Left: The 52-story building in Downtown Los Angeles (Google view), and right: its seismic instrumentation layout (downloaded from the Center for Engineering Strong-Motion Data (CESMD)).
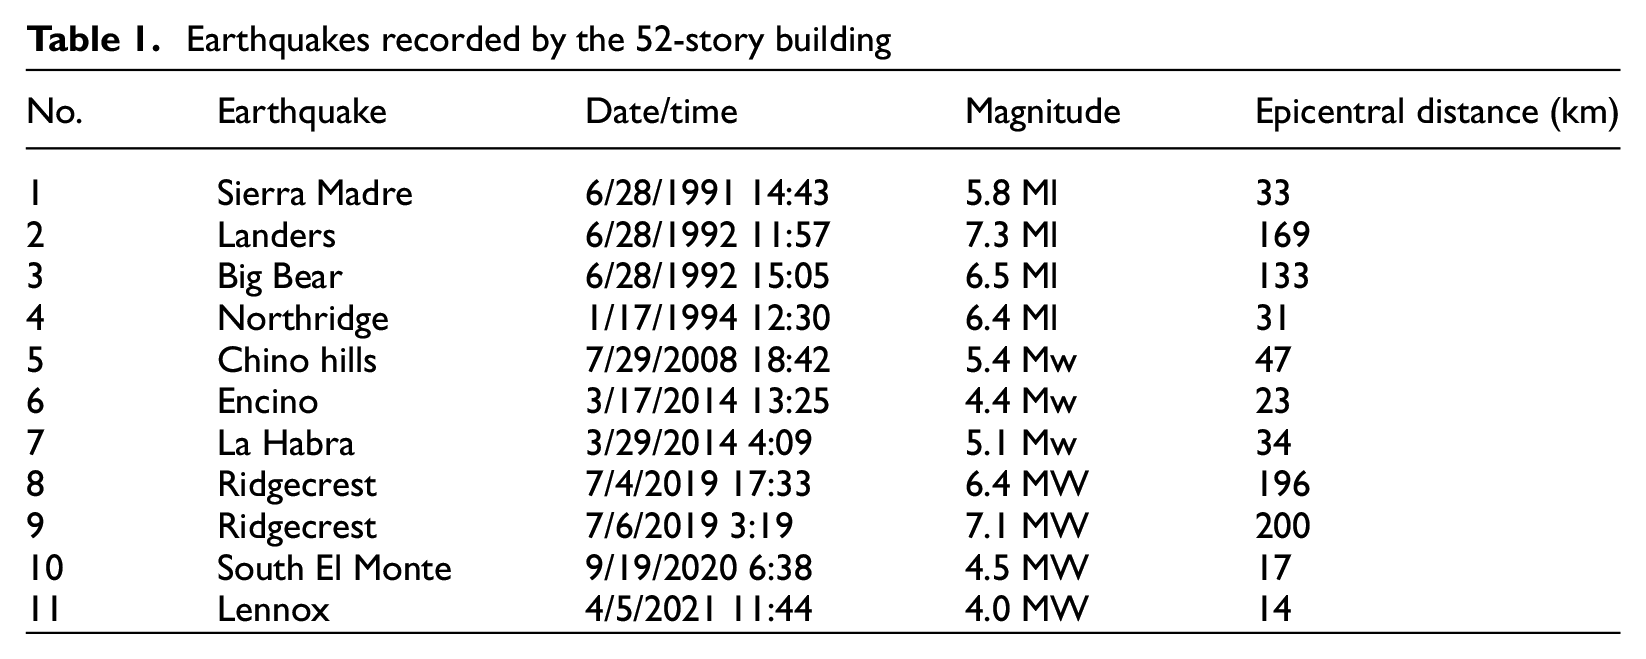
Earthquakes recorded by the 52-story building
AAFs recorded in the east-west direction of the building during the 2019
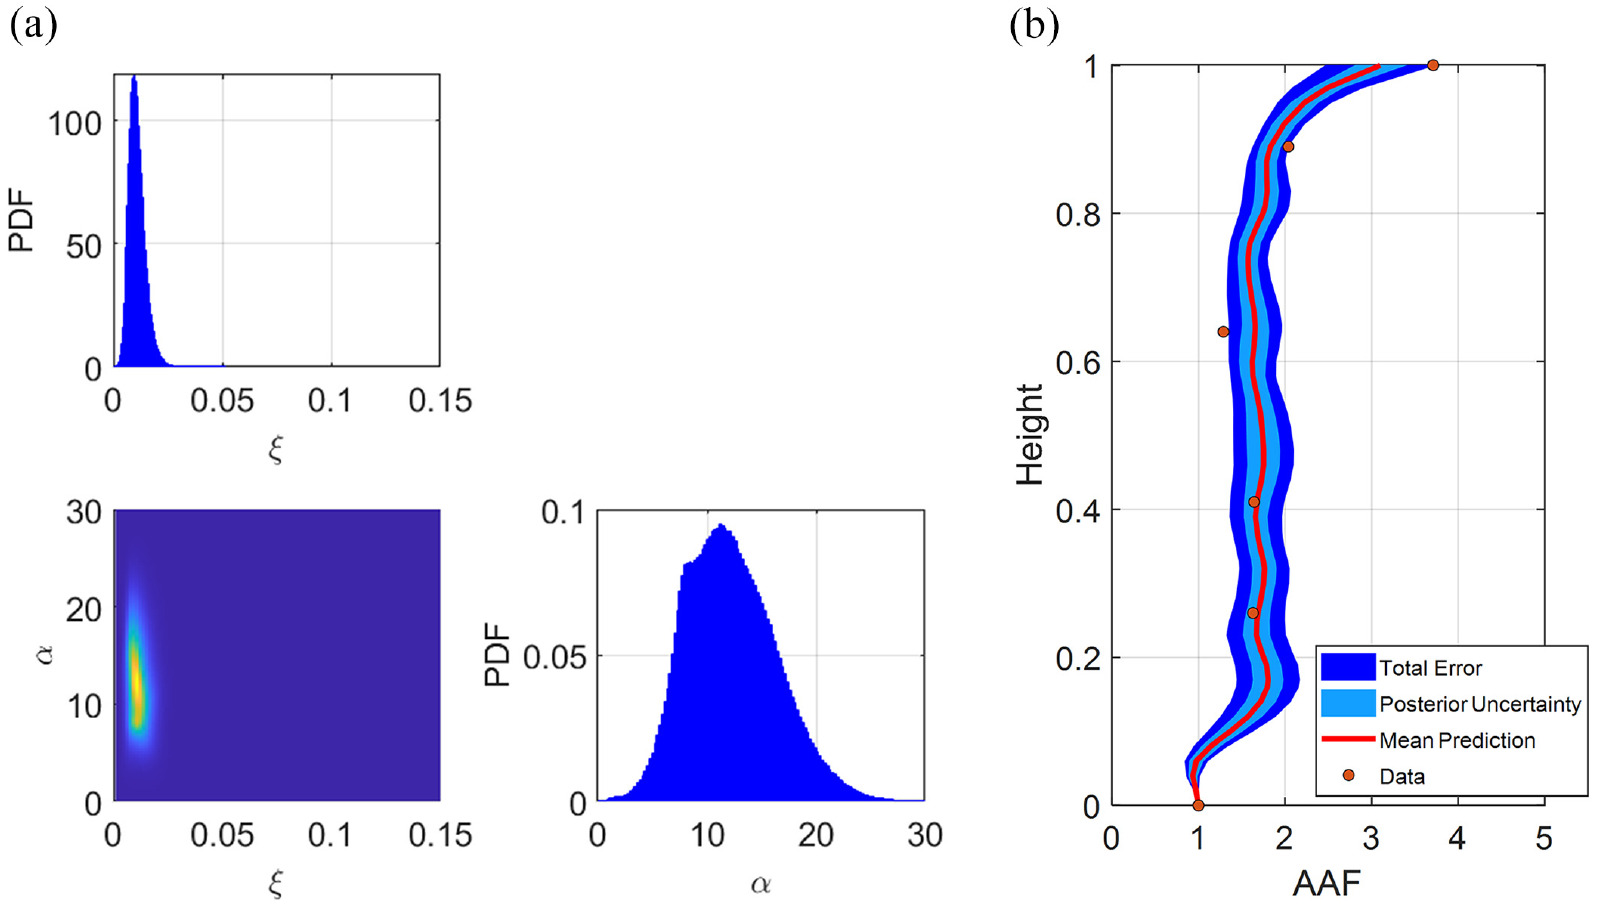
(a) The posterior PDF of the physical parameters, and (b) predicted AAF and the associated uncertainties obtained from the 2019
Figure 5 displays the marginal PDF of AAF along the height of the building in which the PDF increases from blue to red. This figure highlights the areas along the building height where the beam model can predict AAF with high confidence, that is, larger PDF values, while AAF estimation at the roof level is susceptible to significant uncertainty.
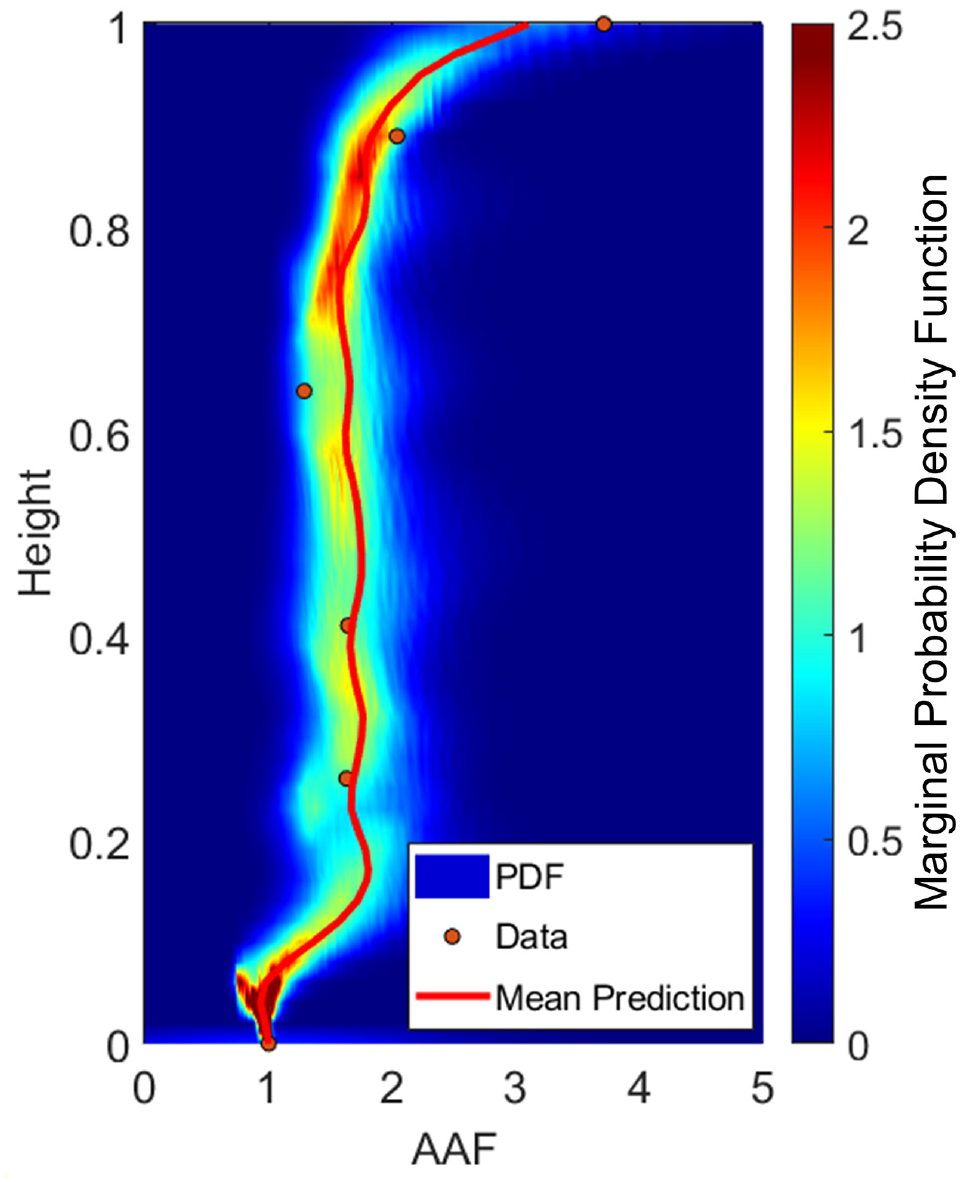
The marginal predictive PDF of AAF along the height of the building obtained from the 2019
To validate the predictive performance of the beam model and assess the estimated uncertainty obtained from the
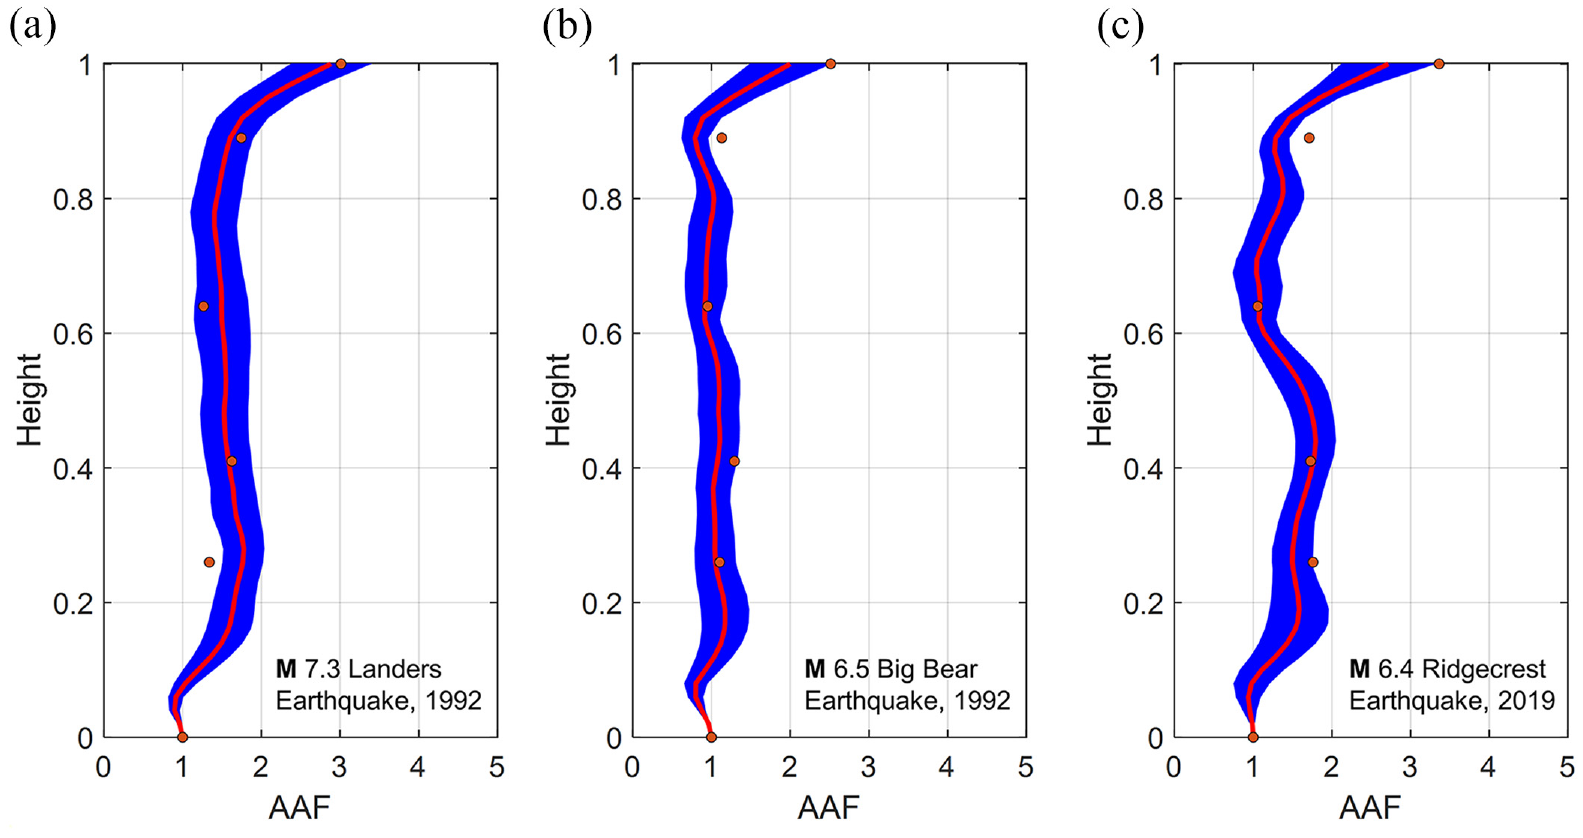
AAF blind prediction for three different long-distance earthquakes (a: 1992 Landers, 1992 Big Bear, and M 6.4 Ridgecrest earthquakes) using the beam model calibrated using the data recorded in
Selected ground motions
Taghavi-Ardakan (2006) used 80 ground motions to develop the probability distribution of AAF using deterministic beam models. These PDFs were subsequently employed by Cheng et al. (2014) to propose the PBEEW framework. The ground motions were initially compiled by Medina (2003) and categorized into four bins based on earthquake magnitude and epicentral distance: “Small magnitude, small distance,”“small magnitude, large distance,”“large magnitude, small distance,” and “large magnitude, large distance.” Here, large magnitude refers to the moment magnitudes ranging from 6.6 to 6.9, and large distance denotes distances between 30 and 60 km. However, as previously mentioned, these ground motions are not suitable for EEW applications since they do not originate from large and long-distance events.
In this study, alongside the existing set of 80 ground motions collected by Taghavi-Ardakan (2006), which will be referred to as the “old set,” a new set of ground motions from California events is collected from NGA-West2 database (Ancheta et al., 2014) according to the following criteria:
Earthquake magnitude greater than M 6.0;
Source to site distance between 50 and 250 km;
Using these criteria, 150 ground motions are selected from the following earthquake events: 1971 M 6.6 San Fernando Valley, 1989 M 6.9 Loma Prieta, 1992 M 7.3 Landers, 1992 M 6.5 Big Bear, 1994 M 6.7 Northridge, and 1999 M 7.1 Hector Mine earthquakes. The distribution of PGA versus earthquake magnitude and source-to-site distance of these records are shown in Figure 7. In this figure, the median PGA predicted by the GMPE used in this study by Boore et al. (2014) is also shown for all six earthquake magnitudes. In addition to the distribution of the records, this figure emphasizes the fact that the GMPE PGA is mostly underestimated at long distances which will be the case for the 52-story building under the 2019 M 7.1 Ridgecrest earthquake as will be shown later. Note that data from the two 2019 Ridgecrest earthquakes are excluded from this set and reserved for later use as test data. This newly collected set of ground motions is hereafter referred to as the “new set.” In addition, as these ground motions will be subsequently used to analyze the 52-story building with a fundamental period of around 6 s, a subset of 75 records with the lowest usable frequency of 0.1 Hz is chosen. Figure 8 illustrates the 5% damped spectral acceleration of both sets of records, with all records scaled to have PGA = 1. The figure also presents their mean spectrum. Notably, the new set exhibits greater richness in the mid- and long-period ranges compared to the old set. As will be shown later, this new set of ground motions results in a better PFA prediction. So, further studies on the ground-motion selection can improve the performance of the proposed PBEEW. For example, conditional spectrum (see, e.g. Baker and Lee, 2018) or scenario-based simulations (Aagaard et al., 2010) can be employed to collect more suitable ground motions.
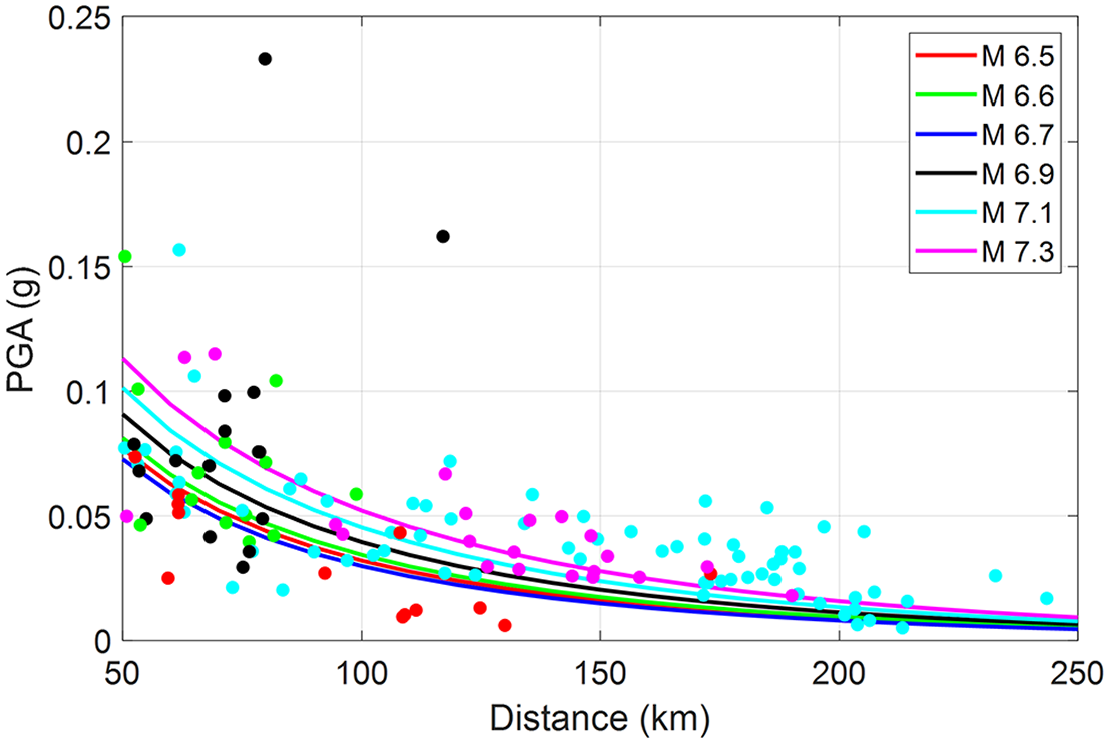
The magnitude-distance-PGA distribution of the selected ground motions, and corresponding median PGA, predicted by GMPE (Boore et al., 2014) with the site condition of the 52-story building.
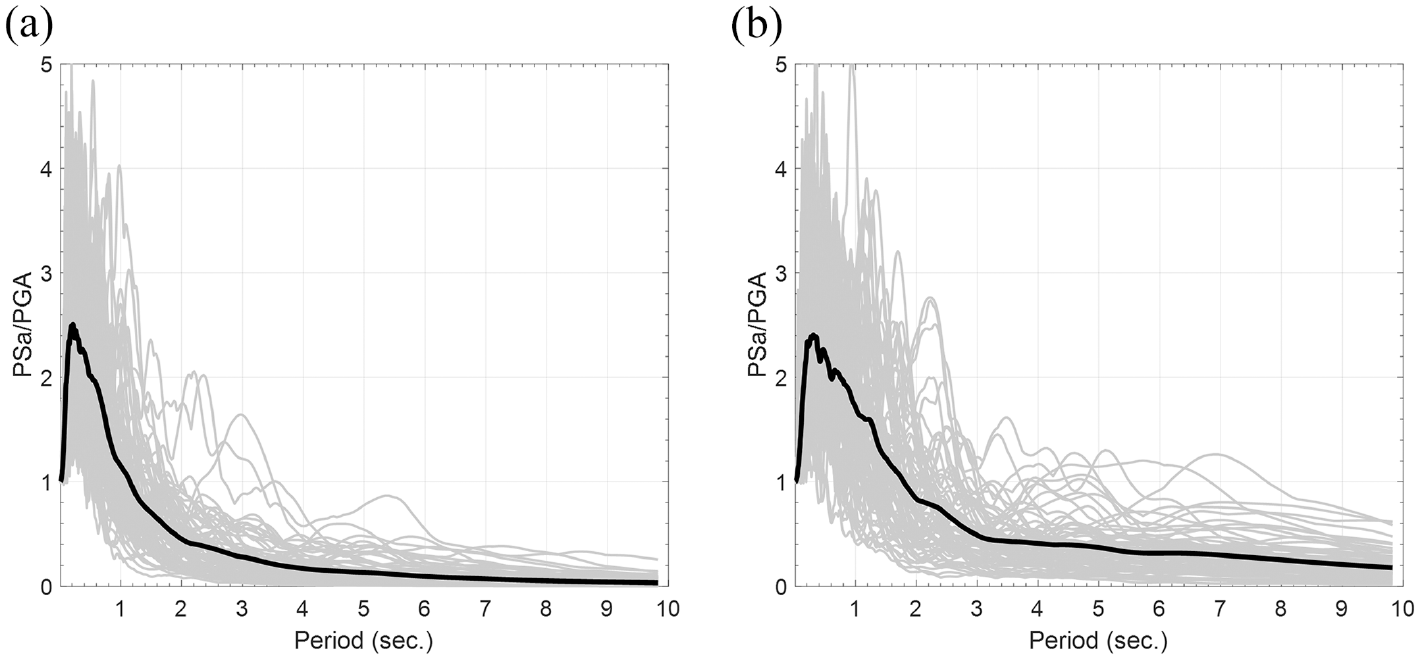
Scaled 5% damped acceleration response spectra of all ground motions in (a) Taghavi’s (old) and (b) this study’s (new) sets.
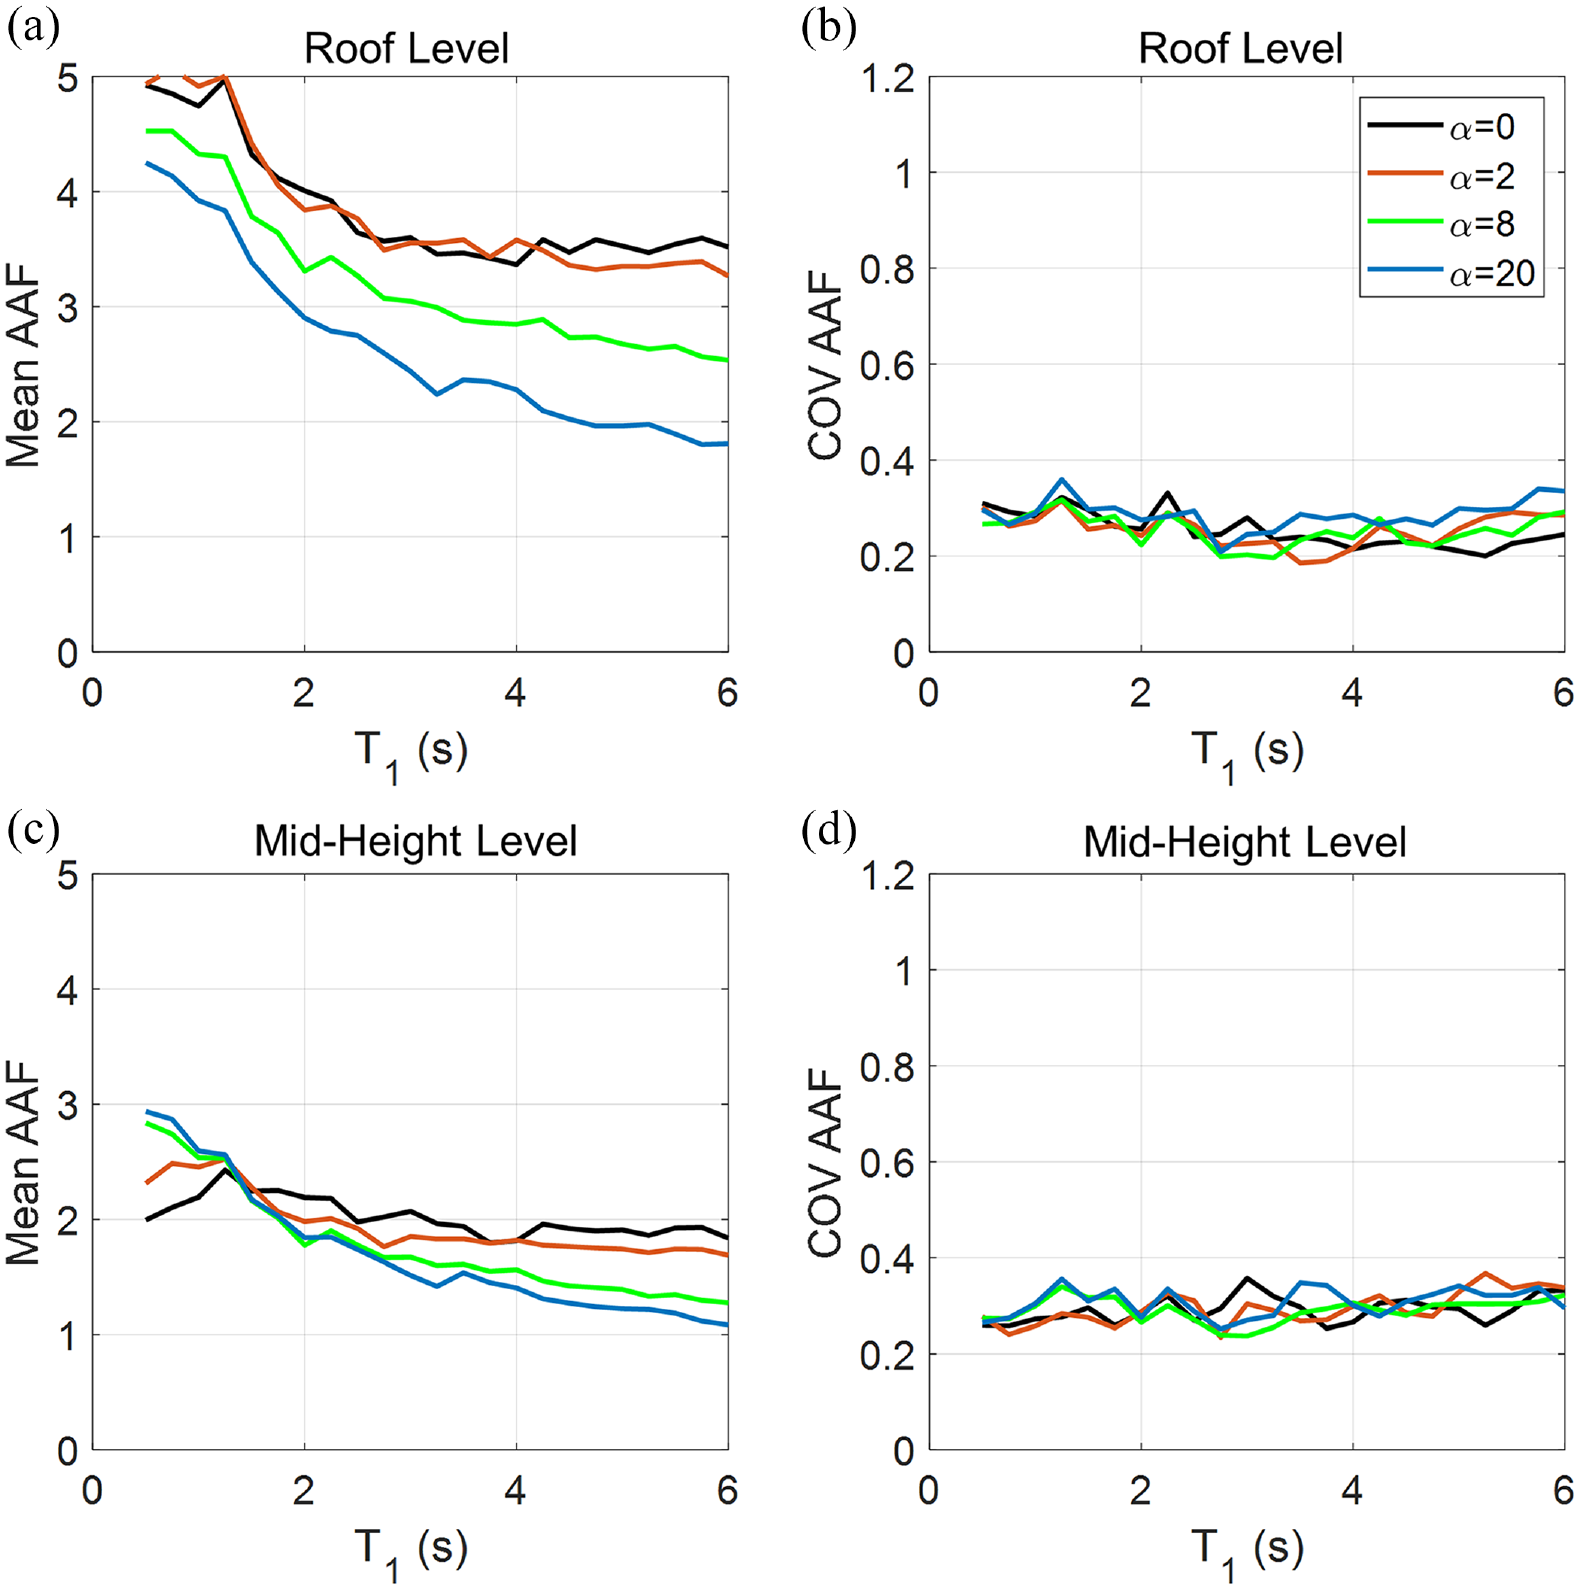
To observe the impact of record-to-record variability on the response of the beam model, deterministic beam models with various
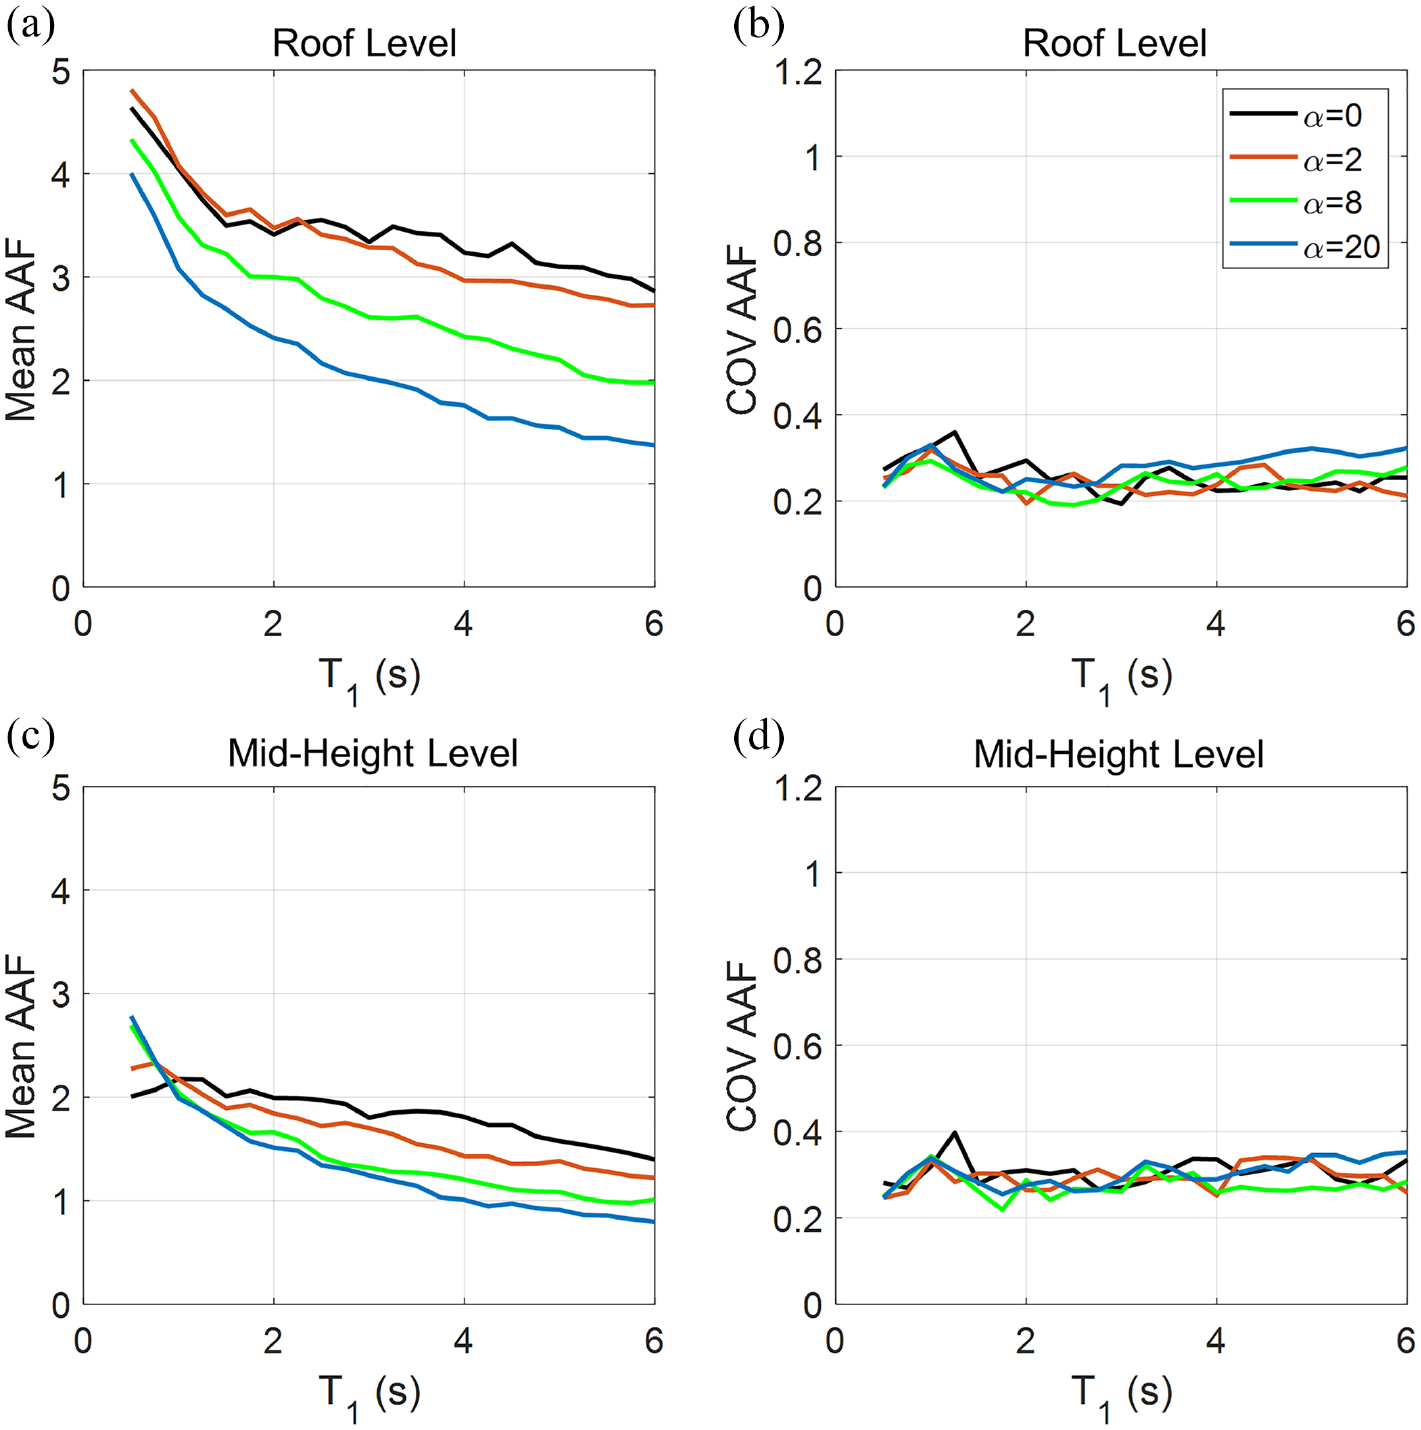
Mean and coefficient of variation (COV) of AAF at the roof (a and b) and mid-height,
Mean and COV of AAF at the roof (a and b) and mid-height,
Peak roof acceleration conditioned on EEW data
PDF of AAF
Assuming the beam model as a deterministic model, Taghavi-Ardakan (2006) developed PDFs of AAF for various
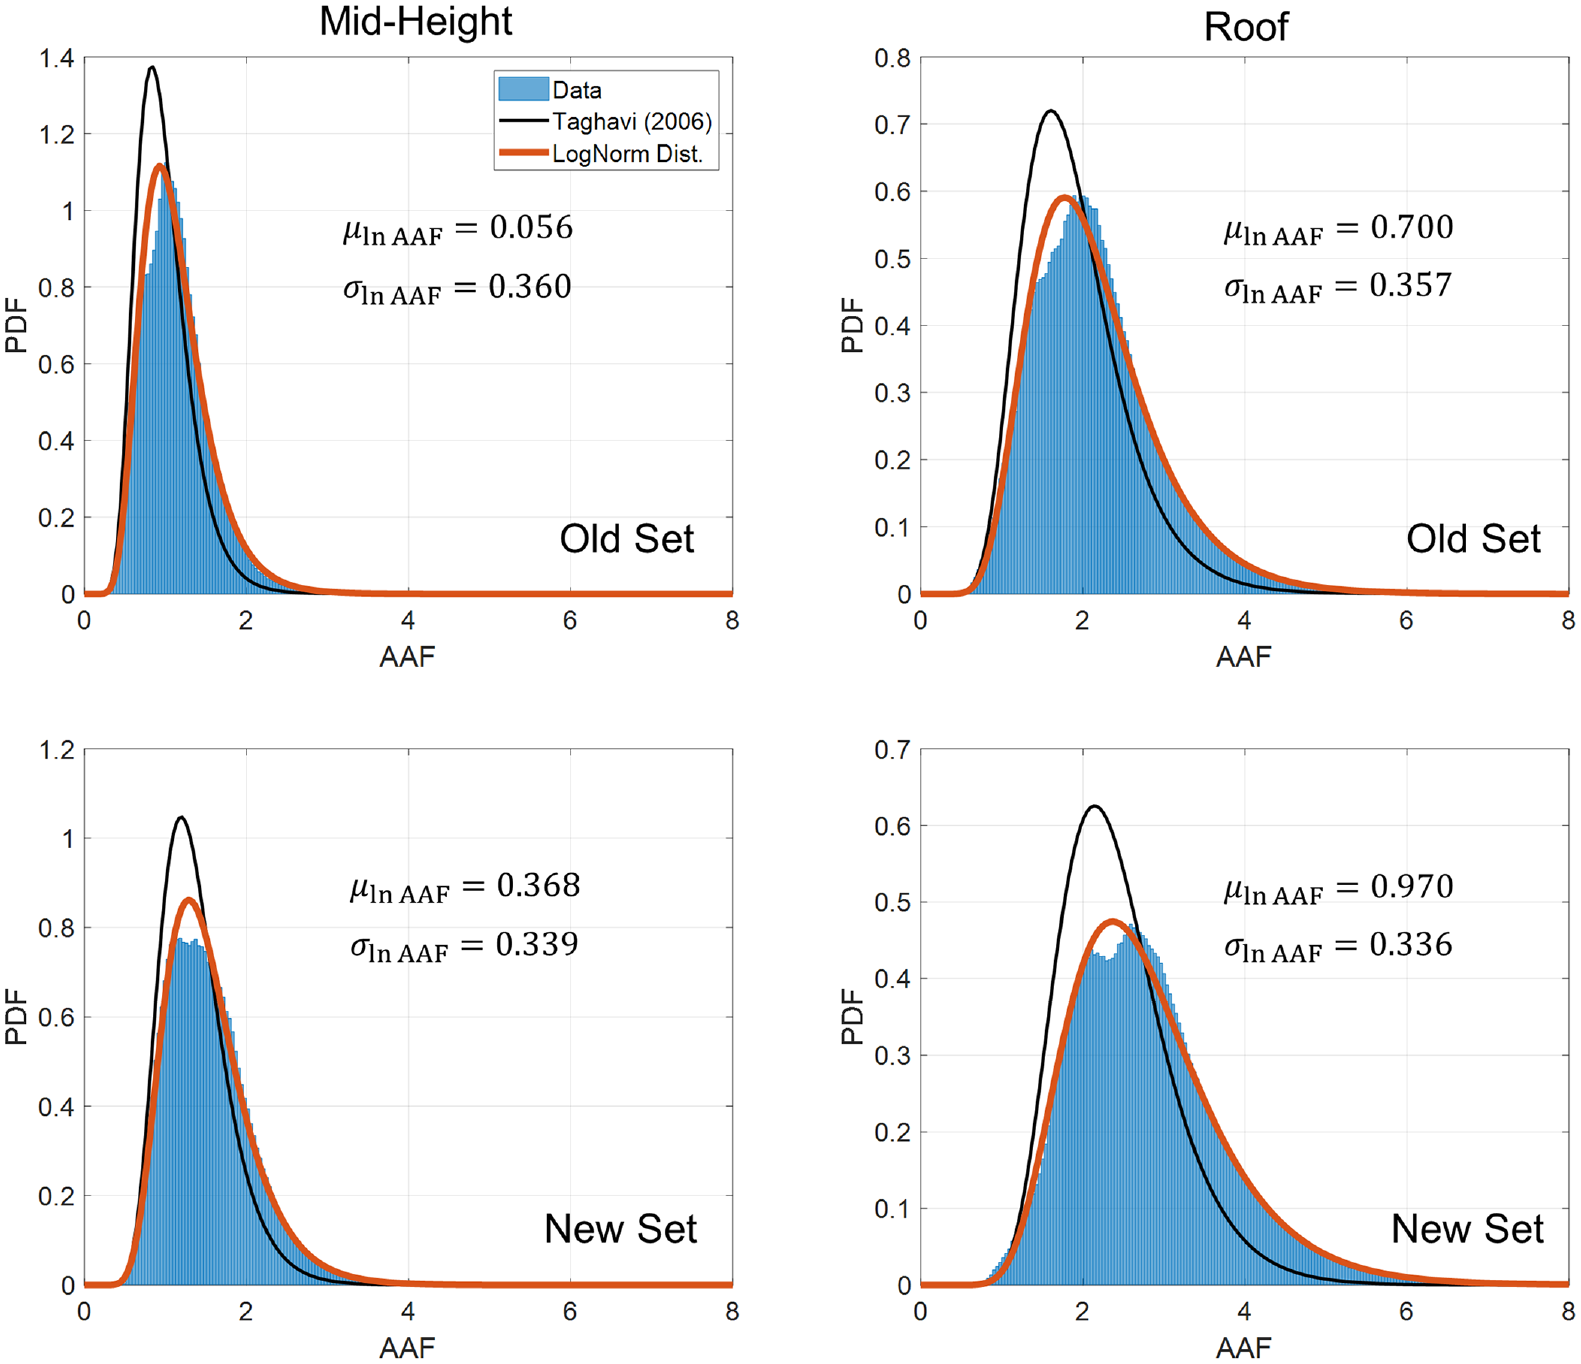
The estimated PDF of AAF at two levels of the 52-story building obtained using old and new sets of ground motions. The parameters of the new log-normal distributions are shown on each subplot.
Before showcasing the final outcome of the proposed PBEEW framework in the next section, Figure 12 is presented to demonstrate the variation of the AAF PDFs along the height of the building. This figure illustrates the median AAF and logarithmic standard deviation of AAF for both sets of ground motions. It can be observed that while both sets of motions exhibit the same total variability, encompassing modeling and record-to-record variability, the median AAF is higher under the new set of ground motions.
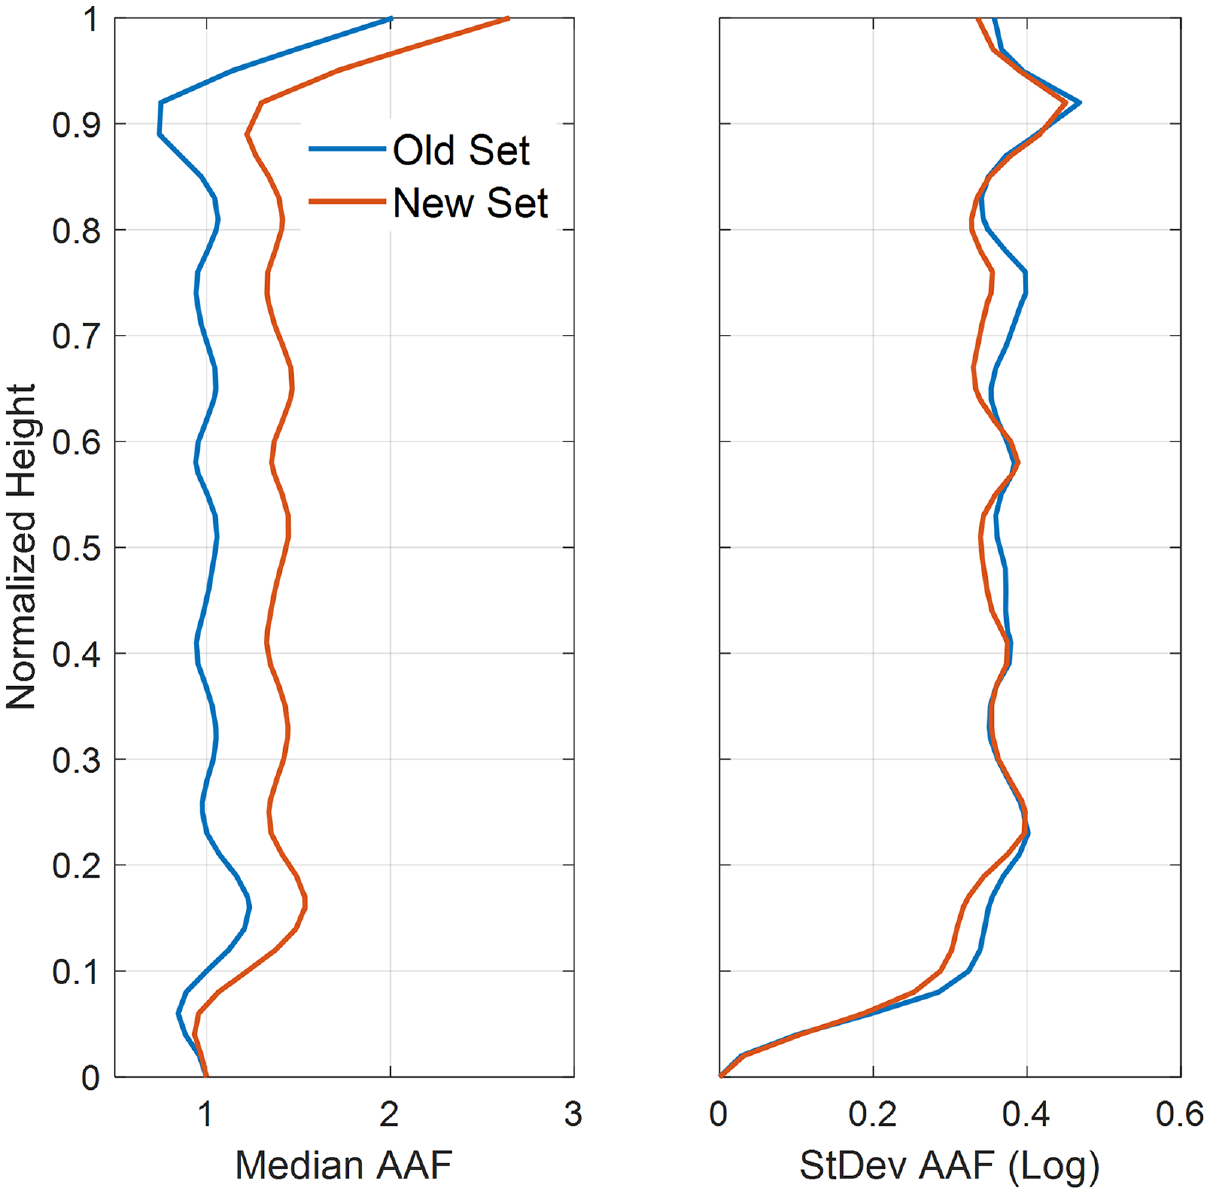
The estimated median and standard deviation of PDF of AAF along the height of the 52-story building under old and new sets of ground motions.
PDF of PFA
Having the log-normal distribution of

where

where
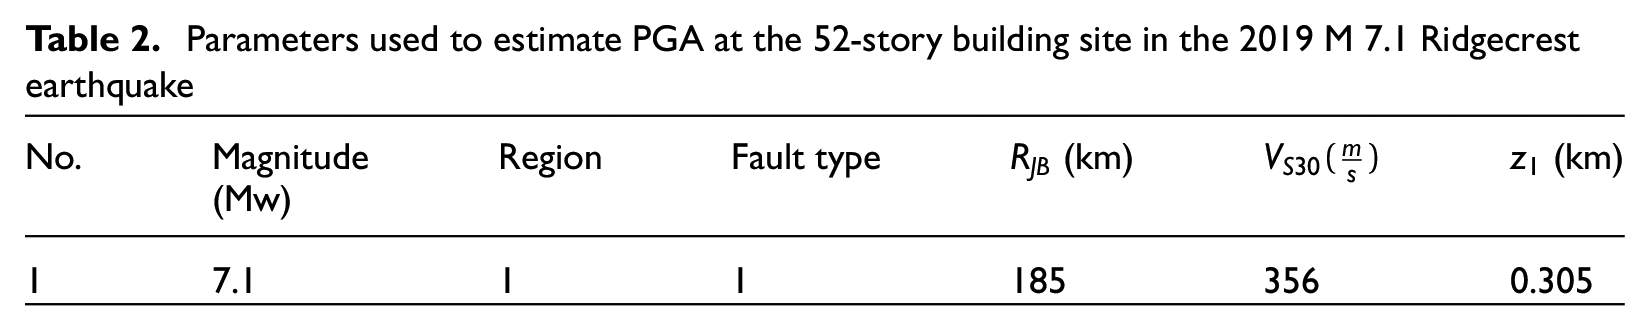
PDF of PFA conditioned on 2019
Parameters used to estimate PGA at the 52-story building site in the 2019 M 7.1 Ridgecrest earthquake
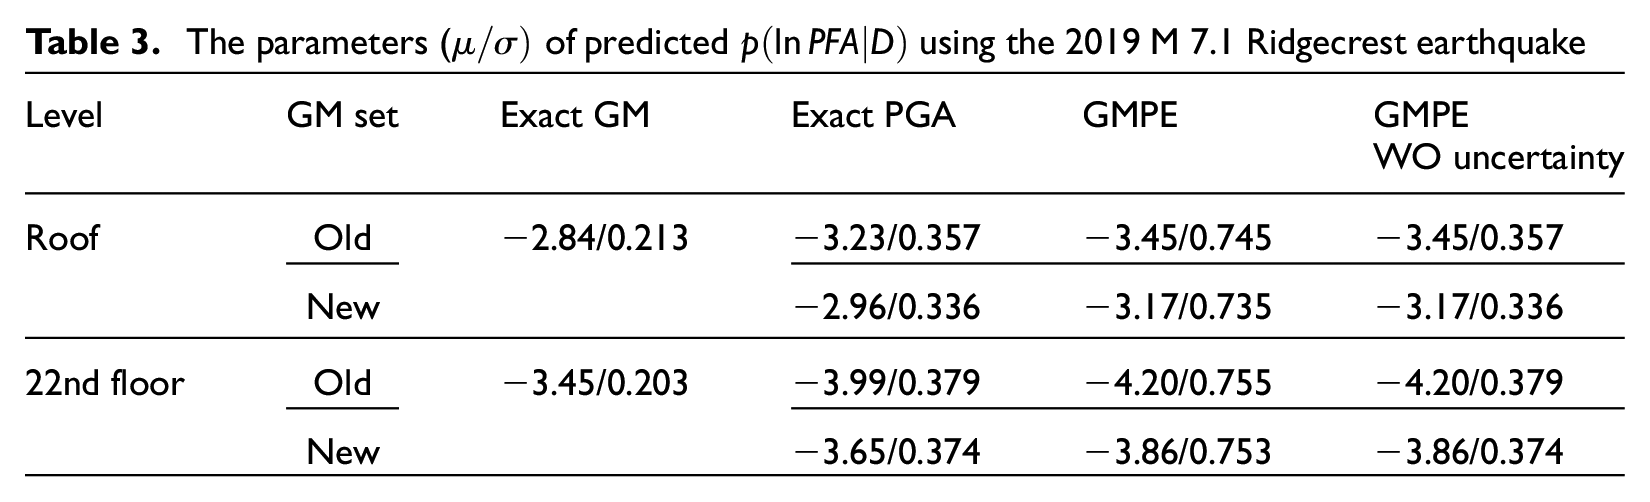
The parameters (
While this study is limited to demand estimation, and a full PBEEW framework is beyond the scope of this work, herein we present a few ways in which these demand PDFs can be directly used for real EEW. As discussed by Cheng et al. (2014), the estimated floor PFA can be used as follows:
Alert residents if floor acceleration exceeds the human comfort level (Boggs and Petersen, 1997), or if non-structural damage is expected and, thus the residents should drop, cover, and hold on;
Stop the elevators if the acceleration exceeds the serviceability limit (Kubo et al., 2011);
Halt acceleration-sensitive equipment. such as magnetic resonance imaging units in hospitals.
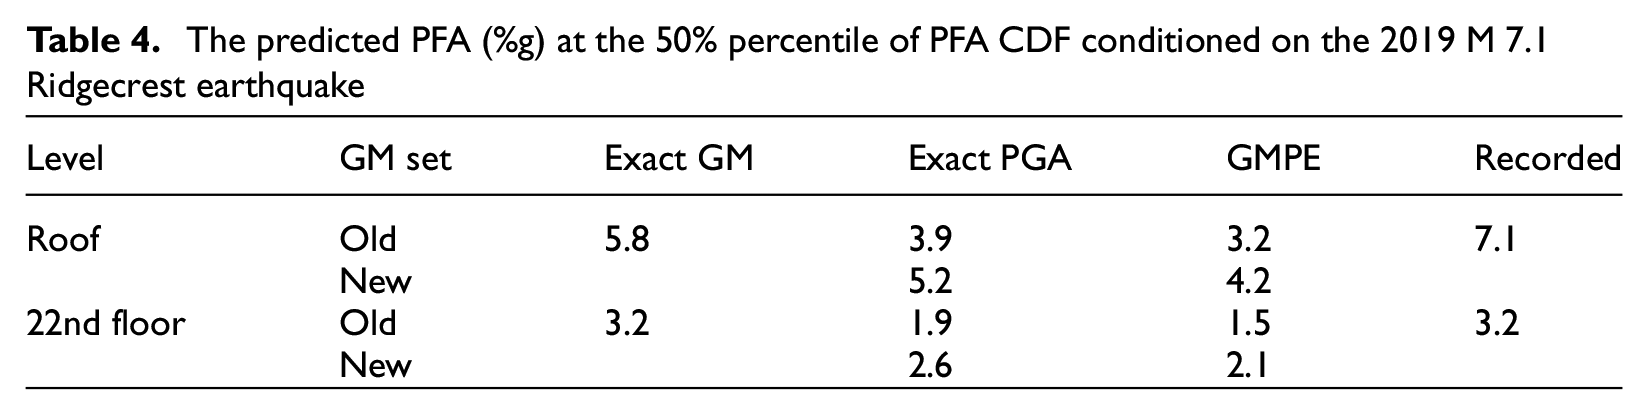
Here, as an illustration, we use the estimated PDFs to determine if a human comfort warning would have been issued for the 52-story building in Downtown Los Angeles if the PBEEW was in effect during the 2019 M 7.1 earthquake. According to the results obtained from wind tests (Griffis, 1993), Cheng et al. (2014) adopted the following human comfort classes: “Not perceptible,”“Threshold of perceptible,”“Annoying,” and “Very annoying” for PFA values less than 0.5%g, between 0.5%g and 1.5%g, between 1.5%g and 5%g, and above 5%g, respectively. We employ both the “mean-value” and “most-probable” methods to obtain the expected PFA from the estimated PDFs and compare them with the specified thresholds. In the “mean-value” method, the PFA at the 50% percentile of the cumulative distribution function (CDF) of
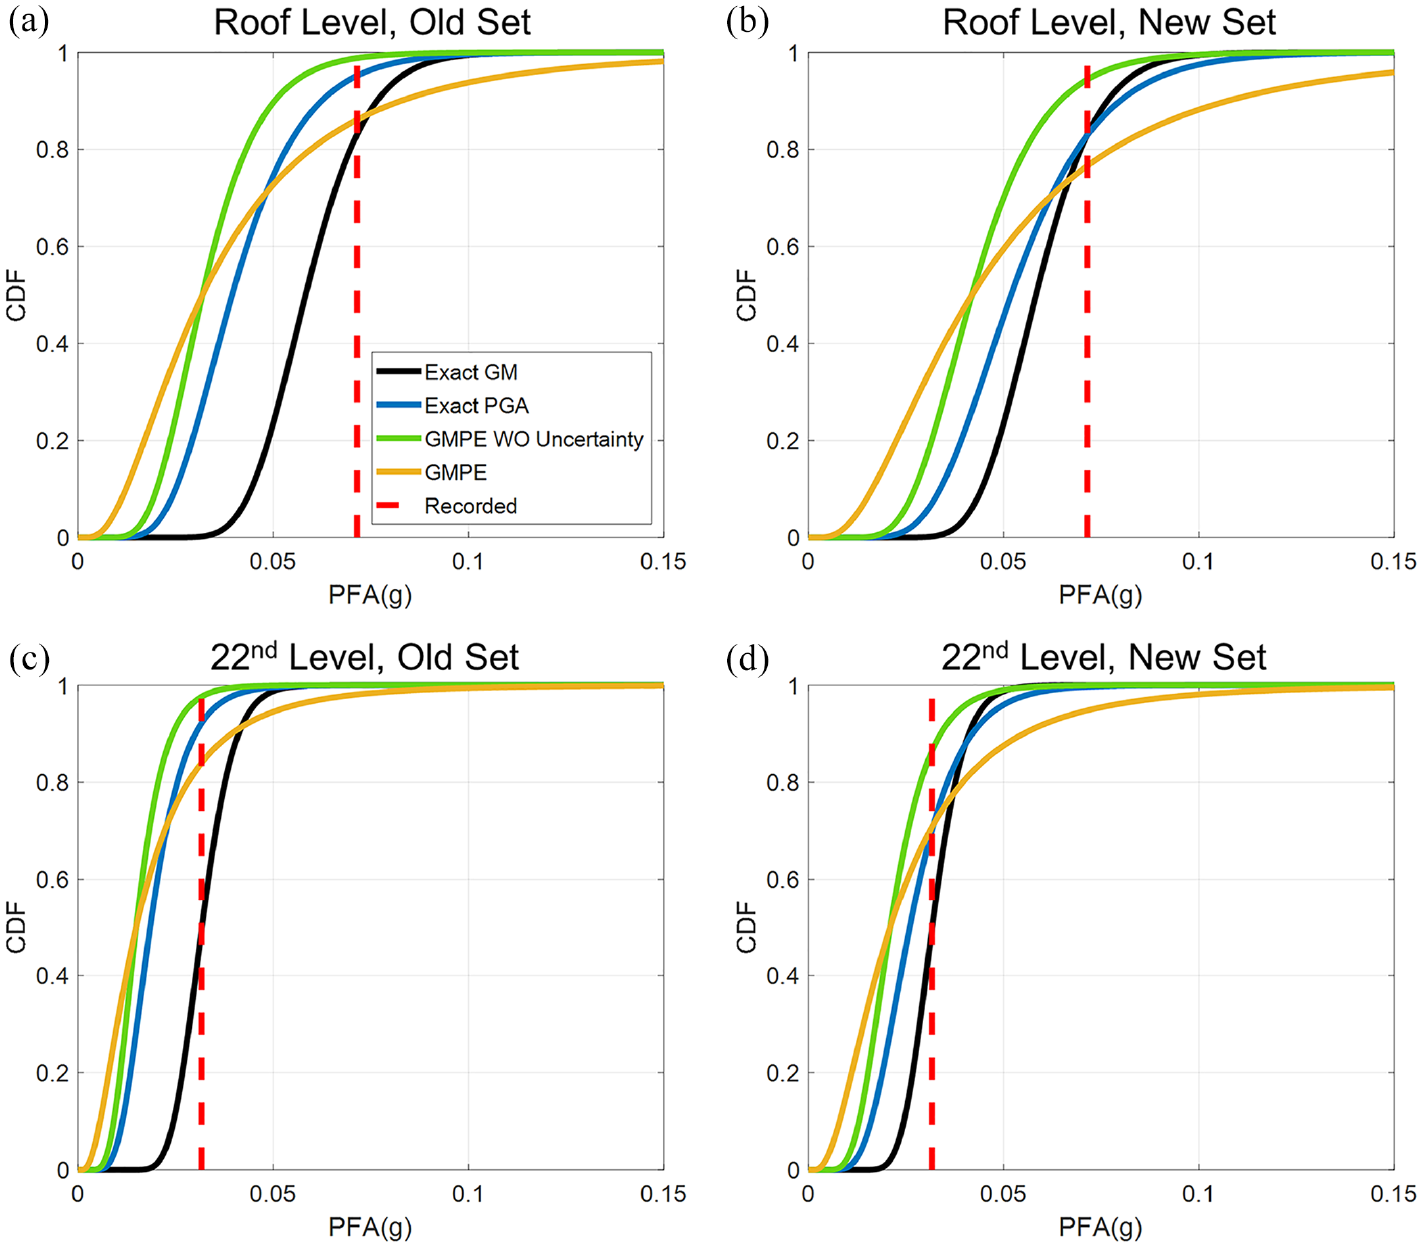
Cumulative distribution functions (CDFs) of PFA conditioned on 2019
The predicted PFA (%g) at the 50% percentile of PFA CDF conditioned on the 2019 M 7.1 Ridgecrest earthquake
The predicted comfort level in two levels of the 52-story building during the 2019 M 7.1 Ridgecrest earthquake estimated using the mean value method
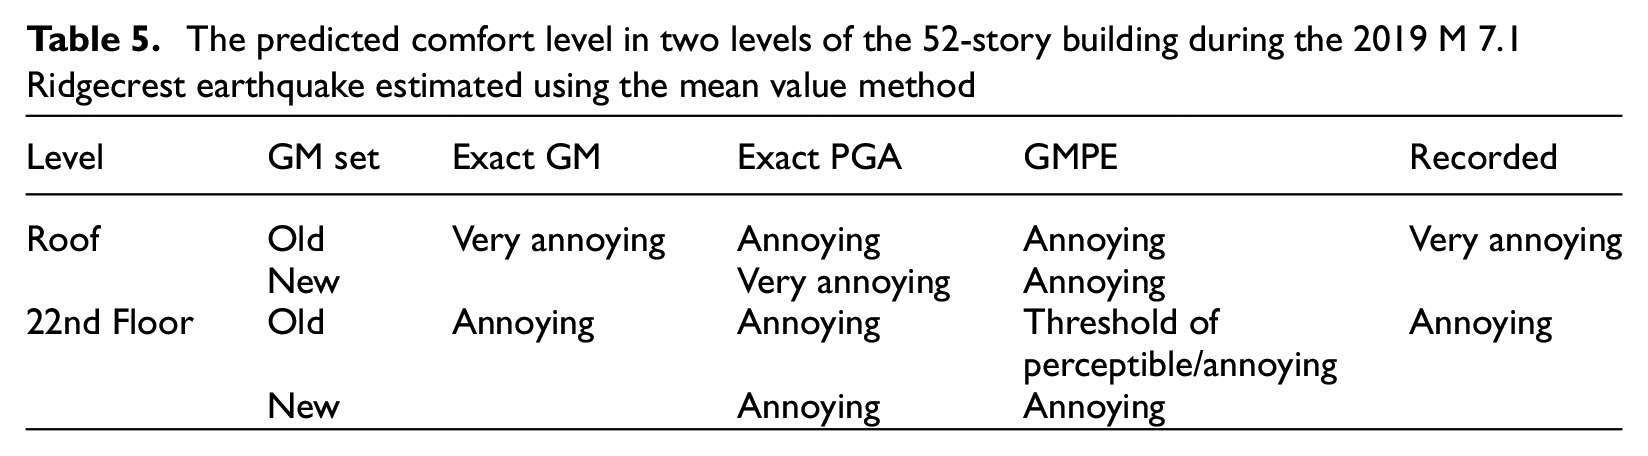
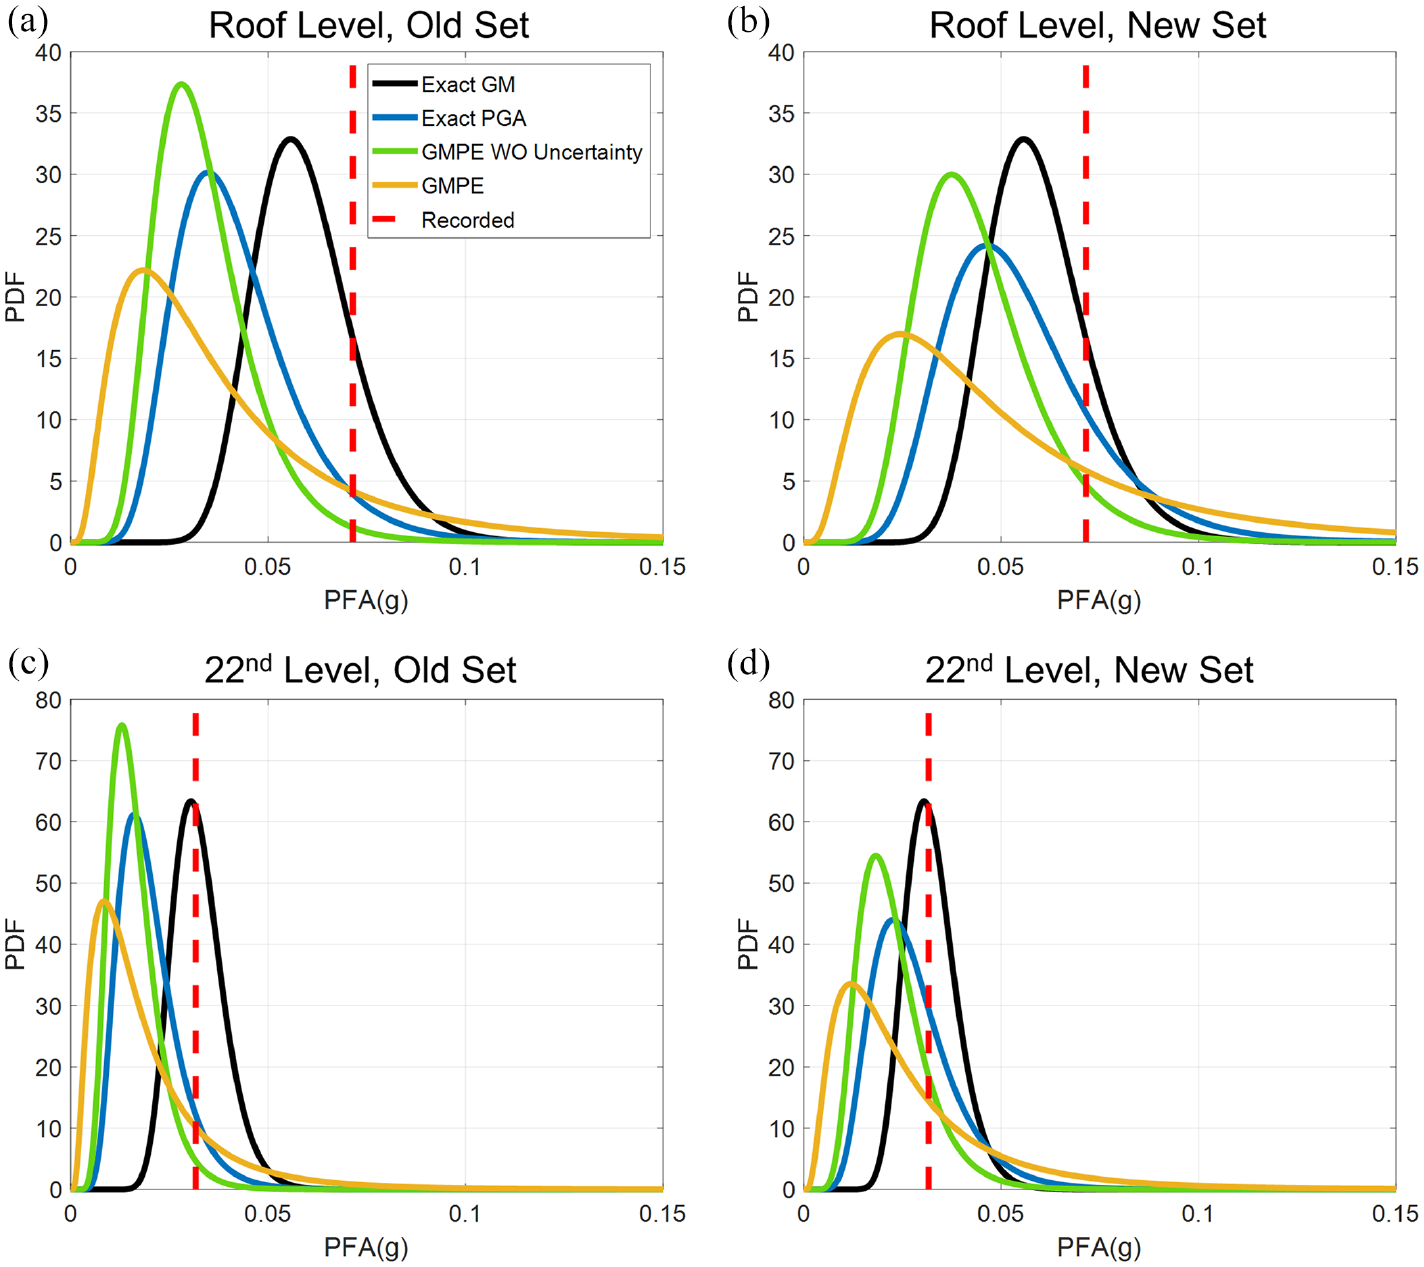
The alternative approach to determine the comfort level is to use the “most-probable” method, which calculates the area of the PDF between those thresholds. Figure 15 displays these areas for the roof level in various scenarios. While there is no direct ground-truth decision that can be considered for this method, assuming “Very annoying” as the correct comfort level at the roof level using a single measurement (see the last column of Table 5), the stochastic beam model, under exact ground motion or exact PGA (provided that the demand model is generated using the new set of motions), is capable of providing such a prediction. Although using the new set of ground motions enhances the prediction using GMPE estimated PGA, it still predicts an “Annoying” level of motion at the roof. A similar figure for the 22nd floor is shown in Figure 16. Accepting the “Annoying” level as the actual occurrence at this level during the 2019
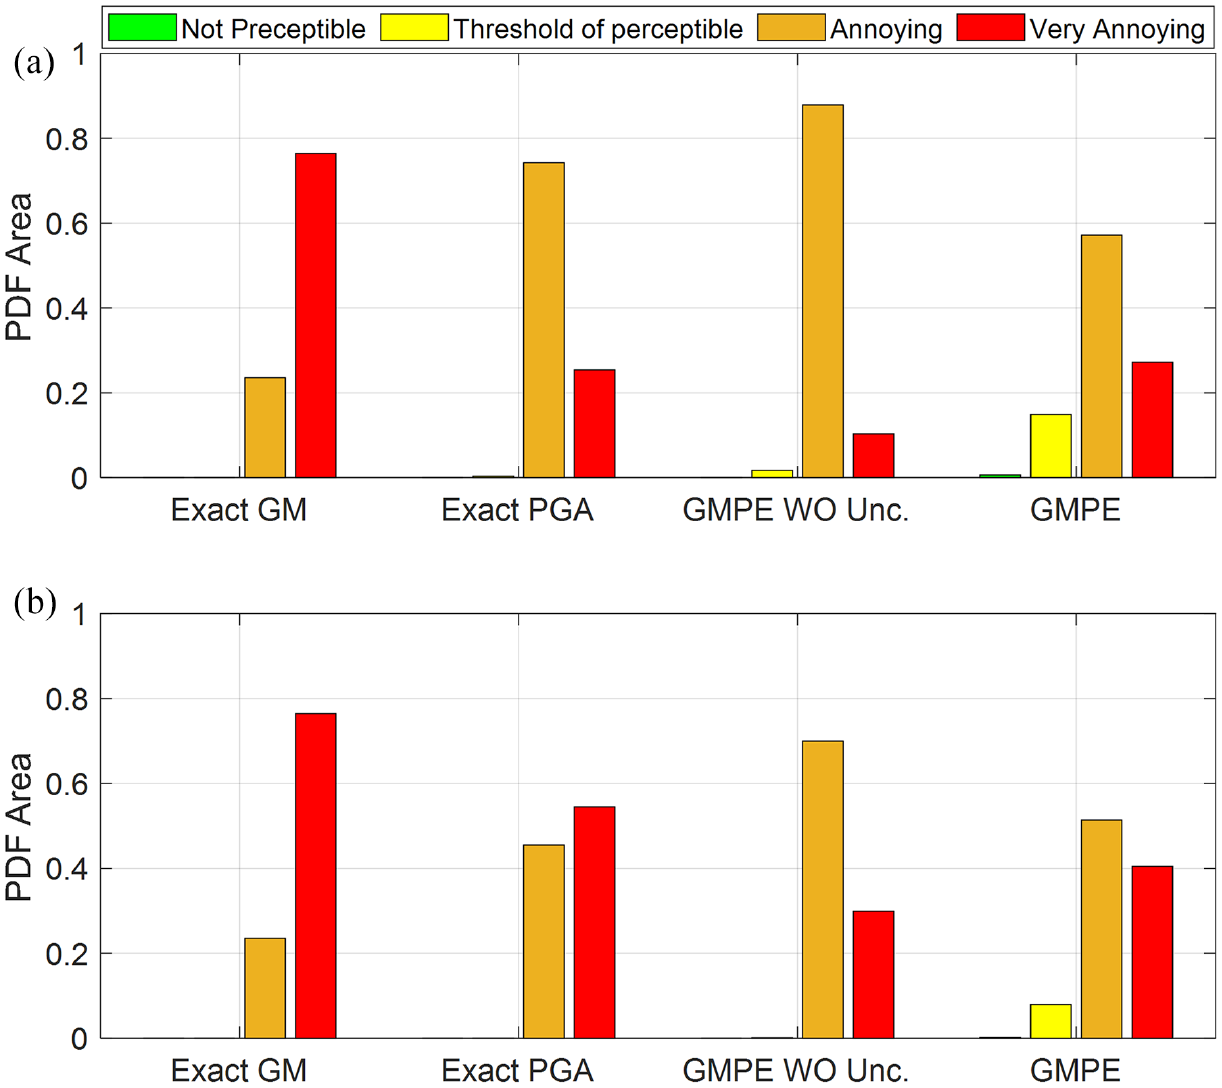
The most-probable comfort level at the roof of the 52-story building during the 2019
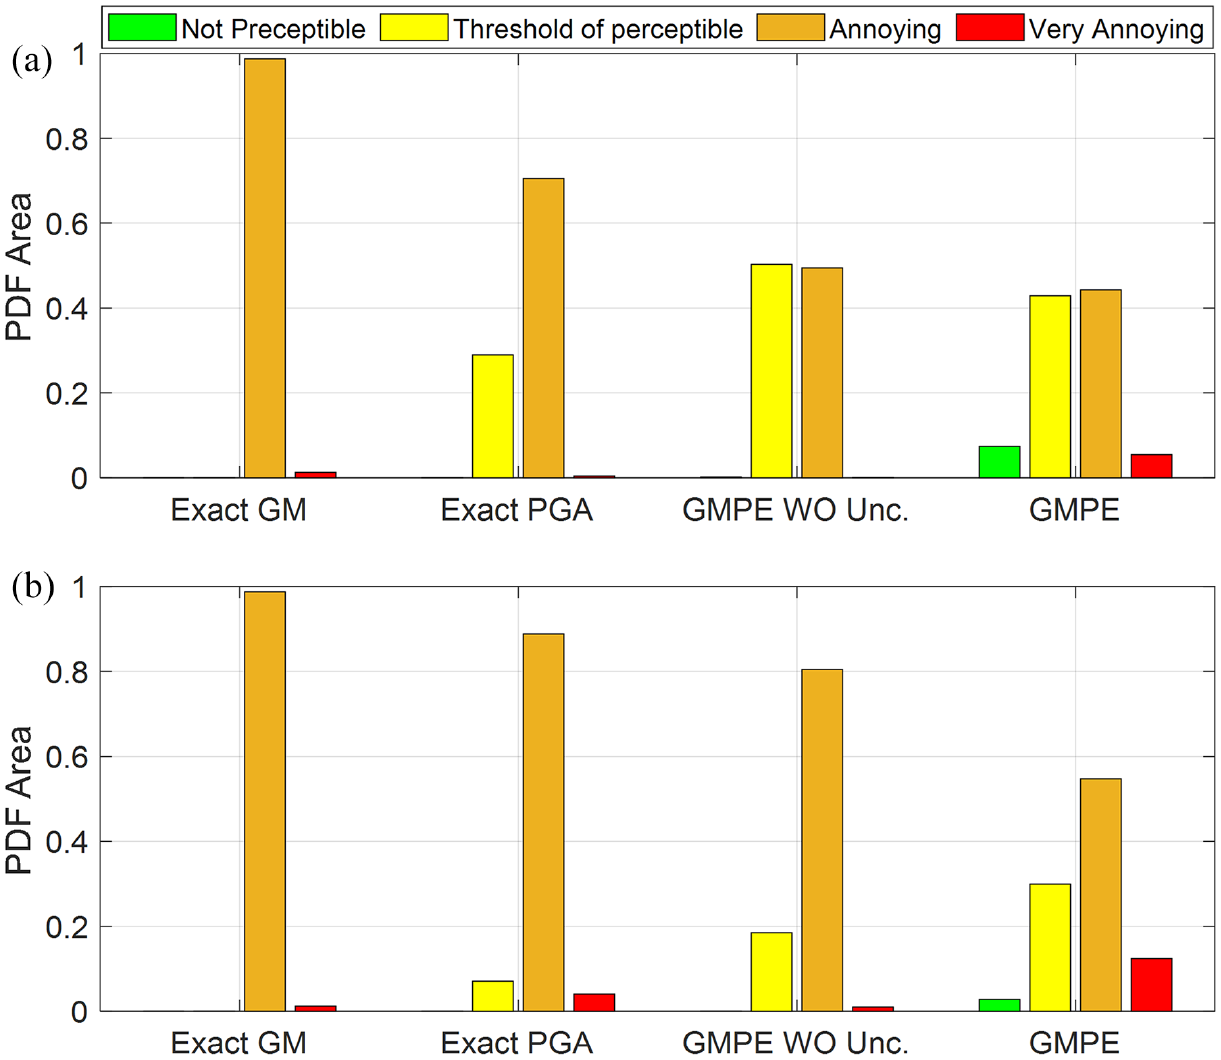
The most-probable comfort level on the 22nd floor of the 52-story building during the 2019
We conclude this section by presenting Figure 17. This figure illustrates the predicted probability of exceedance (1-CDF) of PFA along the height of the building in the M 7.1 Ridgecrest earthquake, which was derived from the estimated PGA using the GMPE and the new set of records. Contrary to Figures 12 and 13 which are limited to two specific levels, this plot represents the likelihood of encountering PFA exceeding specific levels at different heights that provide valuable insights for future studies and establishing thresholds. For instance, the red dashed line represents the probability of observing a PFA equal to or greater than 2%g along the height of the building. The intensity of the color at the position of this line indicates the varying probability of observing PFA exceeding 2%g at different heights, ranging from 10% at lower levels to approximately 50% in the middle, and nearly 100% at the roof.
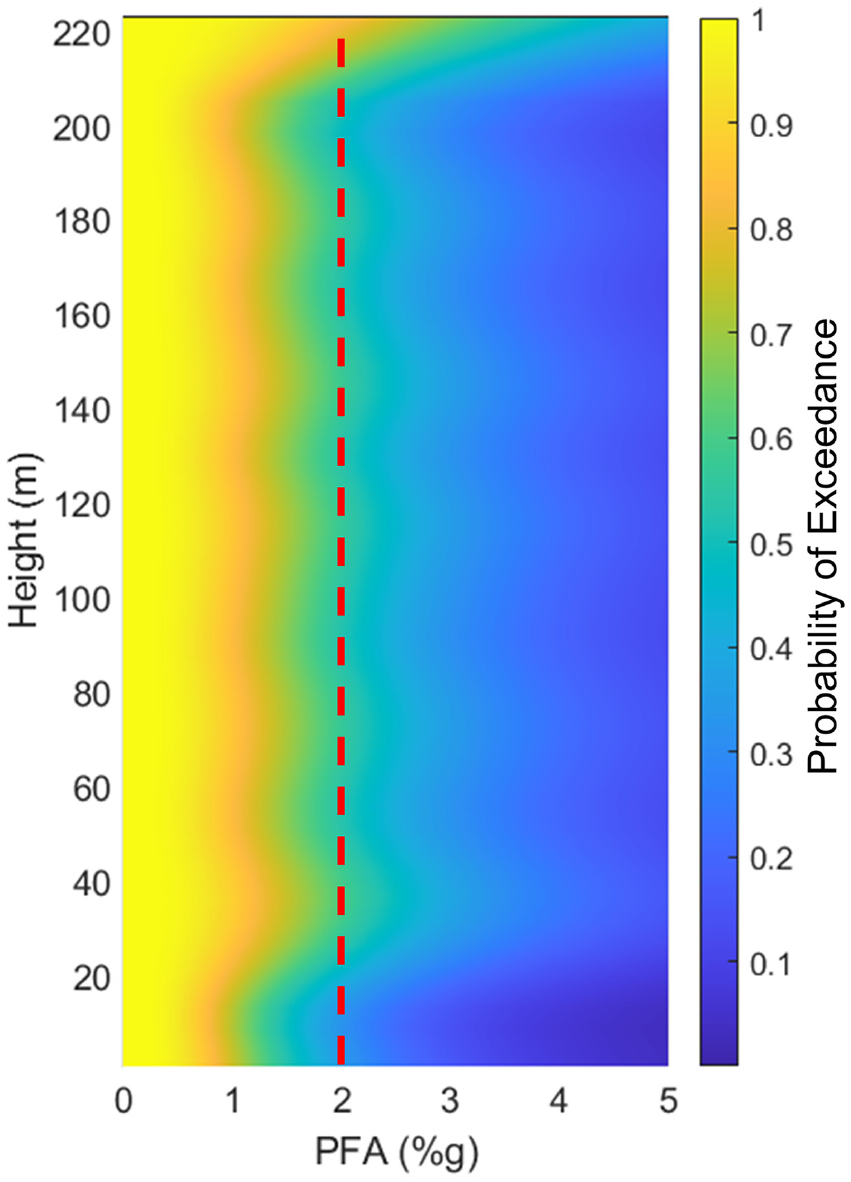
The probability of exceedance of PFA along the height of the 52-story building obtained using GMPE-estimated PGA and the new set of ground motions. As an example, the probability of observing PFA greater than 2%g along the height of the building varies from 10% at the lower level to around 50% at the middle to almost 100% at the roof.
Conclusion
The existing ShakeAlert EEW system provides a warning to residents on the West Coast of the United States if the expected ground shaking intensity (Modified Mercalli intensity) exceeds a certain threshold. However, individuals inside buildings are likely to experience different, usually higher, levels of shaking (acceleration, velocity, displacement) due to the dynamic response of the buildings. Amplification levels are typically much greater for residents of tall buildings during long-distance earthquake events, for which the EEW system works better. The recent 2019 Ridgecrest earthquake events clearly highlighted this limitation of the existing warning strategy. The ideal solution would involve running detailed numerical models of the affected buildings, considering the expected ground-motion time history, to predict building responses and issue appropriate alerts. However, currently, such an analysis is theoretically and practically unfeasible. The expected ground-motion time histories cannot be accurately predicted, numerical models of the buildings might be unavailable, and time-history analysis, especially on a regional scale, is laborious, time-consuming, and undermines the purpose of EEW. A recent study by the same team revealed that the available simple formulas are unsuitable for estimating PFA unless modal properties of the building, and accurate ground-motion response spectra, are available. This article takes a different approach and attempts to extend the PEER PBEE to EEW, considering the fact that every component involved in building prediction is uncertain. This idea is not new and was originally proposed by other researchers, but it suffered from two shortcomings: (1) the simple beam model used for response prediction is susceptible to modeling uncertainty (due to, e.g. assuming linear elastic behavior, neglecting 3D behavior, neglecting soil–structure interaction effects, etc.) which had not been quantified, and (2) the ground motions used for the probabilistic demand model (the probabilistic relationship between IM and EDP) were not suitable for EEW applications.
In this article, we addressed these two issues by incorporating modeling errors into the parameters of the beam model and using a new set of ground motions, respectively. While validating this extended PBEEW requires studying numerous instrumented tall buildings, we used data from a 52-story building in Downtown Los Angeles to demonstrate the practicality of this approach. The criteria and thresholds for comparing the estimated PFA are beyond the scope of this study, but using those employed by previous researchers shows that if PGA, the IM used in this and previous studies, can be accurately estimated, this approach can predict the correct level of human comfort in tall buildings. It is noteworthy to mention that the current EEW system provides the PGA at regions expecting shaking. Additionally, the mean and standard deviation of AAF PDF at every building could be pre-calculated. So, the only operation that needs to be done to obtain the mean and total uncertainty of PFA is a simple addition as shown in equation 18. Thus, the proposed extension does not contribute to additional processing time.
Several remaining issues need to be addressed for the PBEEW approach to be implemented in real-life situations. To apply this approach on a regional scale, stochastic beam models of various types of buildings are necessary. This can be accomplished using data from available instrumented tall buildings and employing data analysis techniques to determine hyperparameters that control the distributions of the beam model’s parameters. PGA is not a sufficient and efficient IM, especially when used for tall buildings under potentially long-distance events because it is a high-frequency IM. So, a different IM may improve the results and reduce the record-to-record variability. Finally, regardless of the chosen IM, the results would depend on the accuracy of its value and its associated uncertainty. One possible solution is to leverage physics-based simulations to generate scenario-based ground motions, which can be used to develop more accurate GMPEs specifically designed for EEW applications, considering that the probable seismic sources and target areas are mostly known. In addition, such specific ground motions can be used to develop more accurate demand models in conjunction with stochastic beam models.
Footnotes
Declaration of conflicting interests
The author(s) declared no potential conflicts of interest with respect to the research, authorship, and/or publication of this article.
Funding
The author(s) disclosed receipt of the following financial support for the research, authorship, and/or publication of this article: This study was supported in part by the United States Geological Survey (USGS) and the California Geological Survey (CGS) which are gratefully acknowledged. Any use of trade, firm, or product names is for the descriptive purposes only and does not imply endorsement by the US Government. Any opinions, findings, and conclusions expressed in this material are solely those of the authors and do not reflect the views of the California Department of Conservation. Sandia National Laboratories is a multi-mission laboratory managed and operated by National Technology and Engineering Solutions of Sandia, LLC., a wholly owned subsidiary of Honeywell International, Inc., for the U.S. Department of Energy’s National Nuclear Security Administration under contract DE-NA-0003525.