
Abstract
For many years, steel moment-resisting frames (SMRF) with welded beam-column connections were thought to be the best lateral-force-resisting system for buildings in high-seismic regions. However, the 1994 Northridge earthquake revealed the important vulnerabilities of what are now referred to as pre-Northridge connections, which experienced unanticipated brittle fractures in many buildings in the Los Angeles Metropolitan Region. There are several tall SMRF buildings with pre-Northridge connections worldwide, raising serious safety concerns about their performance during future earthquakes. To investigate possible undiscovered damage in these types of connections, an advanced probabilistic regional seismic risk and damage assessment is conducted on 97 tall SMRF buildings in the Financial District of San Francisco, California, with pre-Northridge beam-column connections that were subjected to the 1989 Loma Prieta earthquake. This study aims to identify the buildings, floor levels, and orientations more likely to have experienced brittle fractures during the Loma Prieta earthquake. Results indicate that despite this earthquake being only moderate in magnitude with an epicenter approximately 95 km away from the Financial District, peak inter-story drift ratios in the tall buildings reach 0.65%. Median peak probabilities of yielding and fracture of beam-column connections do not exceed 37% and 12%, respectively. As a result of ground motion directionality and differences in grid plan in the city, buildings located south of Market Street experienced considerably greater building responses and probabilities of damage than buildings located north of Market Street. Estimates of damage from this study suggest that some pre-Northridge beam-column connections likely fractured during the Loma Prieta earthquake, but the fractures were not as widespread as in the 1994 Northridge earthquake. However, earthquakes with either higher magnitudes or closer source-to-site distances to the city of San Francisco may cause significant damage to SMRF buildings constructed before the Northridge earthquake.
Keywords
Introduction
The 1989 Loma Prieta event was, at the time of its occurrence, the costliest single natural disaster in the history of the United States, with damages estimated between $7 and $9 billion (Seed et al., 1991). Although this was a moderate-sized event (Mw6.9) and occurred relatively far from the cities of San Francisco and Oakland (e.g. epicentral distances of approximately 100 km), the Loma Prieta earthquake produced much stronger ground motion intensities than what was expected and had an unusually large impact. Thousands of commercial and residential buildings were destroyed (Housner and Thiel, 1990), landslides were widespread, liquefaction occurred near the margins of the San Francisco Bay and elsewhere, transportation networks experienced damage and failure, utilities and other lifeline facilities were widely disrupted, and 62 fatalities were produced as a result of the earthquake (Seed et al., 1991).
Prior to the 1994 Northridge earthquake, the steel moment-resisting frame (SMRF) was considered to be the best lateral-force-resisting structural system for buildings located in regions of high seismicity because their welded beam-column connections were thought to have excellent ductility and capability of resisting large plastic rotations without significant strength degradation (Federal Emergency Management Agency (FEMA), 1997). The 1994 Northridge earthquake challenged these beliefs, since more than 200 buildings experienced brittle fractures in many of their beam-column connections and in some cases also in their column baseplates (FEMA, 1997). The discovery of these unanticipated brittle fractures of framing connections, often with little associated architectural damage to the buildings, was alarming to engineers and the building industry (FEMA, 2000a). Most of these fractures originated at the complete joint penetration weld between the column and beam flanges and were more prevalent in the bottom beam flange (FEMA, 2000d). Experimental research conducted both before and after the earthquake revealed that these brittle fractures at beam-to-column connections are often initiated at very low levels of plastic demand and in some instances prior to the initiation of yielding (e.g. Bertero et al., 1996; Engelhardt and Husain, 1993). This research led to substantial changes in engineering practice for buildings built after 1994 and has resulted in several new types of connections in SMRF buildings commonly referred to as post-Northridge connections.
While the fractures in beam-column connections captured major attention after the Northridge earthquake, they had been reported to occur in prior earthquakes as well. For example, Hamburger and O’Malley (2019) mentioned that a few fractures were discovered in the 1971 San Fernando and 1989 Loma Prieta earthquakes. However, these were ascribed to construction quality issues and repaired without further investigation and therefore their significance was not fully understood. To determine whether a building is damaged, a detailed inspection of the framing and its connections is often required, which in most cases involves the removal of building finishes and some non-structural components, fireproofing, and several other disruptive and time-consuming actions. At the time of the Loma Prieta earthquake, these detailed inspections were typically very expensive, ranging from a few hundred dollars to more than one thousand dollars per connection, which for a large building with several hundred connections is a very expensive undertaking (FEMA, 2000b). As a result, unless major non-structural damage took place or structural damage was evident, detailed inspections of buildings before the Northridge earthquake were rare. This partially explains why damage to pre-Northridge connections in earthquakes before the Northridge earthquake was not discovered and, therefore, was not reported even though it might have occurred. Even in the years after the Northridge earthquake, most of the surveys were performed by engineering firms on an ad hoc basis (mandated by the local ordinances) and were extremely limited (Weinberg and Goltz, 1999). Many owners were not compelled to undertake substantial voluntary inspections in the absence of severe non-structural damage and therefore many buildings remained uninspected or only minimally inspected (Youssef et al., 1995).
Prior studies of tall building response to the Loma Prieta earthquake have been conducted exclusively on either individual or a few existing or archetype buildings. This research has typically focused only on a handful of instrumented buildings. For example, Astaneh et al. (1991) analyzed the response of the Embarcadero building to the Loma Prieta earthquake; Celebi (1992) studied the responses of four instrumented tall SMRF buildings with Loma Prieta motions; Safak (1993) and Anderson and Bertero (1998) evaluated the response of the Chevron Building to the Loma Prieta event; Gunturi (1993), studied the response of the same four buildings in San Francisco previously studied by Celebi (1992), to conduct building-specific earthquake damage estimations; Lai et al. (2015) conducted a seismic evaluation and retrofit of an existing 35-story SMRF in San Francisco, in which the building was subjected to the ground motions recorded at the base of the nearby 18-story building on Sansome street during the Loma Prieta earthquake. Other studies have conducted building-specific analyses on buildings in San Francisco during the Loma Prieta earthquake, but, to the best of our knowledge, there has not yet been an attempt to study the performance of many tall SMRF buildings in San Francisco simultaneously subjected to the Loma Prieta earthquake.
The objective of this study is to conduct the first systematic regional investigation of tall SMRF buildings constructed in the Financial District of San Francisco before 1989, which were subjected to the Loma Prieta earthquake accounting for the combined effects of local site effects, spatial correlation, across period correlation, and ground motion directionality. The study specifically aims to identify the buildings that might have been subjected to greater lateral deformation demands and, therefore, are more likely to have experienced brittle fractures in their connections during the earthquake. The procedure proposed by Bantis et al. (2024b), extended from the RPBEE framework (Heresi and Miranda, 2023), is adopted to quantify the seismic hazard at each building location, building responses, and building damages on a regional scale. In particular, this study investigates the response and the probability of yielding and fracture of the 97 tallest pre-Northridge SMRF buildings in San Francisco. Conducting this type of research is particularly important because prior studies (e.g. Molina Hutt et al., 2019) have indicated that pre-Northridge SMRF structures could have a mean annual frequency of collapse up to 25 times higher than that of new code-conforming buildings and 2 times higher average annual economic losses and downtime due to earthquakes. This work is organized as follows: The next section provides information on the buildings considered in the regional study, a brief summary of the history of tall building construction in San Francisco, and typical details of pre-Northridge connections in SMRF buildings; the third section illustrates how the Loma Prieta earthquake produced unusually large ground motion intensities in San Francisco relative to mean intensities that would be expected from a Mw6.9 earthquake occurring approximately 100 km away; the section after evaluates the effectiveness of the simplified building response model adopted in the regional seismic risk framework when used in conjunction with modal response history analysis to estimate displacement and acceleration responses in the instrumented tall buildings which recorded the Loma Prieta earthquake; the fifth section introduces the drift-based fragility functions for the damage states of yielding and fracture of pre-Northridge beam-column connections; the sixth section summarizes the regional seismic risk framework adopted in this study; and the seventh section presents hazard, building response, and building damage results for the 97 SMRF buildings and discusses their implications.
Pre-Northridge steel moment frame tall buildings in San Francisco
In this study, the regional response and damage analysis of tall buildings in San Francisco uses a subset of buildings in the building database of the San Francisco Tall Buildings Study (ATC-119, 2018). The complete database consists of 180 buildings, of which 156 are denoted as “tall” with heights greater than 73 m. Around 70% of these tall buildings have between 20 and 40 stories, while 20% have more than 40 stories. This study considers the 97 tall SMRF buildings that were built prior to the 1989 Loma Prieta earthquake. Of these buildings, almost 90% were constructed in the 1960s–1980s, more than half have between 20 and 39 stories, 70% are office buildings, 15% are hotels, and 15% are residential or mixed-use.
The San Francisco Tall Buildings Study (ATC-119, 2018) summarized the historic trends of growth of tall buildings in San Francisco based on 243 buildings in the Financial District. In the decade after the great 1906 earthquake, 98 buildings were constructed, of which 62 were erected within the first two years after the earthquake. Between 1915 and 1930, 43 buildings were constructed. However, only five buildings were built during the next two decades due to the Great Depression and the Second World War. Between 1951 and 1994, 86 buildings were erected. During the 1970s and 1980s, a mini boom in the construction of tall buildings took place in the city. After 1994 (until 2018), 11 new buildings were added to the Financial District, although most of these were constructed after 2000. Of the 180 buildings in the ATC-119 database, over half are SMRFs, 30% are reinforced concrete shear walls, and 10% are steel-braced frames. SMRFs were the predominant type of construction during the 1960s–1980s, steel-braced frame dual systems were constructed primarily after the Northridge earthquake during the 1990s, and concrete shear wall systems have emerged as the lateral resisting system of tall buildings in the twenty-first century in the Financial District.
While SMRF structures have been used since the beginning of the last century, there have been many important changes in their construction, particularly in the types of connections used over time (FEMA, 2000c). Steel replaced cast iron and wrought iron as construction materials in the 1890s. From 1900 to 1920, steel frames were commonly constructed as complex built-up members with gusset plates and built-up riveted connections. From the 1920s to 1950s, rolled shapes were used, and connections were made with riveted T-sections (primarily on the lower floors of tall buildings) and riveted angles (used in top stories of tall buildings or smaller buildings). Bolts and welding were sometimes used, but rivets were dominant up until about the 1950s when rivets were discontinued in favor of high-strength bolts and welding (FEMA, 1997). The 1958 Bethlehem Steel Building in San Francisco is one of the last all-riveted structures (FEMA, 2006). Structures in the first half of the twentieth century were highly redundant, as every beam-column connection was a moment-resistant connection. During the 1960s, high-strength bolts continued to replace the rivets in the T-stub and double-flange-angle connection, the mass of structures was decreased to reduce the seismic design forces, and welding became so economical and practical that welded connections became very common in tall buildings from the 1950s to 1970s. The 1955 Equitable Building in San Francisco is an early example of a welded SMRF structure (Elsesser, 2004). During the 1970s, SMRF construction evolved with the increased use of welding. The welded-flange-bolted-web connections became much more widespread than the welded-flange-welded-web connections and eventually became the dominant mode of construction for SMRFs. These connections typically have a complete joint penetration weld connecting the beam flanges to the column flanges, a shear tab bolted to the web for transfer of shear force, and continuity plates to stiffen the column flange or web and panel zone doubler plates. From the late 1970s to the early 1990s, increasingly less-redundant SMRF structures were being built. Heavier and deeper members than those previously tested and constructed were used in these frames to concentrate seismic resistance in as few frames and bays as possible, hence reducing the number of moment connections to reduce construction costs.
It has been suggested that because other structural systems fared worse in the Loma Prieta earthquake (e.g. non-ductile reinforced concrete highway bridges and wood-framed structures on very soft soil sites), the seismic response of tall steel buildings was largely unscrutinized after Loma Prieta in 1989 (FEMA, 2000d). Although some studies had reported on some of the vulnerabilities in welded beam-column connections (e.g. Engelhardt and Husain, 1993), it was not until after the 1994 Northridge earthquake that a number of welded steel moment-frame buildings were found to have experienced brittle fractures of beam-to-column connections. The damaged buildings had heights ranging from 1 story to 26 stories, and a range of ages spanning from buildings as old as 30 years to structures just erected at the time of the earthquake. Damaged buildings were spread over a large geographical area, including sites that experienced only moderate levels of ground shaking (FEMA, 2000a). Detailed damage reports from the earthquake state that 90 of the 155 buildings inspected had some connection damage (FEMA, 2000d). The most typical damage involved fractures at or near beam flange-to-column flange welds. In addition to the fracture potential in beam-column connections, pre-Northridge frames contain deficient connection details as well as low-toughness base and weld materials. Of particular concern in these frames are welded column splice connections that are usually provided near the mid-story height and may be susceptible to fracture. The reader is referred to Engelhardt et al. (1995), Naeim et al. (1995), and FEMA (2000d) for case studies of actual damage to structures from the Northridge earthquake. After the Loma Prieta earthquake, inspections were conducted in several buildings in the San Francisco Bay Area. Five buildings were reported to have sustained slight to significant weld damage in the Loma Prieta earthquake, similar to those observed in the Northridge earthquake. However, two of the buildings were located much closer to the rupture and none of the buildings were located in San Francisco (Phipps, 1999). The damage sustained by pre-Northridge SMRF buildings, and their prevalence in San Francisco, warrant further investigation to identify buildings that are more likely to have sustained damage that was undiscovered after the earthquake.
Loma Prieta earthquake
The 1989 Loma Prieta earthquake produced ground motions in San Francisco with intensities stronger than the median intensity that would be expected for an event of this magnitude and distance. Two main reasons have been provided to explain these large intensities: (1) reflections of seismic waves at the Moho discontinuity and (2) local soil conditions. For example, Campbell (1991) showed that peak accelerations on rock during the Loma Prieta earthquake had almost no attenuation in the distance range of 40–80 km. Somerville and Yoshimura (1990) verified this observation for all sites, using recorded and simulated motions, where peak accelerations did not attenuate until after an epicentral distance of 100 km. The authors explained that the unexpected increment of ground motion amplitudes in the range between 40 and 100 km was due to critical Moho reflections from the base of the crust. At close distances, horizontal ground motions are controlled by direct upgoing shear waves. As the distance increases, in this case between 40 and 100 km, the reflections of the shear wave from interfaces in the lower crust reach a critical angle and undergo total internal reflections. The strong contrast in elastic moduli at these interfaces, especially at the Moho, or the boundary between the Earth’s crust and mantle, causes these critically reflected waves to have large amplitudes, thereby amplifying ground motions. The reflections were also large because of the deep focal depth of the earthquake and the strong velocity gradient at the base of the crust (Somerville and Yoshimura, 1990). Although the varying site conditions in the San Francisco Peninsula may have caused localized amplification, they do not explain the absence of attenuation between 40 and 80 km in peak accelerations. The critical Moho reflections were responsible for amplifying the motions at all sites, regardless of soil conditions, since these reflections control the intensity of the motion arriving beneath the sites of interest. To highlight these high ground motion intensities, Figure 1a compares 5%-damped RotD50 pseudo-acceleration response spectra, which are intensities corresponding to the median from all horizontal orientations (Boore, 2010), computed with ground motions recorded at rock outcrop sites in San Francisco during the Loma Prieta earthquake with spectral ordinates estimated using the BSSA14 (Boore et al., 2014) Ground Motion Model (GMM). The GMM is for a Mw6.9 earthquake, Joyner–Boore distance of 75 km, and a site with a time-averaged shear wave velocity of the first 30 m of soil,
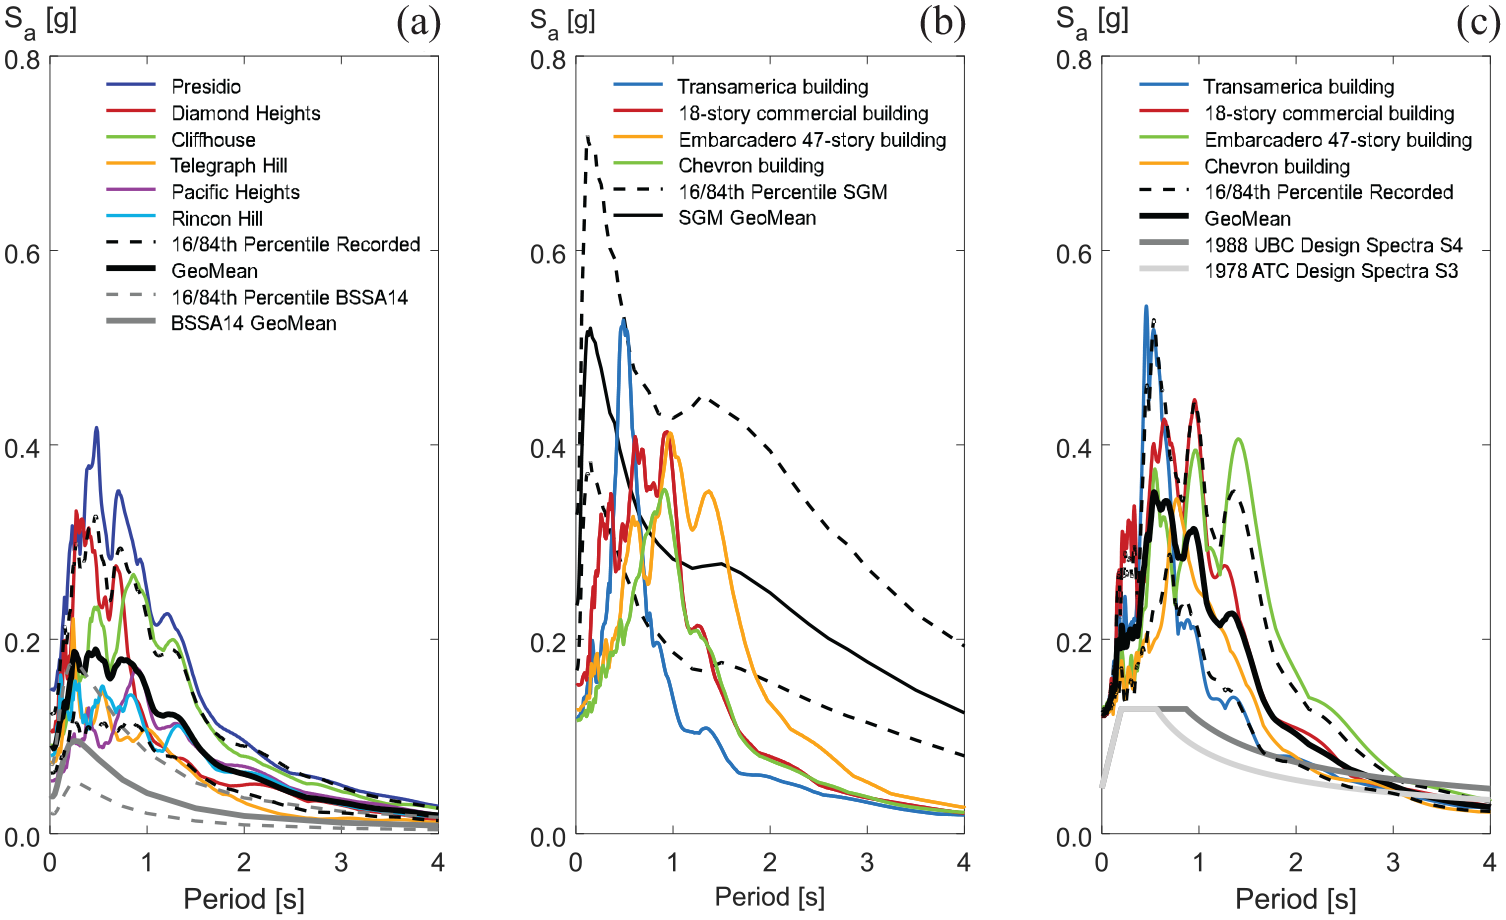
(a) Comparison between 5%-damped RotD50 pseudo-acceleration response spectra computed with ground motions recorded at six rock sites in San Francisco during the Loma Prieta earthquake with the median, 16th, and 84th percentiles of the BSSA14 GMM for a Mw6.9 event, 75 km Joyner–Boore distance, and
Local site effects further amplified the ground motion intensity at soft soil sites in the San Francisco Bay Area during the Loma Prieta earthquake. Site-specific amplification of bedrock ground motions was pronounced at sites in San Francisco with soil deposits composed of soft to medium stiff marine estuarine clays and silty clays, known locally as San Francisco Bay Mud (Benuska, 1990; Borcherdt and Glassmoyer, 1992; Dickenson, 1994; Seed et al., 1991). The high impedance contrast between the Franciscan Assemblage at bedrock made up of a very solid rock formation and the Bay Mud causes significant soil amplification (Baise et al., 2016), especially at specific frequencies (that vary from site to site depending primarily on the depth to bedrock) and particularly at the fundamental frequency of the soil deposits (Aagaard et al., 2010). To illustrate the effect of soft soils on ground motion amplification, Figure 1b compares 5%-damped RotD50 pseudo-acceleration response spectra computed with ground motions recorded at four soft soil sites in San Francisco during the Loma Prieta earthquake with spectral ordinates computed from the Southern California Earthquake Center (SCEC) Broadband Platform ground motion simulations of a Mw8.0 event on the Northern San Andreas Fault in downtown San Francisco (Goulet et al., 2018). The figure shows how these physics-based ground motion simulations, which did not incorporate the soft layers near the surface, cannot capture the site resonances that occur in soft soil sites. In particular, spectral ordinates from the simulated ground motions, despite corresponding to those of a much larger earthquake (with approximately 45 times more energy release) and occurring much closer to San Francisco than that of Loma Prieta, on average underestimate the response spectral ordinates computed at the four soft soil sites in San Francisco during the Loma Prieta earthquake over a critical frequency range where the predominant period of the soil deposit is typically found in San Francisco (between 0.5 and 1.7 s). These examples highlight how abnormally large the intensity of the ground motions recorded in San Francisco was during the moderate-sized Loma Prieta earthquake, which occurred relatively far from the city. Although not shown in Figure 1b, the BSSA14 GMM for a soft soil site in San Francisco also significantly underestimates the response spectral ordinates computed at the four soft soil sites during the Loma Prieta earthquake, just as was the case for rock outcrop sites in Figure 1a. Figure 1b suggests that response spectral ordinates corresponding to higher modes of vibration (2nd–4th) of tall buildings in downtown San Francisco on soft soil sites were significantly greater than median intensities expected for a Mw6.9 event occurring 75 km from downtown San Francisco. These larger intensities can lead to greater than expected building responses, damages, and losses particularly for acceleration-sensitive components which are impacted more by higher modes of vibration than displacement-sensitive components.
The Loma Prieta earthquake also demonstrated strong directionality effects. Poulos and Miranda (2023) recently found a strong effect of style of faulting in the orientation of maximum intensity, showing that for strike-slip earthquakes, the orientations of maximum intensity at each station tend to be close to the transverse orientation, defined as the orientation that is perpendicular to the straight line segment connecting the recording station and the earthquake epicenter. To illustrate this, Figure 2 plots relative displacement hodographs for a 5%-damped oscillator with a period of 4 s computed with ground motions recorded at 11 recording stations on the San Francisco Peninsula during the 1989 Loma Prieta earthquake. As shown in this figure, most of the 11 sites have orientations of maximum horizontal intensity, RotD100 (Boore, 2010), approximately in the Northeast-Southwest direction, an orientation very similar to the transverse source-to-site direction for an epicentral distance of 95.5 km, depicted with a green arc in Figure 2. The average orientation of RotD100 of the six rock outcrop sites on the San Francisco Peninsula for a 5%-damped oscillator with a period of 4 s is
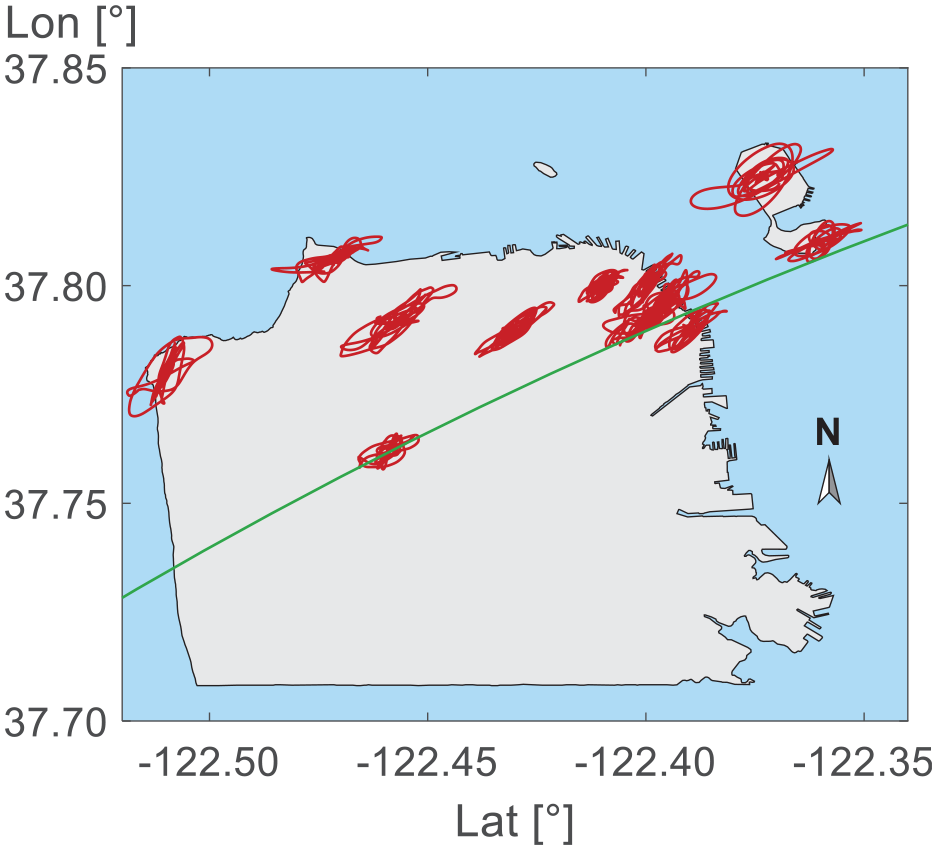
Map of the San Francisco Peninsula showing the transverse component of the Loma Prieta earthquake for an epicentral distance of 95.5 km (green arc) along with relative displacement hodographs for 5%-damped oscillators with a period of vibration of 4 s computed with ground motions recorded at eleven recording stations during the Loma Prieta earthquake (red).
Similar to response spectra estimated from GMMs and physics-based simulated ground motions, design spectra in use at the time of the Loma Prieta earthquake also significantly underpredicted the ground motion intensity of recorded motions. To illustrate this, Figure 1c compares 5%-damped pseudo-acceleration response spectra in the
Validation of building response model
The continuous shear-flexural coupled beam model with non-uniform stiffness along the height proposed by Alonso-Rodríguez and Miranda (2016) is used in the regional framework of Bantis et al. (2024b) to estimate building responses. This section evaluates the shear-flexural coupled beam model when used in conjunction with modal response history analysis to estimate displacement and acceleration responses throughout the heights of four instrumented tall buildings in San Francisco that recorded the Loma Prieta earthquake. The required inputs for a given building are: (a) the orientation of its principal axes (i.e. the orientation of its longitudinal and transverse directions); (b) the fundamental period of the building in each principal direction; (c) a non-dimensional parameter,
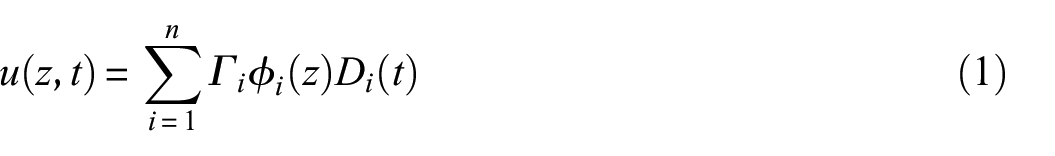
where
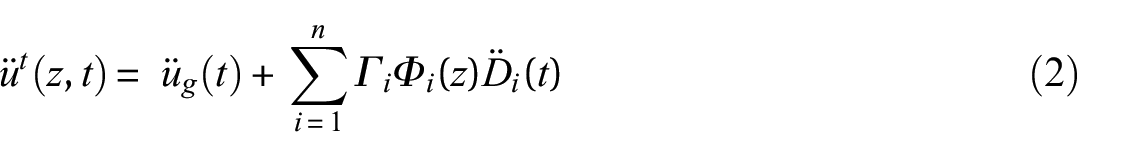
where
Relative displacement response histories along the height of the 47-story Embarcadero Building in its transverse Northwest-Southeast (NW-SE) direction, which has SMRFs (Figure 3a), and the 48-story SMRF pyramidal TransAmerica Building in its transverse NW-SE component (Figure 3b), when subjected to ground motions recorded during the Loma Prieta earthquake, are shown in Figure 3. Figure 4 plots profiles of peak floor accelerations (PFAs) and peak floor relative displacements (PRDs) over normalized building heights,
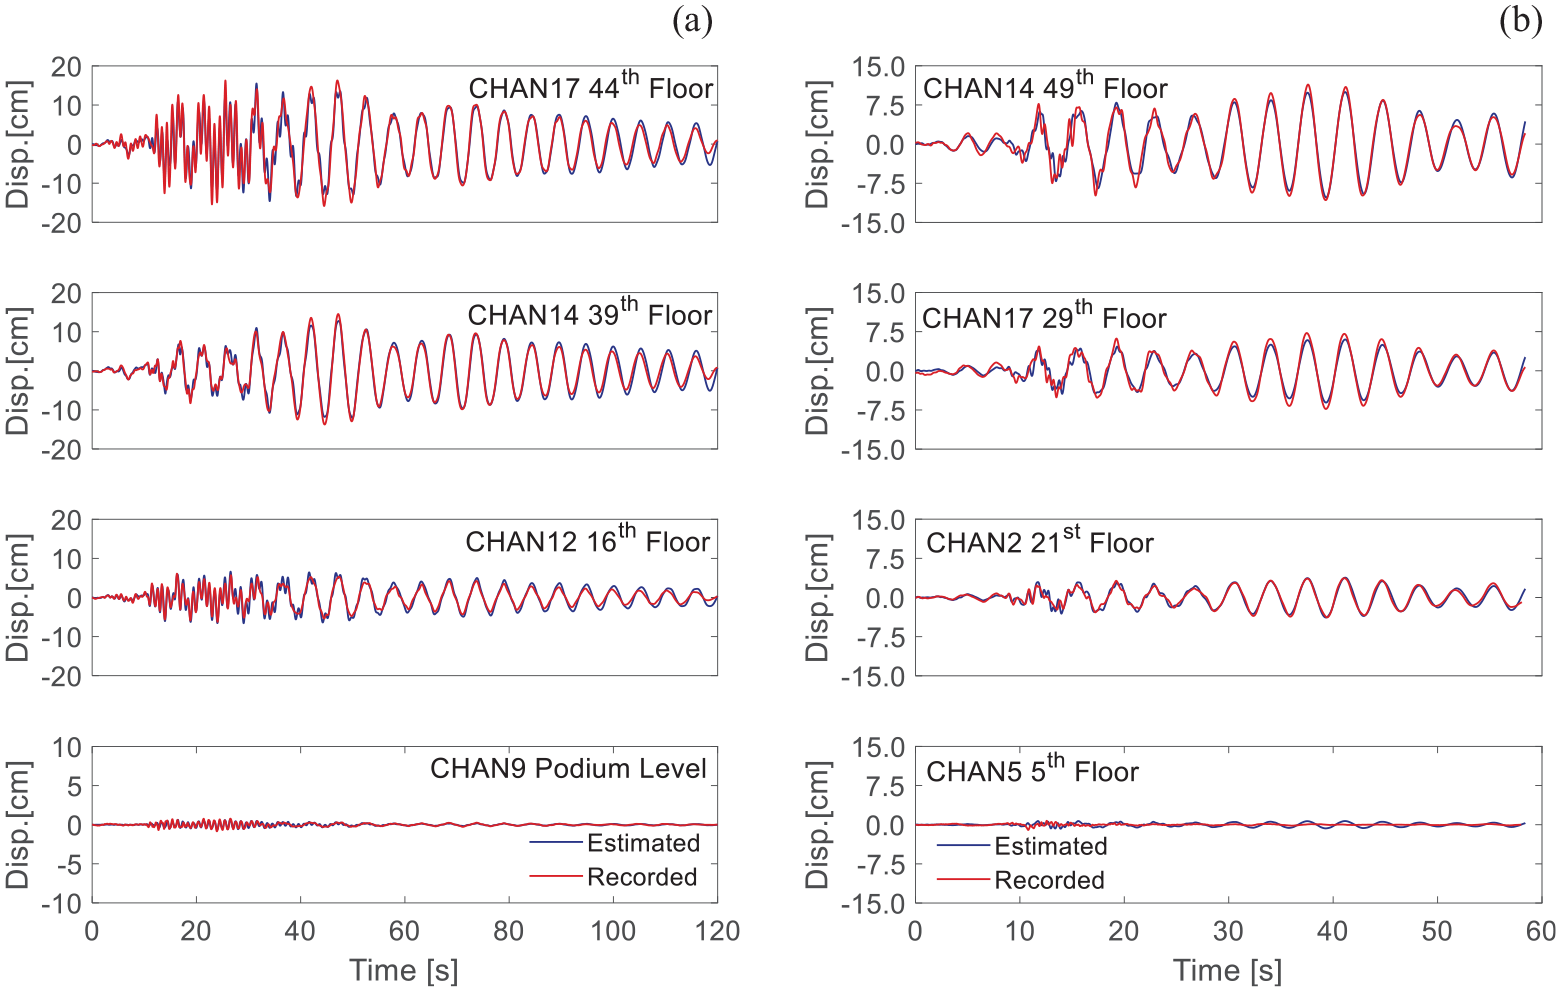
Comparison of recorded, shown in red lines, and estimated (i.e. computed), shown in blue lines, relative displacement response histories in the transverse Northwest-Southeast building orientation throughout the height of the (a) 47-story Embarcadero Building, and (b) 48-story pyramidal TransAmerica Building, during the Loma Prieta earthquake.
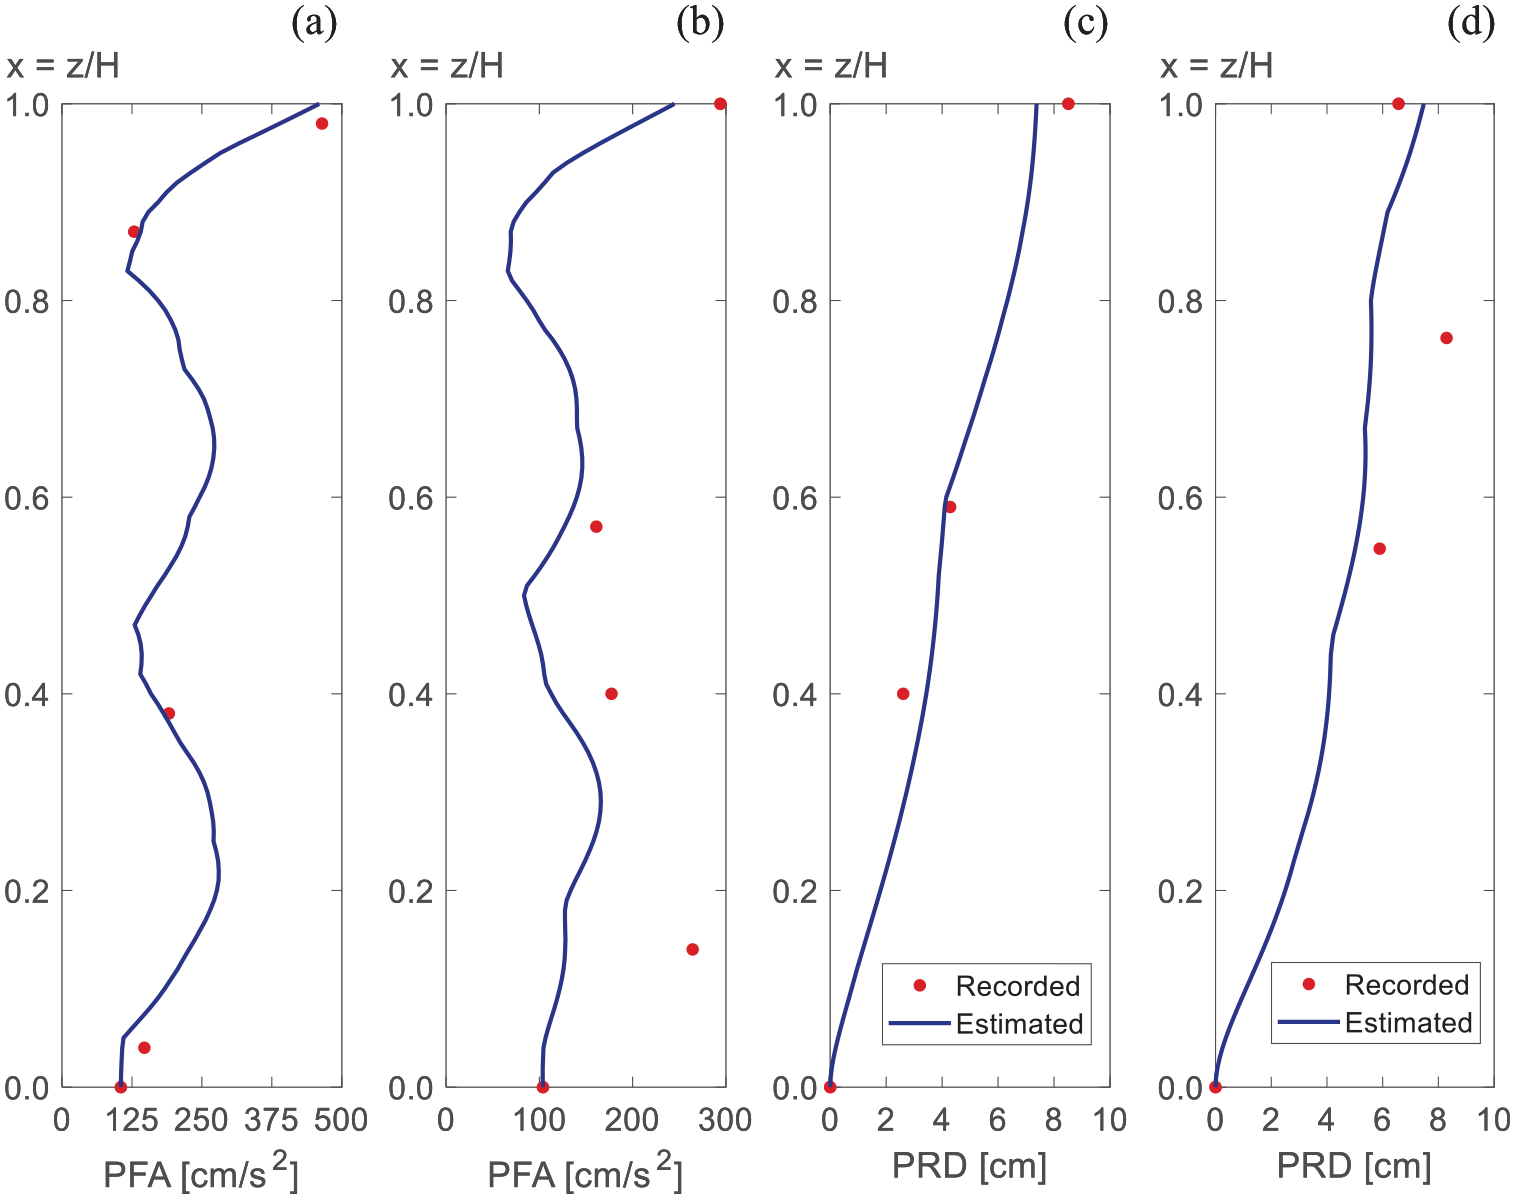
Comparison of profiles of peak floor accelerations (PFAs) and peak floor relative displacements (PRDs) over the normalized height,
Fragility functions
To compute probabilities of damage in SMRF tall buildings in San Francisco, drift-based fragility functions for yielding and fracture of pre-Northridge welded flange, bolted web beam-to-column connections as a function of inter-story drift ratio (IDR) were used, considering an improved version of the ones developed by Ramirez et al. (2012). The fragility functions from ATC-58 (2009) were not used in this study because they neglect the change in fragility with beam depth, arbitrarily do not consider some data, and do not have a yielding damage state. The reader is referred to the electronic supplement of this article for information regarding the specimens used to calibrate the parameters of the fragility functions and for other details on how the improved fragility functions were developed. There are a number of issues in welded connections that may negatively affect some connections more than others beyond some of the variables included in this study. Some of these include welding defects such as cracks, cavities, particularly poor fracture toughness of the weld metal, incomplete fusion, and so on (Kaufmann et al., 1997). The type of column (box versus wide flange) could potentially also influence the likelihood of fracture in the connections. While some of this information may become available during detailed investigations of individual structures, this information is not available at a regional level, which is the focus of this study and, therefore, it is not explicitly considered. These issues that may negatively affect some connections more than others are only considered implicitly to the extent that they were present in the experimental testing used in the development of the fragility functions used in this study. Beam member sizes are required as inputs to use the proposed improved fragility functions to calculate probabilities of damage from building response IDRs. However, the San Francisco Tall Buildings Study database (ATC-119, 2018) does not provide beam member sizes for the SMRF buildings in their inventory. Therefore, in this study, beam member sizes throughout the height of the tall SMRF buildings in San Francisco were inferred based on detailed surveys of SMRF buildings affected by the 1994 Northridge earthquake conducted by various structural engineering firms and reported by Youssef et al. (1995). These surveys determined that beam depths between 30 and 36 inches are commonly used in engineering practice for connections of SMRFs in tall buildings. These beam shapes also have typical span-to-depth ratios between 9 and 11, which is near the mean value of 10, as reported by Youssef et al. (1995). As a result, W30, W33, and W36 member sizes were assumed for all beams in the 97 tall SMRF buildings in San Francisco. These member sizes are also in agreement with the Galvis et al. (2024) database of beam member sizes for tall pre-Northridge SMRF buildings in downtown San Francisco. The database of 89 tall pre-Northridge SMRF buildings shows that the vast majority of buildings have beam member sizes between W27s and W36s with a few buildings also having W24s and W21s. The specimens used to calibrate the parameters of the fragility functions in the electronic supplement include beam member sizes between W21s and W36s, which makes up the overwhelming majority of beam sizes in the Galvis et al. (2024) database. While the W30, W33, and W36 member sizes selected for this study may be a simplifying assumption, it is justified by the Youssef et al. (1995) and Galvis et al. (2024) studies, and results would not have changed by much had other similar and smaller W-shaped beams been used instead. The electronic supplement to this article gives details of the distribution of each of these three depths of W shapes along the height of the building. Figure 5 shows plots of the fragility curves for the three beam depth sizes assumed for the damage states of yielding (Figure 5a) and fracture (Figure 5b). As shown in these fragility functions, at an IDR of 1% (i.e. half the maximum drift allowed in current seismic design codes), the probability of yielding varies between 78% and 95%. In comparison, the probability of fracture in these pre-Northridge connections is much smaller but still significant between 15% and 25%. At the maximum allowed drift level of 2% in current codes, these probabilities of fracture increase to 70%–79%.
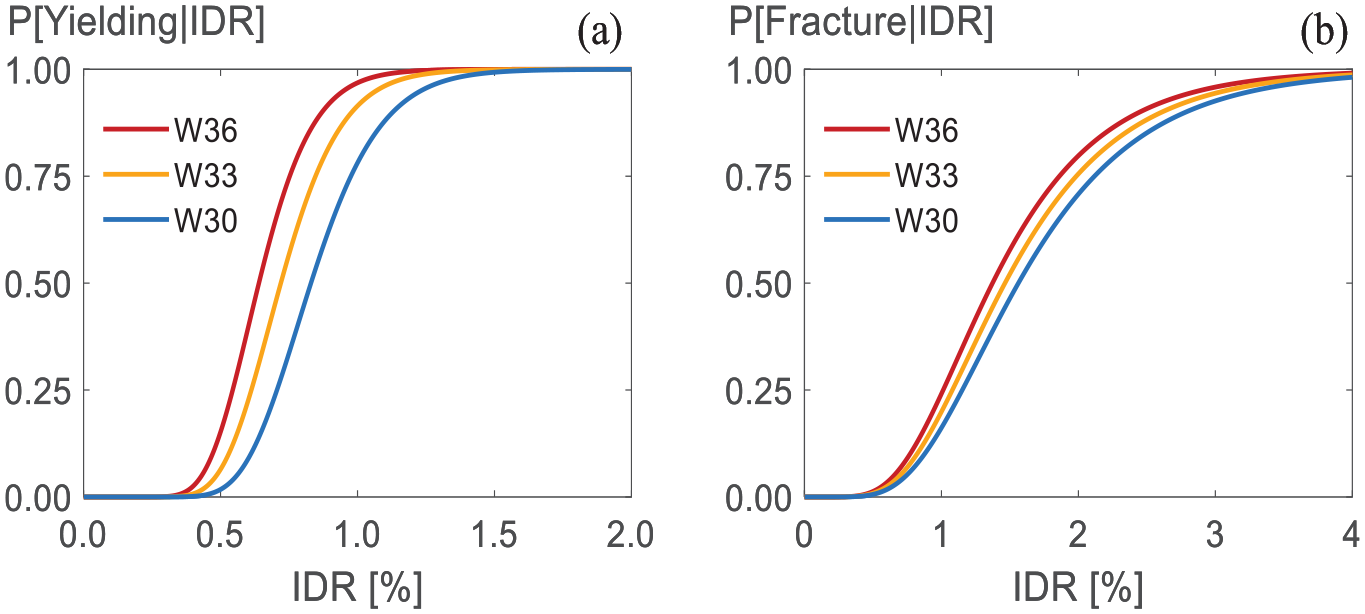
Drift-based fragility functions for W30, W33, and W36 shape beams in tall steel moment frame buildings as a function of inter-story drift ratio (IDR) for the damage states of (a) yielding and (b) fracture of beam-column connections.
Regional building response and damage estimation procedure
The regional seismic risk assessment was conducted using the novel framework outlined by Bantis et al. (2024b), briefly summarized in this section. The framework makes use of a simplified site response analysis to estimate realizations of response spectra of motions at the surface at each site of interest and in the orientations corresponding to the principal components of each building. The simplified site response analysis is initiated by first computing realizations of response spectra at each site assuming rock conditions. The realizations, which are both spatially and spectrally (across different periods) correlated, were simulated with a Monte Carlo approach using a lognormal distribution for the spectral ordinates using the median and dispersion of the ground motions recorded at the six rock outcrop recording stations in San Francisco during the Loma Prieta earthquake. Recorded Loma Prieta ground motions were used to simulate rock spectral ordinates rather than a GMM because, as Figure 1a demonstrated, GMMs neglect directionality and significantly underestimate rock outcrop response spectra computed from ground motions recorded during the Loma Prieta earthquake. It should be noted that, although not done in this study, rather than a median and dispersion from a small sample size of six rock outcrops, GMMs could have been used with an “event term” that accounts for the on-average larger ground motions from the Loma Prieta earthquake. Because most of the buildings considered are on soil and not on rock, a site response analysis is conducted at each site to account for site effects. The analysis makes use of a one-dimensional continuous non-uniform shear beam model having a parabolic variation of lateral stiffness along the soil deposit (Bantis et al., 2024a). For each realization, the Inverse Random Vibration Theory first proposed by Gasparini and Vanmarcke (1976) and later implemented by Rathje et al. (2005) is applied to the pseudo-acceleration response spectra computed from ground motions recorded at rock outcrop sites to obtain an estimate of Fourier Amplitude Spectra (FAS) at the rock outcrop sites. Following that, two multi-degree-of-freedom transfer functions, representing “rock” and “soil” columns, are multiplied by the FAS at the rock outcrop sites to obtain the FAS at the bedrock and then at the ground surface of the sites of interest. The two transfer functions are obtained from the non-uniform shear beam model by using only the depth to bedrock and a small number of parameters. The depth to bedrock at each site in this study is obtained using a digitized version of the Schlocker et al. (1954) depth to bedrock map. Modeling uncertainty in the site response analysis is incorporated at each site by sampling the predominant period of the “soil” and “rock” columns from the depth to bedrock and equivalent homogeneous shear wave velocity (Garcia-Suarez and Asimaki, 2020), modal damping ratios of the “soil” and “rock” columns, and a parameter related to the ratio of the shear-wave velocity at the ground surface to bedrock. Finally, realizations of pseudo-acceleration response spectra at the ground surface at each site are obtained from the FAS at the surface by applying Random Vibration Theory using the peak factor and durations recommended by Bantis and Miranda (2023), which were developed specifically for soft soil sites. In Bantis et al.’s study (2024a), the simplified site response analysis with the one-dimensional continuous shear beam was evaluated and validated using records from downhole arrays at soft soil sites. Conducting a simplified site response analysis at each site is in contrast to typical approaches used in regional seismic risk where the ground motion is estimated from a GMM together with an oversimplified characterization of the site such as using
Once realizations of RotD50 response spectra at the surface of each site are computed, ground motion directionality is explicitly taken into account by computing realizations of response spectra at each site in the principal components of each building by using the Poulos and Miranda (2022) probabilistic model. For this purpose, a single orientation of
The response of each building in each principal direction is obtained by using modal response spectrum analysis together with the non-uniform one-dimensional continuous shear-flexural beam model developed by Alonso-Rodríguez and Miranda (2016), discussed and validated in a previous section, using as input the realizations of response spectra at the base of each building in each principal direction. Conducting a simplified response of each building in each of its principal directions is in contrast to more common approaches used in regional seismic risk where typically no building response is computed and only fragility or vulnerability functions corresponding to a few building classes are used as a function of a measure of ground motion intensity that neglects directionality. In addition, modeling each building as a one-dimensional continuous shear-flexural beam is in contrast to other approaches where buildings are modeled and analyzed using either an extremely simple SDOF system together with fragility and vulnerability models or a very complicated nonlinear response history analysis of a detailed finite-element model. Only the following four parameters are required to fully characterize each building in each principal building component when using the simplified building model: the fundamental period, first modal damping ratio, and two non-dimensional parameters of the one-dimensional shear-flexural beam model representing the ratio of shear stiffness between the top and bottom of the building,
Finally, probabilities of yielding and fracture of pre-Northridge beam-column connections in SMRF buildings were computed by integrating the fragility functions given in the previous section with an assumed lognormal probability distribution for IDR. It should be noted that all relevant uncertainties associated with each step of the framework are explicitly incorporated and propagated. The parameters giving the “soil” and “rock” column dynamic properties for the simplified site response analysis and the parameters giving the building dynamic properties are the same as those used in the Bantis et al. (2024b) illustrative case study in downtown San Francisco because the sites and buildings analyzed in this work are a subset of those analyzed in that study. For further details of the framework for regional seismic risk assessment, the reader is referred to Bantis et al. (2024b).
The framework for regional seismic risk assessment summarized above is applied to one 23-story building immediately north of Market Street and one 37-story building immediately south of Market Street and separated by only 85 m to demonstrate the process of estimating responses and damages in buildings. To illustrate some aspects of the uncertainty in ground motion intensity at each site during the Loma Prieta earthquake, Figure 6 shows 5%-damped RotD50 pseudo-acceleration response spectra for the two sites immediately north (Figure 6a) and south (Figure 6b) of Market Street. To highlight the probabilistic nature of the framework, 100 individual simulations of response spectra are shown alongside the median and 16th/84th percentiles of response spectra for each site. The median and 16th/84th percentiles of response spectra are computed over 1000 simulations. As expected, the RotD50 intensities at the two sites are very similar due to the small separation distance between the two sites, but the depth to bedrock and, therefore, also the fundamental period of the soil deposit is slightly longer for the site south of Market Street than for the site north of Market Street. As a result, the spectral ordinates at the predominant period of the soil deposit are slightly larger for the site south of Market Street.
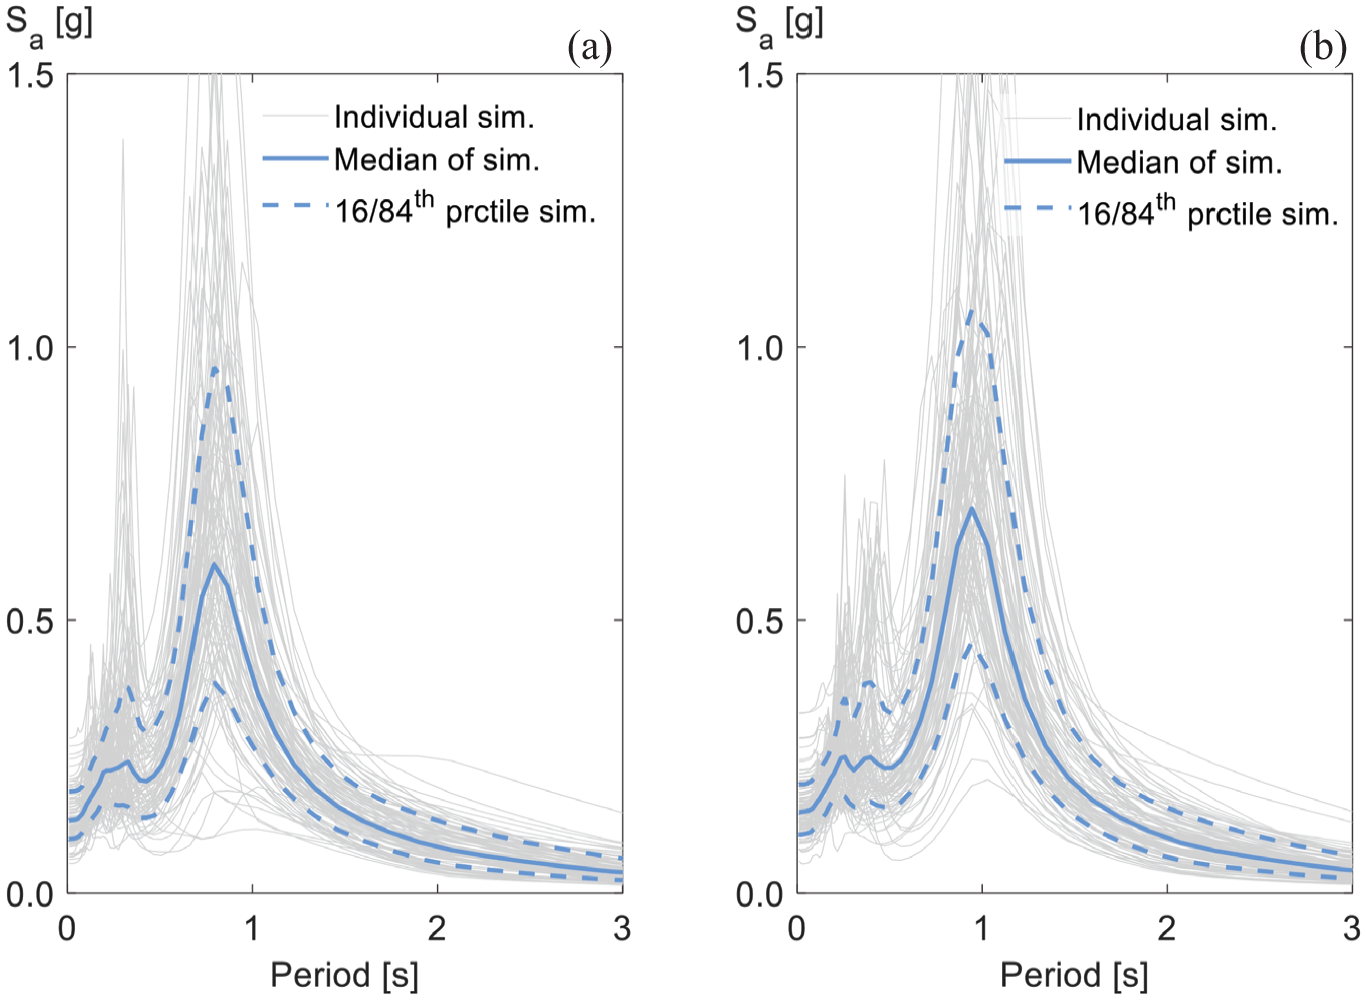
Simulated 5%-damped RotD50 pseudo-acceleration response spectra for a site (a) north of Market Street and (b) south of Market Street representative of ground motions during the Loma Prieta earthquake. Shown are 100 simulations in gray lines, the median in a solid blue line for 1000 simulations, and the 16th and 84th percentiles in dashed blue lines for 1000 simulations.
Simulations of IDRs along the height of the two buildings centered around Market Street in both principal orientations of the buildings are shown in Figure 7. The grid layout of buildings north of Market Street is approximately that of the cardinal axes in North-South and East-West directions. In contrast, buildings south of Market Street are oriented either parallel or perpendicular to Market Street. Therefore, even though the buildings are very close to each other, their seismic responses can change significantly due to the interaction of the building orientation and the ground motion directionality. In addition, the height of the building south of Market Street is approximately 50 m greater than the height of the building north of Market Street, which will also cause differences in their seismic responses. Figures 7a and 7b display profiles of IDRs for the building north of Market Street in its approximate East-West and North-South principal orientations, respectively. Figures 7c and 7d display profiles of IDRs for the building south of Market Street in its Northwest-Southeast (NW-SE) and Northeast-Southwest (NE-SW) principal orientations, respectively. Similar to Figure 6, individual simulations, the median, and 16th/84th percentiles of IDR profiles are shown. The median and 16th/84th percentiles of IDR profiles are computed over 1000 simulations. The IDRs of both buildings corresponding to the NE-SW principal building orientation are greater than those corresponding to the NW-SE principal building orientation because the NE-SW orientation is closer to the orientation of RotD100. In addition, the building south of Market Street experiences significantly greater peak IDRs than the building north of Market Street. This difference is partly because the spectral ordinates are, on average, greater for the building south of Market Street in its NE-SW principal component than for the building north of Market Street in its NE-SW principal component partly because the NE-SW orientation of the building south of Market Street is closer to the orientation of RotD100 than that of the NE-SW orientation of the building north of Market Street. IDR demands are also significantly greater for the taller structure south of Market Street because its second mode of vibration is very close to its predominant period of the soil deposit where the spectral accelerations peak in Figure 6. Differences in IDRs within these buildings in individual realizations may also be due to the variability in some of the building parameters used in each realization. However, the difference in average IDR demands along the height is primarily due to the combination of building orientation, ground motion directionality, building height, and depth to bedrock.
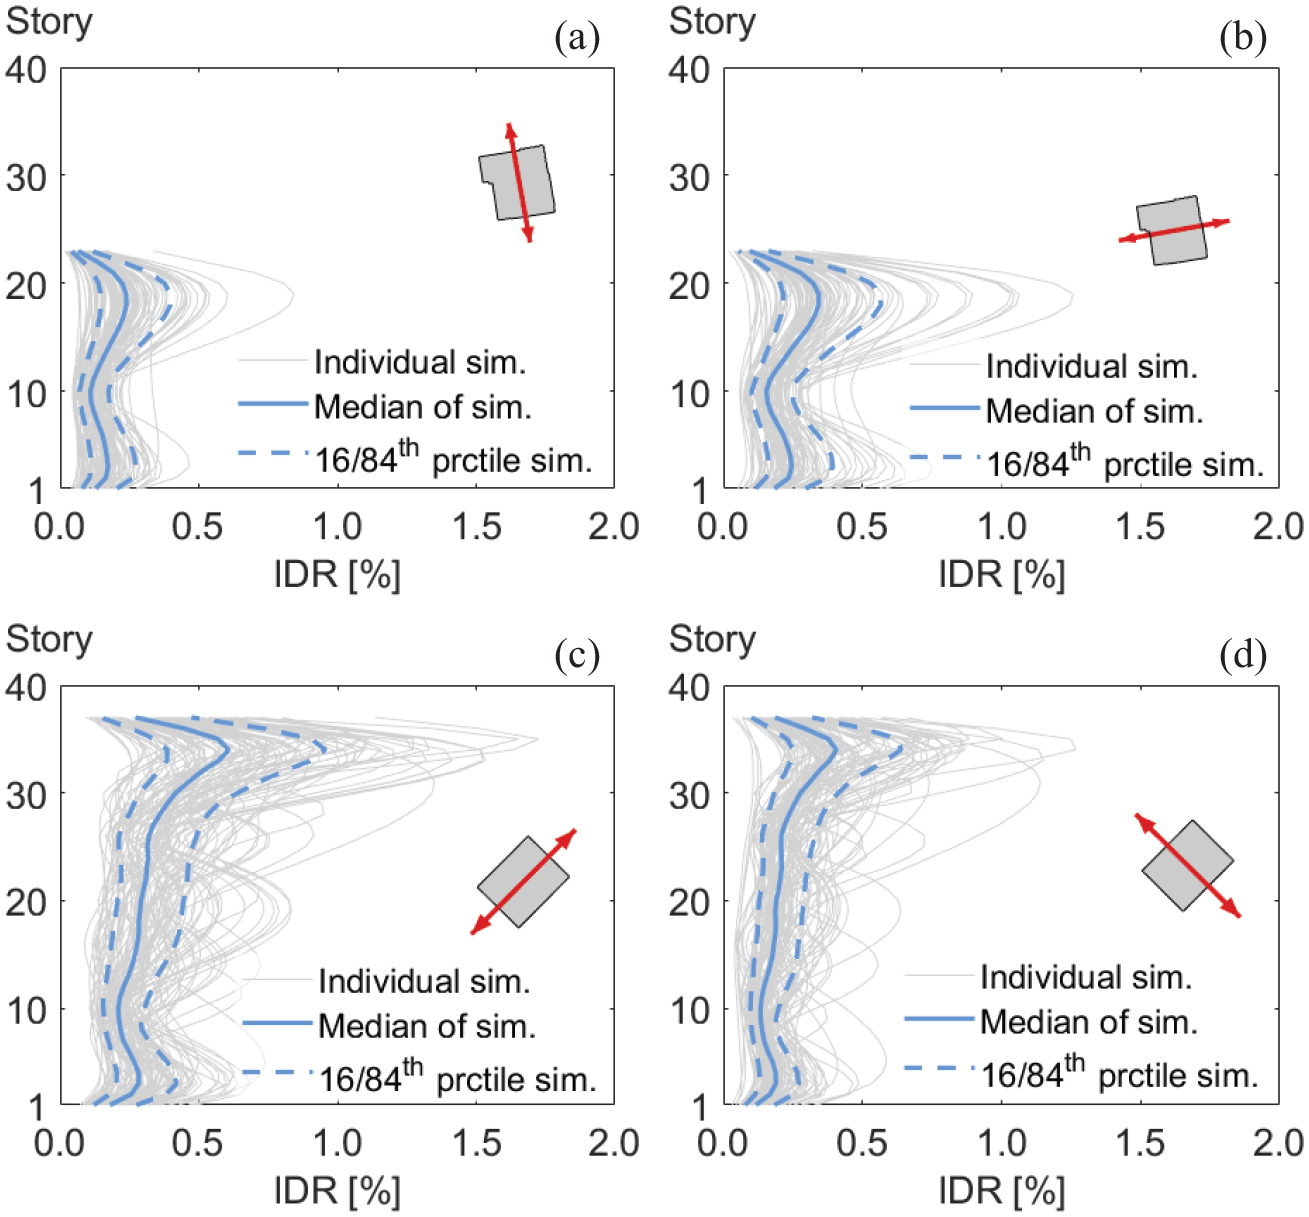
Simulated profiles of inter-story drift ratio (IDR) demands along the height of (a) the 23-story building north of Market Street in its Northeast-Southwest principal orientation; (b) the 23-story building just to the north of Market Street in its Northwest-Southeast principal orientation; (c) the 37-story building just to the south of Market Street in its Northwest-Southeast principal orientation; and(d) the 37-story building south of Market Street in its Northeast-Southwest principal orientation.Shown are 100 individual simulations in gray lines, the median of 1000 simulations in a solid blue line,and the 16th and 84th percentiles in dashed blue lines for 1000 simulations.
Median probabilities of yielding and fracture of pre-Northridge beam-column connections for the two buildings, computed given the maximum IDR of both principal orientations for each simulation (Figure 7), are shown in Figures 8a and 8b, respectively. As expected from the drift-based fragility functions (Figure 5), the probabilities of yielding are much greater than the probabilities of fracture along the heights of both buildings. In addition, probabilities of damage are significantly greater for the building south of Market Street than the building north of Market Street because the peak IDRs at each story (i.e. the maximum value of both principal building orientations) are much greater. Moreover, just as in Figure 7, where the IDRs peaked toward the top of the building, the same is true for the median probabilities of yielding and fracture shown in Figure 8 for these two buildings. This location of maximum probabilities of yielding and fracture, particularly for the taller building south of Market Street, is the result of the second mode of vibration, which strongly contributes to story drift demands as its period of vibration is close to the fundamental period of the soil deposit at these locations (i.e. slightly less than 1 s). These results illustrate how the proposed regional framework can help not only identify the buildings with the largest probabilities of yielding and fracture but also the floor levels and orientations where the damage may have occurred. Moreover, the results highlight that the proposed regional framework can predict significant differences in the structural performance across nearby buildings, which other methods would identify as performing in a nearly identical way.
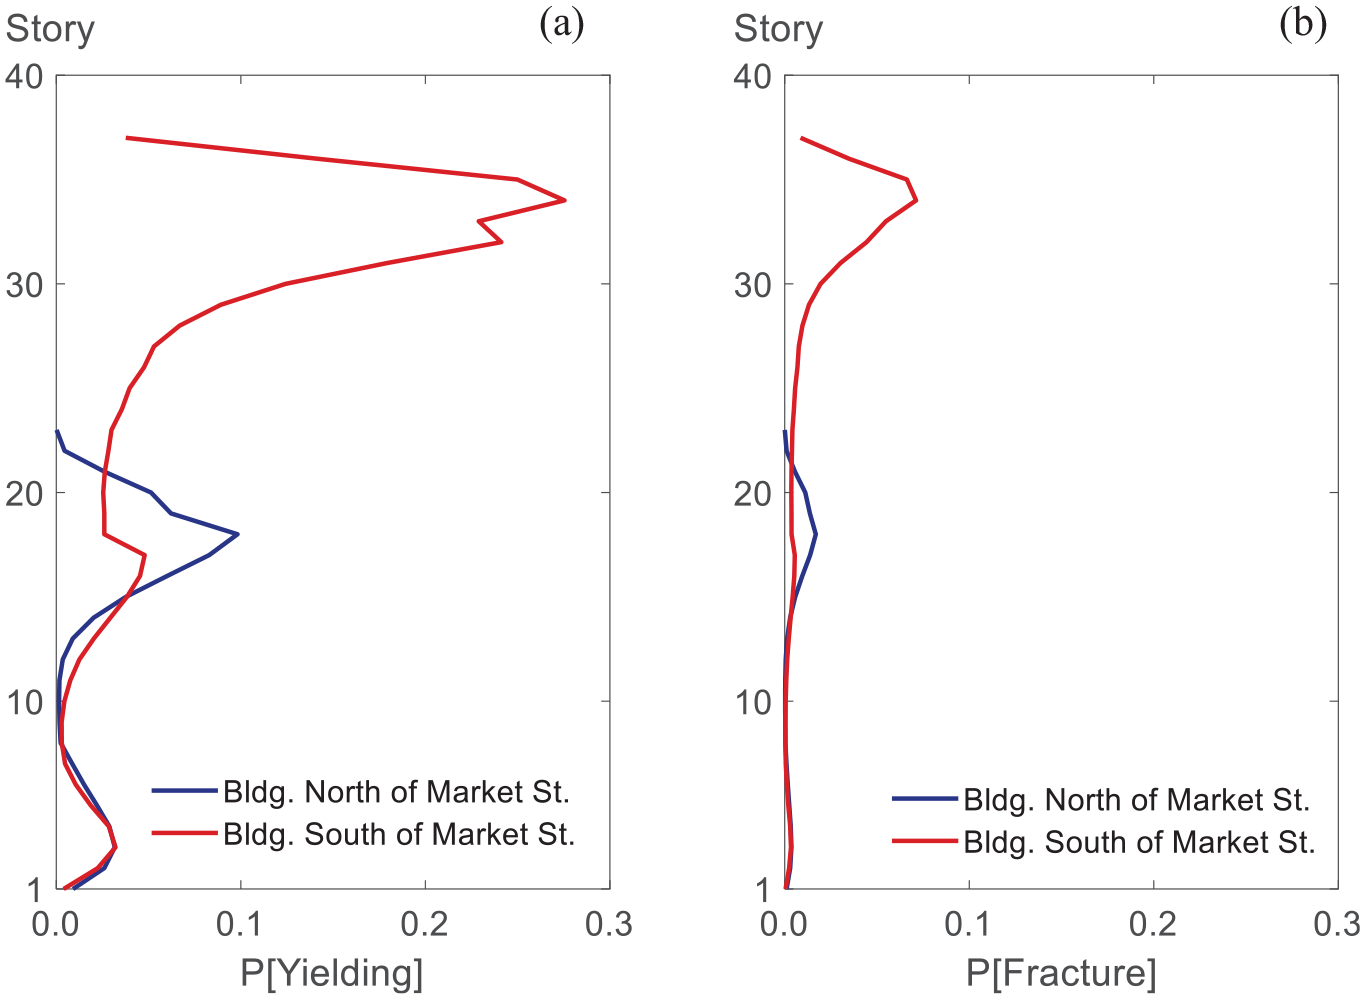
Profiles of median (a) probabilities of yielding and (b) probabilities of fracture along the height of the two buildings immediately to the north (shown in blue lines) and to the south (shown in red lines) of Market Street in the building orientation giving the maximum IDR of both principal orientations.
Regional seismic risk assessment and analysis
This section presents the results for seismic hazard, building response, and building damage for the whole portfolio of 97 pre-Northridge tall SMRF buildings in downtown San Francisco. Figure 9 shows maps of median 5%-damped RotD50 pseudo-acceleration response spectral ordinates at each site overlain by a building at periods of 1 s (Figure 9a) and 3 s (Figure 9b). Response spectral ordinates are, as expected, much greater at 1 s than 3 s because the maximum site periods in downtown San Francisco are around 1 s, and as shown in Figure 6, response spectral ordinates generally decrease for periods longer than the site period at softer soil sites. Moreover, sites centered around Market Street, especially those immediately south of Market Street, experience the greatest acceleration demands and have greater spectral ordinates at 1 s than sites further away from Market Street. This difference is because sites centered around Market Street, representing the deepest area of downtown San Francisco, have site periods of around 1 s while sites further away from Market Street have considerably shorter predominant periods of the soil deposit. Unlike other procedures where sites with the same site class (e.g. site class D) would be subjected to the same seismic demands, in the proposed approach, based on a simplified site response analysis at each building site, seismic demands can change by more than a factor of three across very short distances (e.g. 300 m).
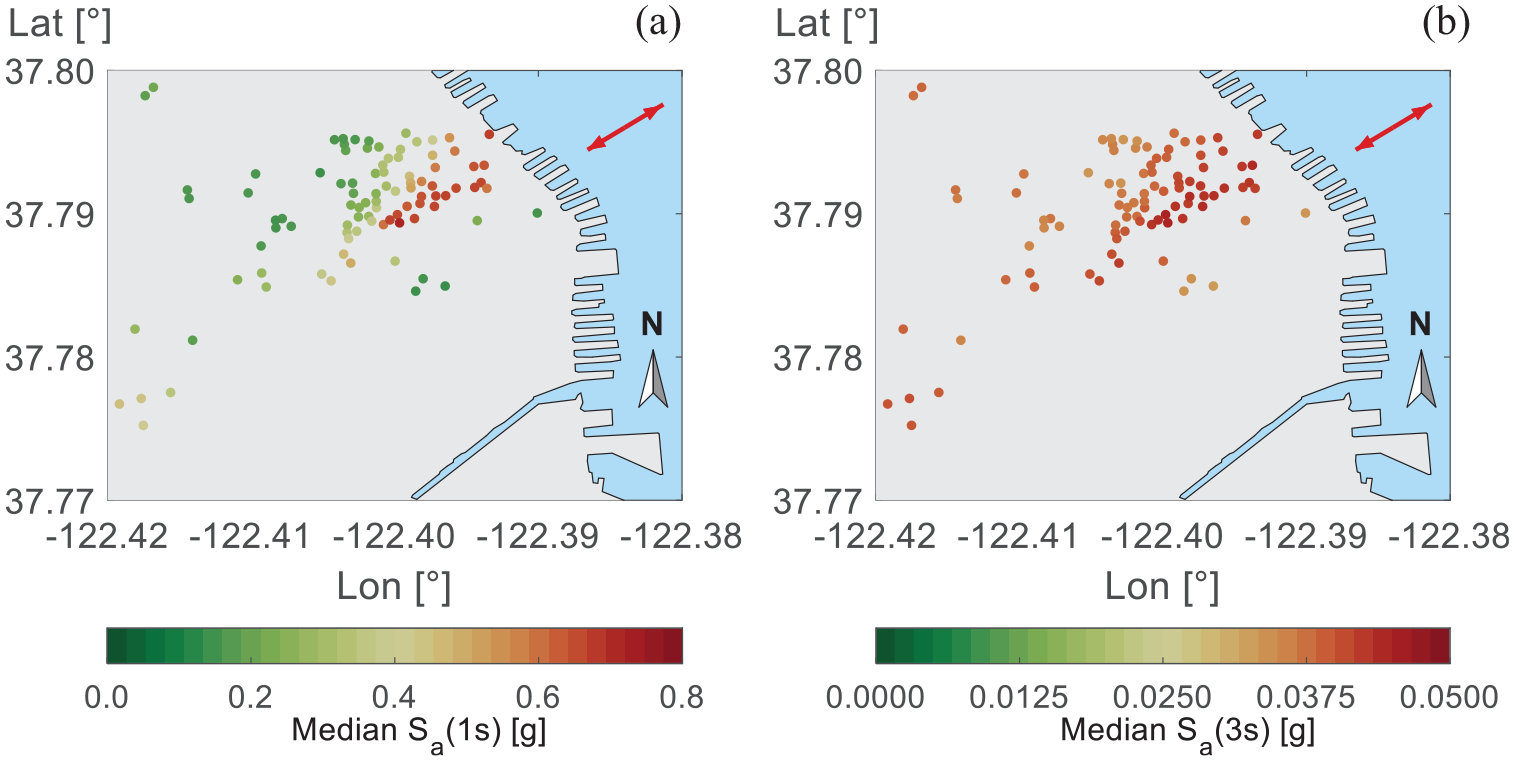
Map of median 5%-damped RotD50 pseudo-acceleration response spectral ordinates at periods of (a) 1 second and (b) 3 seconds at all 97 sites considered in the regional analysis. The red arrow shows the assumed orientation of RotD100.
To provide information on IDR demands at the regional level, Figure 10 shows a three-dimensional map of peak median IDRs for all tall SMRF buildings considered. Peak median IDRs are computed by taking the maximum IDR with respect to the two building principal orientations for each story and simulation, obtaining the median of all 1000 simulations for each story, and finally selecting the maximum value over all stories. Peak median IDRs reach 0.65% for the Loma Prieta earthquake. According to these analyses, tall buildings immediately to the south of Market Street experienced considerably greater IDRs than buildings immediately to the north of Market Street. This difference is because buildings south of Market Street have one of their principal components parallel to Market Street and this orientation is much closer to the orientation of RotD100 than those of the buildings north of Market Street. In addition, buildings south of Market Street are located at sites with greater depths to bedrock, which results in many of their second modal periods of vibration being tuned or nearly tuned to their site periods. Thus, seismic responses, such as IDRs, are greatly amplified in buildings south of Market Street, particularly in their upper portion, compared to sites with shallower depths to bedrock, despite having very soft soil deposits.
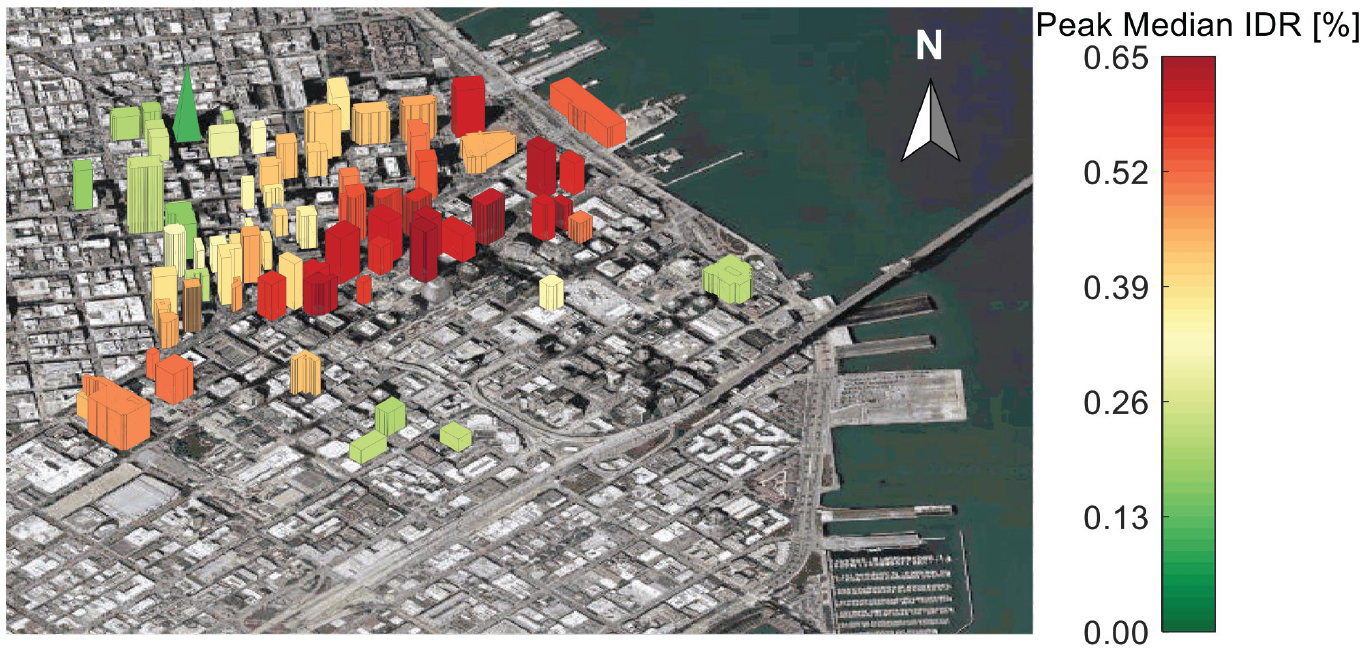
Map of peak median inter-story drift ratios (IDR) for all buildings in the regional analysis.
As in the fourth section, IDR demands were computed using modal response history analysis with the continuous coupled beam model for the four instrumented buildings that recorded the Loma Prieta earthquake in order to illustrate the role of building height, location, orientation, and ground motion directionality on IDR demands along the height. Using modal response analysis, the
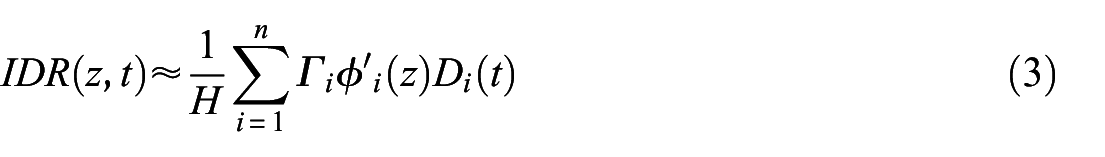
where
Profiles of median inter-story drift ratio (IDR) demands over the height of four buildings in their Northeast-Southwest principal orientation when subjected to the Loma Prieta earthquake. These profiles are computed with modal response history analysis and the continuous non-uniform coupled beam model. IDR profiles are shown when considering only the first mode (blue lines), only the first 2 modes (orange lines), only the first 3 modes (red lines), and when considering the first 10 modes (black lines). The four buildings are: (a) the 48-story TransAmerica Building; (b) the 40-story Chevron Building; (c) the 18-story Building at Sansome Street; and (d) the 47-story Embarcadero Building.
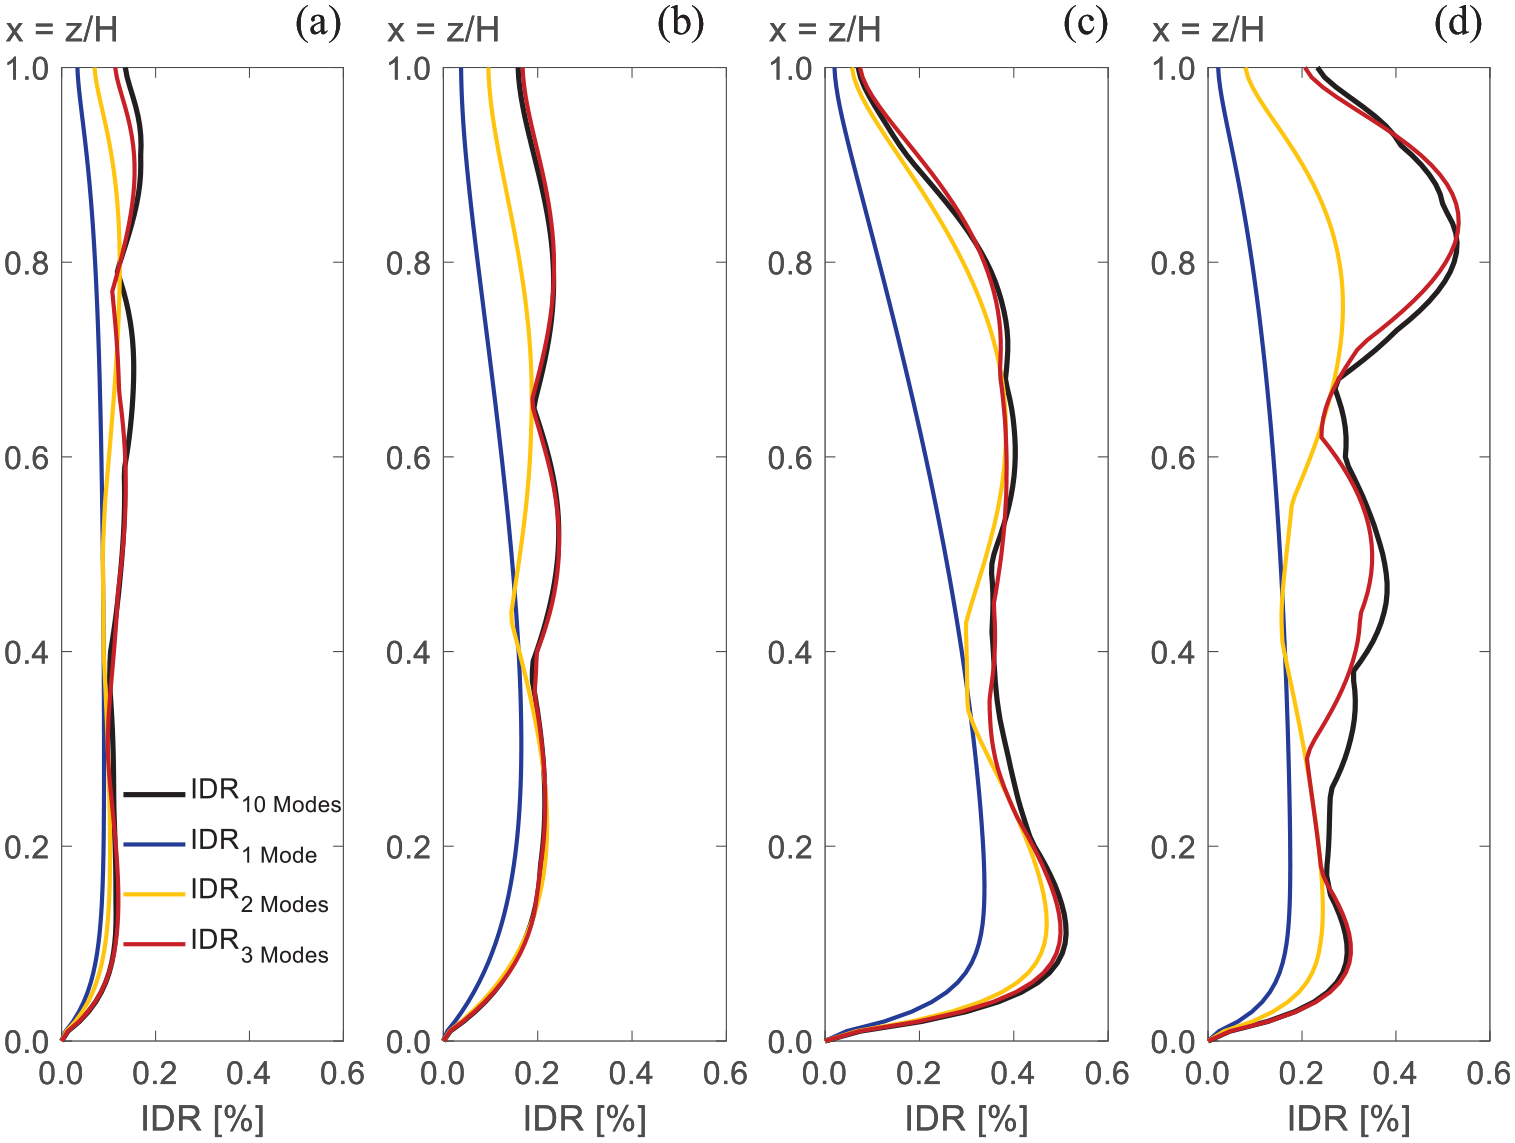
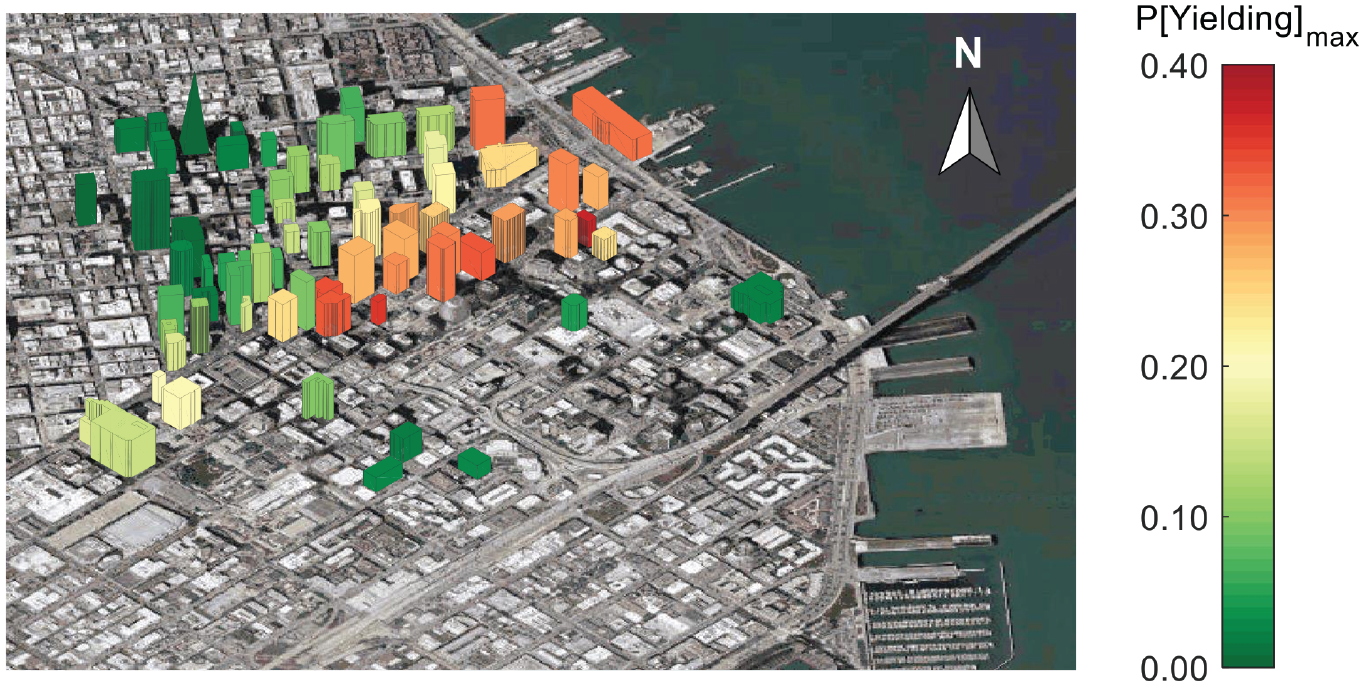
Three-dimensional maps of the peak median probabilities of yielding and fracture for the pre-Northridge tall SMRF buildings in downtown San Francisco are shown in Figures 12 and 13, respectively. This peak value for each building corresponds to the maximum value over both the height and two principal orientations of the profile of median probabilities of damage (Figure 8). Again, as expected, the probabilities of yielding are much larger than the probabilities of fracture for each building. In addition, peak median probabilities of yielding and fracture do not exceed 0.37 and 0.12, respectively. As with IDR demands, results indicate that buildings immediately to the south of Market Street had, in general, greater probabilities of damage than buildings immediately to the north of Market Street. The probabilities of yielding and fracture are, on average, larger in buildings located at sites where the depth to bedrock is larger, which results in greater lateral displacement demands.
Map of peak median probabilities of yielding for all buildings in the regional analysis.
Map of peak median probabilities of fracture for all buildings in the regional analysis.
The simulated damage results suggest that there is a significant probability that several tall SMRF buildings south of Market Street experienced some yielding of pre-Northridge beam-column connections during the Loma Prieta earthquake. Connection yielding is significant to consider structurally because it can trigger residual drifts, increases the possibility of experiencing global or local buckling and, for some connections, fracture may occur shortly after (Ramirez et al., 2012). Probabilities of yielding range between 20% and 40%, especially in the buildings south of Market Street. These probabilities are high enough that they cannot be ignored, especially considering that these results only correspond to the median of all simulations. The median indicates that there is a 50% chance that some of these connections in the buildings immediately south of Market Street experienced greater than the 20%–40% probabilities of yielding given in Figure 12. For example, the 90th percentile probabilities of yielding ranged between 60% and 76% for the connections in the buildings immediately south of Market Street, suggesting that yielding in the connections of some of the buildings located in this part of the city probably occurred. At the same time, the 90th percentile and 10th percentile probabilities of yielding for connections in buildings not immediately north and south of Market Street do not surpass 40% and 3%, respectively, suggesting that yielding in the connections for the buildings not immediately south of Market Street did not widely occur. The 90th percentile probabilities of fracture ranged between 25% and 45% for the connections in the buildings immediately south of Market Street, but the 10th percentile probabilities of fracture did not exceed 1.2% in any building. This suggests, along with the median peak probabilities of fracture shown in Figure 13, that while a few pre-Northridge SMRF beam-column connections may have fractured during the Loma Prieta earthquake, particularly in the buildings immediately south of Market Street, there was likely not a widespread fracturing of these connections over many buildings. Moreover, the probabilities of fracture are small enough that even if a few connections did fracture, this would not be enough to notice severe damage to a building or for a building to collapse. For the connections in buildings not immediately south of Market Street, the 90th percentile probabilities of fracture do not exceed 15%, strongly suggesting that these buildings did not suffer from fractures of beam-column connections. The low probability of fractures computed in this study is consistent with the fact that no fractures were reported immediately after the earthquake in San Francisco and that no tall buildings in downtown San Francisco collapsed during the Loma Prieta earthquake. However, the fact that no fractures in beam-column connections in tall SMRF buildings in San Francisco were reported right after the Loma Prieta earthquake does not necessarily mean that they did not occur. This study helps identify those buildings where fracture is more likely to have occurred.
Summary and conclusions
The primary objective of this research was to evaluate seismic demands on tall SMRF buildings in downtown San Francisco during the 1989 Loma Prieta earthquake. A regional seismic response and damage estimation of the 97 tallest SMRF buildings in San Francisco subjected to the Loma Prieta earthquake using the simplified framework proposed by Bantis et al. (2024b) was conducted. More specifically, interstory drift demands along with probabilities of yielding and fracture of pre-Northridge beam-column connections were computed.
Some studies have suggested that the Loma Prieta earthquake was not a very severe test for tall buildings in San Francisco. However, the present research has shown that ground motions recorded in San Francisco during the earthquake had intensities much greater than the expected median intensity based on recent GMMs. In addition, this study showed that seismic demands during the earthquake were, in general, significantly larger than those anticipated by the seismic code used at the time of the earthquake. The regional seismic risk procedure used in this investigation makes use of a simplified site response analysis at the location of each building to explicitly account for site effects and, in particular, for local site resonances. These local resonances are often neglected in regional seismic risk studies where sites are typically only characterized by the average shear-wave velocity of the upper 30 m of the soil deposits, and ground motion intensities are directly estimated by GMMs. Results indicate that response spectral ordinates had very large variability within the Financial District with variations between sites of more than a factor of three, even at small separation distances such as 300 m. It was shown that ground motions during the Loma Prieta earthquake were strongly polarized, with intensities in some orientations being more than twice those of other orientations. Furthermore, examination of the orientation of maximum intensity obtained from recorded ground motions indicates that this orientation was practically the same across the peninsula of San Francisco and it was very close to the transverse orientation of the earthquake, consistent with recent findings by Poulos and Miranda (2023).
The effectiveness of the continuous shear-flexural coupled non-uniform beam model proposed by Alonso-Rodriguez and Miranda (2016) and adopted in the Bantis et al. (2024b) regional framework to characterize the dynamic properties of buildings was evaluated by comparing the responses with this model in combination with modal response history analyses to the recorded responses in four instrumented tall buildings. Modal response spectrum analyses explicitly accounting for ground motion directionality and building orientation were then used to simulate seismic responses in each principal orientation of every building when subjected to 1000 simulated response spectra at their bases. Improved fragility functions for the damage states of yielding and fracture of pre-Northridge beam-column connections were developed in this work to estimate the probabilities of these types of damage in each story and each orientation of the 97 tall SMRF buildings in downtown San Francisco.
Large variations of IDR demands were computed in the tall buildings in San Francisco despite all buildings being at very similar distances from the fault rupture (i.e. despite all buildings being subjected to the same earthquake magnitude and practically the same distance to the source). The median peak IDR demands (maximum over all stories and both building principal orientations and the median from all individual realizations) varied in tall buildings from as little as 0.10% to as high as 0.65%. Variations were primarily controlled by the height of the buildings, the depth to bedrock at each building location, the building orientation, and the ground motion directionality. In general, buildings located south of Market Street had greater IDR demands than buildings north of Market Street. This difference is because buildings located south of Market Street have one of their principal building orientations parallel to Market Street, and this orientation was relatively close to the orientation of RotD100 intensities during the earthquake. This result highlights the importance of building orientation relative to the orientation of maximum intensity, which is typically neglected in regional seismic risk assessments. Furthermore, many tall buildings located south of Market Street are located at sites where the depth to bedrock is greatest in the city. This produced large ground motion amplifications for periods between 0.7 and 1.0 s, resulting in large deformation demands for the second mode of vibration of many of these tall buildings, which are tuned or nearly tuned to the predominant period of the underlying soil deposits. Median peak probabilities of yielding (maximum over all stories and both building principal orientations and the median from all individual realizations) ranged from less than 2% for buildings located on either rock or sites with small depths to bedrock up to 37% in buildings built on sites with the greatest depths to bedrock such as those on Mission Street. Median peak probabilities of fracture ranged from less than 1% up to 12%, again with the highest probabilities of fracture occurring south of Market Street, near Mission Street, where buildings are located at sites with the deepest depths to bedrock.
Simplified site response analyses used in this study, which make use of a one-dimensional non-uniform shear beam model with linear behavior, or the simplified modal response spectrum analyses of tall buildings, which make use of the non-uniform coupled flexural-shear beam model, are not intended to replace detailed analyses with complex models and complete information of mechanical properties of each soil layer and geometry and material properties of all structural elements and their connections. Instead, these simplified models of the soil deposits and buildings allow for quick estimates of response spectra at hundreds or thousands of sites and building responses for hundreds or thousands of buildings using only a small number of parameters and publicly available information. The reader should note that the simplified one-dimensional linear elastic models used in the framework to obtain the dynamic properties and response of both the soil deposits and buildings for all sites provides adequate results for situations in which the response is elastic or for cases where the nonlinear response does not differ significantly from the peak linear response, such as where the equal displacement approximation can be used. For other cases where the response is highly nonlinear, the framework can successfully identify sites or buildings where nonlinear models should be used instead (Bantis et al., 2024a; Bantis et al., 2024b). In addition, the simplified site response analysis procedure adopted in the framework is based on a one-dimensional site analysis and, therefore, inherits some of its limitations, particularly for sites with strong lateral heterogeneities, such as those near the edges of deep basins where two- or three-dimensional analyses are necessary. The results presented herein for tall buildings in the City of San Francisco are based on probabilistic analyses that can be used to identify the sites and periods producing the greatest hazard demands as well as the buildings, floors/stories, and building orientations with the largest seismic demands and probabilities of damage. Since these simplified analyses are not aimed to substitute more detailed analyses, no conclusions should be drawn from this study about the seismic safety of any individual building.
Supplemental Material
sj-docx-1-eqs-10.1177_87552930251334656 – Supplemental material for Regional damage estimation of tall pre-Northridge steel moment-resisting frame buildings in San Francisco during the Loma Prieta earthquake
Supplemental material, sj-docx-1-eqs-10.1177_87552930251334656 for Regional damage estimation of tall pre-Northridge steel moment-resisting frame buildings in San Francisco during the Loma Prieta earthquake by James Bantis, Eduardo Miranda and Pablo Heresi in Earthquake Spectra
Footnotes
Acknowledgements
The ground motions used in this investigation were provided by the USGS and CSMIP. Efforts to install and maintain seismic instrumentation and to collect, process, and disseminate seismic records are greatly acknowledged.
Declaration of conflicting interests
The author(s) declared no potential conflicts of interest with respect to the research, authorship, and/or publication of this article.
Funding
The author(s) disclosed receipt of the following financial support for the research, authorship, and/or publication of this article: The authors would like to thank the financial support they received that allowed them to conduct this investigation. Financial aid to the first author to pursue doctoral studies at Stanford University under the supervision of the second author was provided by The Shah Family Fund in the School of Engineering from the Department of Civil and Environmental Engineering at Stanford University and The National Defense Science and Engineering Graduate Fellowship from the Department of Defense. This financial aid is greatly appreciated. The third author acknowledges the financial support of ANID FONDECYT Iniciación en Investigación (grant no. 11230463). The authors also thank the financial support of the UPS Endowment Fund for Transportation, Logistics, and Urban Issues at Stanford.
Data and Resources
Ground motion data utilized in this study are available at https://www.strongmotioncenter.org. Site and building information required to conduct the regional analysis were obtained from the San Francisco Tall Buildings Study (ATC-119, 2018). The regional framework of ![]() and summarized in this study was coded in MATLAB in order to conduct the regional seismic risk assessment.
and summarized in this study was coded in MATLAB in order to conduct the regional seismic risk assessment.
Supplemental material
Supplemental material for this article is available online.
References
Supplementary Material
Please find the following supplemental material available below.
For Open Access articles published under a Creative Commons License, all supplemental material carries the same license as the article it is associated with.
For non-Open Access articles published, all supplemental material carries a non-exclusive license, and permission requests for re-use of supplemental material or any part of supplemental material shall be sent directly to the copyright owner as specified in the copyright notice associated with the article.