
Abstract
High impact polystyrene sheets (HIPS) of 1.5 mm and 2.5 mm thicknesses were thermoformed on moulds of different parameters at sheet heating temperatures of 130℃ and 140℃. Formability studies indicated no difference in wall thickness distribution at different sheet temperatures. Due to non-uniform stretching of the sheet, wall thickness distribution along the slant length was found to have three regions. In the regions near the mould corner and clamp point, wall thickness was found to decrease with increase in distance from the corner, in these zones. The decrease near the corner was much greater and sharper than that near the clamp point. The decrease in both regions was found to increase at higher depths of draw and decrease at higher draft angles. In the intermediate portion of the slant length, no significant variation in wall thickness was observed.
Introduction
In positive thermoforming, a clamped thermoplastic sheet made pliable by heating is shaped by pushing up a male mould against it, followed by the application of vacuum. Achieving uniform wall thickness distribution and optimum average wall thickness is extremely important in the manufacture of high quality thermoformed parts. However, uneven wall thickness distribution and excessive thinning in certain portions of the part are some of the main problems associated with thermoforming. Typically, thermoformed parts do not have uniform wall thickness. The thickest and thinnest portions of the part are observed where the sheet touches the mould first and last, respectively. Since excessive thinning can be a cause of failure due to low strength related to thickness or to high orientation, the design and process should be optimized for getting a part with uniform wall thickness distribution, without excessive thinning at any point. An understanding of the effects of the parameters important in thermoforming is essential for the process of optimization.1–3
One of the tools used for predicting thermoformability is hot uniaxial tensile test. The draw ratio (ratio of the cross-sectional area before stretching to the cross-sectional area after stretching) of a tensile specimen is maximum at the centre and decreases gradually towards the ends. Thus the draw ratio distribution is found to be an ‘inverted V’ shaped curve. Homogeneous deformation of a polymer leads to a more uniform draw ratio distribution, resulting in a shallow, or an ‘inverted dish’ shaped curve. This indicates more uniformity in wall thickness distribution in thermoforming. 4
Heat transfer and the technique of heating largely influence the technical aspects of thermoforming. An improperly heated sheet gives rise to parts of inferior quality. In any thermoforming process, the base-line objective should be the attainment of uniform temperature throughout the sheet surface and across the sheet. 5 The thermoforming of thick sheets presents difficulties. According to Labeas et al., 6 the surface of a thick sheet may get heated to a temperature significantly higher than the forming temperature while the core is still below the forming temperature. This gives rise to non-uniform stretchability across the sheet thickness, resulting in an increased tendency to rupture, poor shape conformance and uneven wall thickness distribution. 7 According to Throne, 8 for thermoforming of a thick sheet using double-sided heating, by controlling the overall rate of heating, the centre-line of the sheet can be heated to the minimum forming temperature, without overheating the surface. Shyam Kumar et al. 9 conducted studies on the thermoforming of thick polypropylene sheets to establish such effect.
In addition to the temperature related factors which are governed by sheet heating, the quality of thermoformed plastic parts depends on the material characteristics, the vacuum/pressure applied and the assisting plug related parameters.10,11
During heating, a clamped sheet on account of thermal expansion first bows while it is still solid. This is followed by softening. During softening, the sheet can extend due to its own weight, acquiring a concave shape. This phenomenon is called sag. Sag influences the distance of each element of the sheet surface from the heaters, and hence can adversely impact the heat flux distribution on the sheet surface and across the sheet thickness. Giacomin et al. have interpreted sag in terms of a gravity-driven melt flow and have derived an analytical solution for determining sag when a sheet is pinned at only two edges, as well as when it is pinned all the way round. They have also derived the heat flux distributions over both faces of a bowing or sagging sheet, along with the corresponding temperature profiles through and across the sheet.12–15
An ideal thermoforming material should not sag much during heating. However, it should flow well during forming. This necessitates a good balance of elastic behaviour (which determines sag) and viscous behaviour (which determines flow). The viscoelastic properties of the polymer profoundly influence the thermoforming process, including the rate at which thermoforming progresses. It is easier to thermoform an amorphous polymer, as compared to a crystalline polymer, since the former shows an appreciable rubbery plateau during heating unlike the latter. Both sag and the depth of draw are influenced by the melt strength of the polymer. Being a measure of the resistance of the polymer to extensional deformation, melt strength is an important processing parameter in all melt processing operations which involve stretching and drawing, such as thermoforming. A higher melt strength is beneficial for thermoforming as it lowers the tendency to sag and enhances deep draw capability.16–21 The sag rate has also been found to be a power law function of the blank, or opening, size. 22
Ayhan and Zhang 23 reported studies on the wall thickness distribution of thermoformed food containers. Wall thickness was found to be significantly affected by forming temperature, pressure, heating time, wall location, container side and their interactions. Thickness distribution was also found to improve when the plug velocity increased and the stretching time decreased. 24
Figure 1 is a schematic of the mould and the clamped sheet during positive forming. The portion of the sheet OB which comes in contact with the upper mould surface freezes and is stretched the least. The remaining portion BP is stretched between the mould corner B and the clamp point P. As vacuum is applied, BP gradually lays over the mould surface, curving inwards (as depicted by the dotted arcs), and further stretching during the process. Eventually, the slant length BA of the part is formed, along with the section PA, which lies along the mould table and is finally trimmed off.
Schematic showing one-half of the truncated cone male mould during the sheet laying over process in vacuum forming.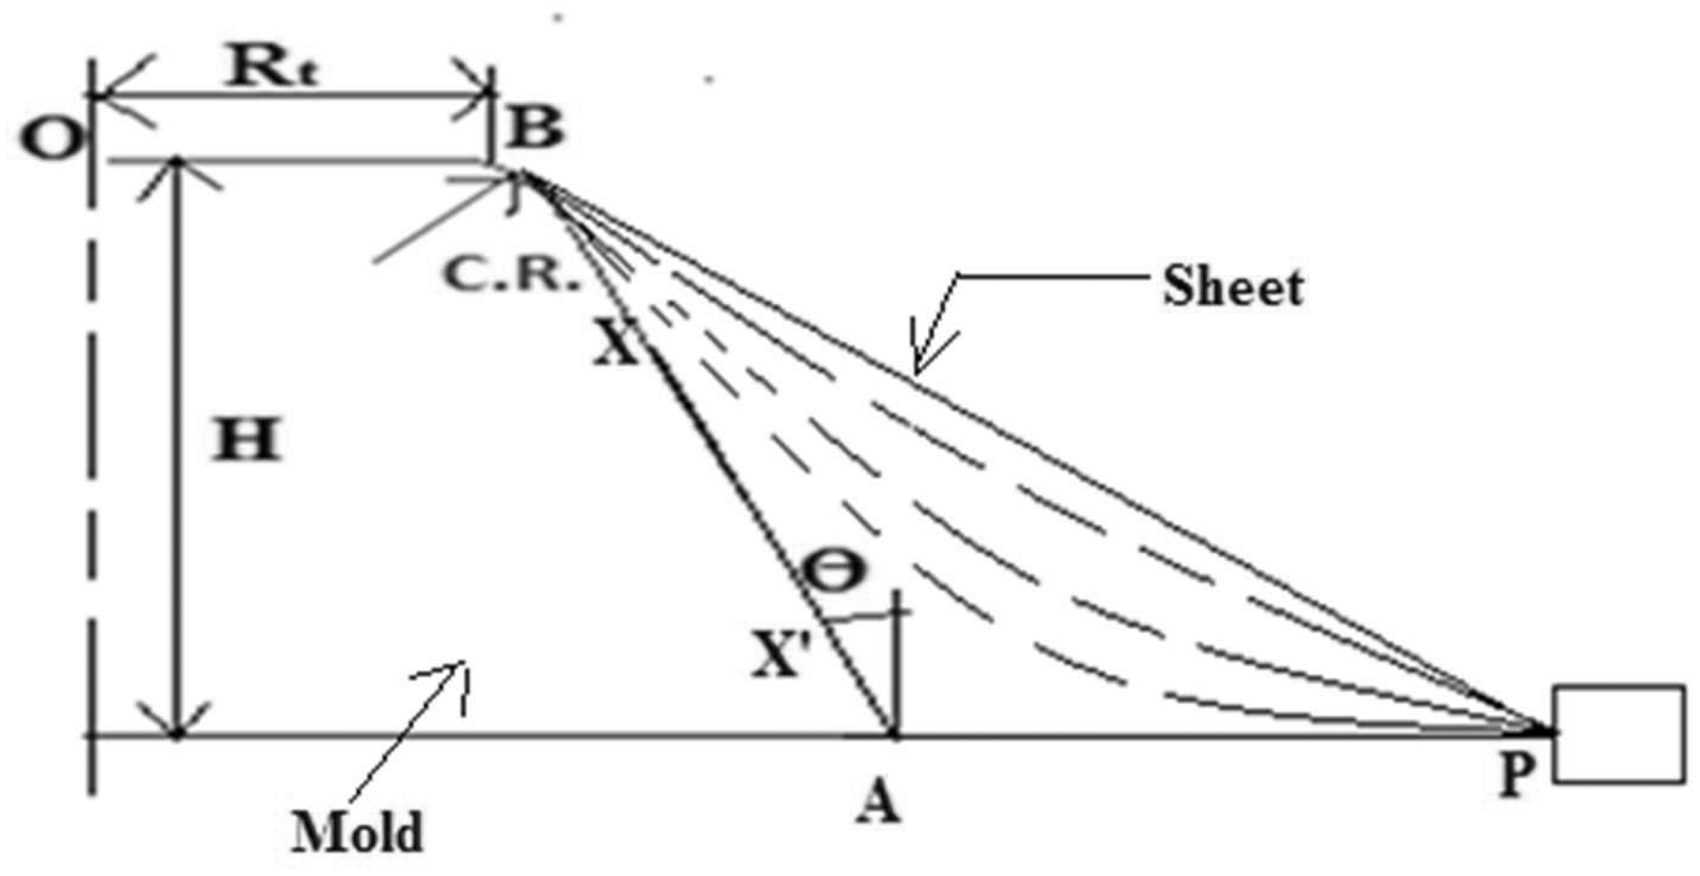
This paper discusses studies on the stretching behaviour of medium gauge high impact polystyrene sheets (HIPS) (1.5 and 2.5 mm thicknesses) during positive thermoforming. Thermoforming was done at different sheet temperatures, on different moulds, with the objective of correlating the sheet stretching and product quality with the thermoforming temperature and mould parameters. Medium gauge HIPS sheets were chosen on account of the popular use of the polymer in thermoforming, coupled with the challenge associated with increased sheet thickness. 25
Experimental
Material
In this study, 18 × 18 inch sheets of HIPS made of BASF Polystyrol 476 L, having thicknesses 1.5 and 2.5 mm, designated as HIPS1.5 and HIPS2.5, respectively, were used. The sheets on being tested as per ASTM D1238 were found to have an average melt flow index (MFI) of 2.5 g/10 min (190℃/5.0 kg).
Hot tensile test
Hot tensile test of the HIPS sheets was performed to understand their thermoforming behaviour, before carrying out thermoforming.
Tests were performed according to ASTM D638, using an Instron 5582 universal tensile testing machine equipped with an environmental chamber. Experiments were performed at 130℃ and 140℃. Tensile specimens of sheets were prepared. Samples were kept in the hot chamber at the desired temperature for a period of 15 min before application of tensile load. A cross-head speed of 10 mm/min was used. The specimens were stretched till 400% strain. After unloading the stretched specimens, the draw ratios along the length of the tensile specimens were determined. The centre of each specimen was marked zero and the width and thickness of the specimen at various points along the central narrow straight part of the specimen were measured to calculate the draw ratio. The initial width of this section was 3.2 mm. Draw ratio was determined on both sides, so as to get the draw ratio distribution with respect to the distance from the centre of the specimen. Three specimens were tested each at 130℃ and 140℃ and the mean result has been reported.
Thermoforming
Mould design
Mould sets (2 A, 2B, 2 C) were designed for study of the effect of draft angle on product quality, all other parameters remaining the same.
Procedure
Sheets were thermoformed in a FORMECH 660 machine. The frame size used in this study was of 13 × 13 inch. The sheets were heated from the top by the ceramic heaters of the thermoforming machine.
The sheet to be formed was clamped. The heaters were switched on. When they reached the set temperature of 200℃, sheet heating was started. When the surface temperature of the sheet, as measured with an infrared temperature gun, reached the desired temperature (130℃ and 140℃ in the different sets of experiments), the heaters were pushed back. The male mould was raised and vacuum was applied. After the details of the mould were embossed on the sheet, vacuum was switched off and air was blown to detach the thermoformed part from the mould. Formability analysis of the parts was conducted.
Formability analysis
The dependence of part quality on sheet heating temperature and mould parameters has been analysed by studying the shape conformance, wall thickness distribution, maximum, minimum and average wall thicknesses of the formed parts. Since the portion of the sheet in contact with the top surface of the mould freezes and does not stretch during the laying over process, only the slant length was chosen for study of wall thickness considering that the flow in the top surface may not affect the final trend in the sheet thickness distribution.
Wall thickness was measured with vernier callipers of least count 0.01 cm and no zero error. Thickness was measured at various points along the slant length (BA in Figure 1), starting from the corner (point B in Figure 1), in order to determine the thickness distribution with respect to the distance from the corner. Also, the average wall thickness along the slant length (BA) was calculated from the measured thickness values.
Results and discussion
Hot tensile test
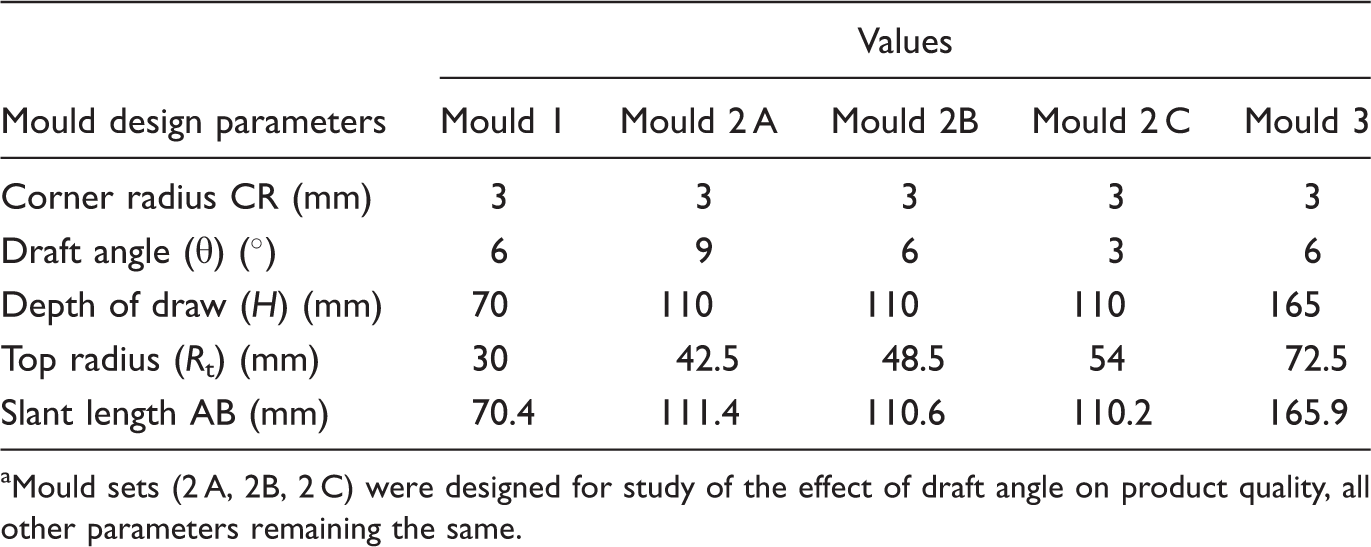
Figure 2(a) and (b) shows the draw ratio distribution with respect to the distance from the centre of the specimen at temperatures 130℃ and 140℃, for HIPS1.5 and HIPS2.5, respectively. It can be seen that irrespective of sheet thickness at both temperatures, the draw ratio distribution curves are ‘inverted-dish’
4
shaped. This indicates that thermoforming at sheet heating temperatures of both 130℃ and 140℃ will lead to reasonably uniform wall thickness distribution.
Draw ratio distribution curves at 400% strain for (a) HIPS1.5 and (b) HIPS2.5. HIPS: high impact polystyrene.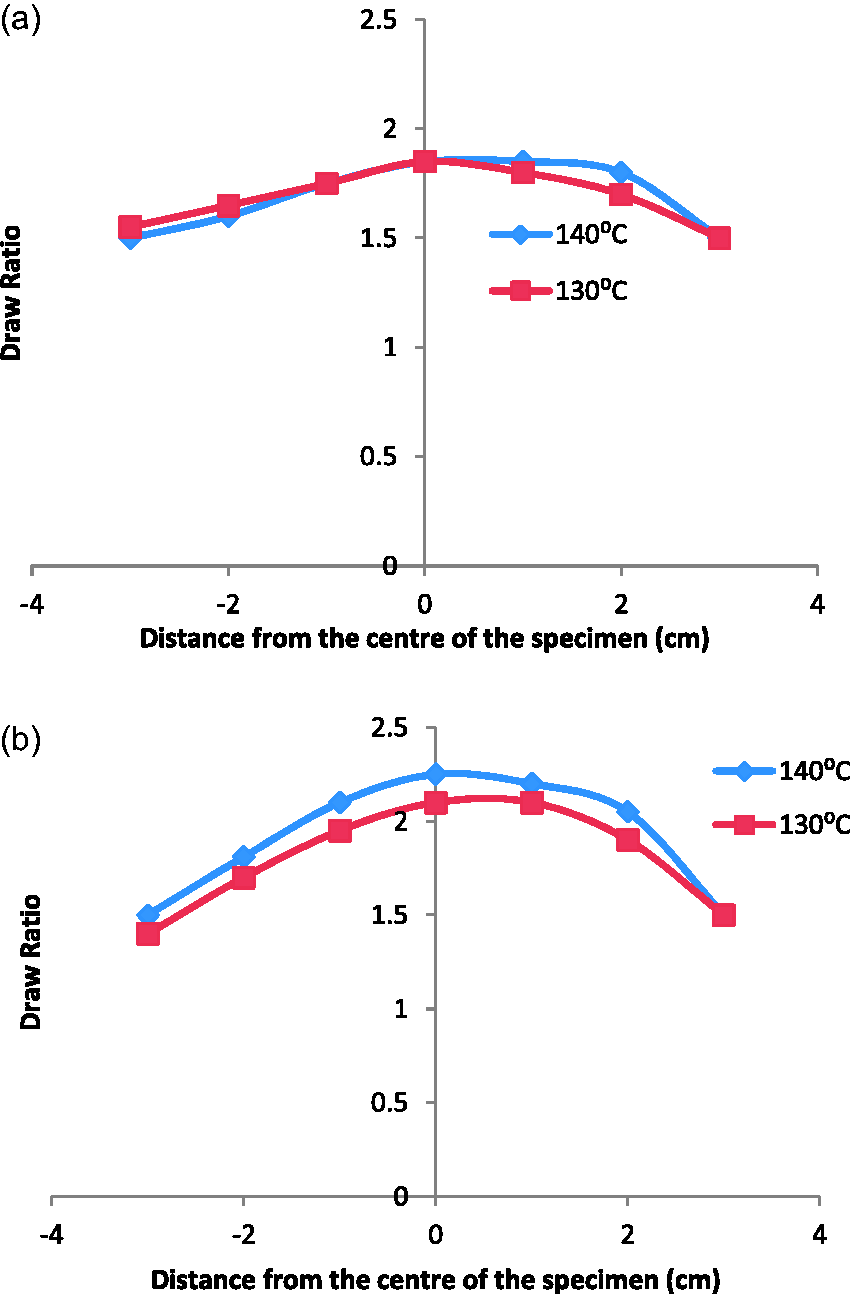
Shape conformance
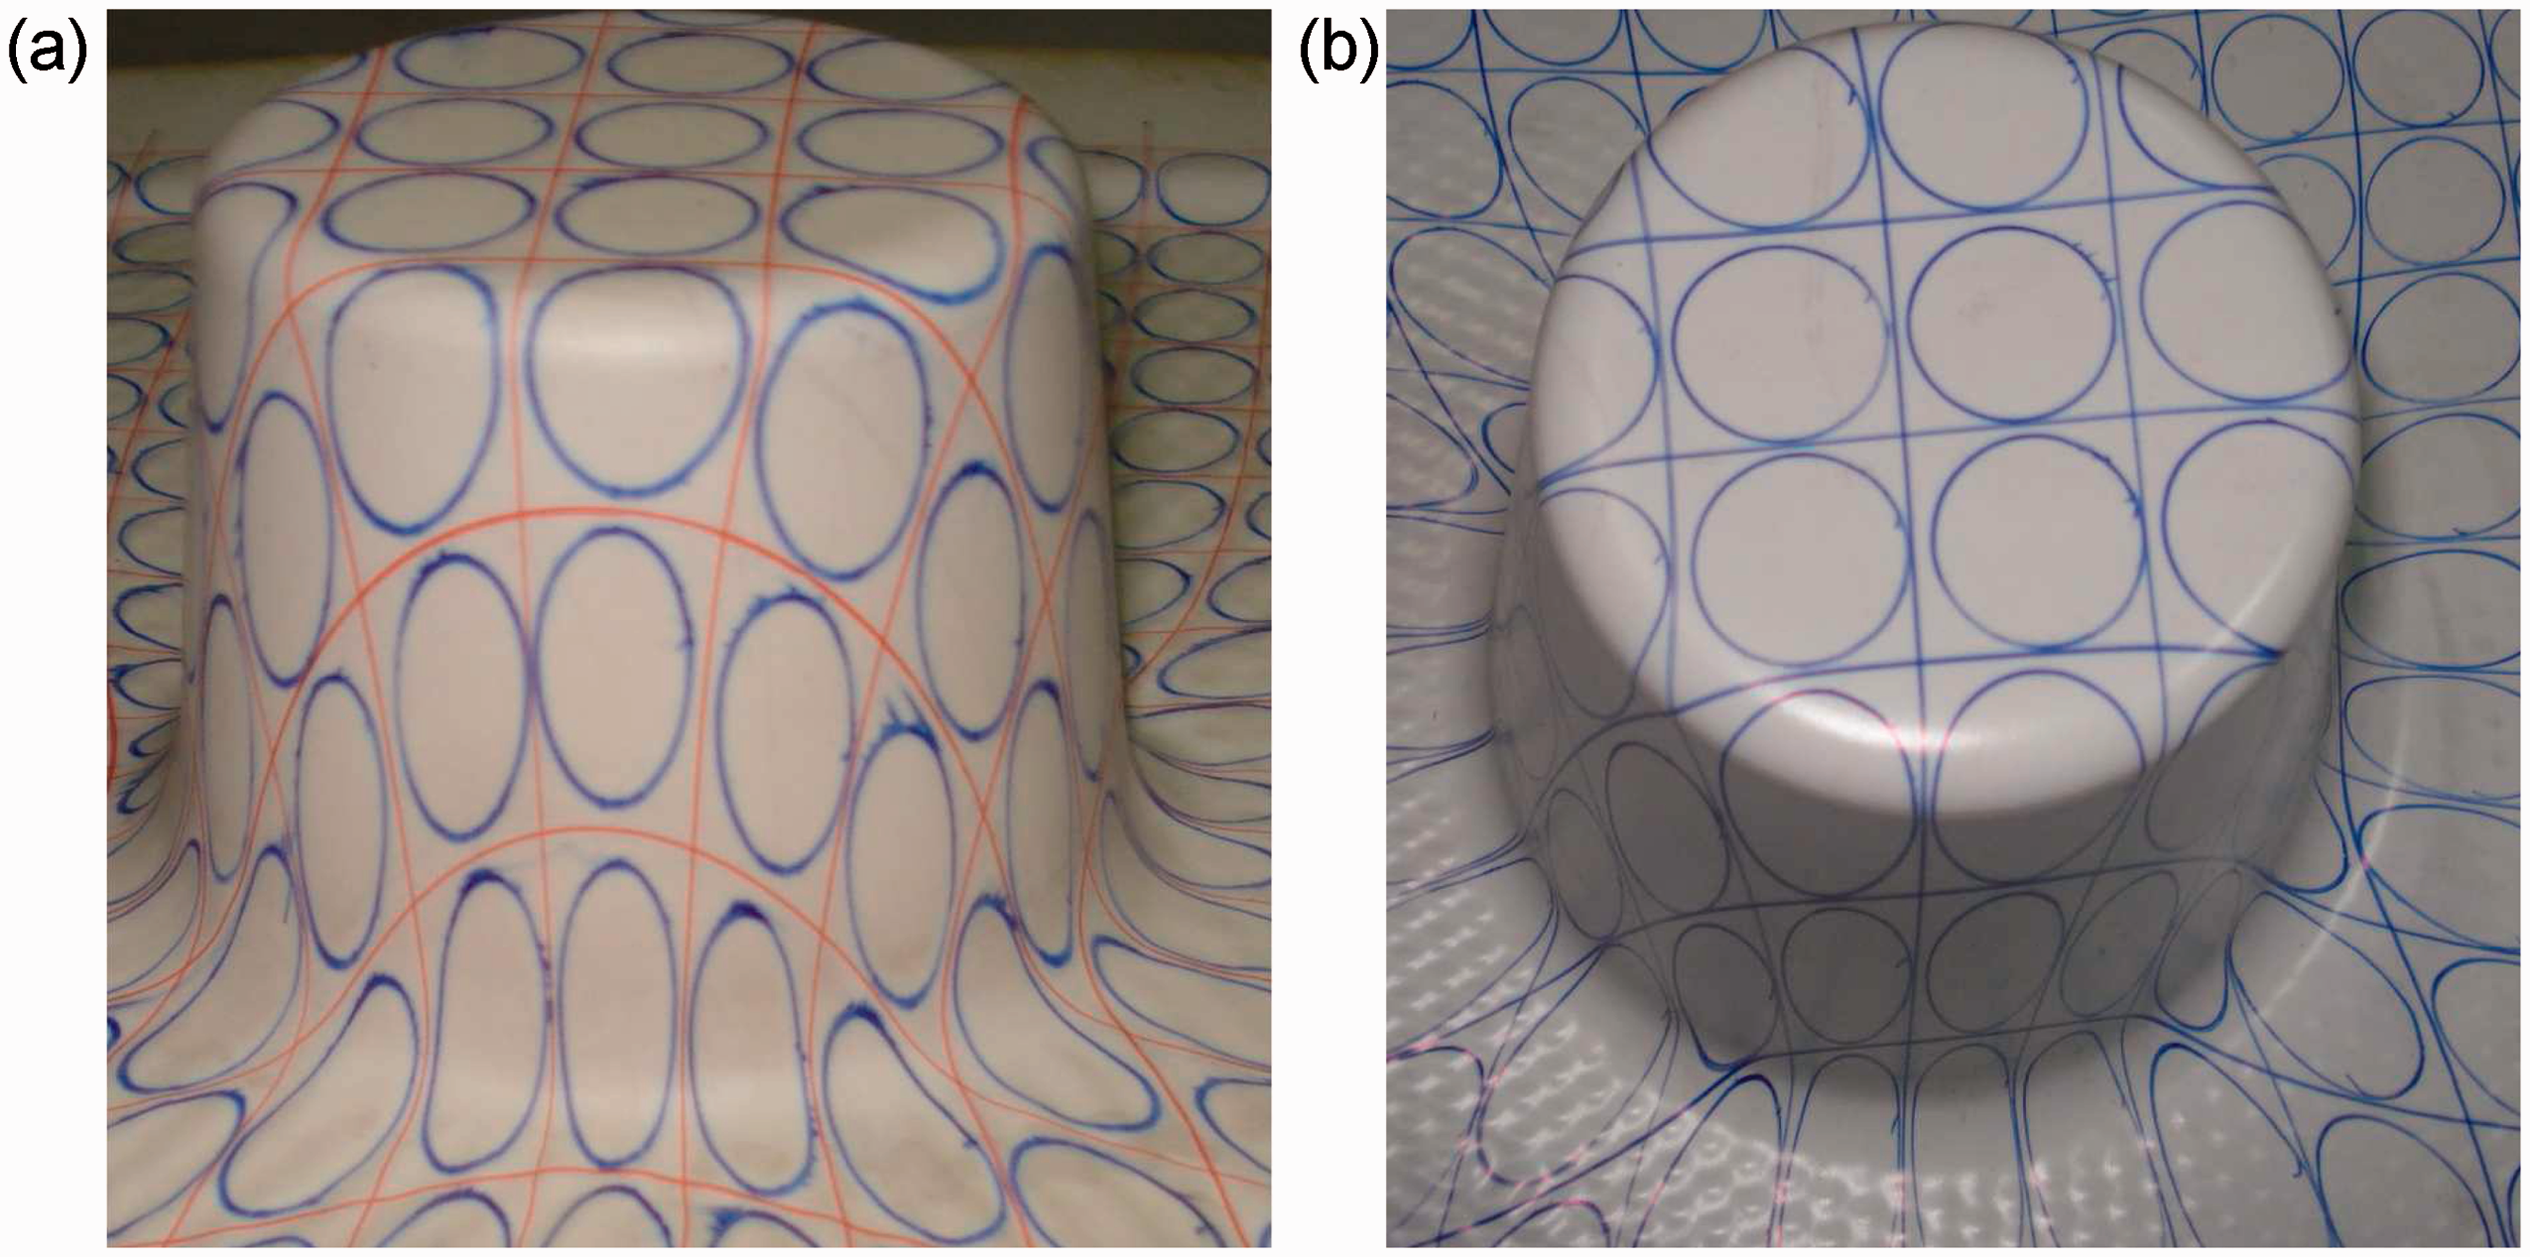
Irrespective of sheet thickness, heating temperature and mould characteristics, all parts were found to have good shape conformance. Figures 3 and 4 show photographs of parts having 110 mm depth of draw formed with HIPS1.5 and HIPS2.5, respectively, at 130℃ and 140℃. It can be seen that with an increase in sheet thickness from 1.5 mm to 2.5 mm, there is no change in appearance of the part, such as appearance of wrinkles or other surface defects.
Parts formed on mould 2 A with HIPS1.5 at (a) 130℃ and (b) 140℃. HIPS: high impact polystyrene. Parts formed on mould 2 A with HIPS2.5 at (a) 130℃ and (c) 140℃. HIPS: high impact polystyrene.
Wall thickness distribution
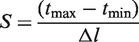
Irrespective of the sheet thickness, sheet heating temperature and mould parameters, wall thickness distribution along the slant length shows three distinct regions. The first region (BX in Figure 1) extends from the mould corner upto a short distance along the slant length. In this region the wall thickness decreases sharply. The second region corresponds to an intermediate portion (XX’ in Figure 1) of the slant length, in which the wall thickness does not show much variation. In the third region (X’A in Figure 1), thickness is found to decrease. But this decrease is less in magnitude and is less sharp as compared to that in region BX. Overall, the wall thickness distribution is reasonably uniform in region XA, as predicted by hot tensile tests. However, BX shows a marked deviation from uniformity of thickness distribution. At B the sheet is virtually under no slip condition. Also, the points close to B on account of their proximity to the mould experience maximum force. As a result, this region is stretched the most and the sheet in region BX is formed even before the application of vacuum. The remaining portion of the slant length (XA) is formed by the laying over process, on the application of vacuum. Since the clamped portion of the sheet is fixed, the section of the sheet close to the clamp point is stretched more during the laying over process, which accounts for the decrease in wall thickness in X’A. The magnitude and sharpness of fall in wall thickness in the two regions BX and X’A have been analysed by calculating dimensionless values Δt and S with the help of equations (1) and (2), respectively.
maximum wall thickness in region of sharp decrease minimum wall thickness in region of sharp decrease length along which the decrease was observed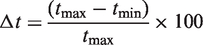
In all cases, ΔtB and SB were found to be more than ΔtA and SA, where subscripts B and A denote regions BX and X’A, respectively. This is because the section of the sheet close to the clamp point, on account of its distance from the mould experiences much less force than the section of the sheet close to the mould. Also, in the region PX’, the sheet lays over gradually not only along the slant length, but also in the region PA, which lies between the clamp and the mould. Hence the stretching is distributed over a larger portion of the sheet X’AP.
Effect of draft angle
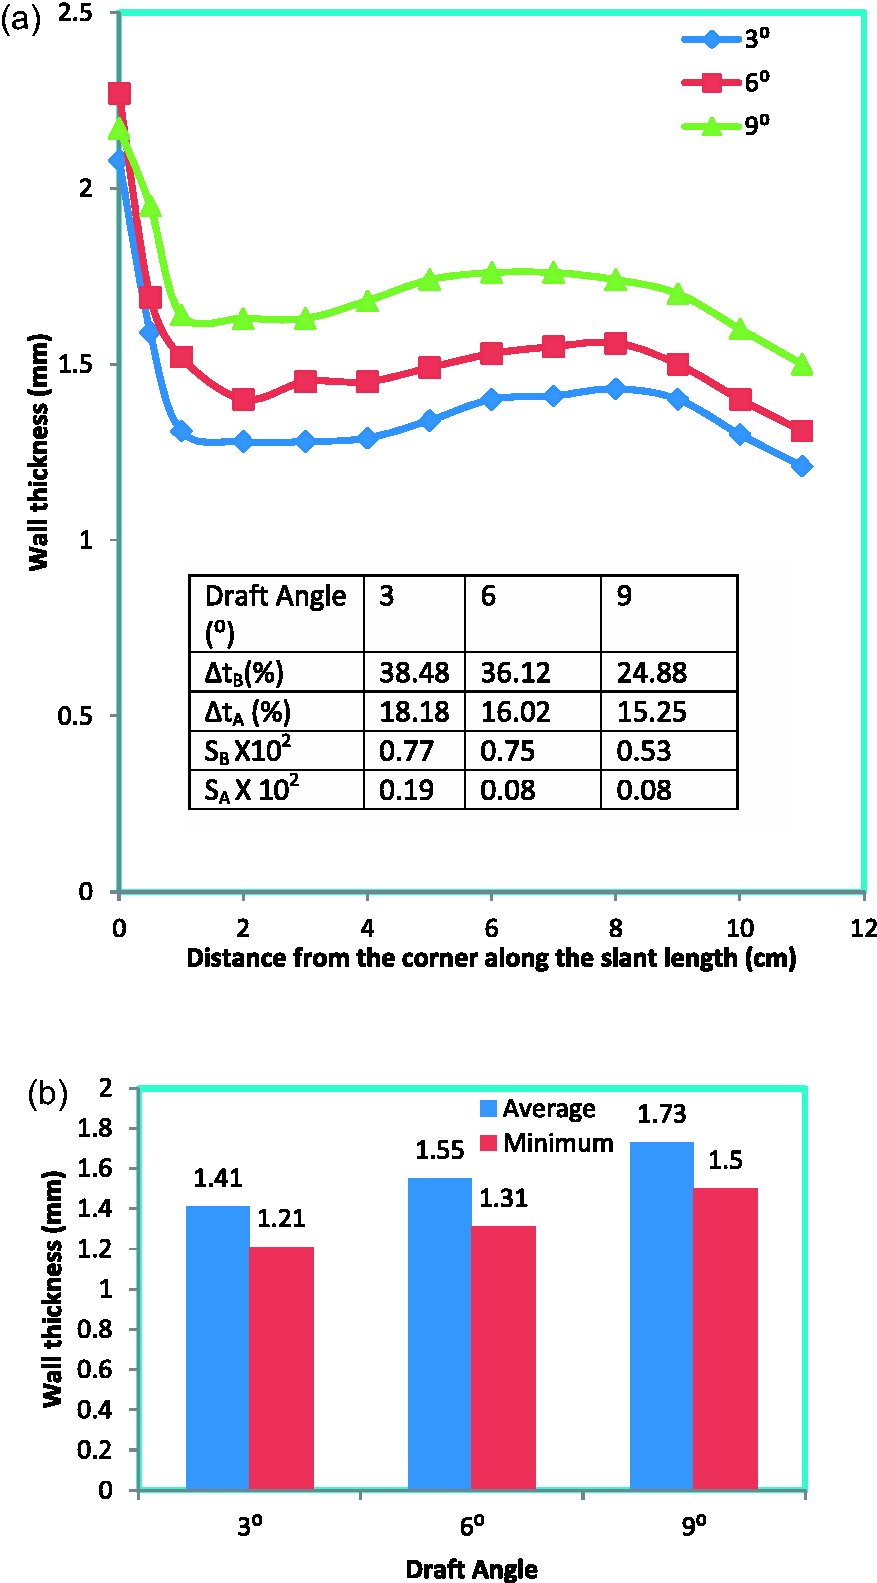
Figures 5 and 6 show the effect of draft angle on wall thickness distribution, average and minimum wall thickness values of parts having depth of draw 110 mm formed with HIPS1.5 and HIPS2.5, respectively, at sheet heating temperature of 140℃. It can be observed that for both HIPS1.5 and HIPS2.5, with an increase in draft angle, values of ΔtB and ΔtA decrease, the values of average and minimum wall thickness increase and almost all points have higher wall thickness. This indicates that a generous value of draft angle is required for higher values of wall thickness and less thinning at the extremities of the slant length. Also, with an increase in draft angle from 3° to 9° the fall in wall thickness at the extremities of the slant length becomes less sharp, as indicated by decrease in values of SB and SA.
Effect of draft angle for HIPS1.5 on (a) wall thickness distribution; (b) average and minimum wall thicknesses along slant length at 110 mm depth of draw (moulds 2 A, 2B and 2 C). HIPS: high impact polystyrene. Effect of draft angle for HIPS2.5 on (a) wall thickness distribution; (b) average and minimum wall thicknesses along slant length at 110 mm depth of draw (moulds 2 A, 2B and 2 C). HIPS: high impact polystyrene.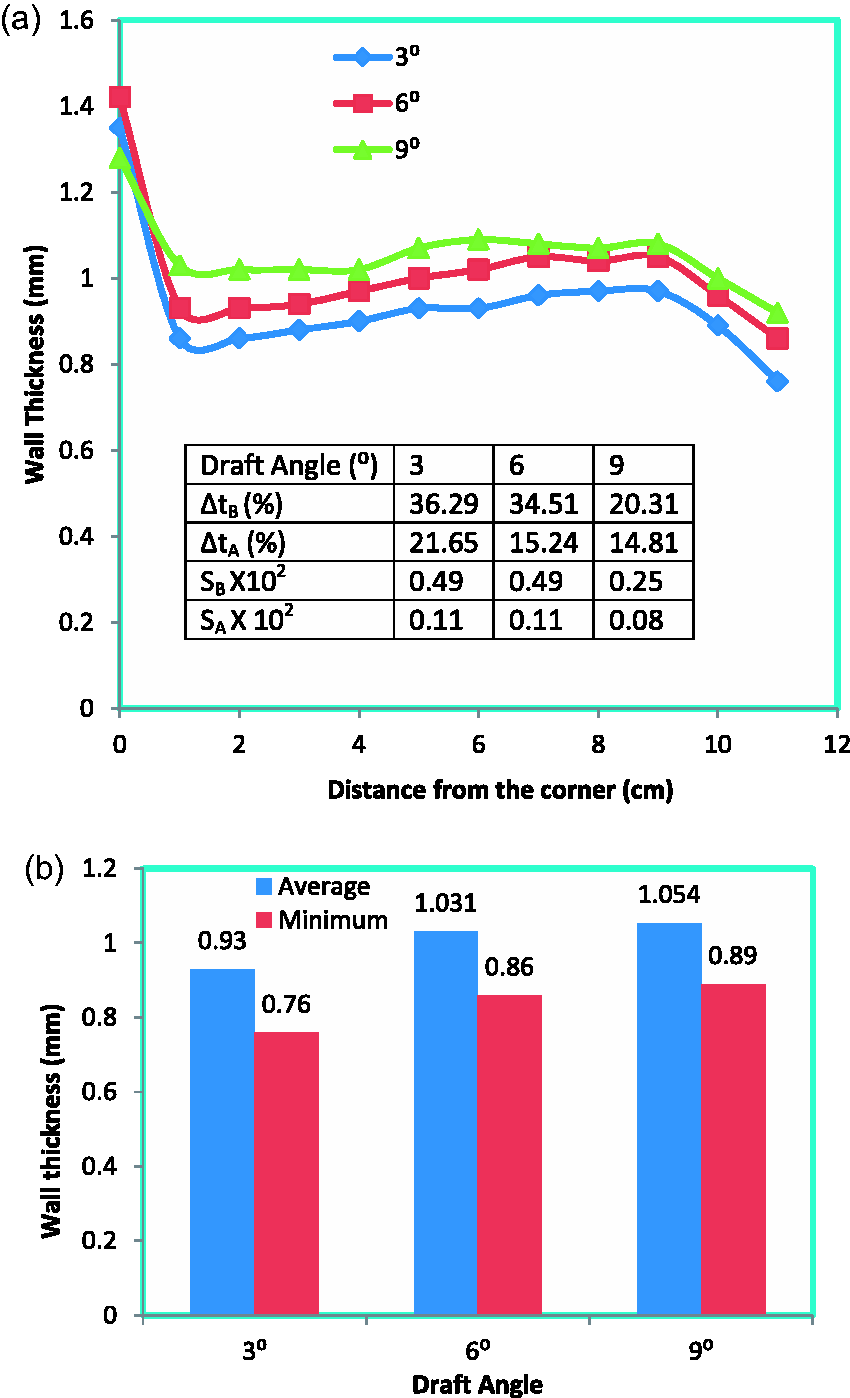
Effect of sheet temperature
Figure 7(a) and (b) shows the effect of sheet heating temperature on wall thickness distribution of parts formed on mould 2B with HIPS1.5 and HIPS2.5, respectively. It can be observed that with change in sheet heating temperature, there is no significant variation in wall thickness distribution. This can be attributed to the fact that HIPS being an amorphous polymer, can be thermoformed in a wide temperature range.
Effect of sheet temperature on wall thickness distribution of (a) HIPS1.5 and (b) HIPS2.5 at 110 mm depth of draw (mould 2B). HIPS: high impact polystyrene.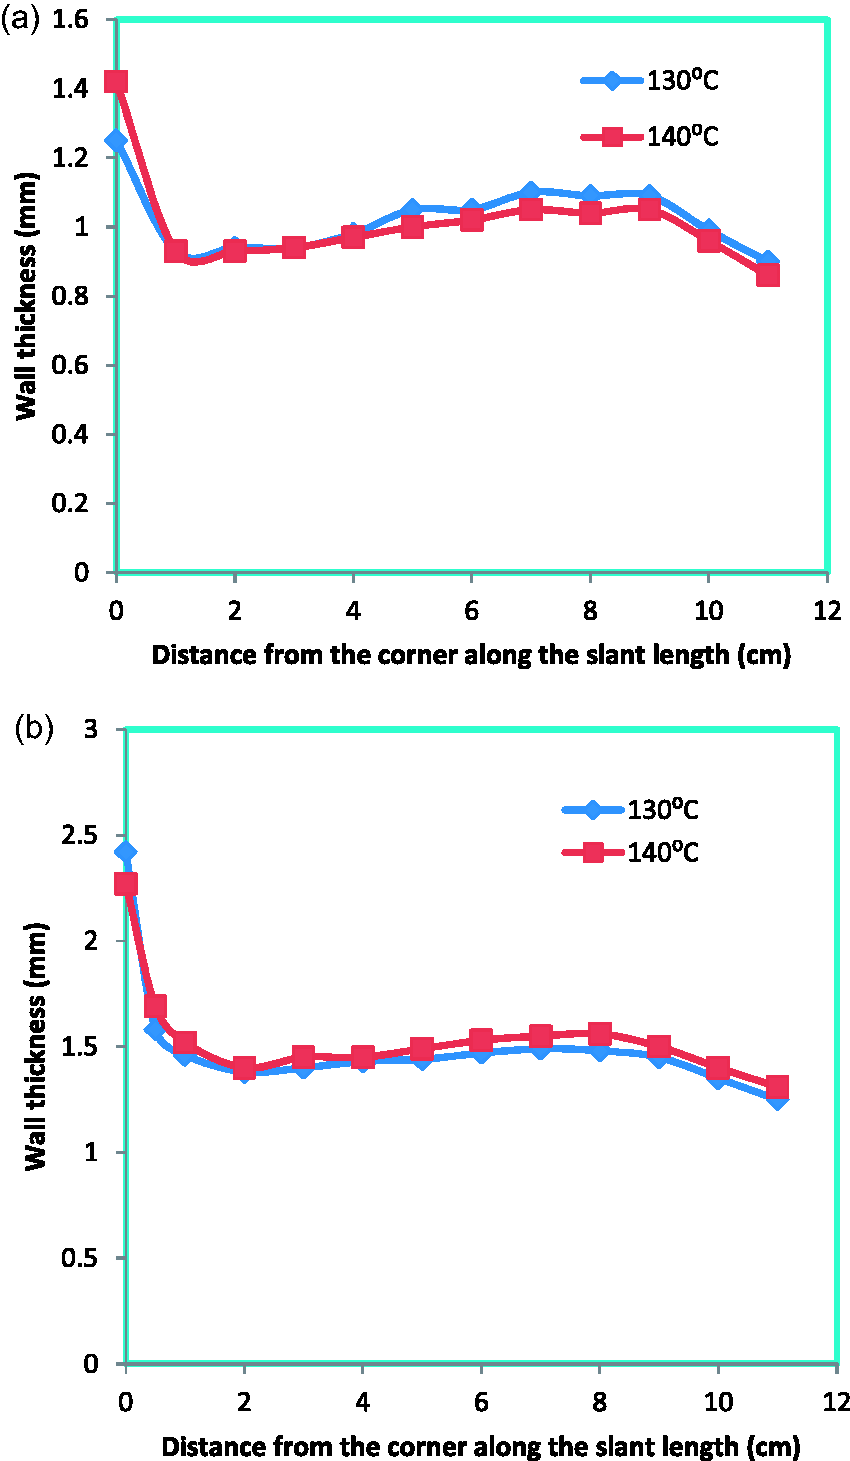
Effect of depth of draw
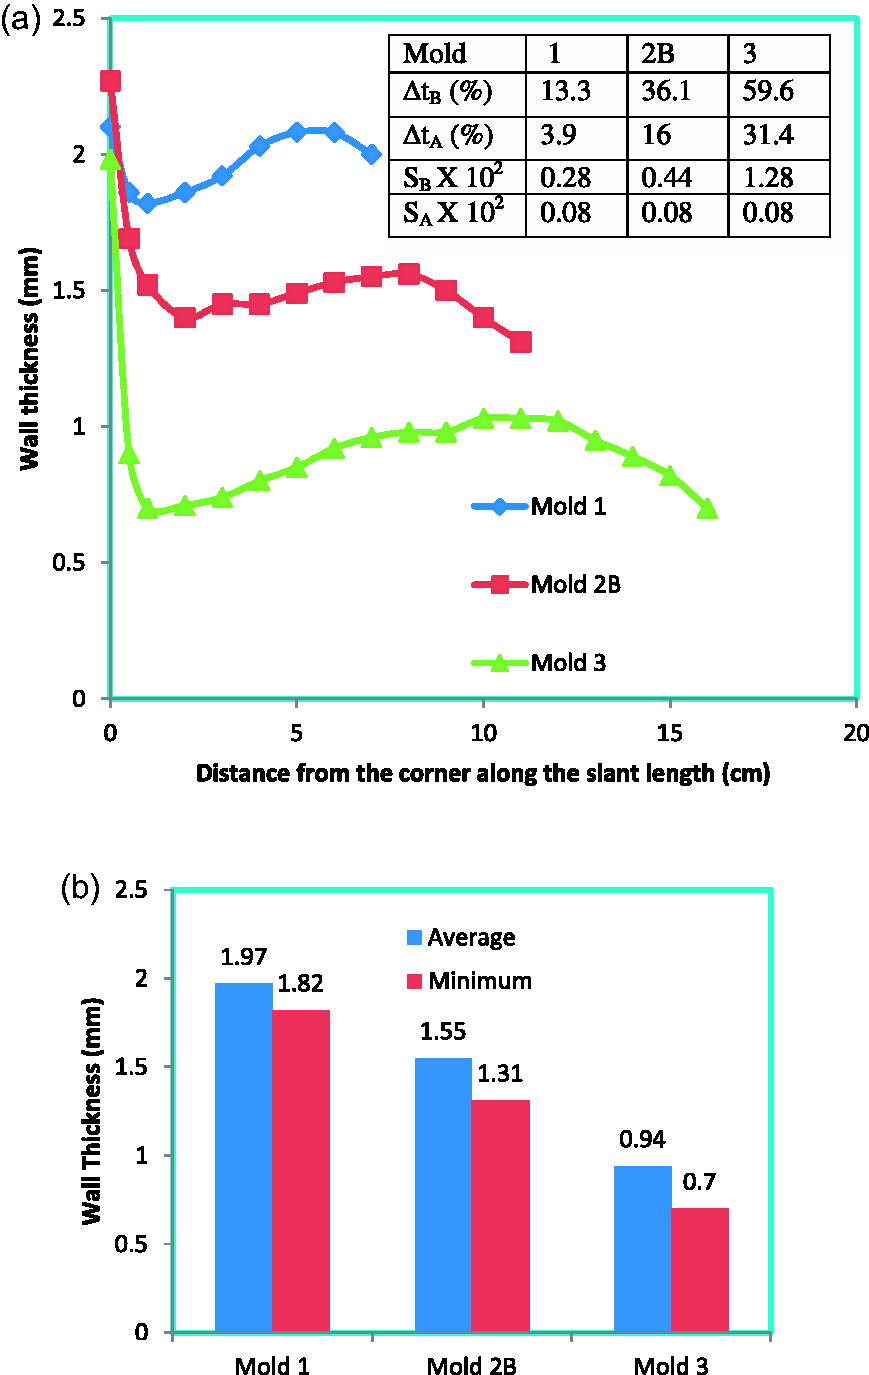
Figures 8 and 9 show the wall thickness distribution, average and minimum wall thicknesses of parts having different depths of draw, formed with HIPS1.5 and HIPS2.5, respectively. The parts being compared have the same draft angle. It can be seen that at lower depths of draw, wall thickness values are distributed over a narrower range, indicating relatively even sheet thickness distribution. With an increase in the depth of draw, ΔtB, ΔtA, and SB increase. Also, lower values of wall thickness are obtained along the slant length, with a decrease in the average and minimum wall thicknesses. These observations can be attributed to the fact that as the depth of draw increases, increased sheet stretching occurs during the forming process.
Effect of depth of draw (H) on (a) wall thickness distribution and (b) average wall thickness along slant length of part formed with HIPS1.5. HIPS: high impact polystyrene. Effect of depth of draw (H) on (a) wall thickness distribution and (b) average wall thickness along slant length of part formed with HIPS2.5. HIPS: high impact polystyrene.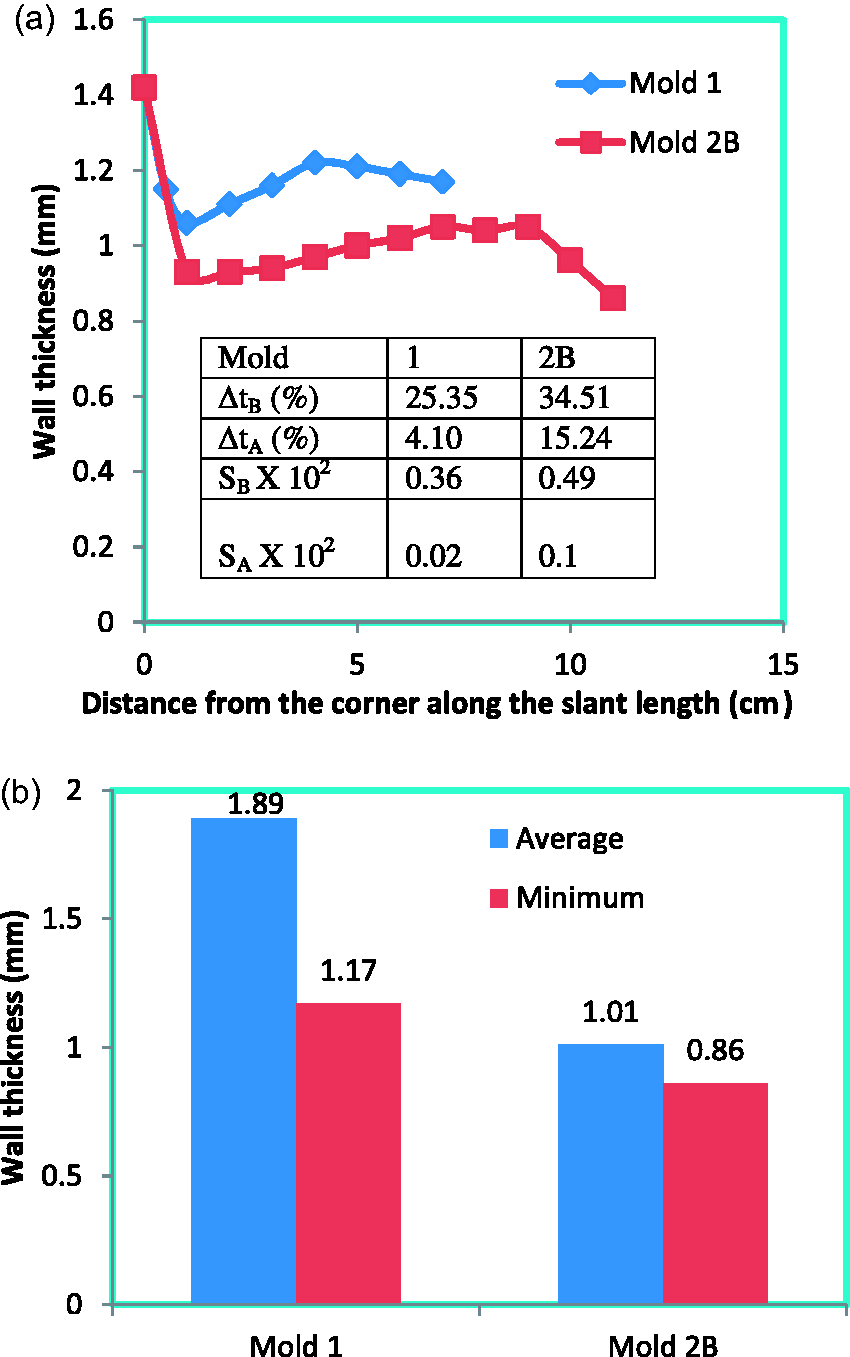
Thus, during positive thermoforming the portion of the sheet corresponding to the slant length is subjected to non-uniform stretching. The region close to the mould corner is stretched the most, resulting in non-uniform wall thickness distribution. However, an increase in draft angle can minimise this effect. Stretching increases when a mould of a higher depth of draw is used. Hence, to thermoform medium gauge HIPS sheets into parts having a higher depth of draw, moulds with a higher draft angle (9°) should be used. Further details of this work have been reported by Kommoji. 26
Conclusions
During positive thermoforming of medium gauge HIPS sheets the following effects are observed:
Wall thickness distribution with respect to the distance from the corner, along the slant length, has three distinct regions, two of which are close to the mould corner and clamp point, respectively. In these two regions, wall thickness decreases due to the increased stretching which occurs near the fixed portions of the sheet. The decrease in wall thickness is much more in the region close to the mould corner than that near the clamp point. Wall thickness in the intermediate portion of the slant length, which is not close to any of the fixed points, does not show much variation. The decrease in wall thickness near both ends of the slant length increases at higher depths of draw. However, an increase in draft angle reduces this effect. No significant difference in product quality is observed at different sheet heating temperatures of 130℃ and 140℃. This can be attributed to the amorphous nature of HIPS.
16
Footnotes
Funding
This research received no specific grant from any funding agency in the public, commercial, or not-for-profit sectors.
Conflict of interest
None declared.