
Abstract
This study was undertaken to fundamentally understand structure–property relationship of blown films of linear low density polyethylene/low density polyethylene blends over the entire composition range via decoupling orientation effects from their intrinsic properties. Three different low density polyethylene blends with an octene Ziegler–Natta linear low density polyethylene resin were studied. The machine direction tear strengths of blown film of linear low density polyethylene/low density polyethylene blends went through a minimum as the low density polyethylene concentration increased, almost a mirror image of the melt strength curve for these blends. The machine direction tear decreased significantly up to 40% low density polyethylene, much sharper decrease compared to decrease in intrinsic tear suggesting orientation effects dominating the machine direction tear behavior. The decrease in the dart impact and puncture energy was also due to both an increase in the machine direction orientation, and a decrease in the intrinsic toughness due to decrease in the tie chain concentration, as the low density polyethylene content increased.
Keywords
Introduction
High pressure low density polyethylene (LDPE), produced commercially since 1939, exhibits excellent extrusion processability and melt strength/bubble stability due to high degree of long chain branching. However, blown films made from LDPE exhibit poor mechanical properties (e.g. dart impact, puncture, tear, tensile strength) and very low hot-tack strength, due to the high long chain branching. Linear low density polyethylene (LLDPE), produced commercially using Ziegler–Natta (Z–N) and metallocene catalyst, typically exhibits poor extrusion processability and poor melt/strength bubble stability due to zero or very low long chain branching. However, blown films made from LLDPE exhibit excellent mechanical properties and hot-tack strength, due to linear or substantially linear molecules. Hence, LLDPE and LDPE blends are used very commonly to balance extrusion processability and bubble stability, and mechanical properties. LLDPE and LDPE blends are particularly used to make blown films used in food and specialty packaging (F&SP) applications and, also, in some industrial and consumer packaging applications, such as heavy duty shipping sacks, green house films, and collation shrink films. Blown film converters may blend anywhere from 10 to 50% LDPE (percentages are by weight for blend components) with an octene LLDPE for a sealant web for F&SP lamination applications. They may blend >60% LDPE with LLDPE where optics and shrink properties are important for applications such as collation shrink films and masking films.
There have been many studies performed to understand rheology (especially elongational viscosity and melt strength), structure evolution during film blowing, and thermal properties of LLDPE/LDPE blends.1–14 Studies have been performed to understand the effect of the addition of small amounts of LDPE, i.e. less than 20%, to a LLDPE to understand the impact of the LDPE addition on LLDPE film physical properties such as tensile properties, Elmendorf tear strength, dart impact strength, etc.15–18 However, the effect of higher level of LDPE in the blends (LDPE-rich blends) has not been studied as much, and hence is not as well understood. Falla 19 studied blown films of LLDPE/LDPE blends over the entire composition range from 0 to 100%. However, the study did not explain the reasons behind the variation in physical properties seen.
As a result, this study was undertaken to understand the structure–property relationship of LLDPE/LDPE blends over the entire composition range in terms of blown film mechanical properties such as Elmendorf tear strength, dart impact strength, and puncture. Three different LDPEs blended with an octene Z–N LLDPE resin were studied. Further, the objective of this study was to fundamentally understand the film properties as a function of LDPE level, especially to decouple orientation effects from the intrinsic (unoriented) properties of the blends. These relationships will be described in detail.
Materials and experimental
The LLDPE and LDPE resins used in the study are listed in Table 1 along with their melt index and density. Table 1 shows the resins used which were produced by The Dow Chemical Company. All three LDPE resins were made using a tubular process. Blown films were made with 10, 20, 40, and 80% LDPE added to the octene LLDPE. In addition, blown films were made with 100% LLDPE and 100% LDPE.
Sample code with commercial designation for LDPE and LLDPE resins used with measured melt index and density.
LDPE: low density polyethylene; LLDPE: linear low density polyethylene; ™: Trademark of The Dow Chemical Company.
Melt index (MI or I2) was measured according to ASTM D1238, at 190°C/2.16 kg and is reported in grams per 10 min. Density was measured as a quick density according to ASTM D1928. Density measurements were made within 1 h of sample pressing using ASTM D792, Method B.
Melt strength was measured at 190°C using a Goettfert Rheotens melt fed with a Goettfert Rheotester 2000 capillary rheometer equipped with a flat entrance angle (180°) 30 mm long and 2 mm diameter die. The pellets were fed into the barrel (length = 300 mm, diameter = 12 mm), compressed, and allowed to melt and equilibrate for 10 min before being extruded at a constant 0.265 mm/s piston speed. The extrudate passed through the Rheotens wheels located 100 mm below the die exit and was pulled by the wheels downward at an acceleration rate of 2.4 mm/s2. Melt strength is reported as the plateau force (cN) before the strand broke.
Differential scanning calorimetry (DSC) was run on a TA Instruments Q1000 DSC, equipped with a refrigerated cooling system and an auto-sampler. The sample was rapidly heated to 180°C and held isothermal for 3 min in order to remove its thermal history. Next, the sample was cooled to −40°C at a 10°C/min cooling rate and held isothermal at −40°C for 3 min. The sample was then heated to 150°C at 10°C/min.
Monolayer films were produced on a monolayer blown film line in Dow’s Pack Studios facility in Freeport, TX. The films were 2 mil (51 µm) thick and produced at 300 lb/h on an 8 in. die (11.9 lb/h/in. die circumference). The blow up ratio (BUR) was 2.5. The melt temperature was between 380 and 420°F, and internal bubble cooling was utilized. A 70 mil die gap was used for all the films, including the 100% LDPE films. The frost line height was measured between 36 and 38 in. for all the films.
Elmendorf tear, dart impact, and puncture are three critical film mechanical properties in packaging applications. Elmendorf tear testing in both the machine and cross directions (MDs and CDs) was done in accordance with ASTM D1922, type B—constant radius. Dart impact (Dart A) testing was performed via ASTM D1709. The puncture test was performed using a modified ASTM D5748 with a 0.5″ diameter stainless steel probe. For intrinsic tear, measurements were done per the method described by Plumley et al. 20 About 11 mil thick compression molded plaques were used for intrinsic Elmendorf tear measurement (using Method A). Intrinsic dart impact was measured on 20 mil (508 µm) thick compression molded fast cooled plaques using ASTM D3763.
Small angle X-ray scattering (SAXS) data were collected with a Rigaku instrument with a micro X-ray source. The sample to detector distance was 150 mm, the data were calibrated with silver behenate, and the air background was corrected before data analysis.
Results and discussion
Melt strength characterization
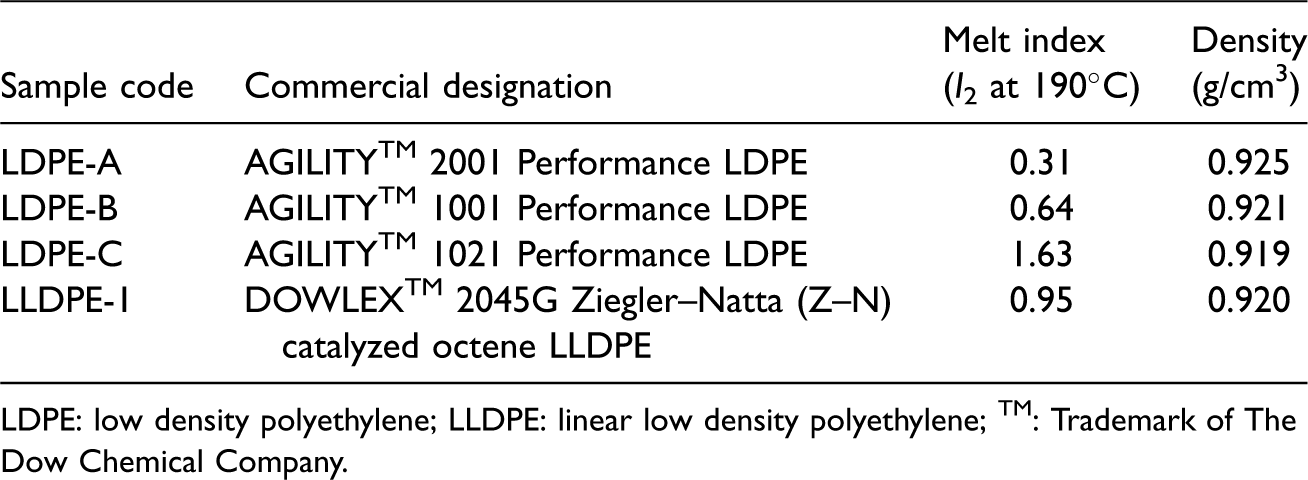
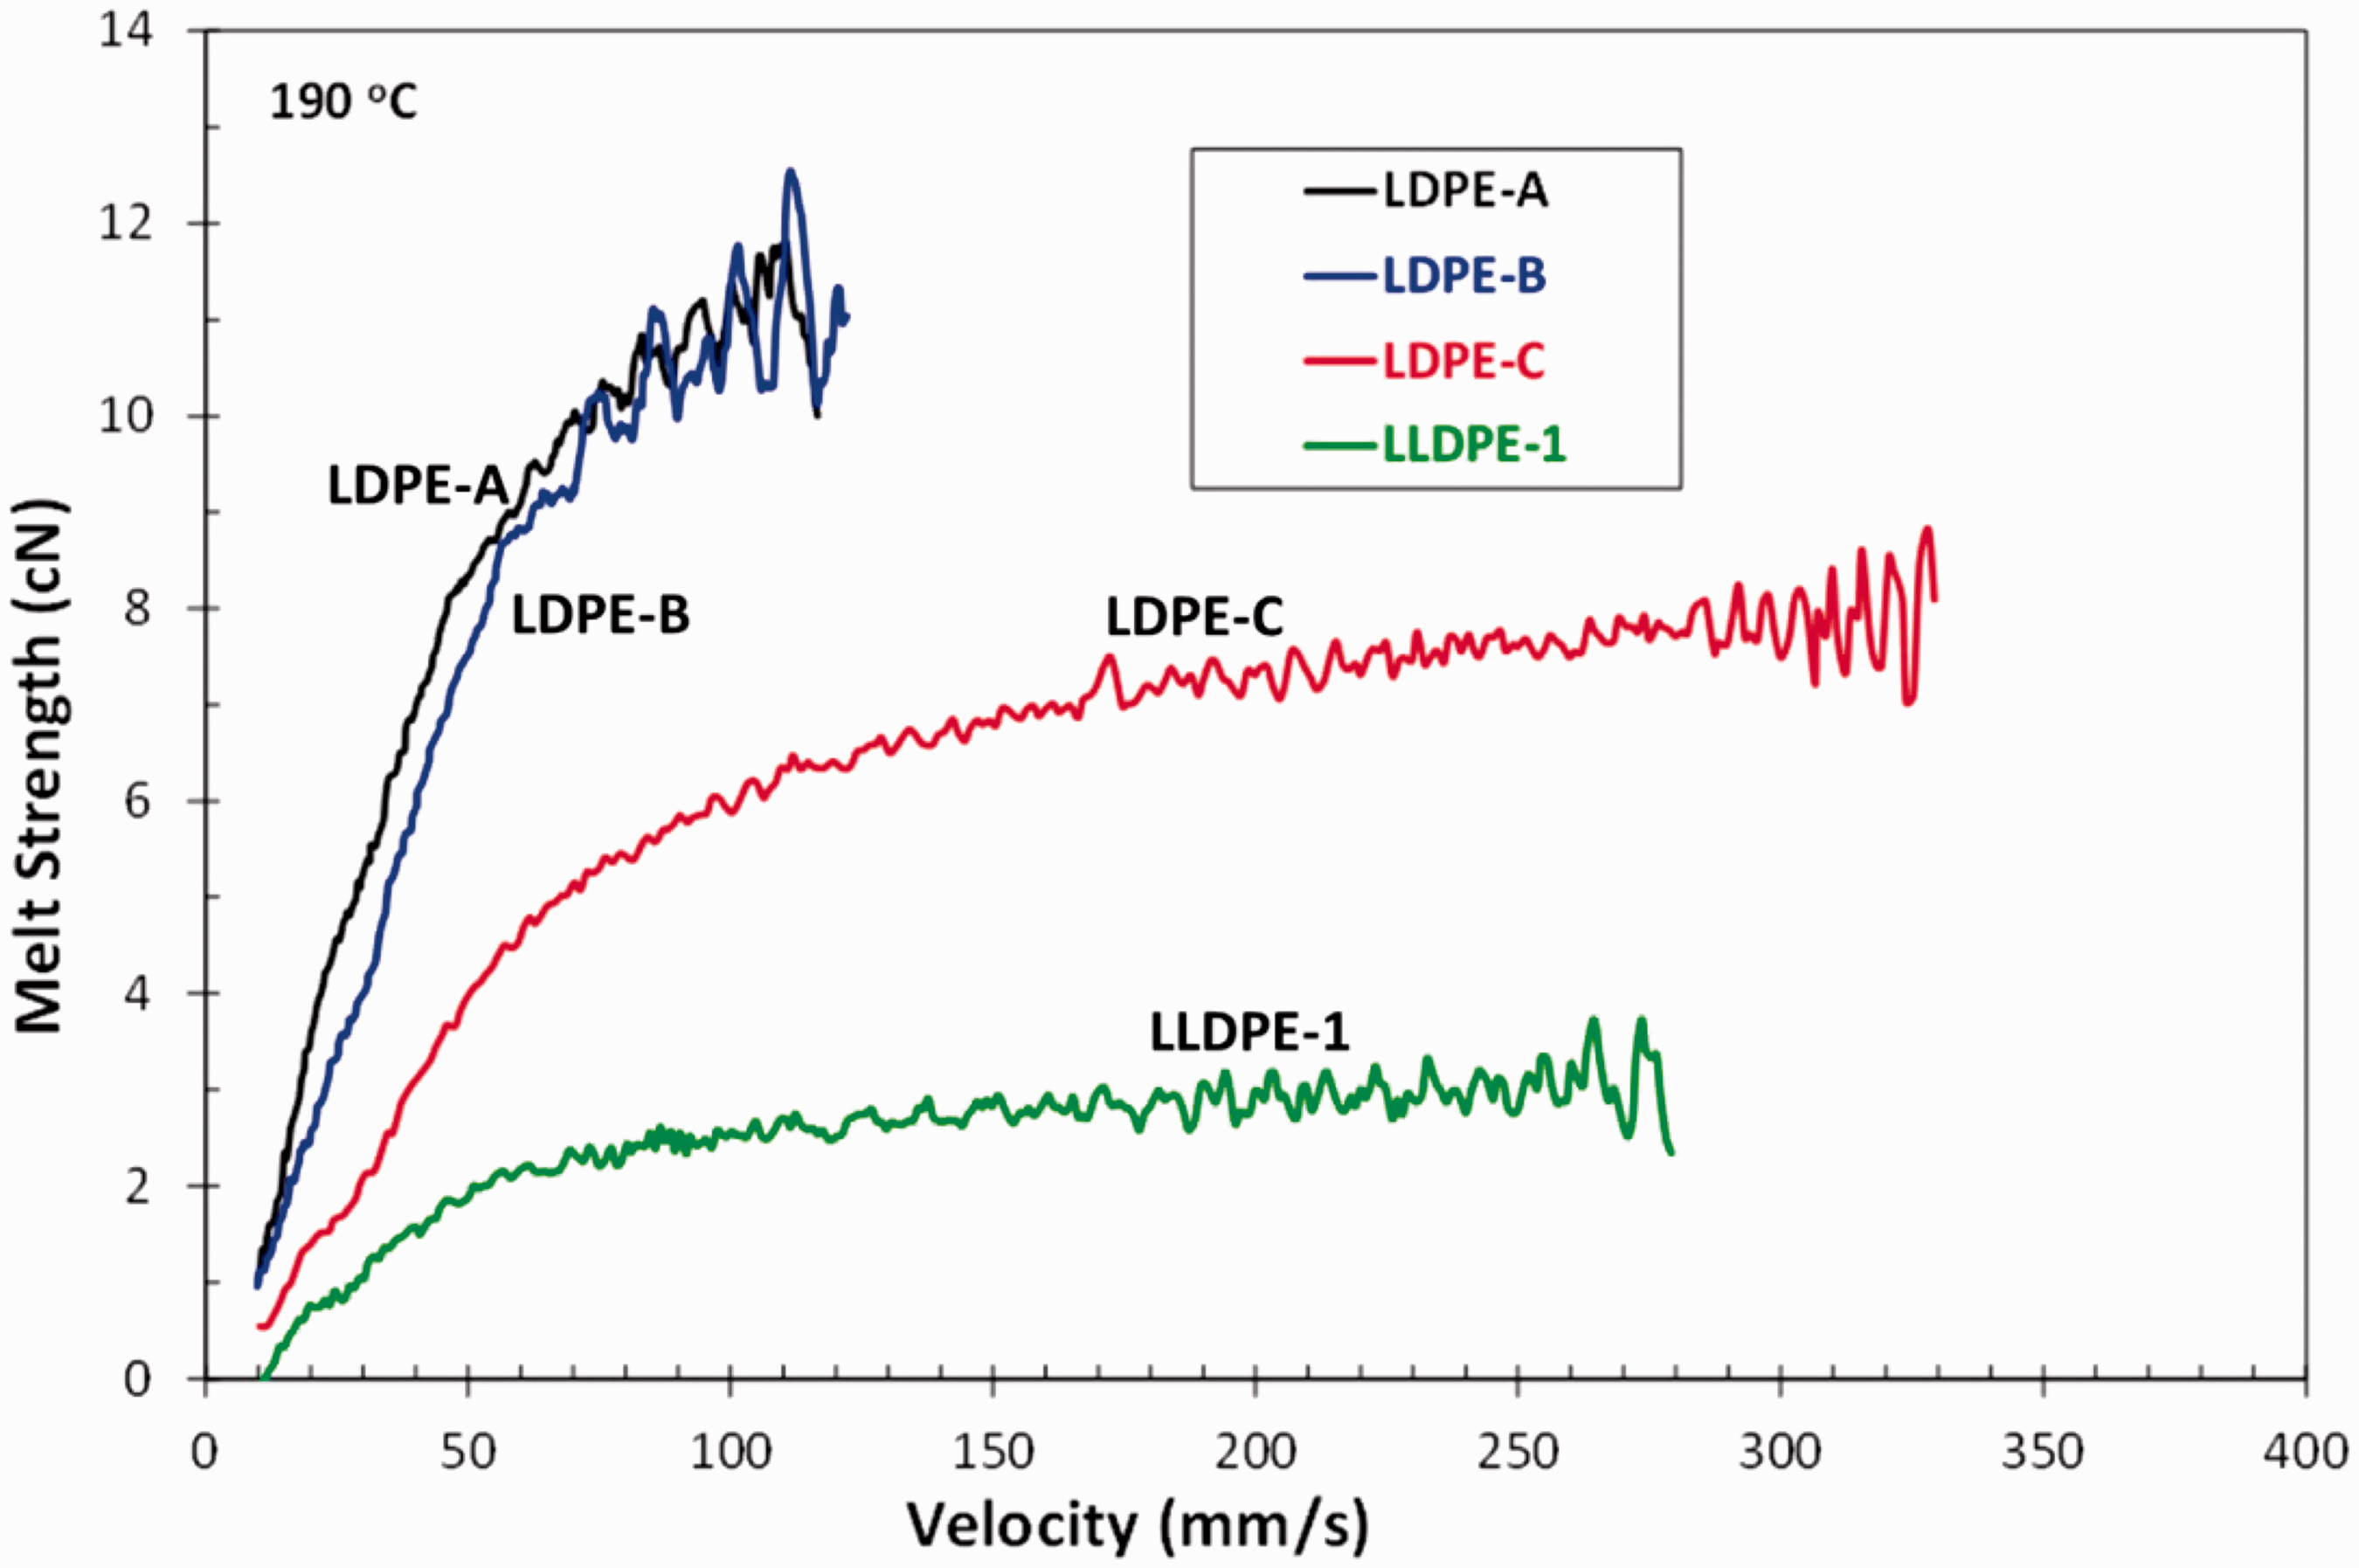
Figure 1 shows melt strength versus velocity for the neat resins. LDPE-A and LDPE-B have similar melt strength values. The higher MI LDPE-C has substantially lower melt strength, followed by LLDPE-1. Figure 2 shows melt strength versus %LDPE in the blends. Films made from the blends were compression molded to remove orientation and re-pelletized to measure the melt strength.
Melt strength versus velocity at 190°C for the LDPE and LLDPE resins. LDPE: low density polyethylene; LLDPE: linear low density polyethylene.
Melt strength versus % LDPE in the blends. LDPE: low density polyethylene.
The highest melt strength is observed for the LLDPE/LDPE-B blend followed by LLDPE/LDPE-A blend and then LLDPE/LDPE-C blend. It is well known that high pressure LDPE resins have higher melt strength than LLDPE resins due to the high degree of long chain branching in the LDPE resins. Hence, it was not surprising that adding LDPE to a LLDPE resulted in higher melt strength. However, the blend melt strength was significantly higher than the linear rule of mixtures at all blend ratios. For LDPE-C, the 40% LDPE blend melt strength was about the same as the 80% LDPE blend, and the 100% LDPE melt strength was significantly lower than the 80% LDPE/20% LLDPE blend. For blends with LDPE-B and LDPE-A, the melt strength increased from 40 to 80% LDPE and then it dropped from 80% LDPE to 100% LDPE. In all three cases, the 100% LDPE resin melt strength was lower than at 80% LDPE blend.
This LDPE/LLDPE blend melt strength synergy has been reported earlier.21,22 Ghijsels et al. explained the melt strength and zero shear viscosity synergy of LDPE/LLDPE blends via the Bersted23,24 model based on how long chain branching affects the polyethylene melt zero shear viscosity. The zero shear viscosity initially increases with increased long chain branching due to more intermolecular entanglements, passes through a maximum and decreases with higher long chain branching due to molecular coil size (hydrodynamic volume) reduction. Considering the LDPE/LLDPE blends as a whole polymer with varying long chain branching levels, the Bersted model can also be applied for the blends. Adding highly long chain branched LDPE to LLDPE resin leads to melt strength enhancement and synergy, and after passing through a maximum ultimately leads to the lower pure LDPE resin melt strength. At high long chain branching, the polymer coil becomes compact (lower radius of gyration) such as in a pure LDPE molecule, while at moderate long chain branching, the polymer coil size expands. We hypothesize that this happens when the LLDPE concentration in LDPE is low. As a result, there are more intermolecular entanglements resulting in higher melt strength for the 80/20 LDPE/LLDPE blends.
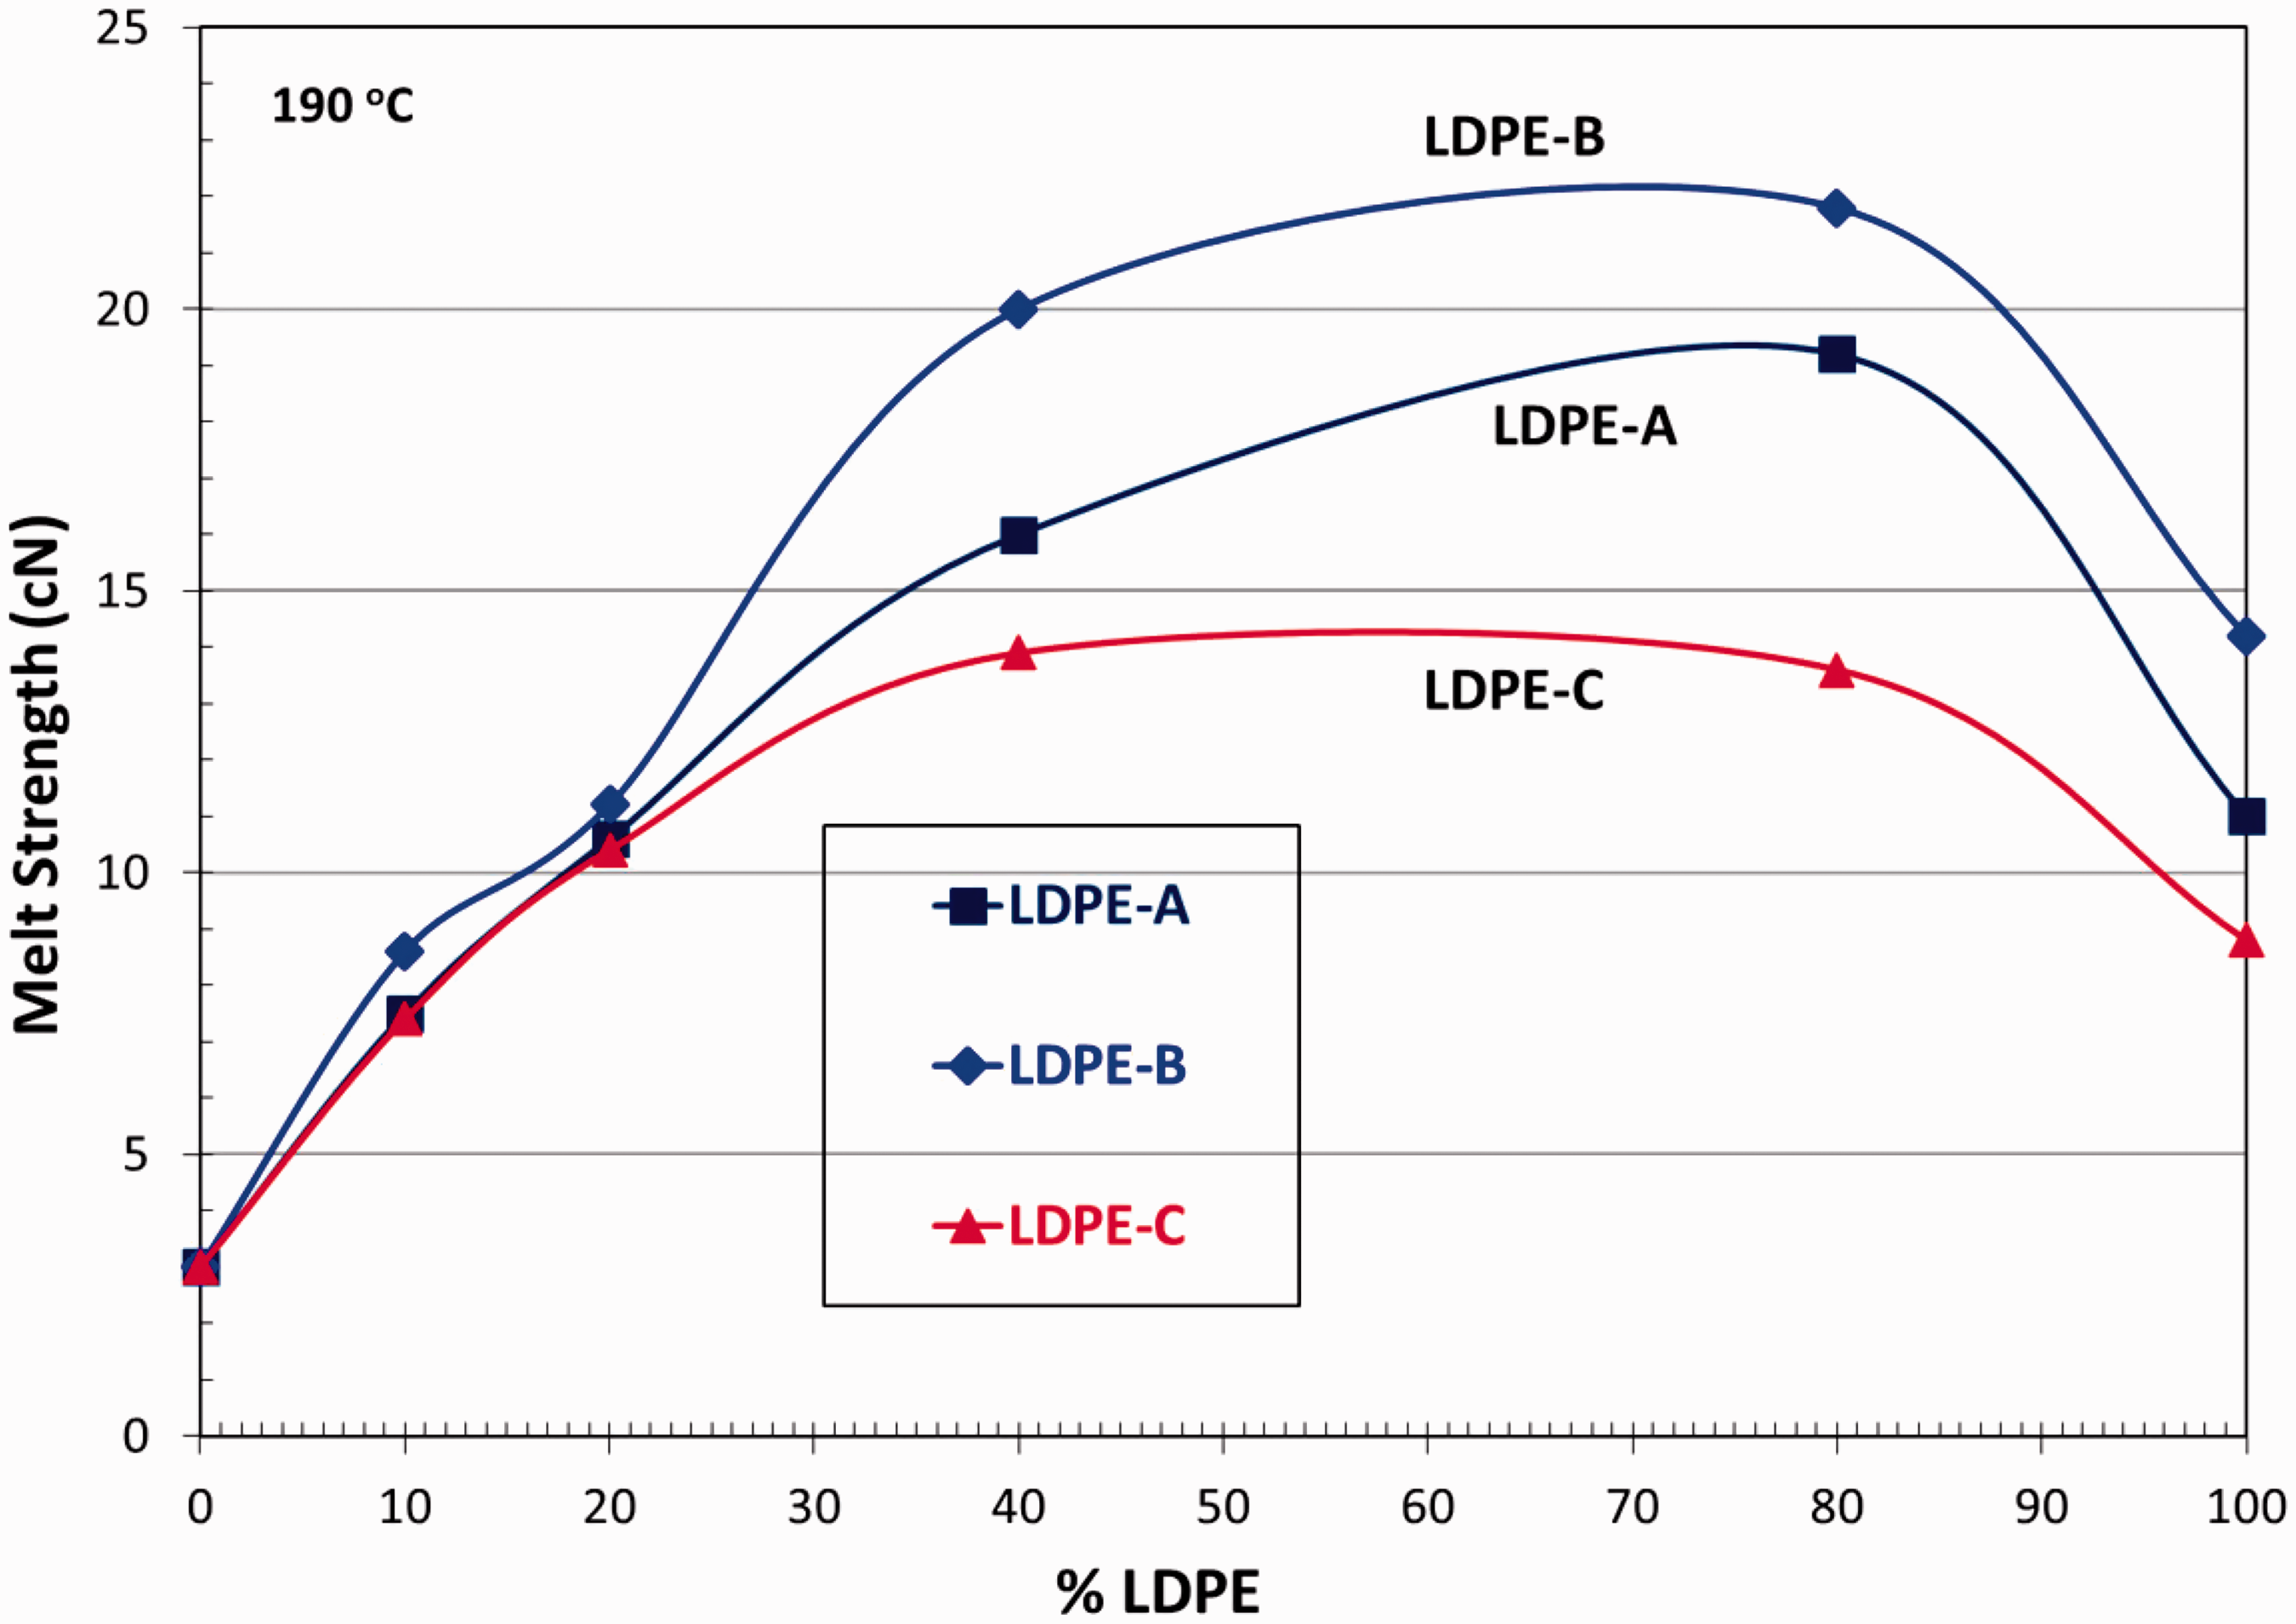
Figure 3 shows the DSC cooling curves. The DSC curves within a given family, either LLDPE or LDPE, generally have higher crystallization temperatures with increase in density. At the same density, the LDPE crystallization peak temperature is lower than the LLDPE due to the LDPE resins having a narrower short chain branching distribution than the Z–N catalyzed LLDPE resins.
DSC cooling curves for the LLDPE and LDPE resins. LDPE: low density polyethylene; LLDPE: linear low density polyethylene.
Film property results
Elmendorf tear strength
The films’ tear properties were tested in the MD as well as the CD. Figure 4 shows the MD tear strengths for the blends versus % LDPE and Figure 5 is for the CD.
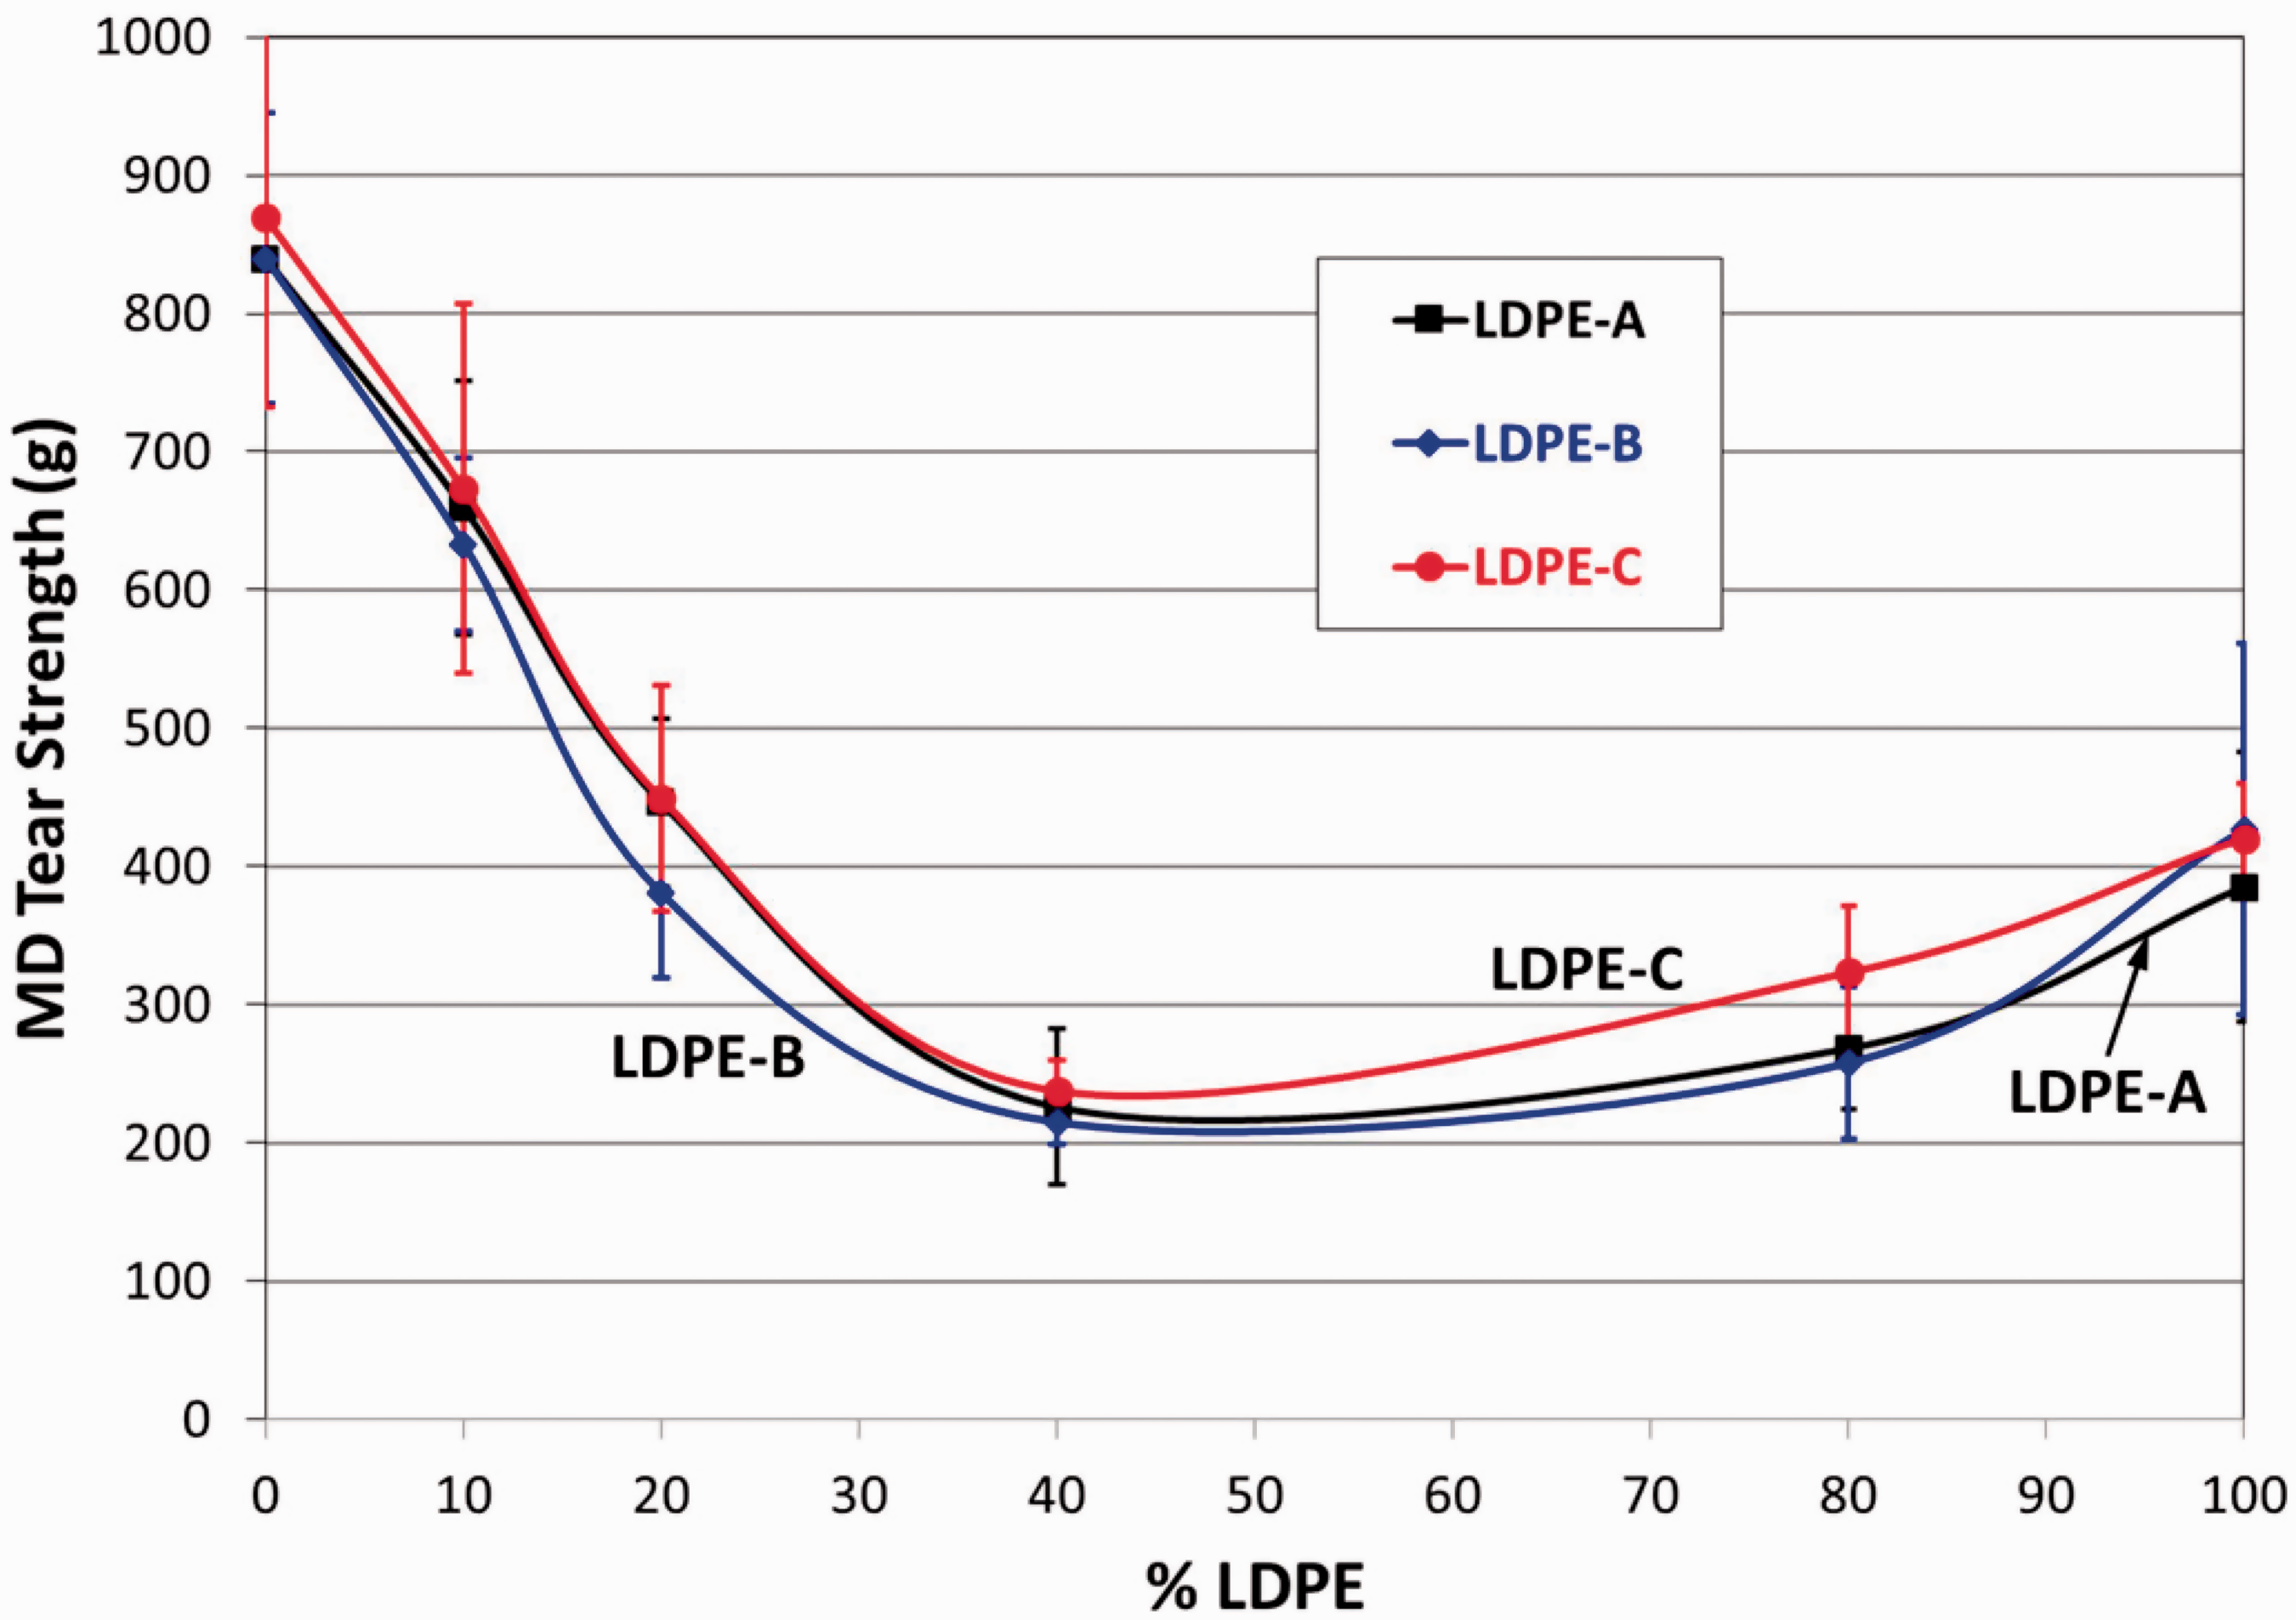
MD Elmendorf tear strength versus %LDPE for 2 mil blown films. LDPE: low density polyethylene; MD: machine direction.
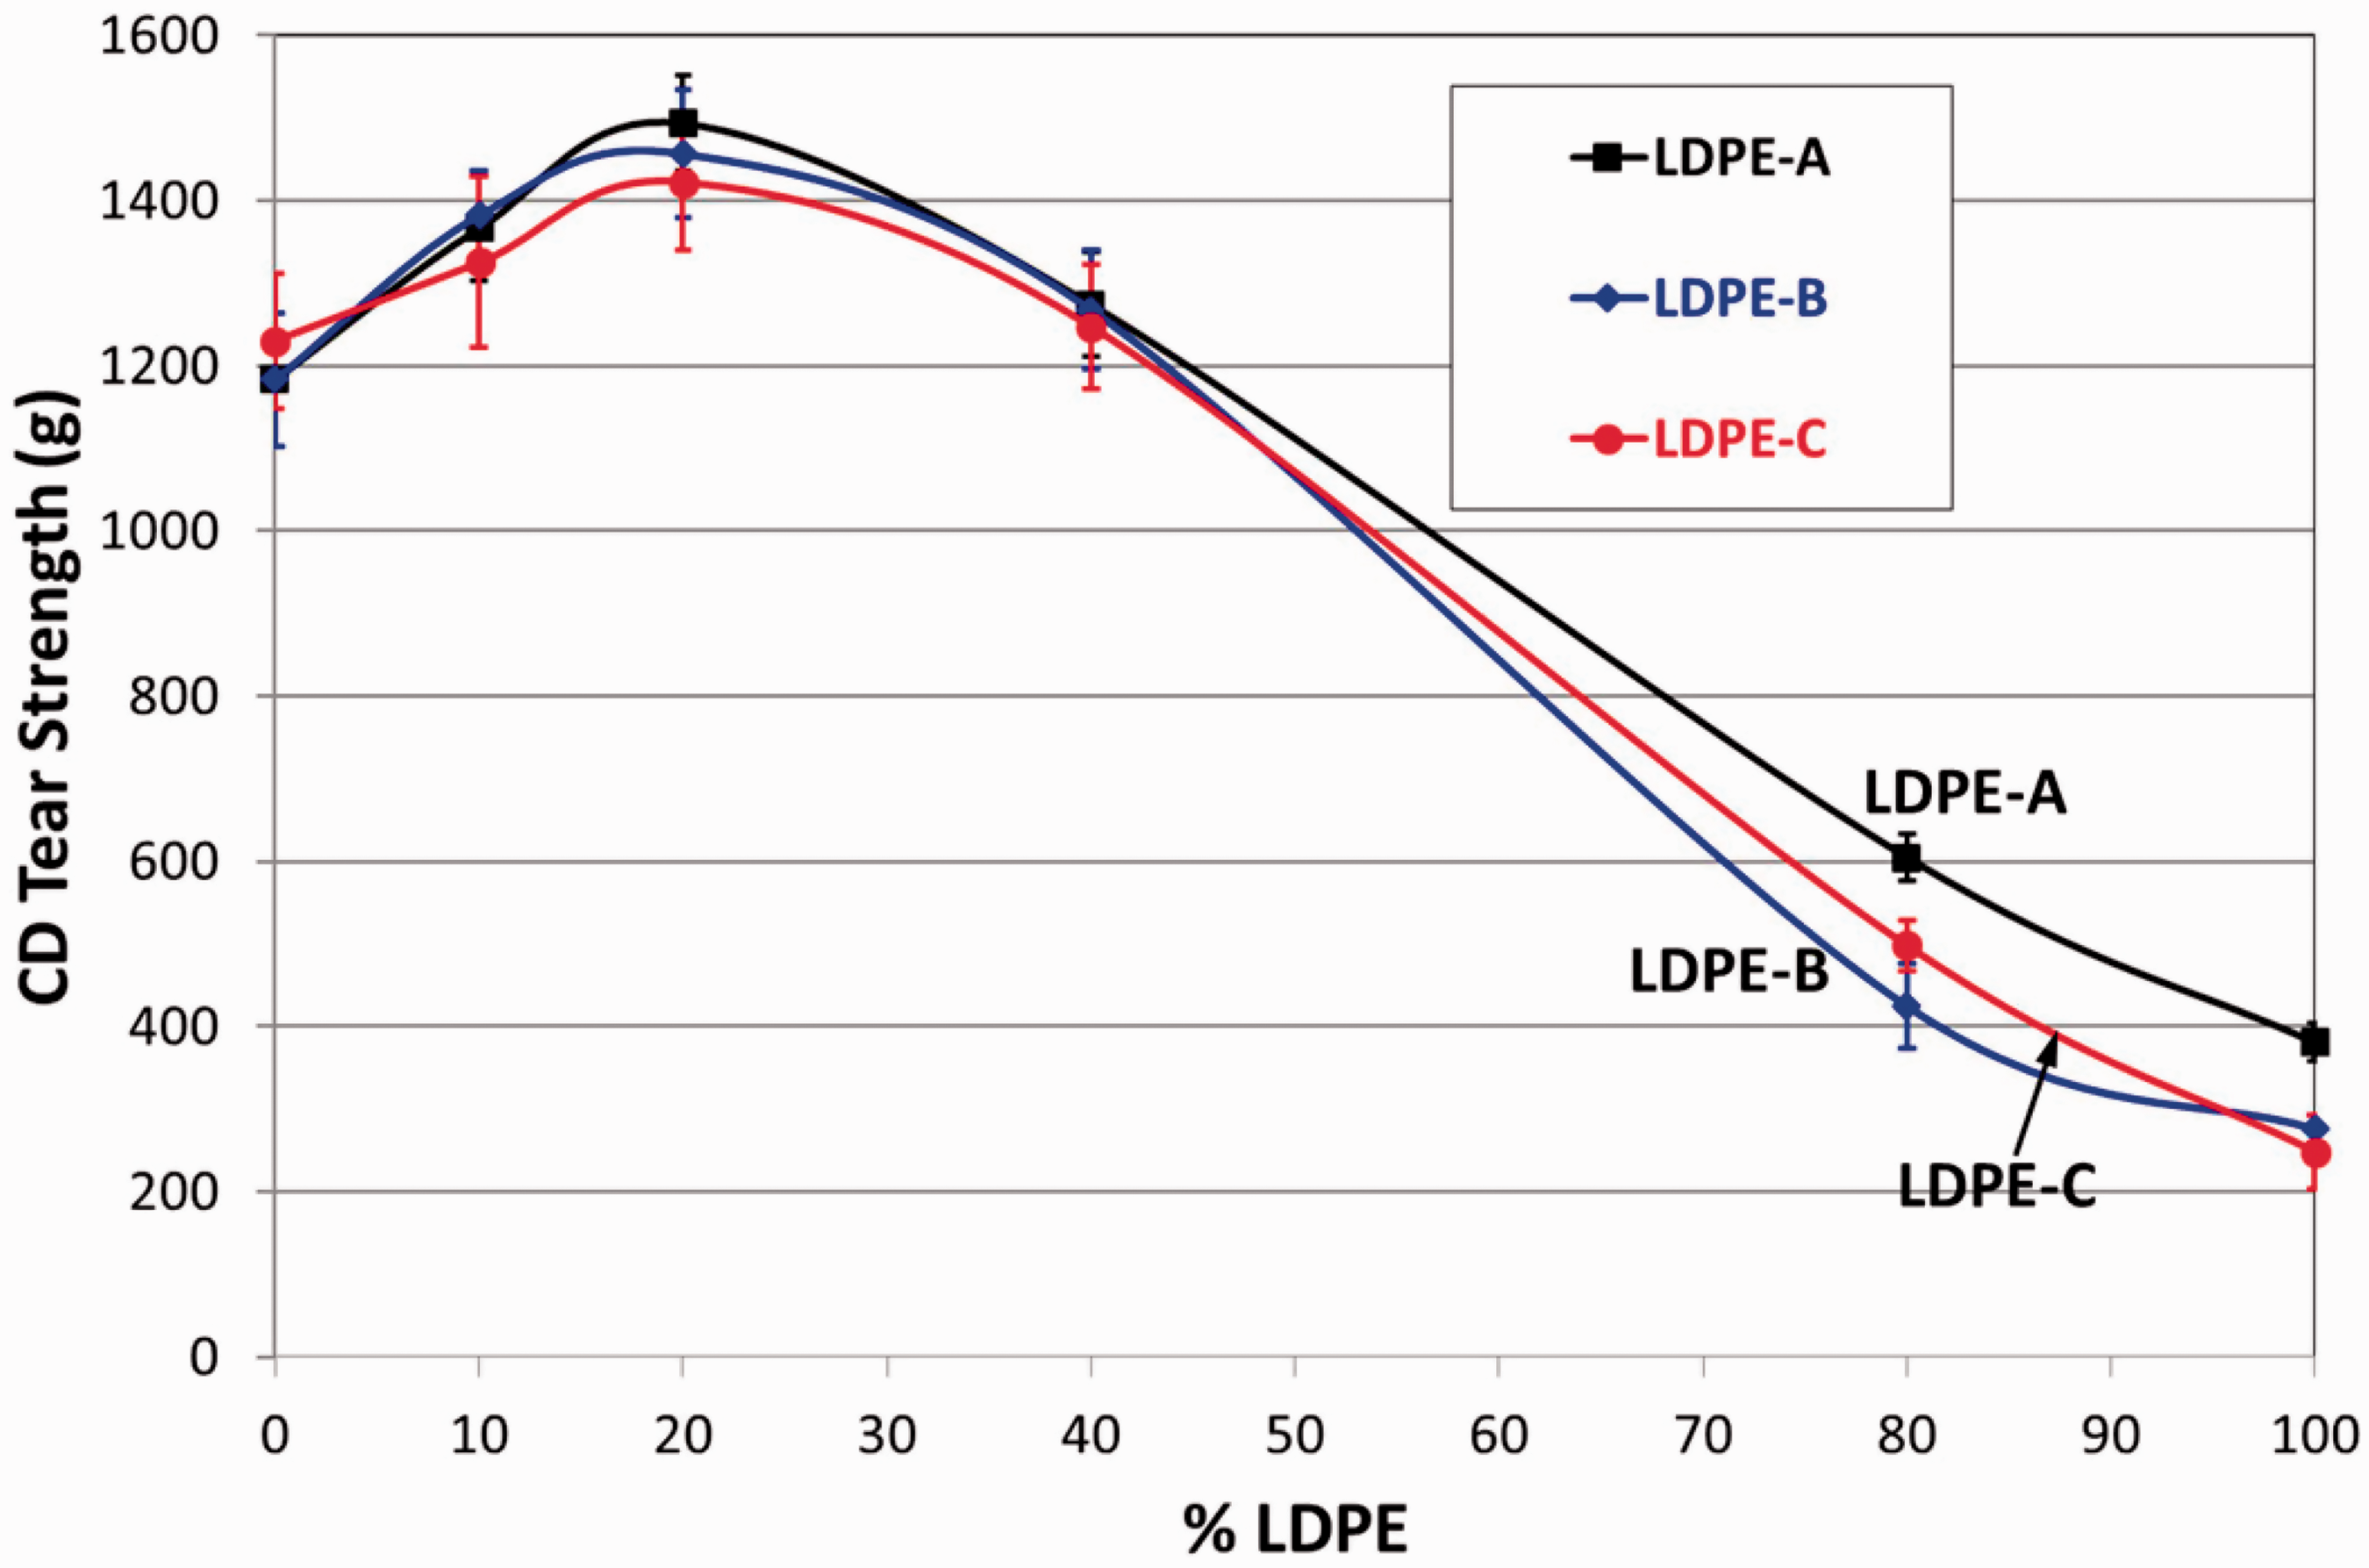
CD Elmendorf tear strength versus %LDPE for 2 mil blown films. CD: cross direction; LDPE: low density polyethylene.
The MD tear strength rapidly decreased with up to 40% LDPE loading, almost reached a plateau value up to 80% LDPE, and then increased at 100% LDPE. It is possible that the MD tear strength went through a minimum at 60% LDPE since this blend was not included. The same trend was observed for all blend films with the three LDPEs. However, more noteworthy was the observation that there is a plateau for the MD tear strength between 40 and 80% LDPE and then the MD tear strength increases between 80 and 100% LDPE.
It is well known that Z–N LLDPEs such as LLDPE-1 exhibit high MD tear strength (generally > 400 g/mil) due to the high density fraction having high molecular weight and a relatively high tie chain concentration.25–27 High pressure LDPE resins have much lower tie chain concentration due to high long chain branching levels. Hence, adding LDPE resins to LLDPE resins should result in lower tie chain concentration for the blend resulting in lower MD tear strength for the blend as compared to the pure LLDPE resin. Adding LDPE to LLDPE would be expected to result in increased amorphous phase and lamellar orientation in the MD resulting in further reduction in MD tear strength for the LDPE/LLDPE blends. This was observed in this study up to 40% LDPE.
Somewhat unexpectedly, the MD tear strength did not continue to decrease at higher %LDPE for such blends in blown films; and actually, increased from 80 to 100% LDPE. We believe that this unusual behavior is related to the orientation locked in the blown films for LDPE/LLDPE blends containing more than 40% LDPE. Figure 5 shows that the CD tear strength went through a maximum around 20% LDPE for all three LDPE resins.
Figure 2 clearly shows the synergy between LLDPE and each LDPE for melt strength. The melt strength maxima occur between 40 and 80% LDPE for the three LDPEs. This explains the LDPE/LLDPE blend MD tear strength behavior since there is more orientation locked in the films between 40 and 80% LDPE due to the high melt strength observed. So from Figures 2 and 4, the LDPE/LLDPE blend MD tear strength is almost a mirror image of the melt strength curve. Figure 6 shows this for LDPE-B/LLDPE blends.
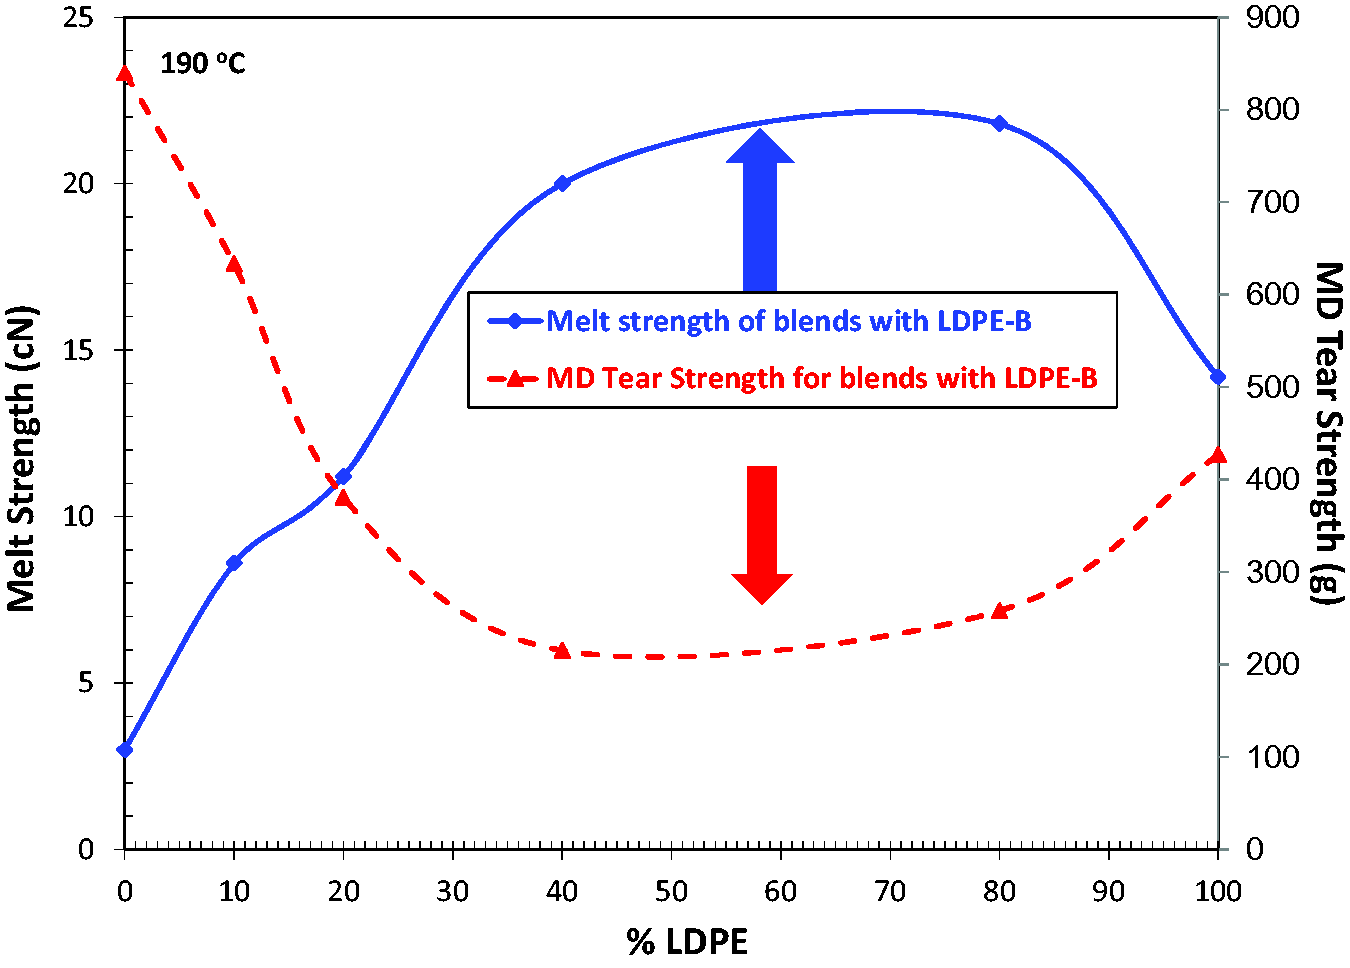
Melt strength and MD tear strength versus % LDPE-B. LDPE: low density polyethylene; MD: machine direction.
We decided to measure LDPE/LLDPE intrinsic tear strength by making compression molded plaques, in order to decouple the orientation effect from the intrinsic (unoriented properties) effect on tear strength. Figure 7 plots the intrinsic tear data. We see that the intrinsic tear versus %LDPE is almost linear. The LDPE/LLDPE intrinsic tear strength decreased with increasing LDPE content as expected, due to less tie chain concentration and supports the hypothesis that the increase in MD tear strength observed at >80% LDPE relates to the orientation locked in the blown films.
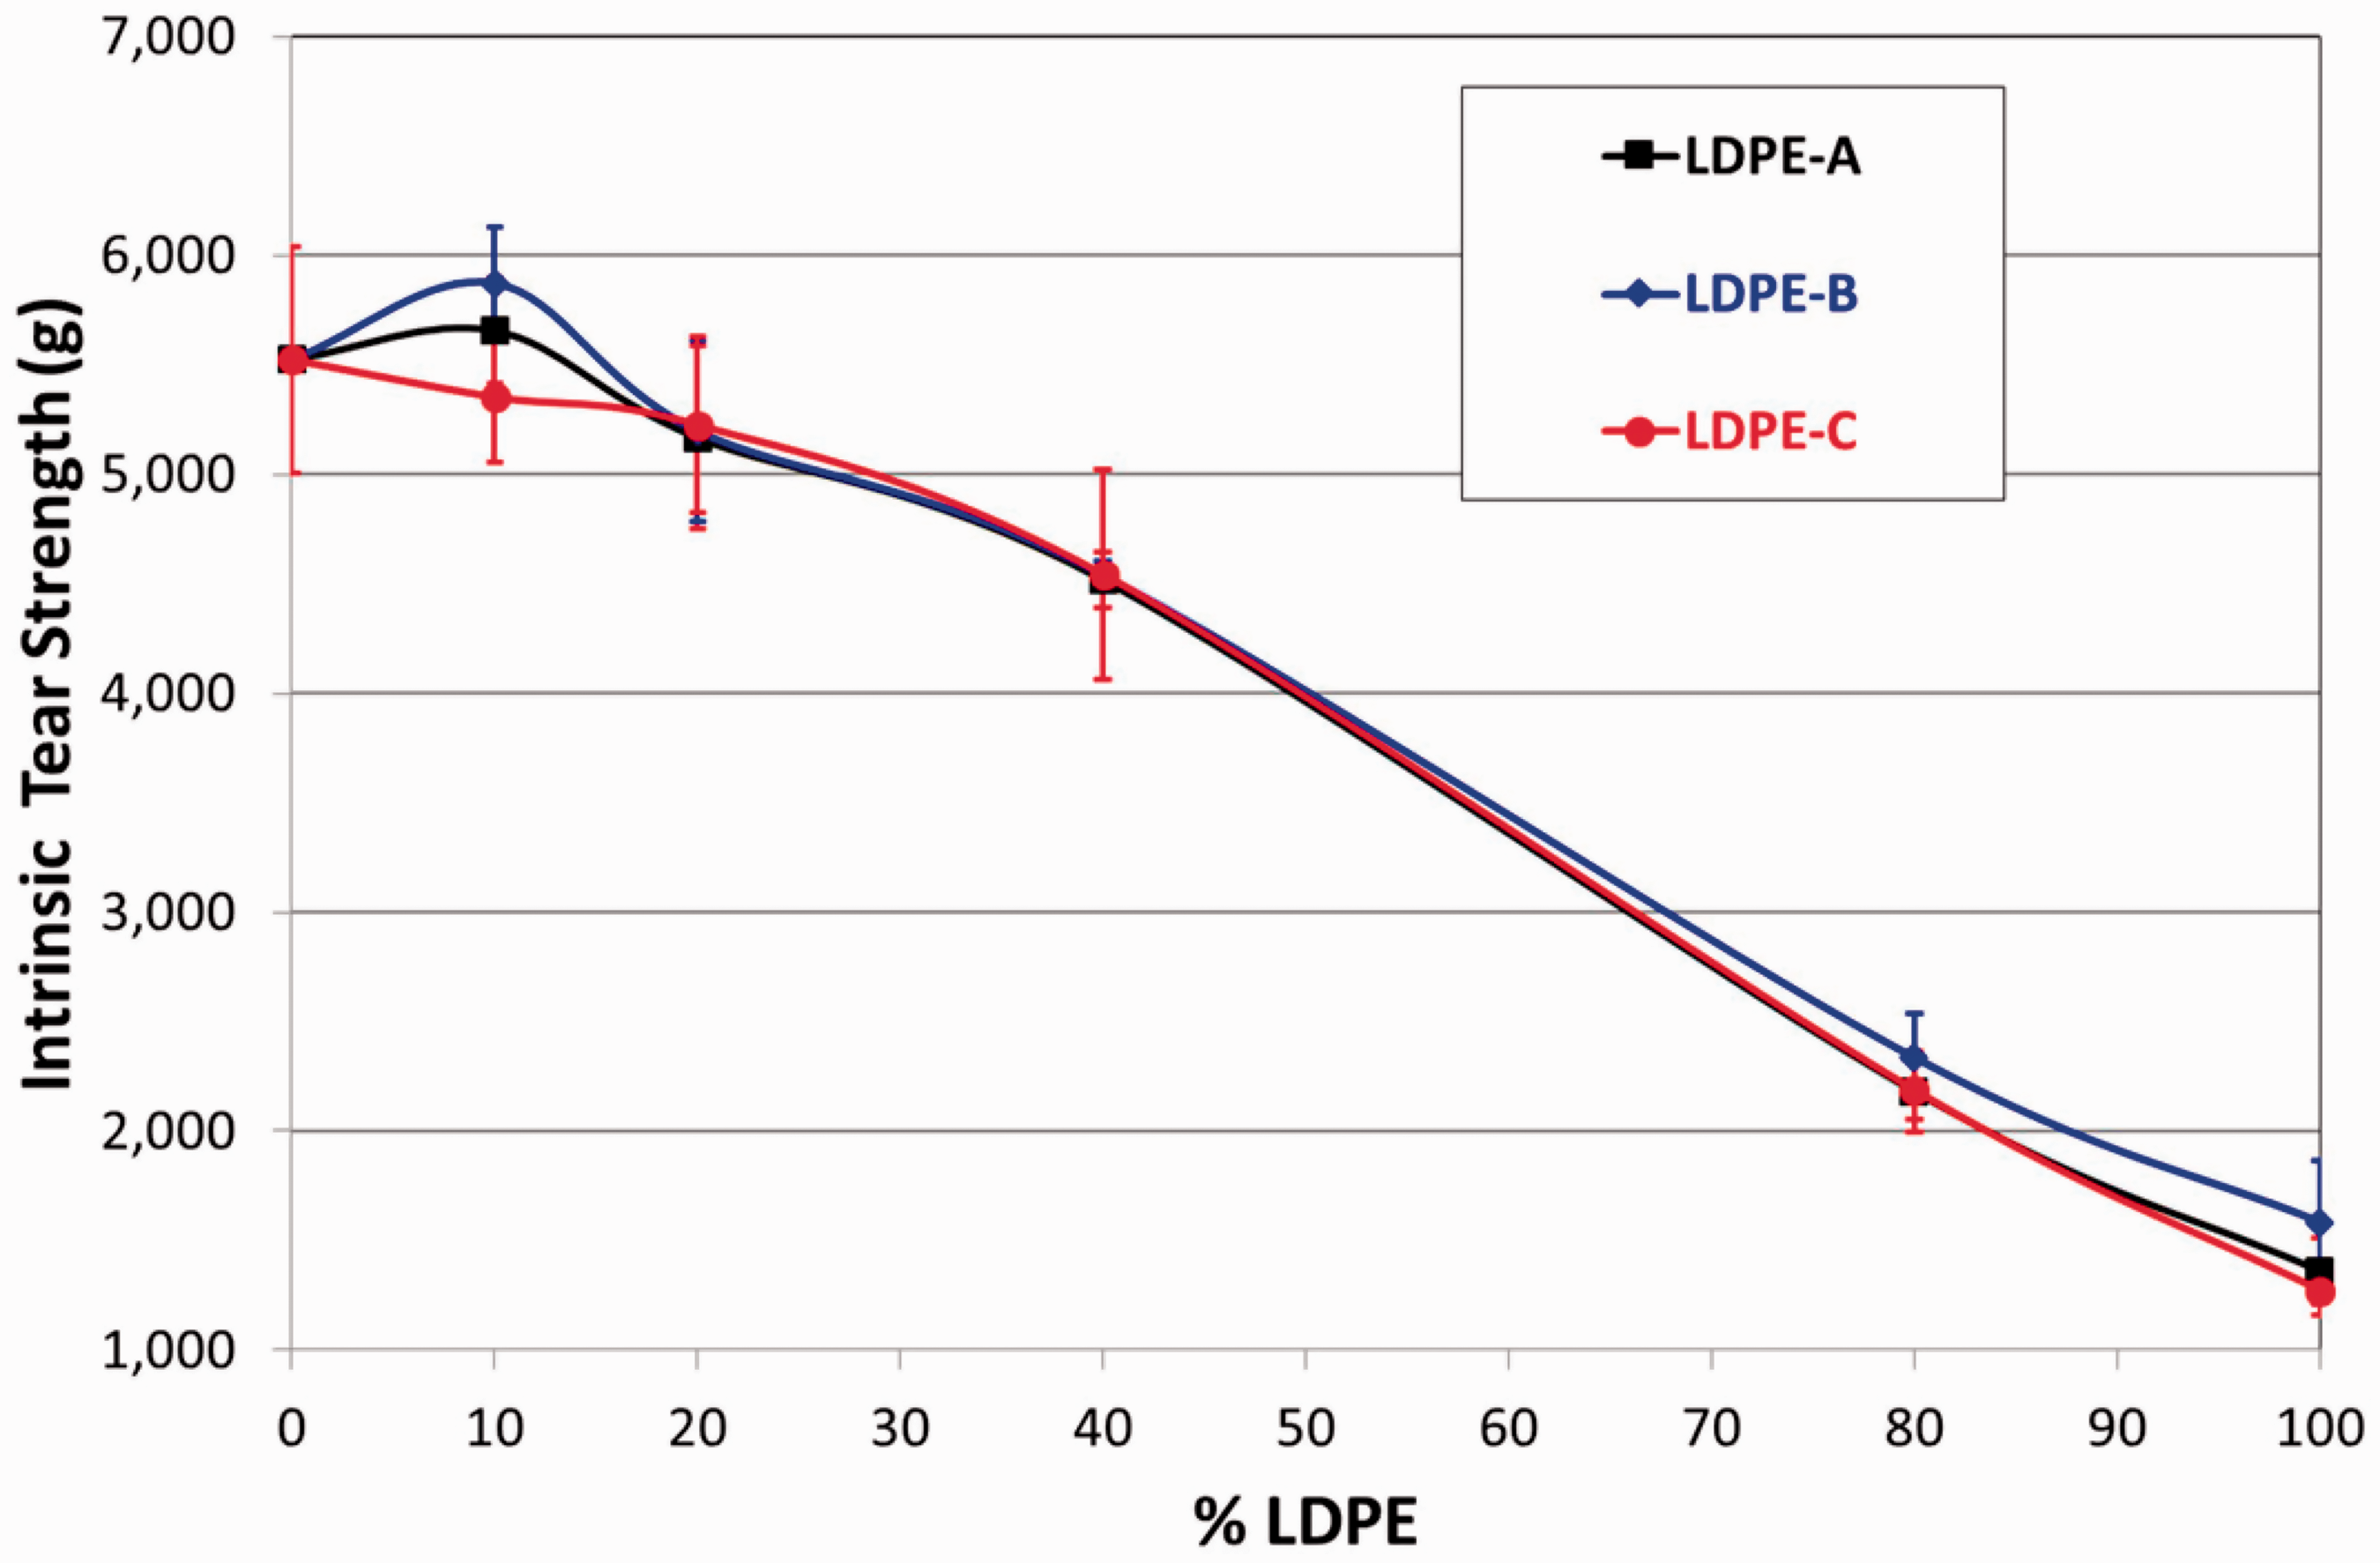
Intrinsic Elmendorf tear strength versus %LDPE for LDPE/LLDPE blends. LDPE: low density polyethylene.
Figures 8 to 10 plot the film normalized MD and CD tear strengths along with the normalized intrinsic tear strengths for LDPE/LLDPE blends. The MD tear decreased significantly up to 40% LDPE, much sharper decrease compared to decrease in intrinsic tear suggesting an orientation effect (versus intrinsic effect) dominating the MD tear behavior up to 40% LDPE.
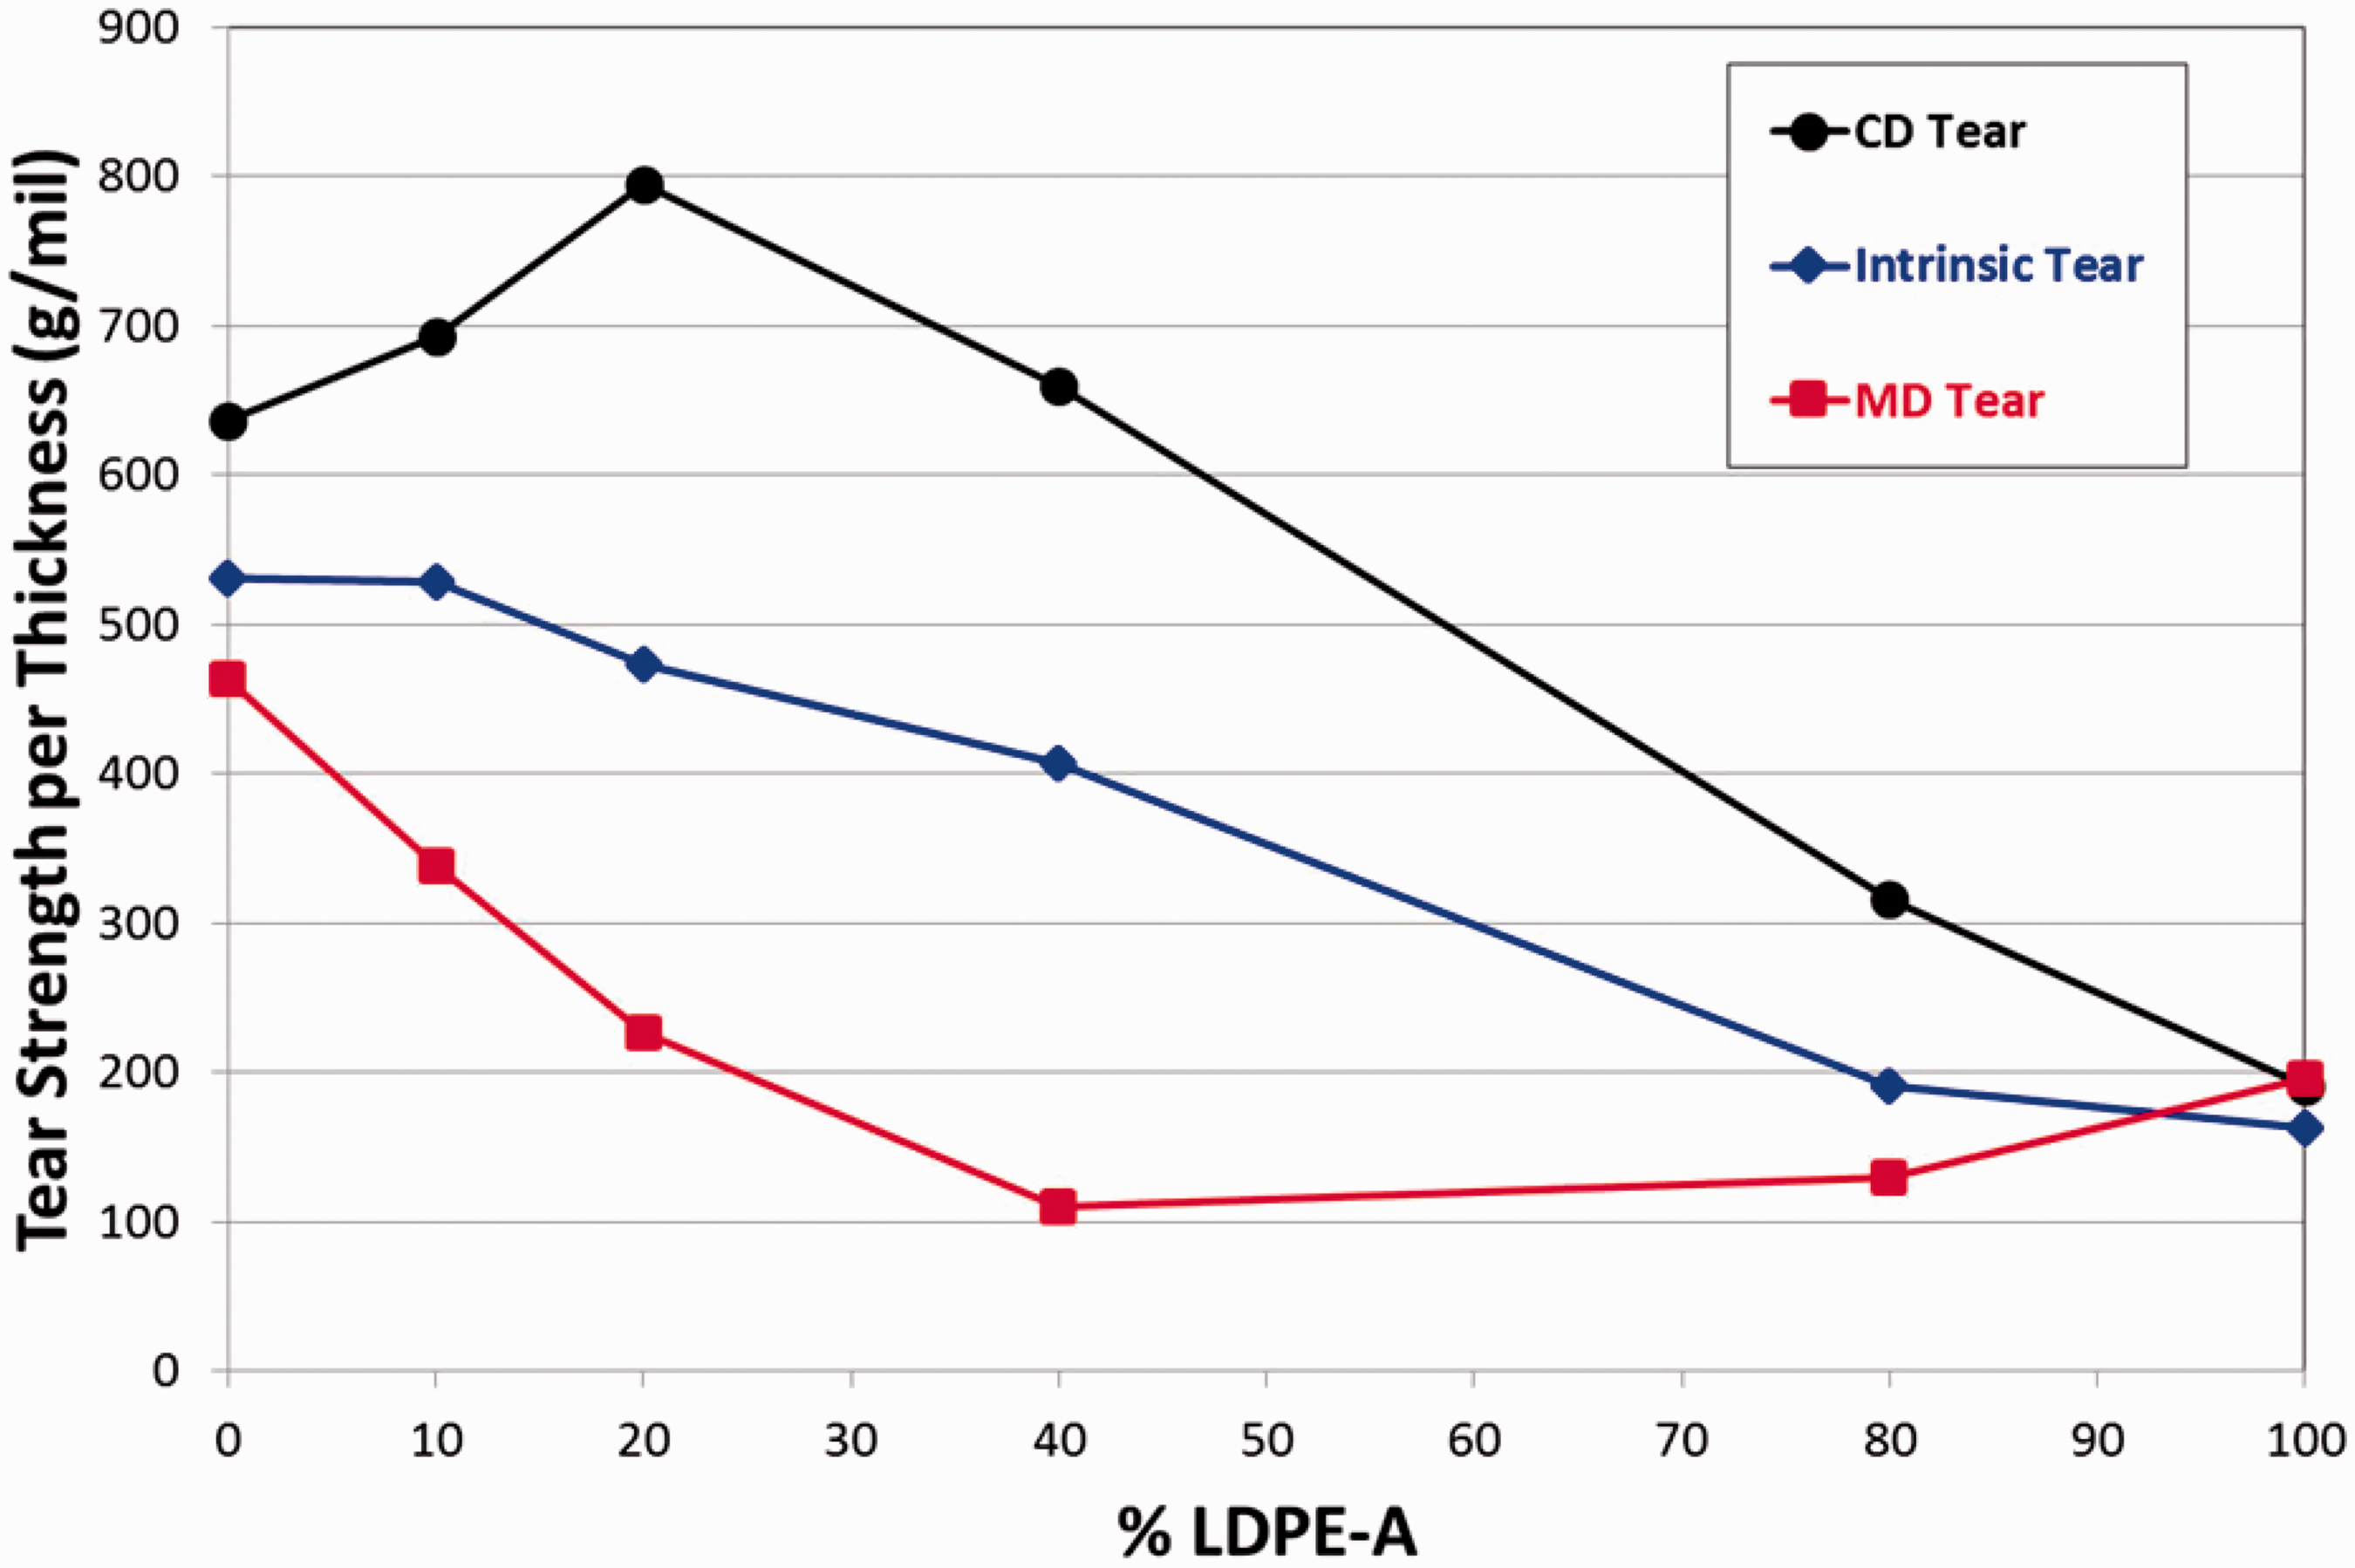
Normalized intrinsic tear on compression molded plaques and MD/CD Elmendorf tear on 2 mil blown film versus %LDPE-A. CD: cross direction; LDPE: low density polyethylene; MD: machine direction.
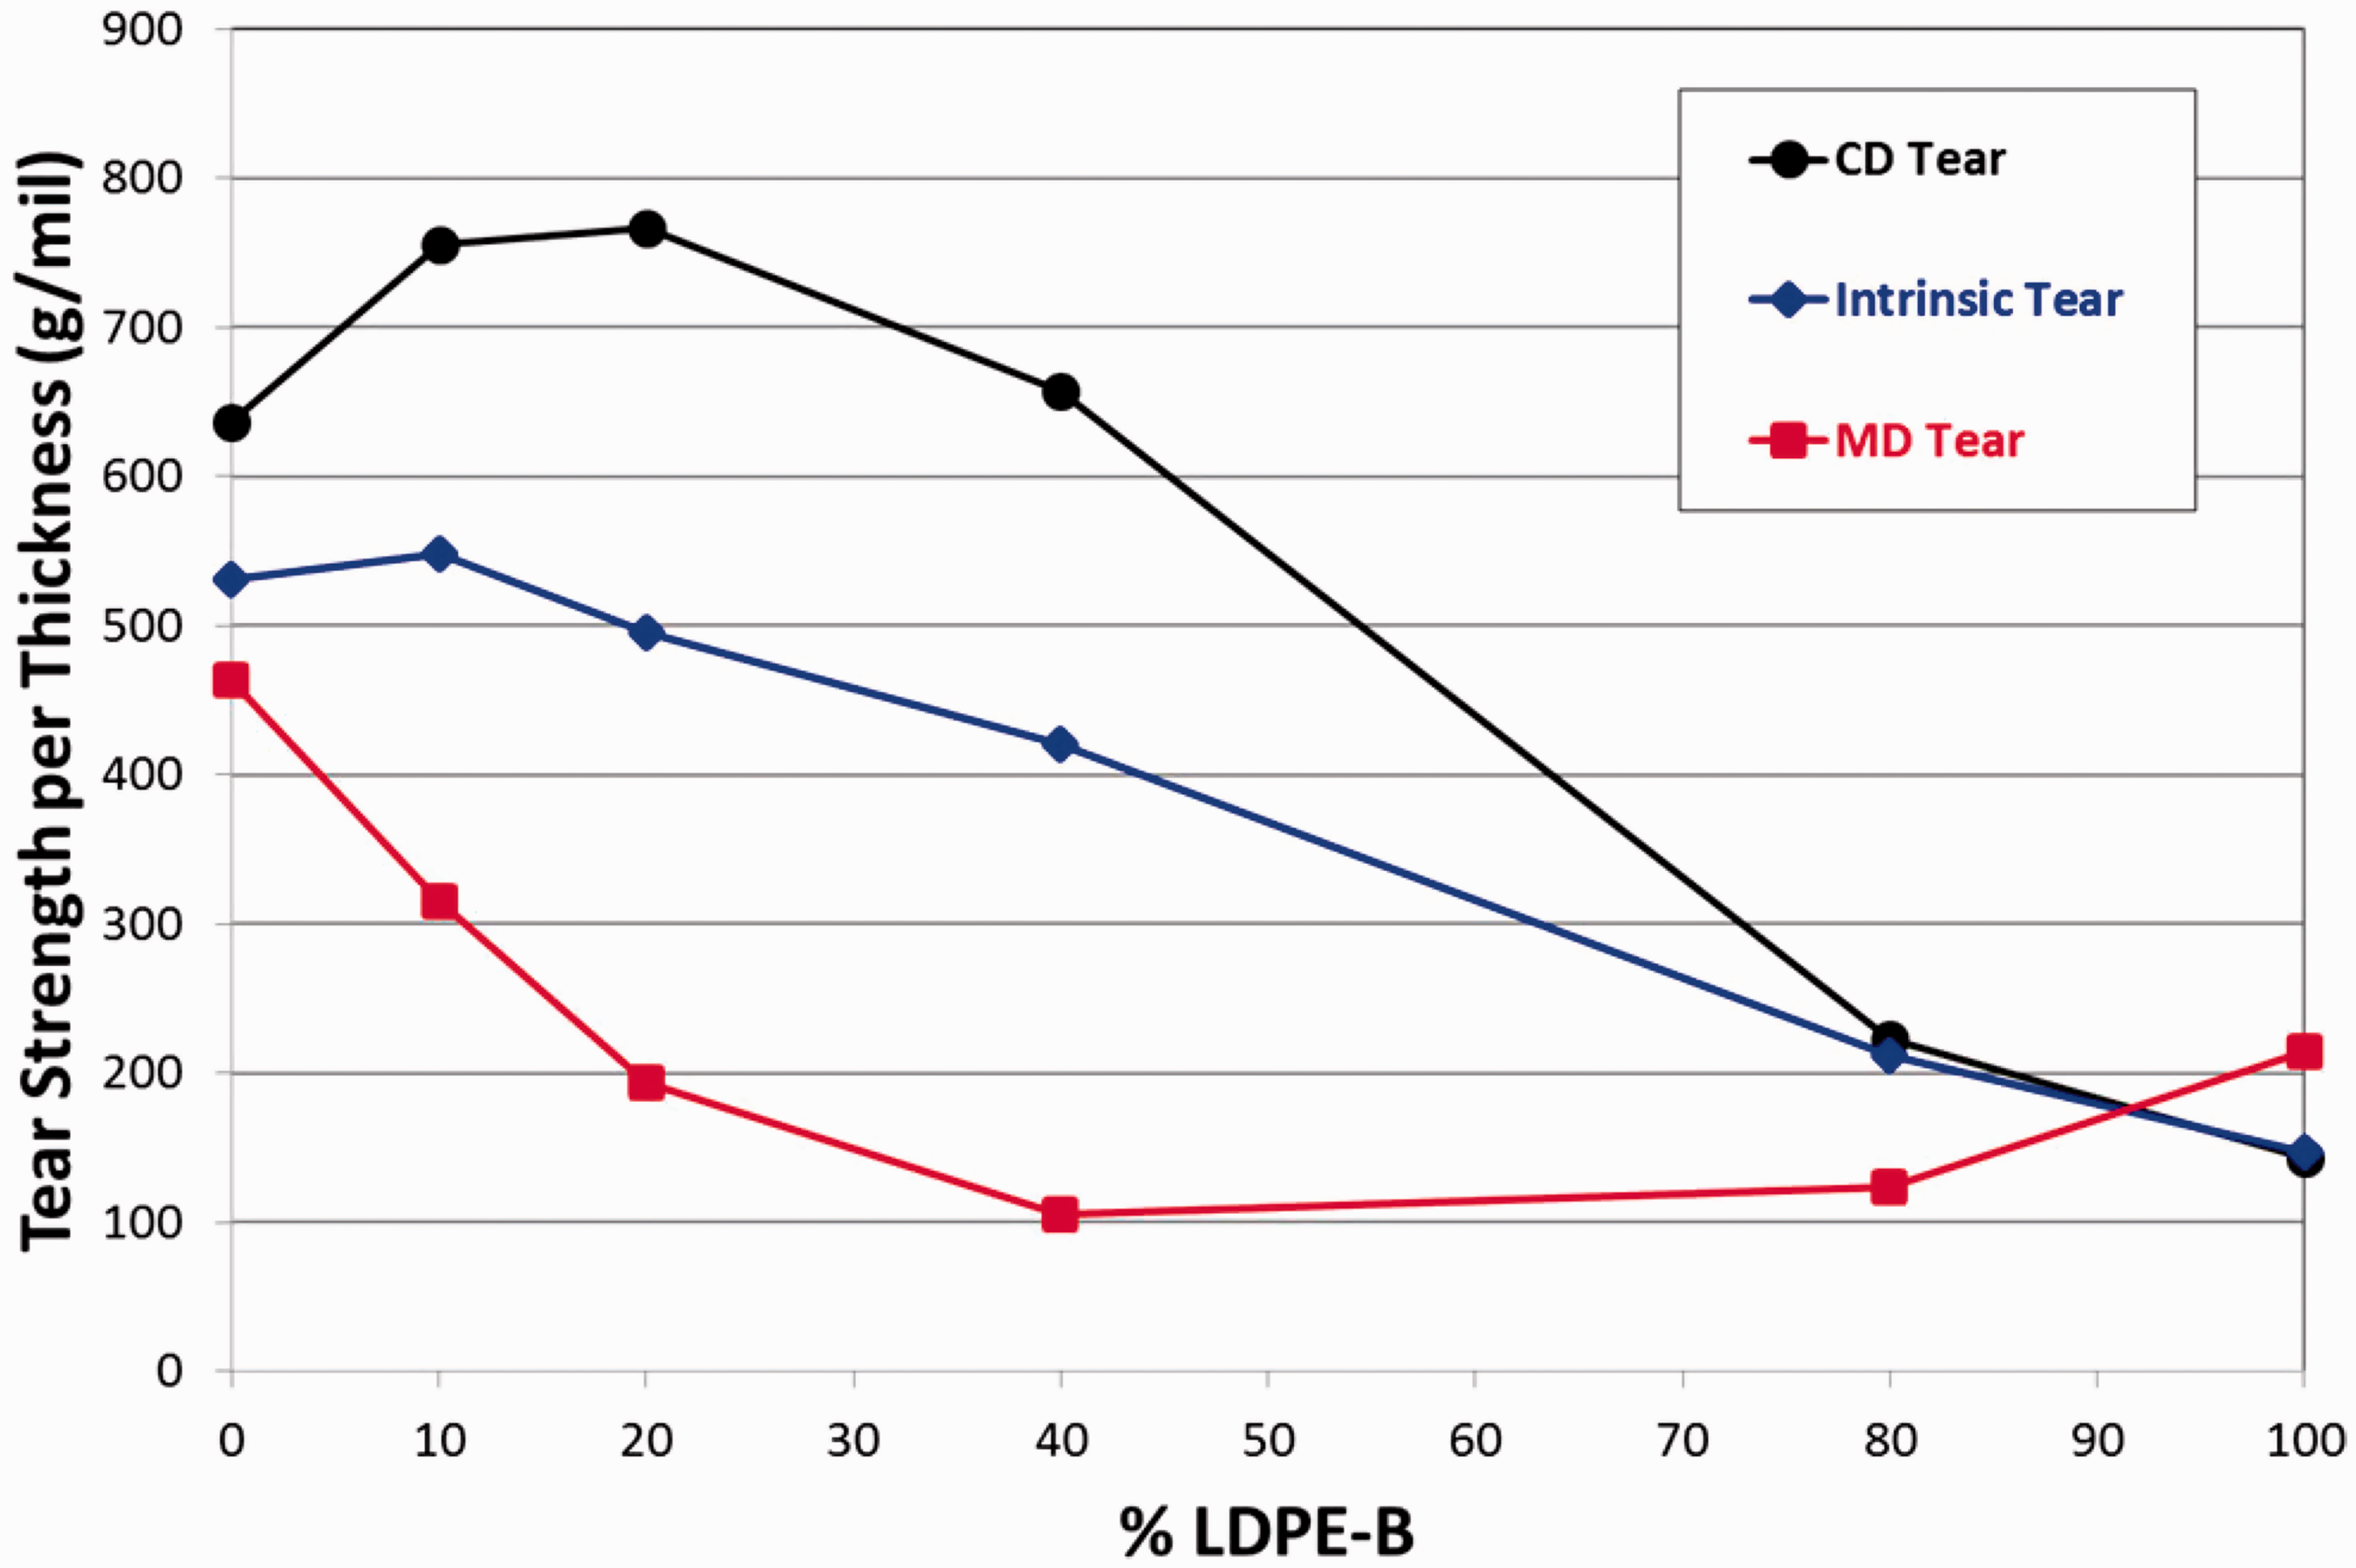
Normalized intrinsic tear on compression molded plaques and MD/CD Elmendorf tear on 2 mil blown film versus %LDPE-B. CD: cross direction; LDPE: low density polyethylene; MD: machine direction.
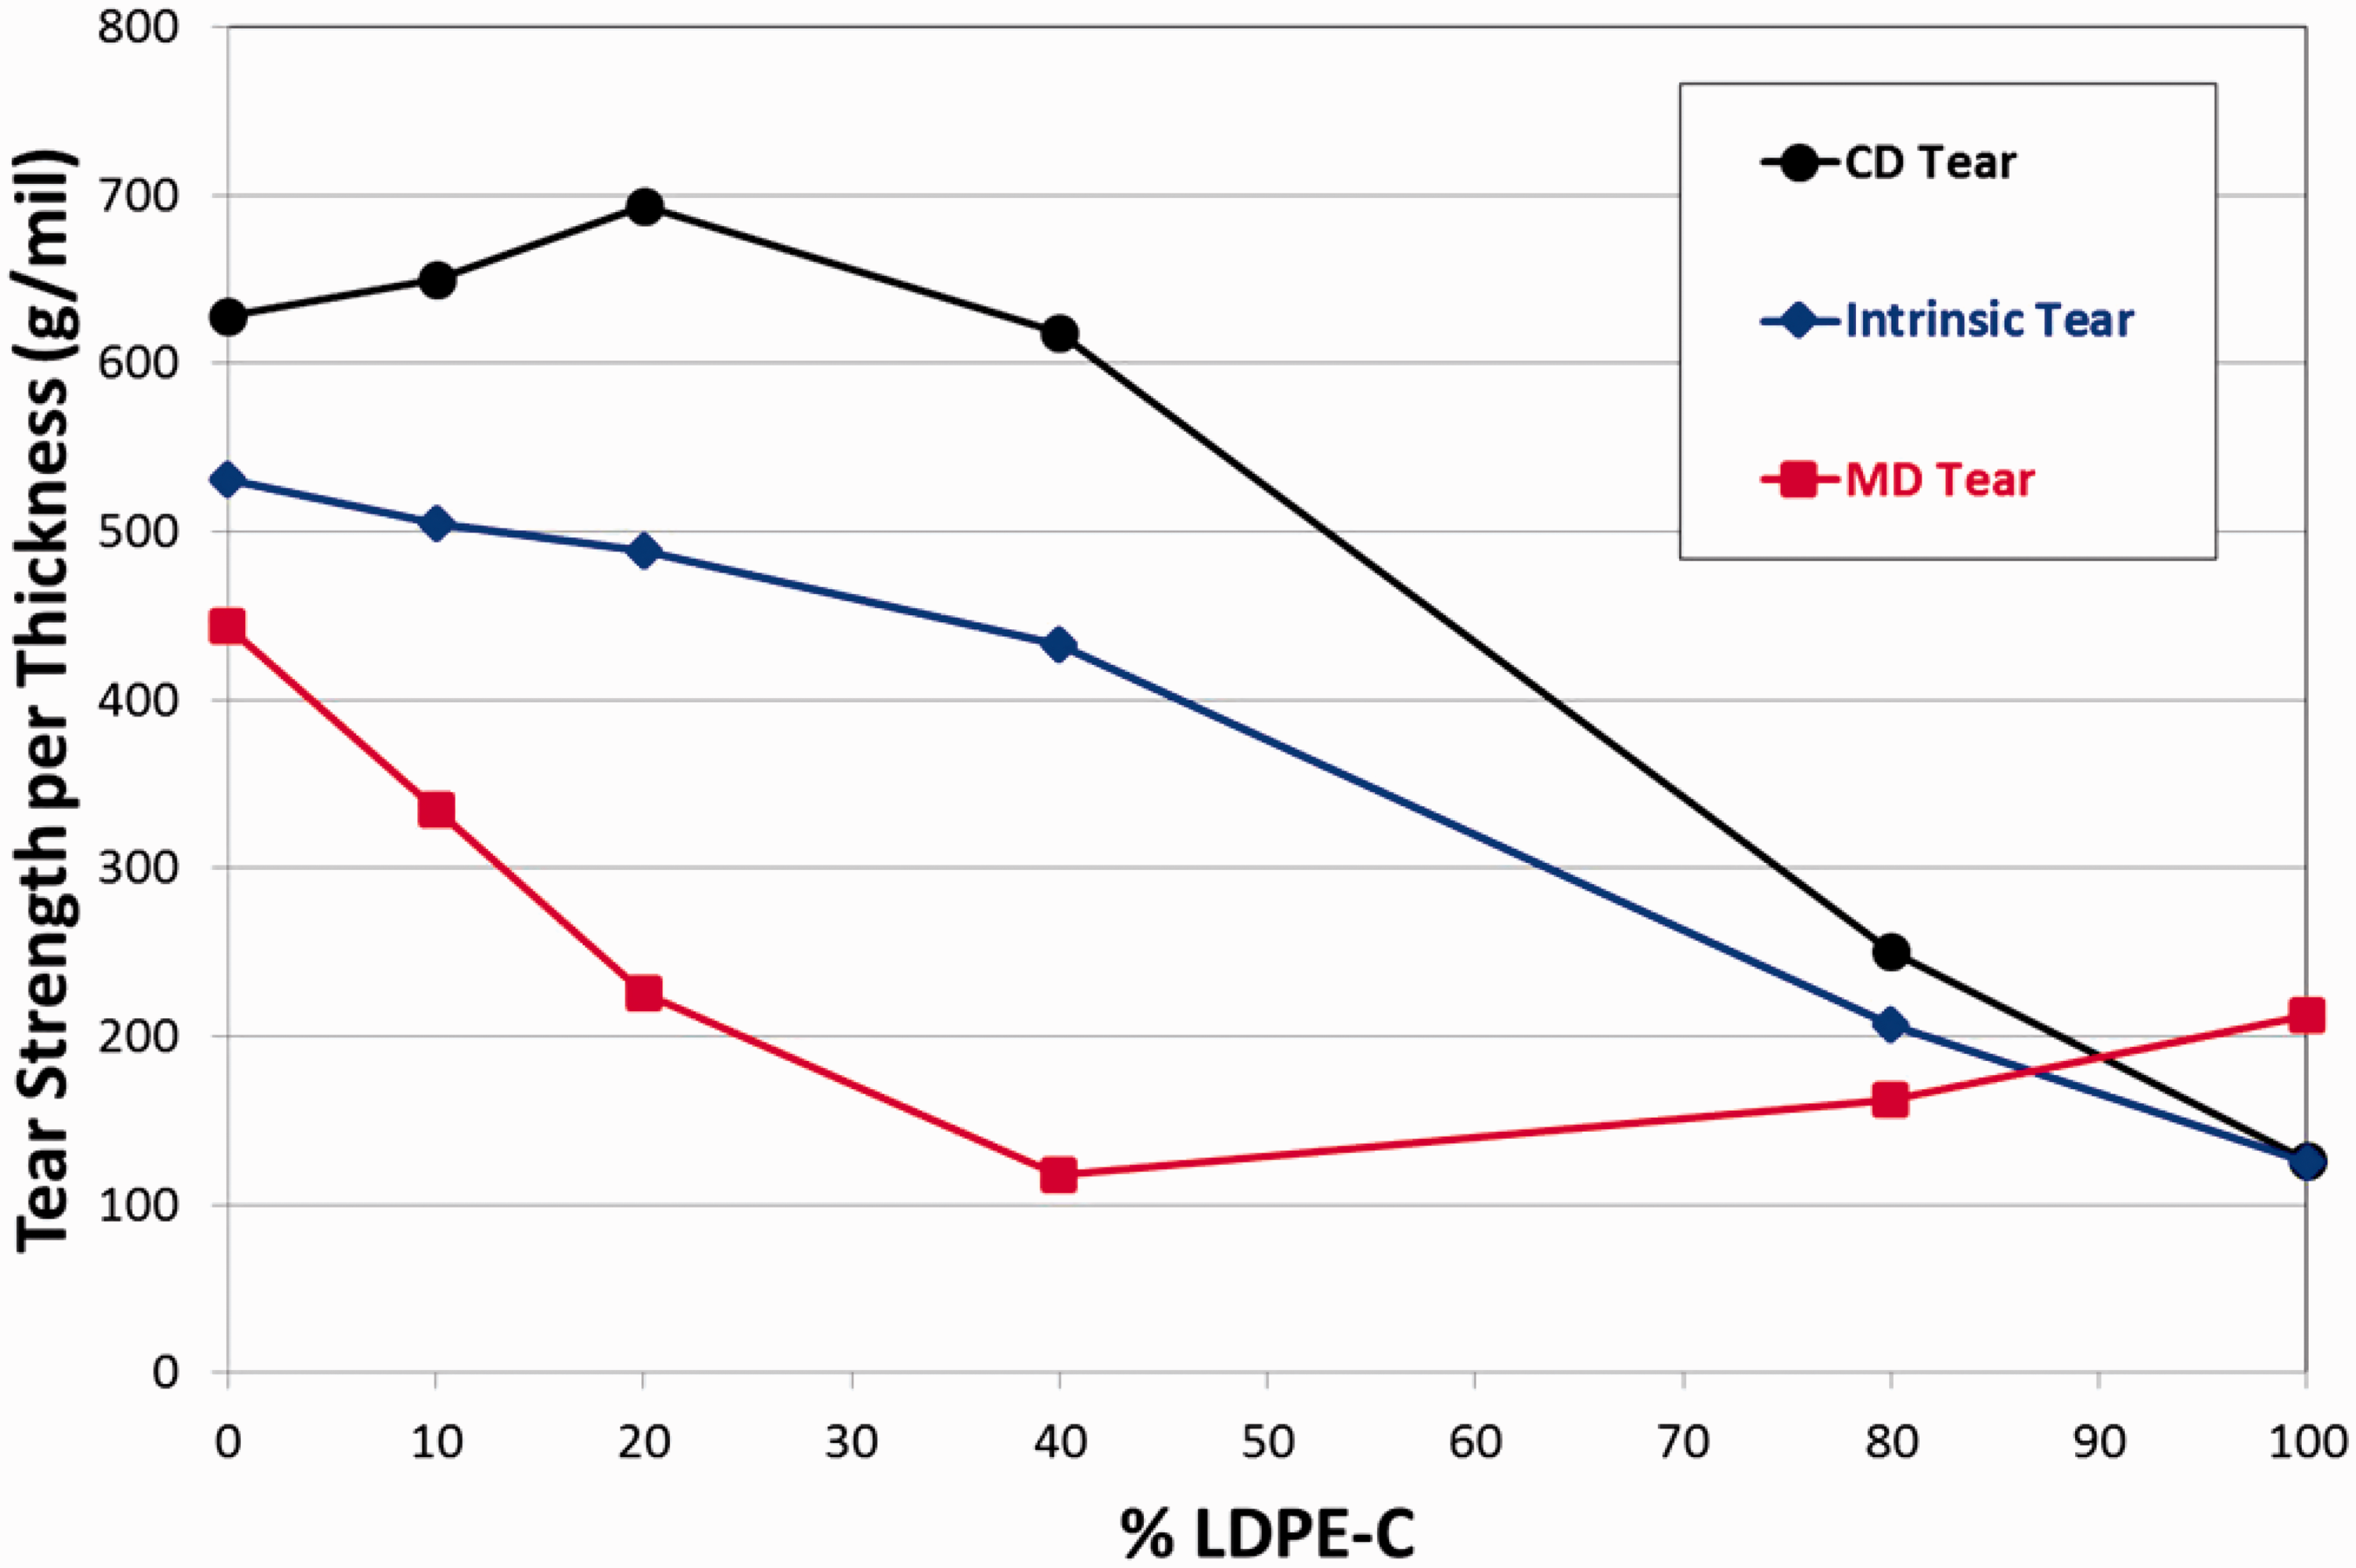
Normalized intrinsic tear on compression molded plaques and MD/CD Elmendorf tear on 2 mil blown film versus %LDPE-C. CD: cross direction; LDPE: low density polyethylene; MD: machine direction.
We assume that the intrinsic tear strength per unit thickness is proportional to either the geometric mean or the arithmetic mean of the MD and CD tear strength per unit film thickness. These means were calculated using the following equations (1) and (2)


Figure 11 compares the geometric and arithmetic mean of MD/CD Elmendorf tear for LDPE-A/LLDPE blown film with intrinsic Elmendorf tear. One clearly sees that the arithmetic mean of MD and CD blown film tear showed a much closer fit to the intrinsic tear curve than the geometric mean for the LLDPE/LDPE-C blends. The same was observed for LDPE-A/LLDPE and LDPE-C/LLDPE blends.
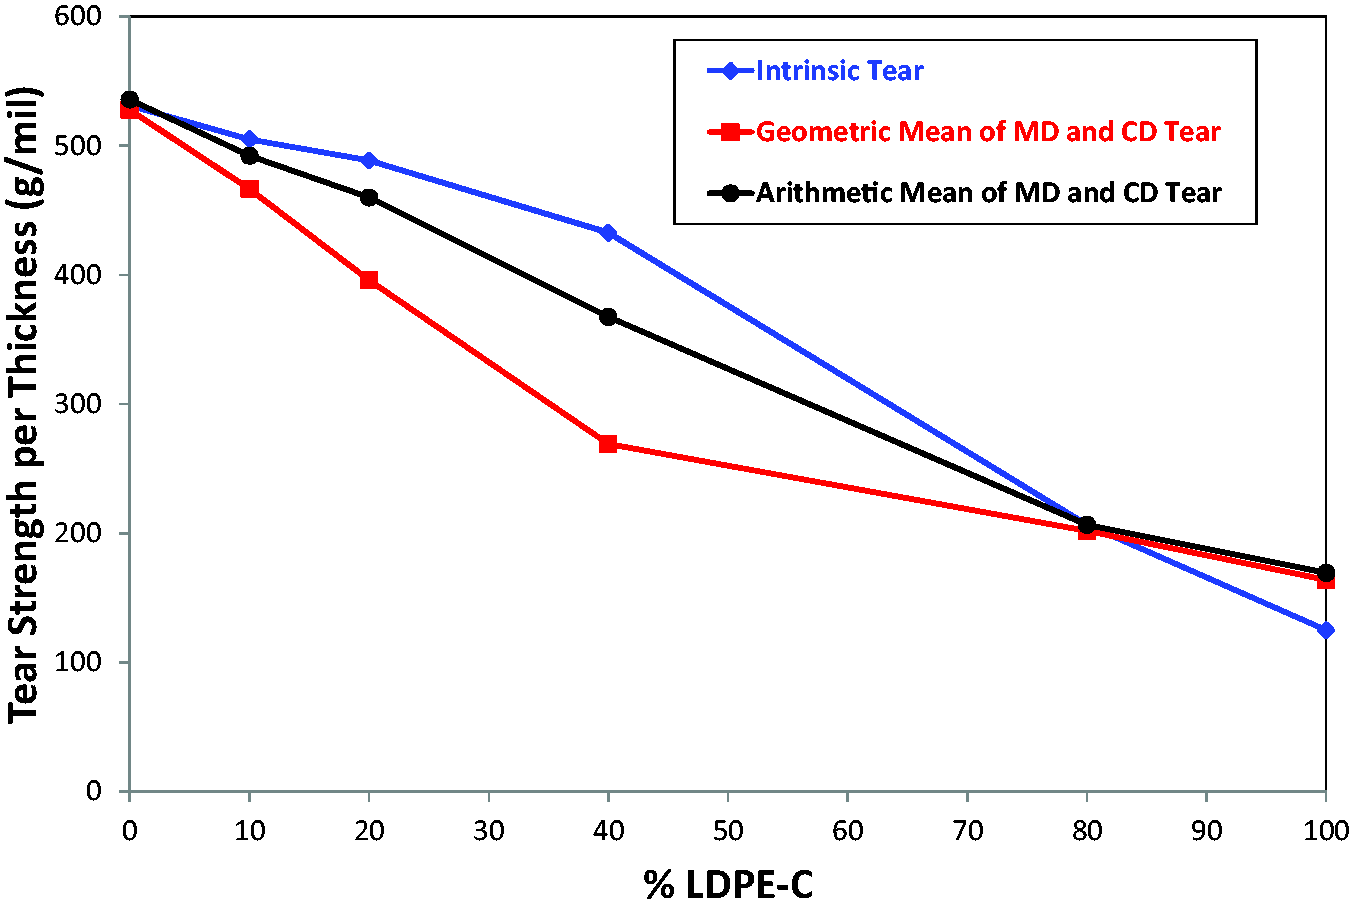
Normalized intrinsic tear and MD and CD Elmendorf tear strengths geometric and arithmetic means versus %LDPE for LLDPE/LDPE-C blends. CD: cross direction; LDPE: low density polyethylene; MD: machine direction.
Film orientation by SAXS
The blown films were analyzed by small angle X-ray light scattering in order to understand the potential effects of crystalline lamellar orientation in the plane of the films on the blown film MD tear strength. We know that tear strength can relate to the lamellar orientation induced during the blown film process.
28
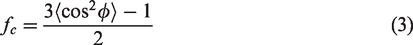
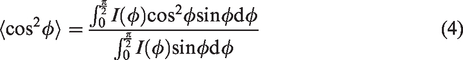
The lamellar orientation can be quantitatively evaluated using a Herman’s orientation function defined as
29
For this SAXS work, the MD direction was used as the reference direction. The fc represents the degree of lamellar orientation along the MD direction. 1 represents perfect orientation, 0 represents random orientation, and −0.5 represents perfectly perpendicular orientation. As the SAXS peak is relatively broad for polyethylene, a 5 pixel wide band crossing the scattering maxima is used to evaluate lamellar orientation.
Figure 12 shows the scattering patterns. All the scattering patterns are preferably oriented in the MD. This is also shown by Troisi et al. 1 in their study of structure evolution during film blowing of LDPE/LLDPE 10/90 blend. Figure 13 shows that at 20% LDPE there is a sharp increase in lamellar orientation and then a moderate increase up to 80% LDPE. The neat LDPE showed a lower lamellar orientation compared to 80/20 LDPE-B/LLDPE blend. Rheology tells us that the LDPE melt relaxation is slow; adding LDPE to LLDPE locks in more MD orientation during film crystallization, due to a much higher MD draw down ratio as compared to the CD BUR. This is what is observed in Figure 13. It is also noted that the blend with 80% of LDPE shows higher lamellar orientation than the neat LDPE. This can be interpreted from melt strength data of the blend as overlaid in Figure 13. Blending 20% LLDPE in LDPE resins increased the melt strength of the blend which also would result in higher MD orientation. Therefore, more MD orientation can be locked in the 20/80 LLDPE/LDPE blend than for the neat LDPE.
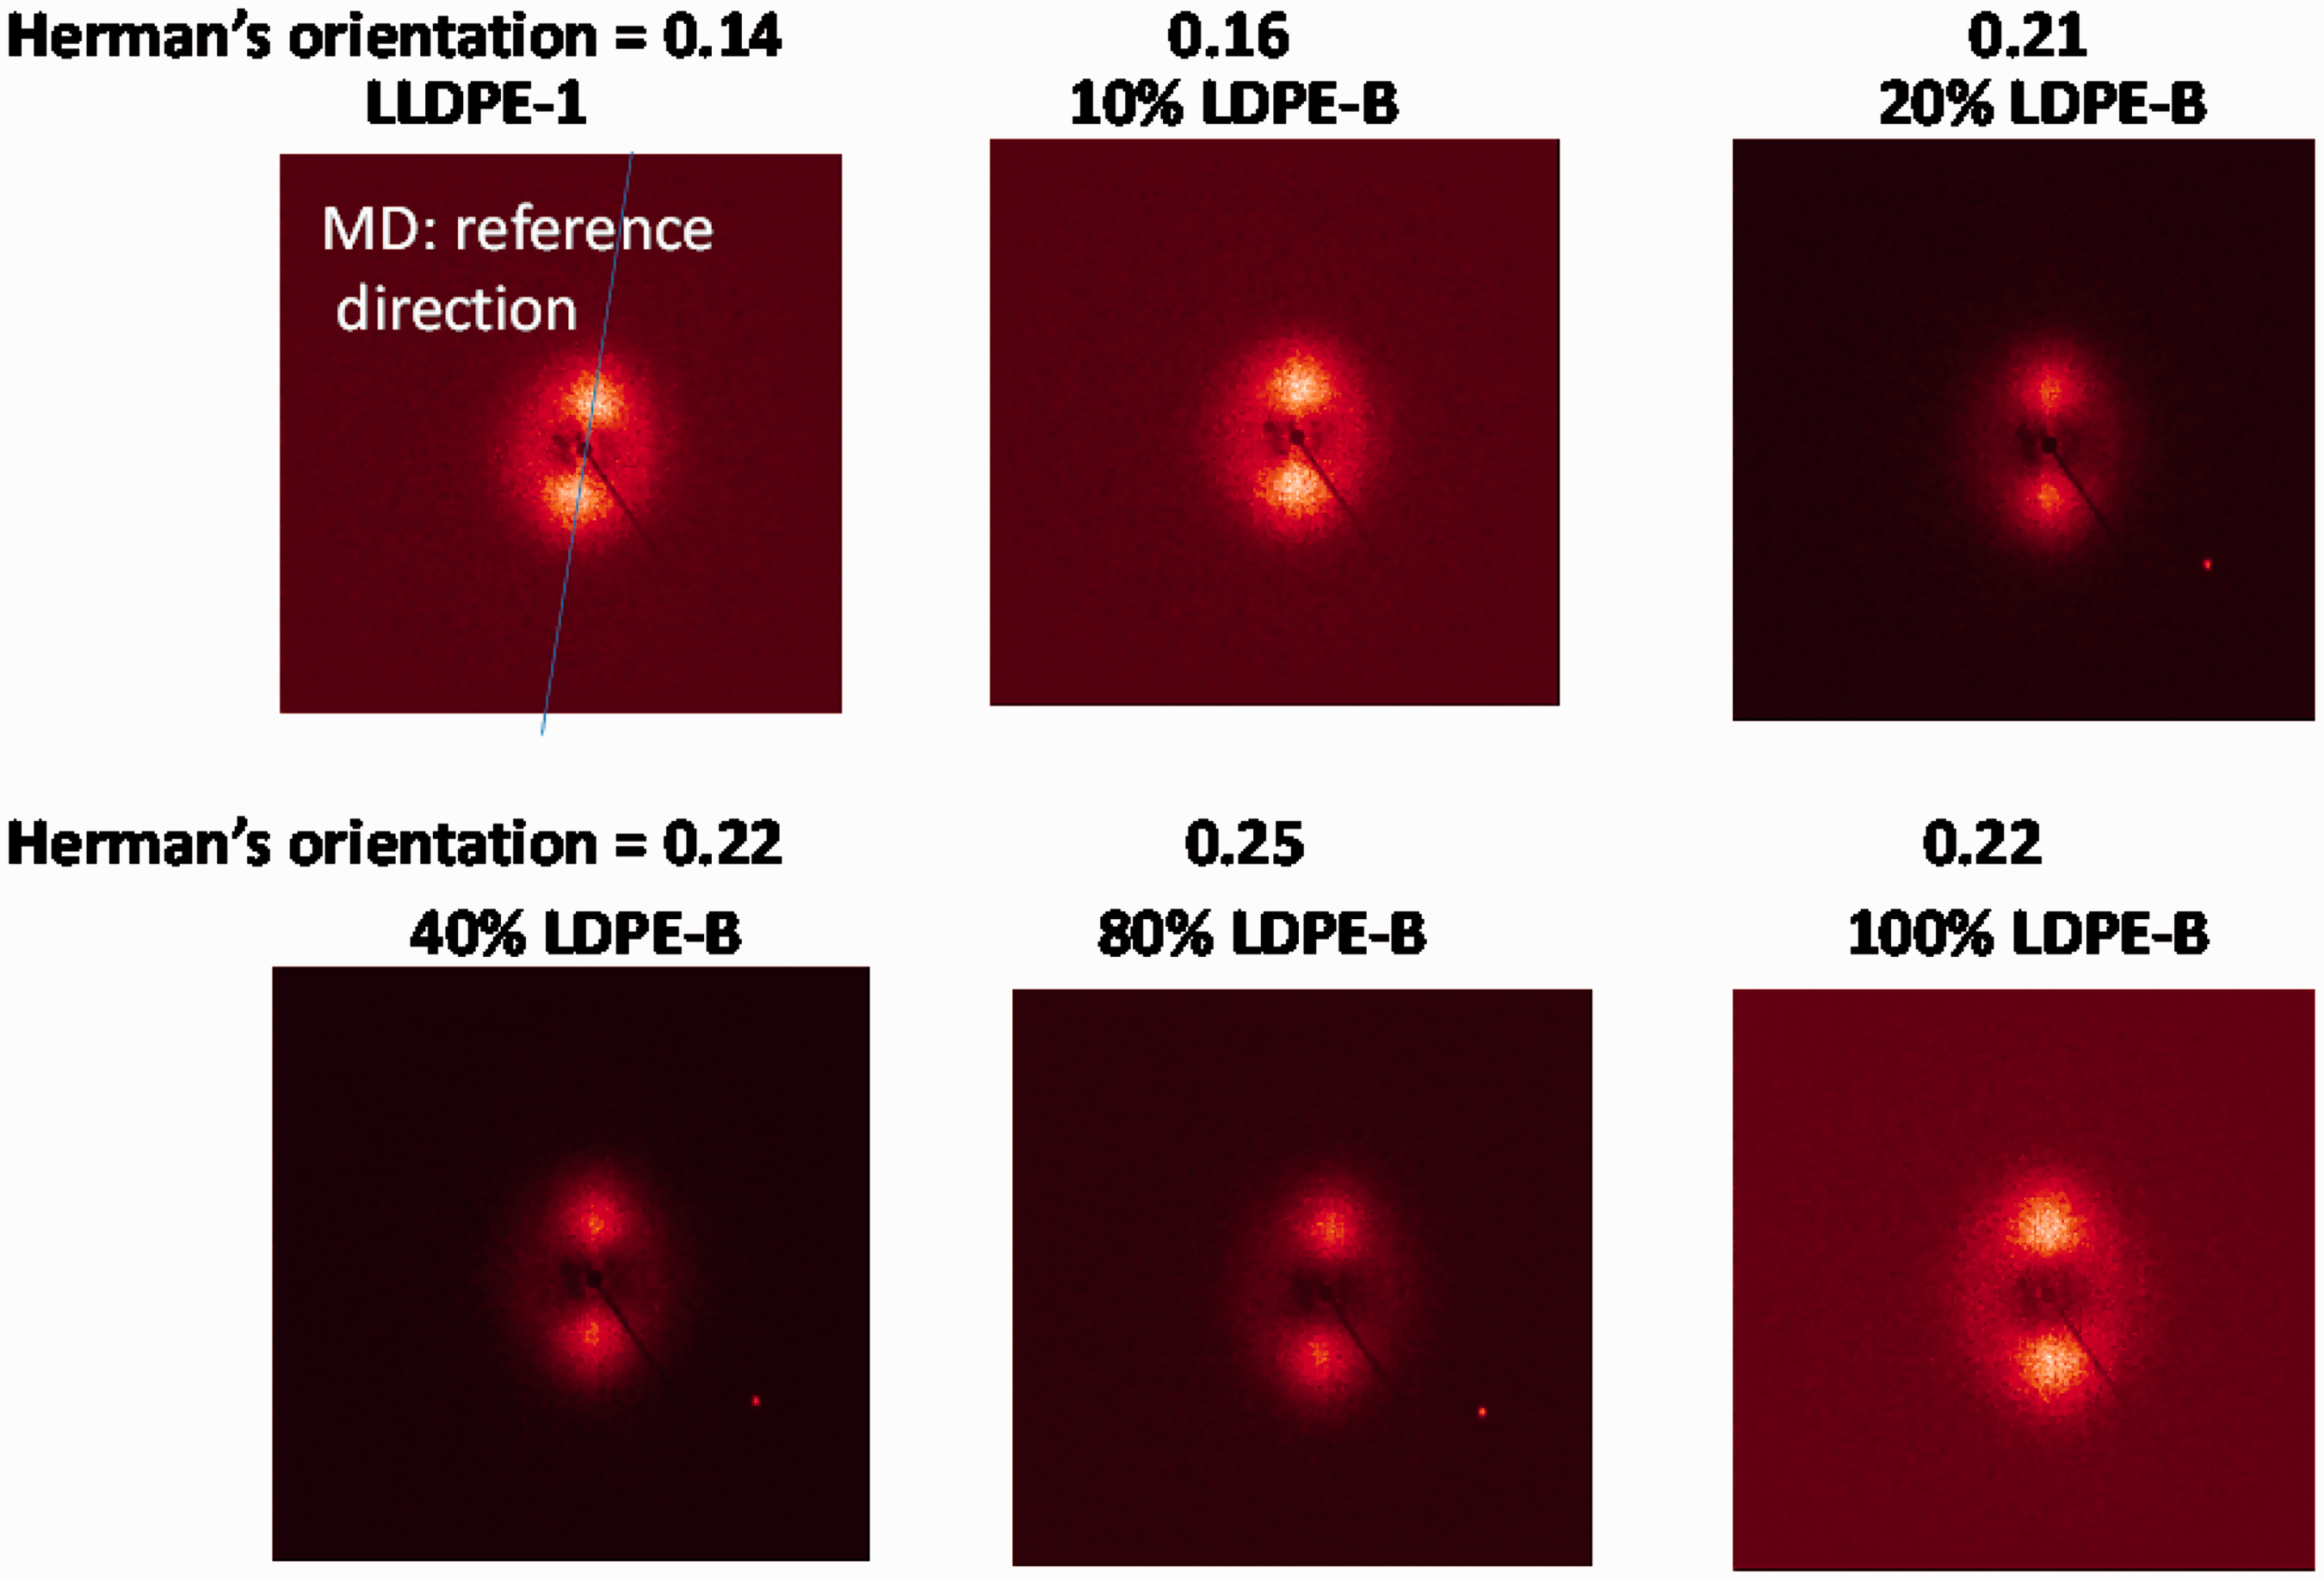
LLDPE/LDPE-B blown film SAXS patterns with measured Herman’s lamellar orientation factor. LDPE: low density polyethylene; LLDPE: linear low density polyethylene.
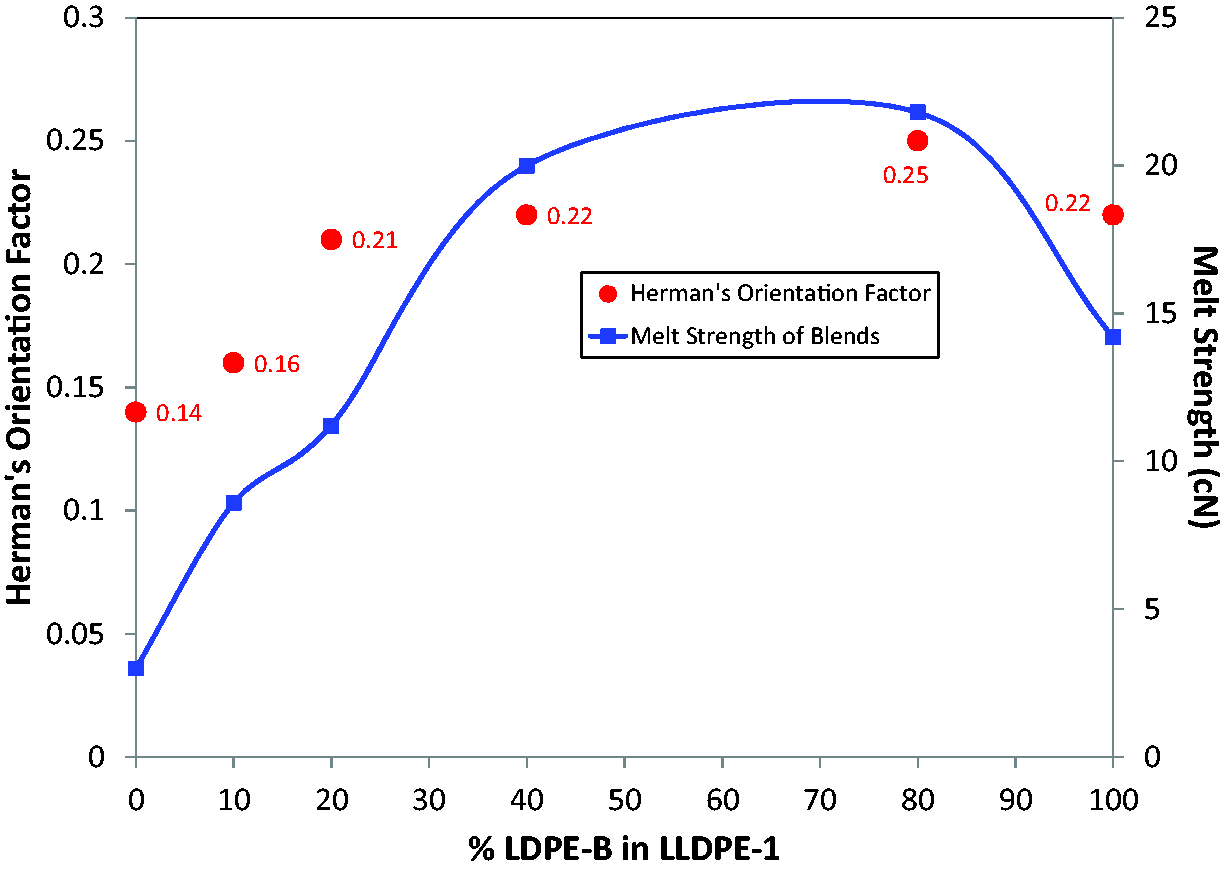
Herman’s orientation factor versus %LDPE-B in LLDPE. The LDPE-B/LLDPE melt strength curve is overlaid. LDPE: low density polyethylene; LLDPE: linear low density polyethylene.
When a polymer crystallizes at a higher temperature, the long period increases due to increase in the lamellar thickness. Figure 14 shows the scattering profiles for the LDPE-B blends. At 80% LDPE the profile looks very similar except that the blend shows a larger long period (16.4 nm) than the neat LDPE (15.5 nm). This is presumably due to a higher blend crystallization temperature (faster crystallization). The scattering profiles with less LDPE-B looked more similar to neat LLDPE which showed a significantly larger long period (21 nm). With increasing LDPE content, the long period decreased. The change in lamellar orientation with the addition of different amounts of LDPE showed a similar trend as with melt strength (Figure 2) but the opposite trend as compared with MD tear strength (Figure 4). See Figure 6. We know that higher MD orientation typically leads to lower MD tear strength and higher CD tear strength. The change in MD tear strength with LDPE content is consistent with the lamellar orientation observed for the blends.
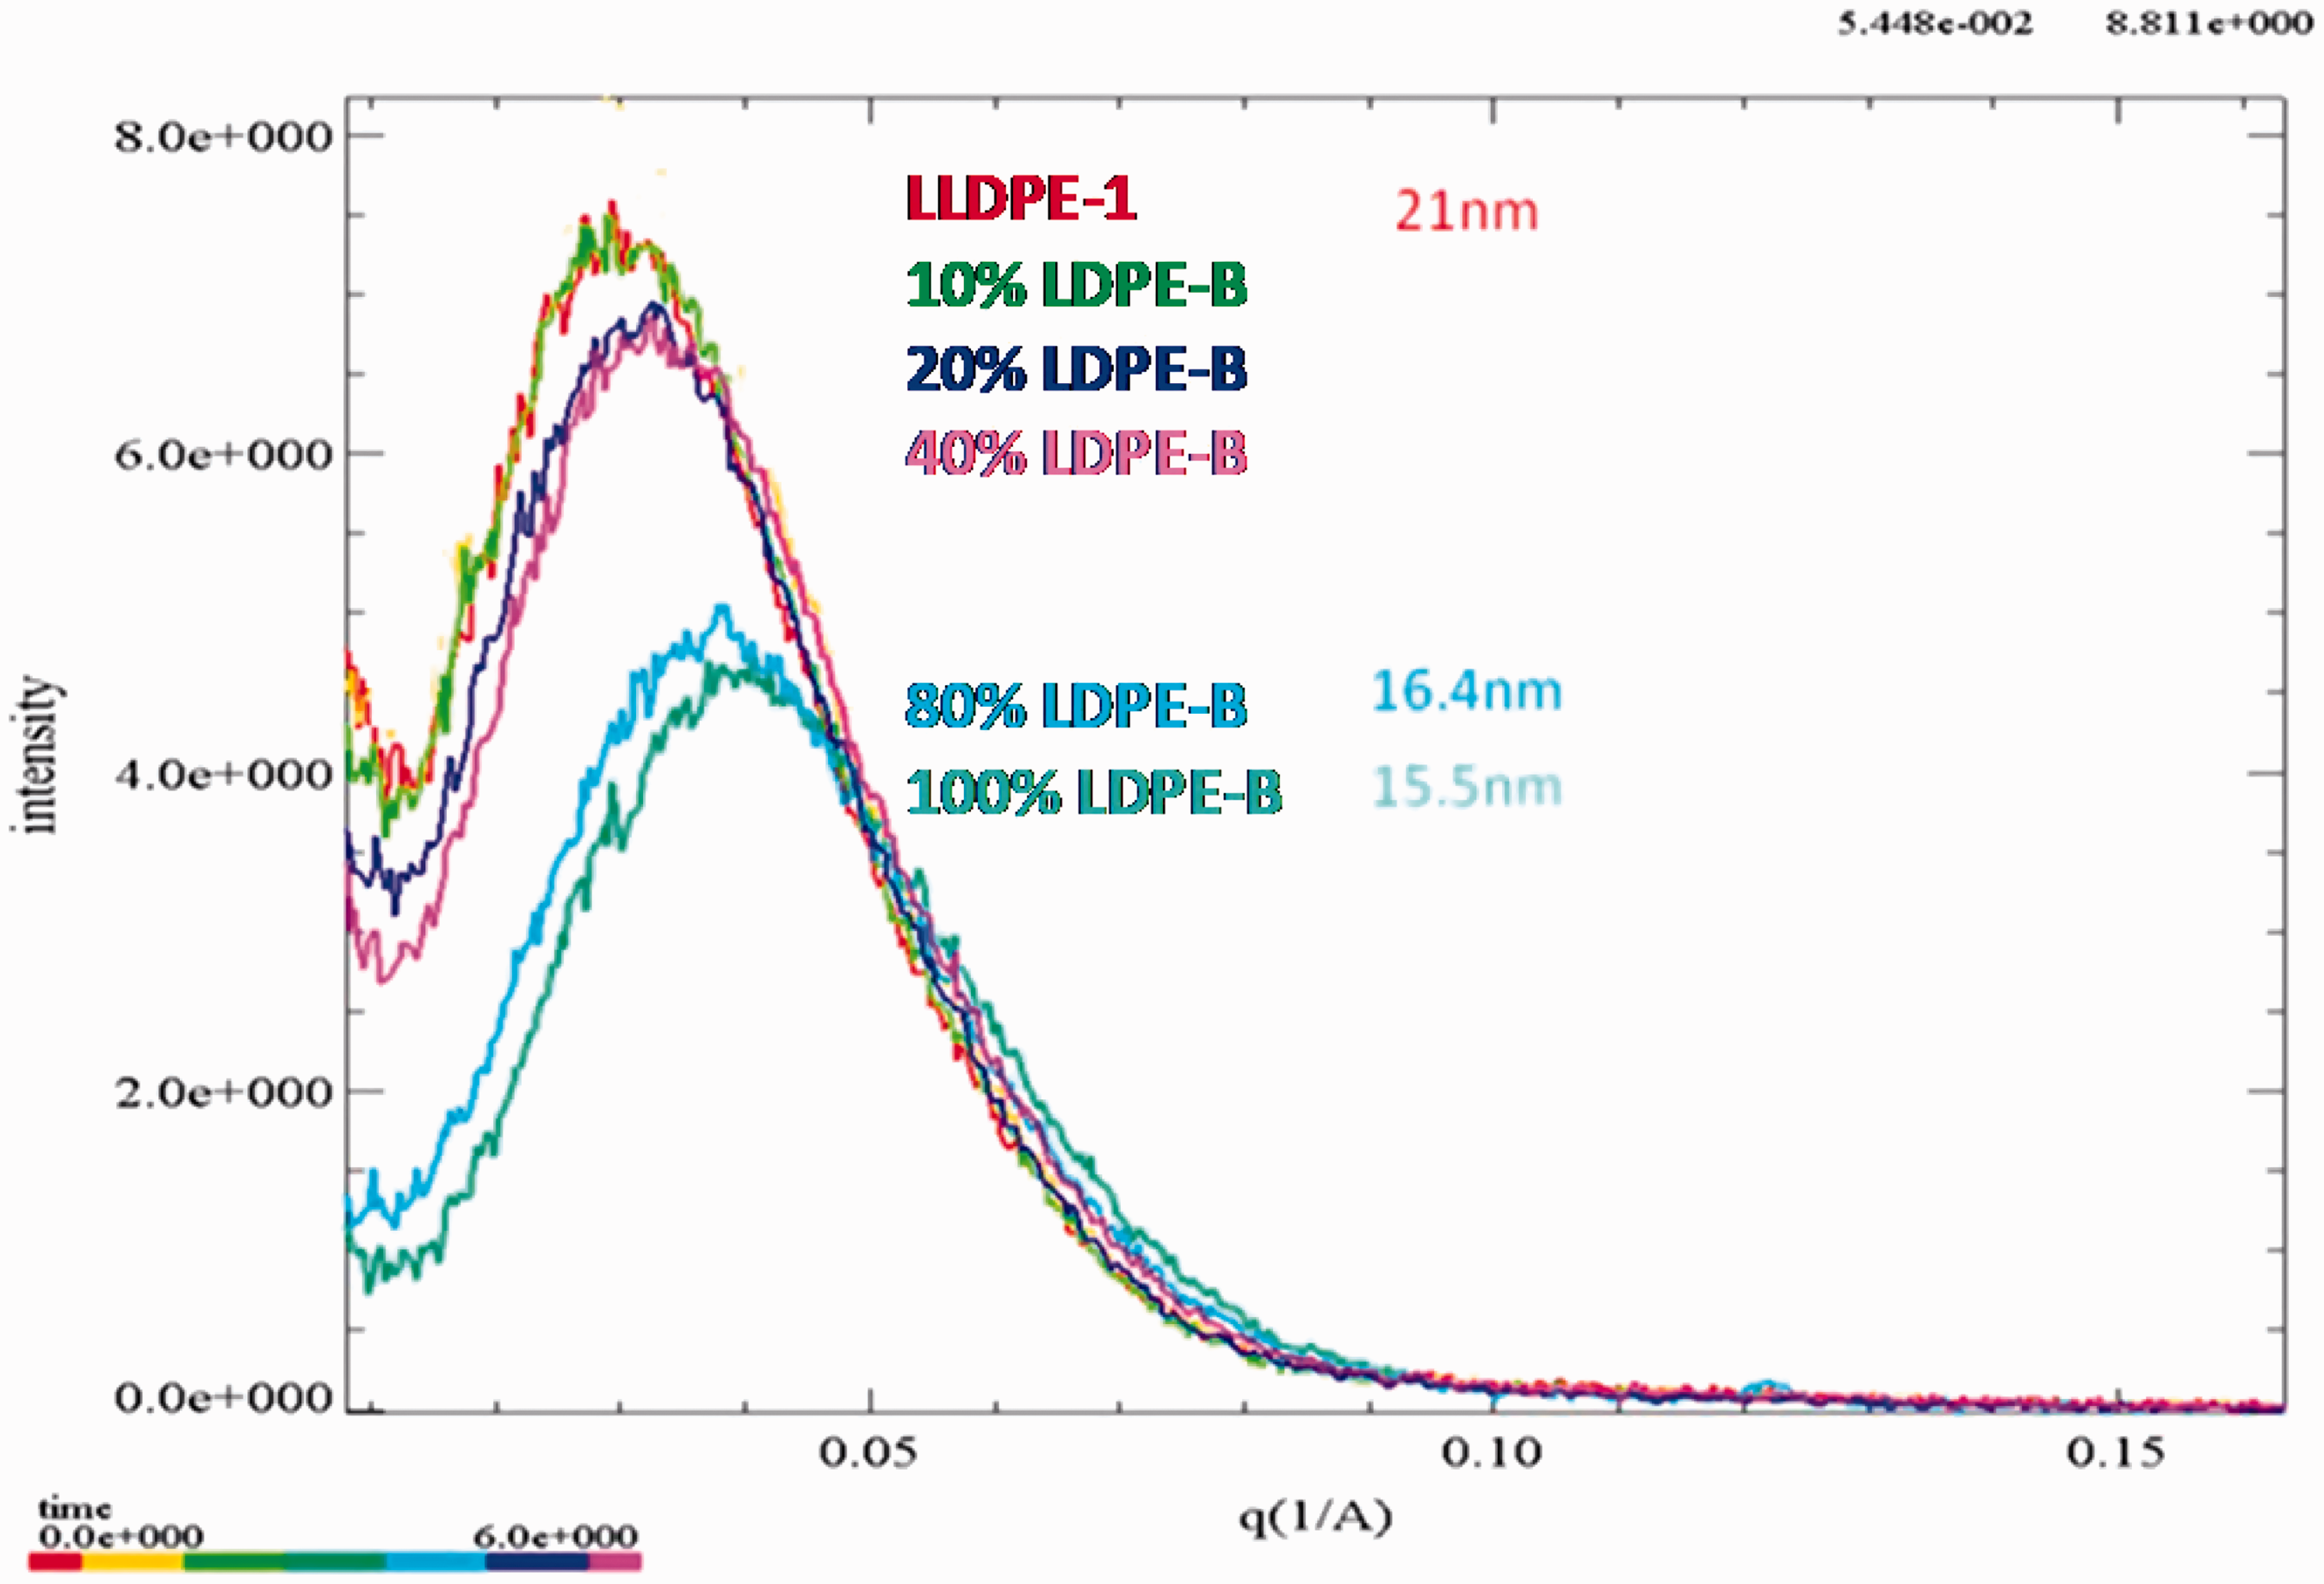
SAXS scattering profiles, intensity versus q(1/A) for LDPE-B/LLDPE blown films. LDPE: low density polyethylene; LLDPE: linear low density polyethylene.
Dart impact strength
Figure 15 shows dart impact strength versus %LDPE for LDPE/LLDPE films. Blending these three LDPEs to LLDPE-1 resulted in a significant reduction in the dart impact strength. Figure 16 plots the intrinsic impact strength versus %LDPE measured on 20 mil (508 µm) compression molded plaques using ASTM D3763. The intrinsic impact strength decreased with increased LDPE, due to a decrease in tie chain concentration. The decrease in blown film dart impact strength with increasing LDPE is due to both an increased MD orientation (more unbalanced MD/CD orientation) and the decrease in intrinsic impact strength (due to decrease in tie chain concentration).
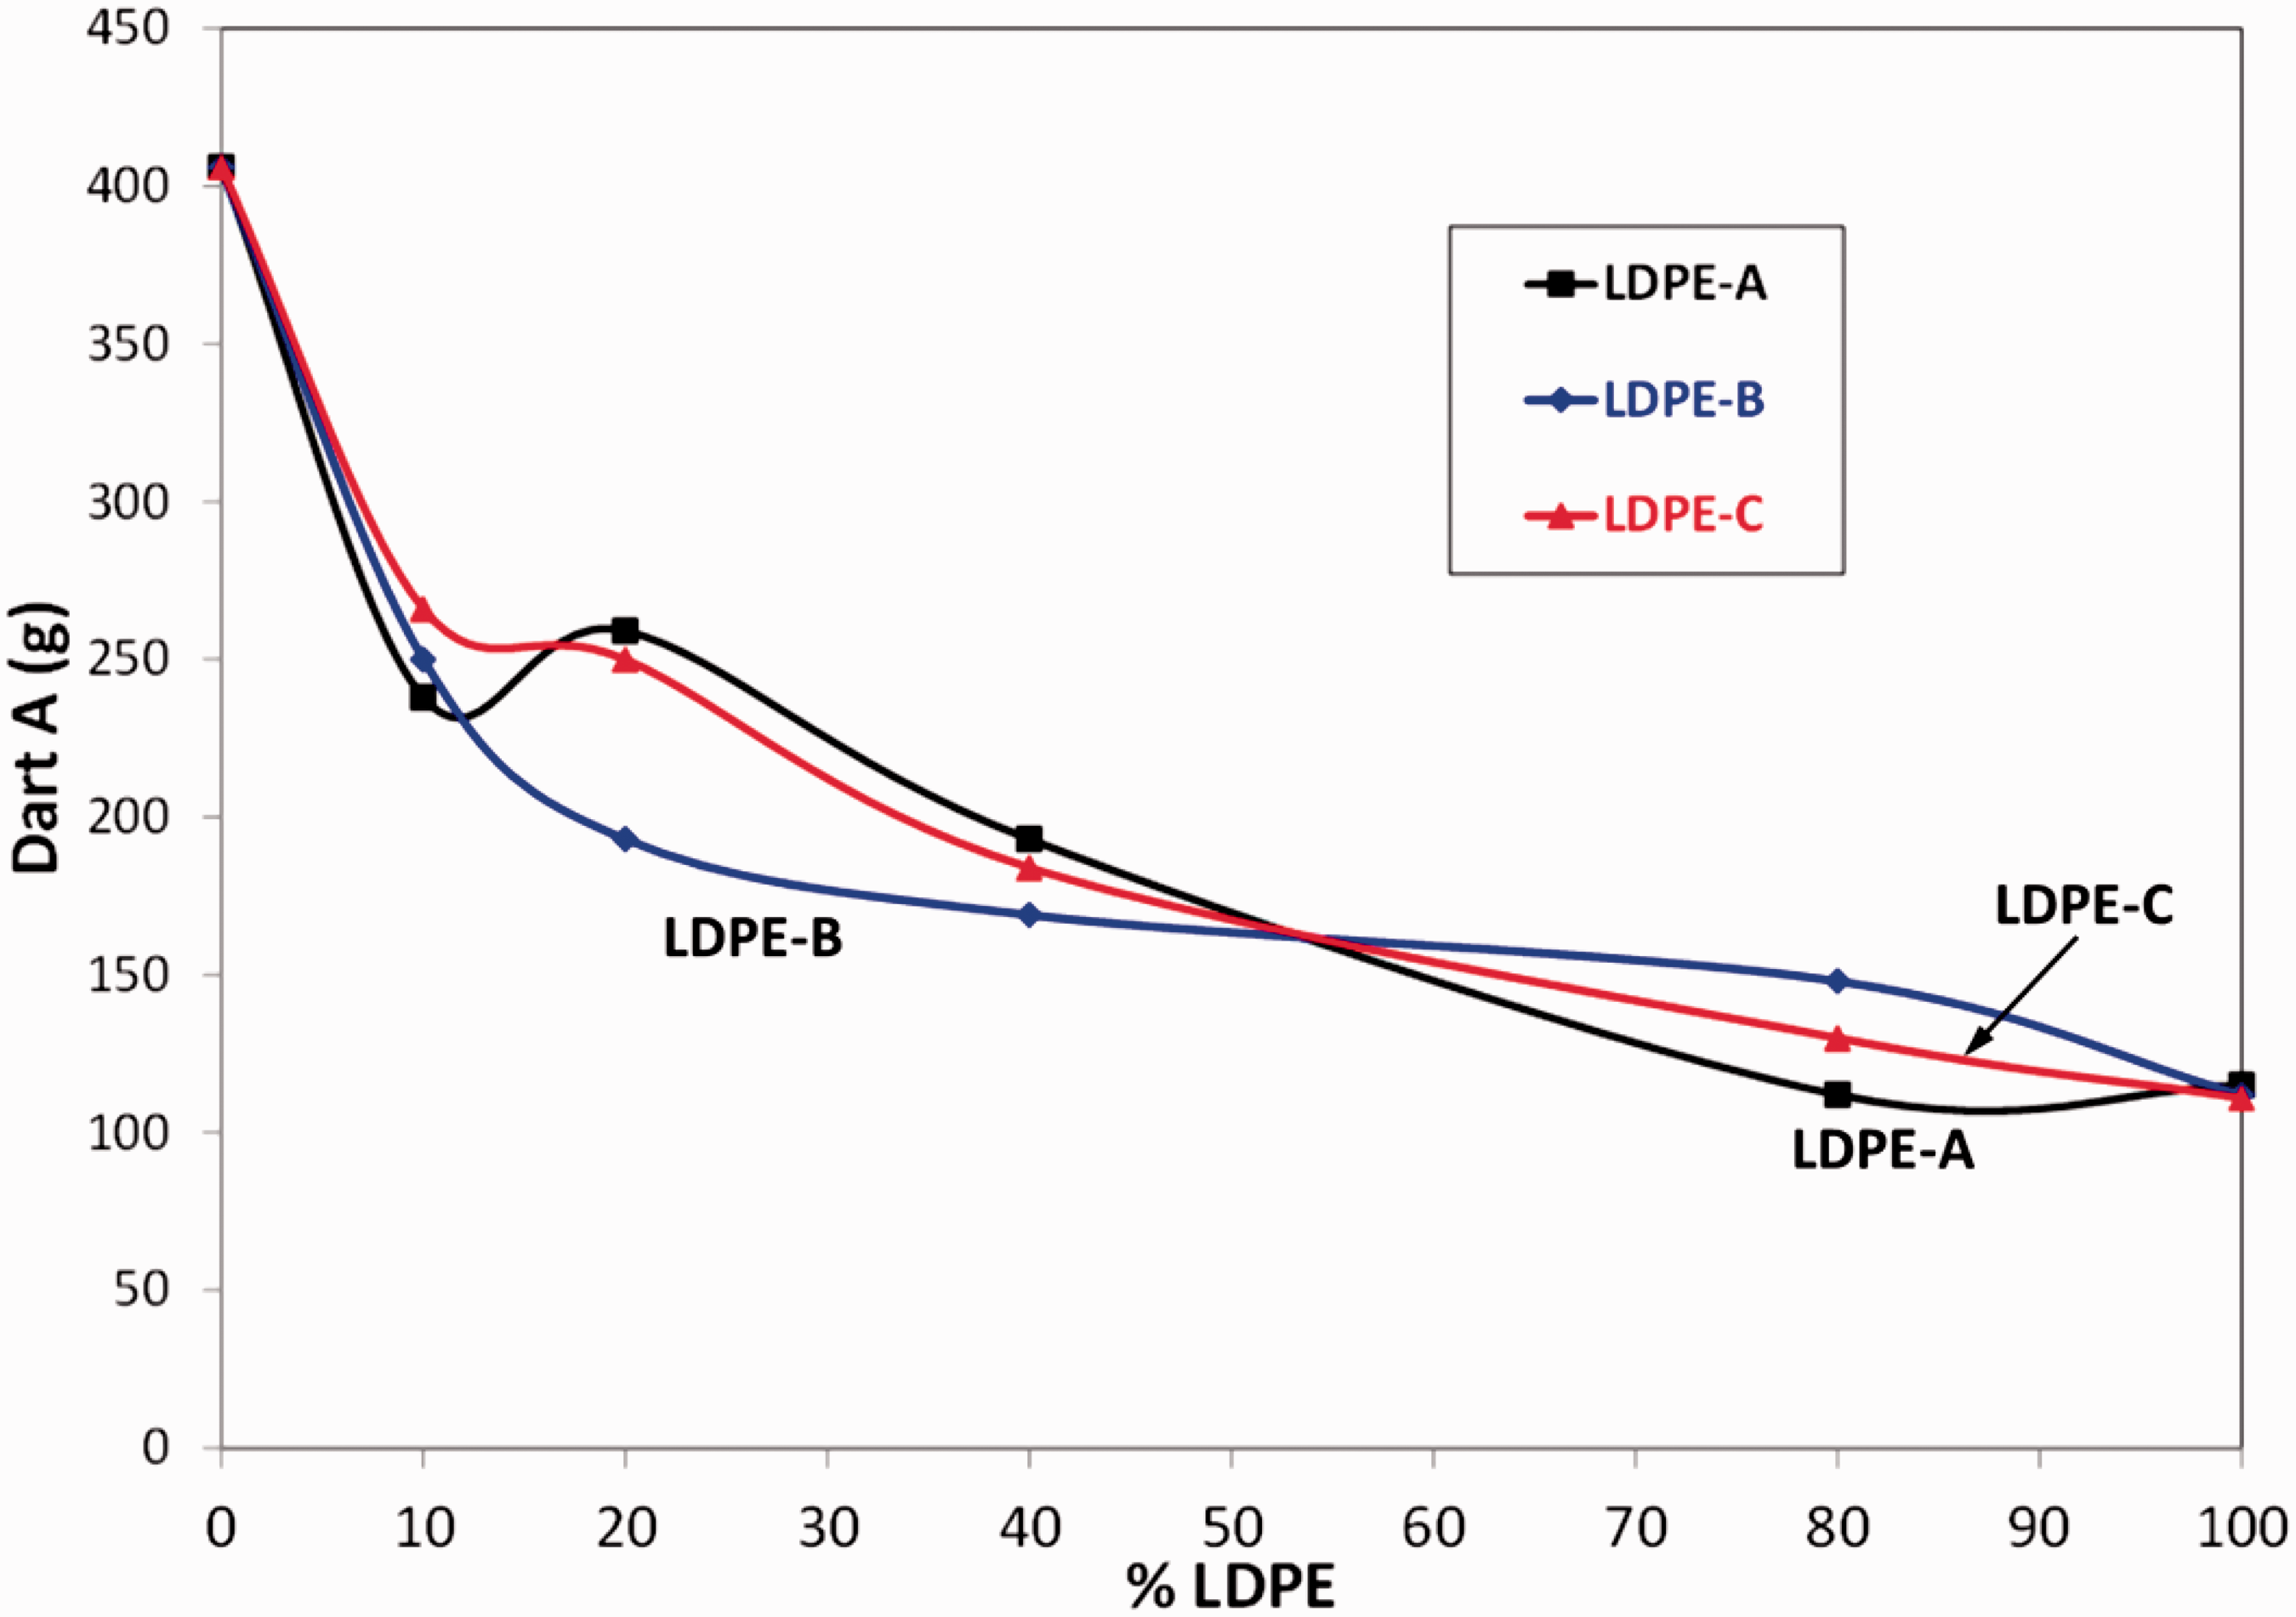
Dart impact strength versus %LDPE for LDPE/LLDPE films. LDPE: low density polyethylene.
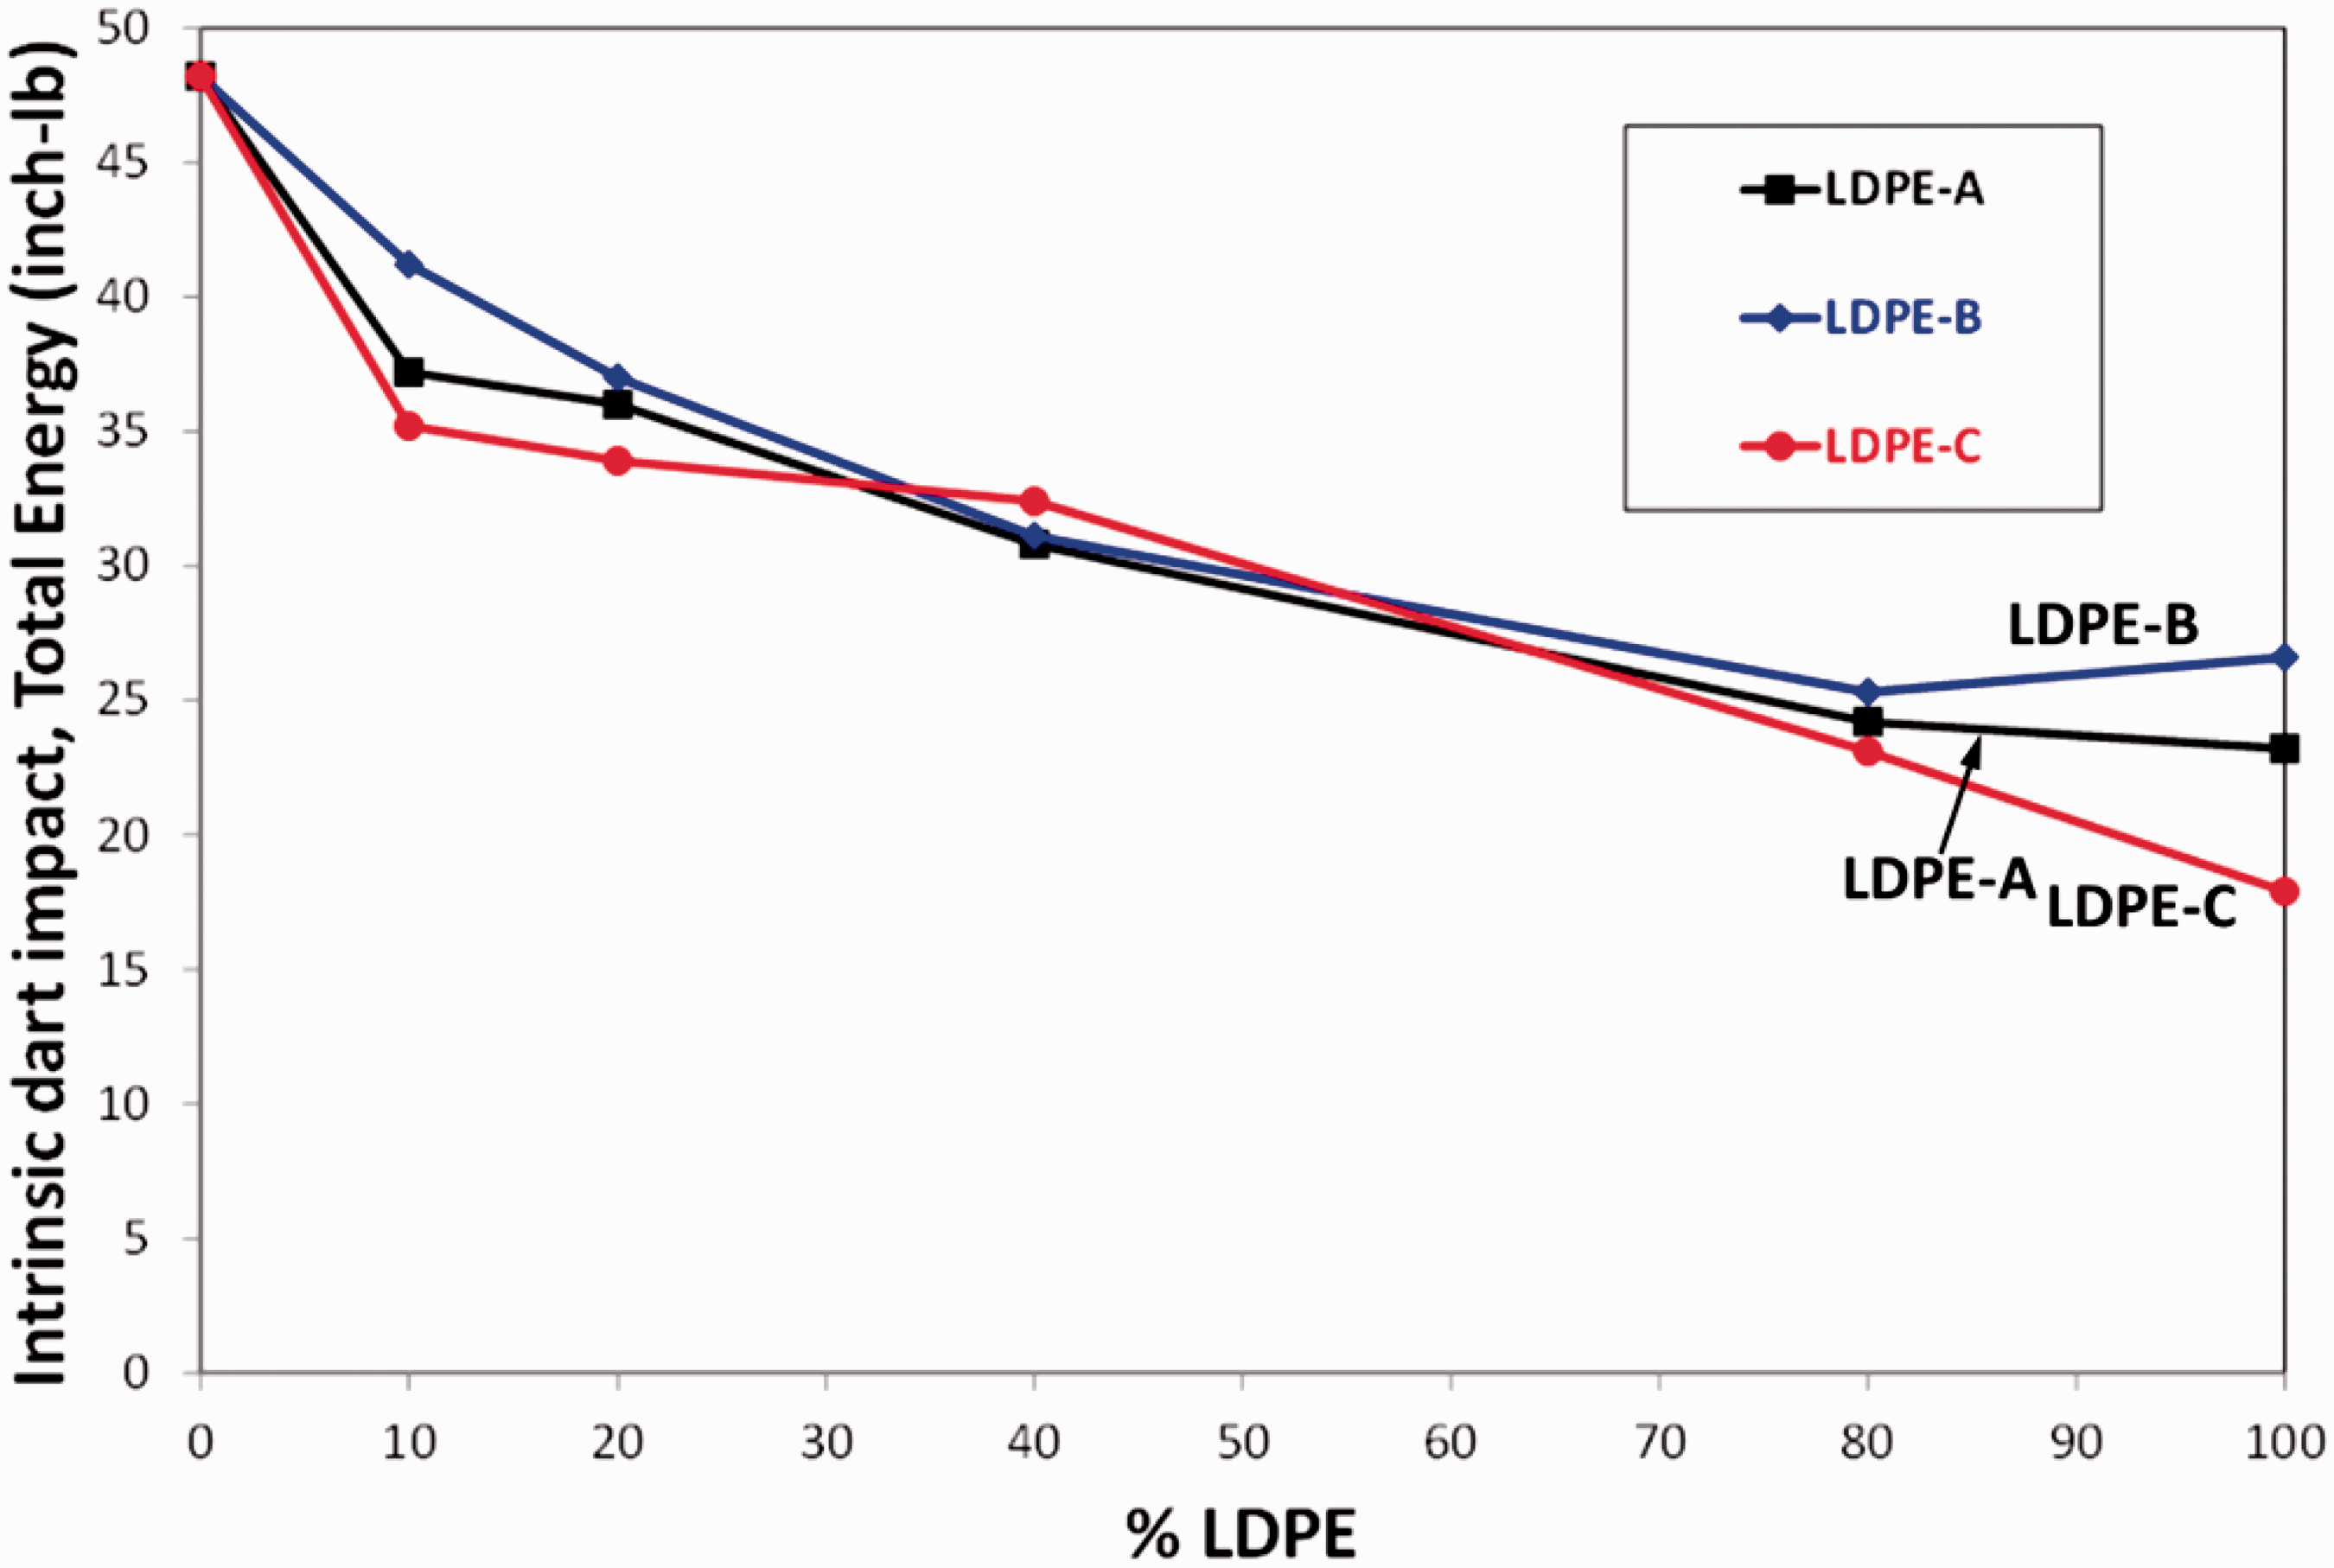
Intrinsic dart impact strength of 20 mil compression molded plaques versus %LDPE for LDPE/LLDPE blends. LDPE: low density polyethylene.
Puncture strength
Figure 17 plots the puncture strength versus %LDPE in LLDPE. We observed that blending LDPE to LLDPE-1 resulted in a significant reduction in puncture strength. The decrease in puncture strength of the blends is almost linear with %LDPE. The initial increase in puncture energy at 10% LDPE is believed to be due to higher film gloss versus 100% LLDPE film. This results in increased frictional energy (between probe and film) and contributes to the measured puncture energy. The overall decrease in the puncture strength with increasing %LDPE is also believed to be due to both an MD orientation increase (more unbalanced MD/CD orientation) and a decrease in the intrinsic toughness (decrease in the tie chain concentration) as the %LDPE increased.
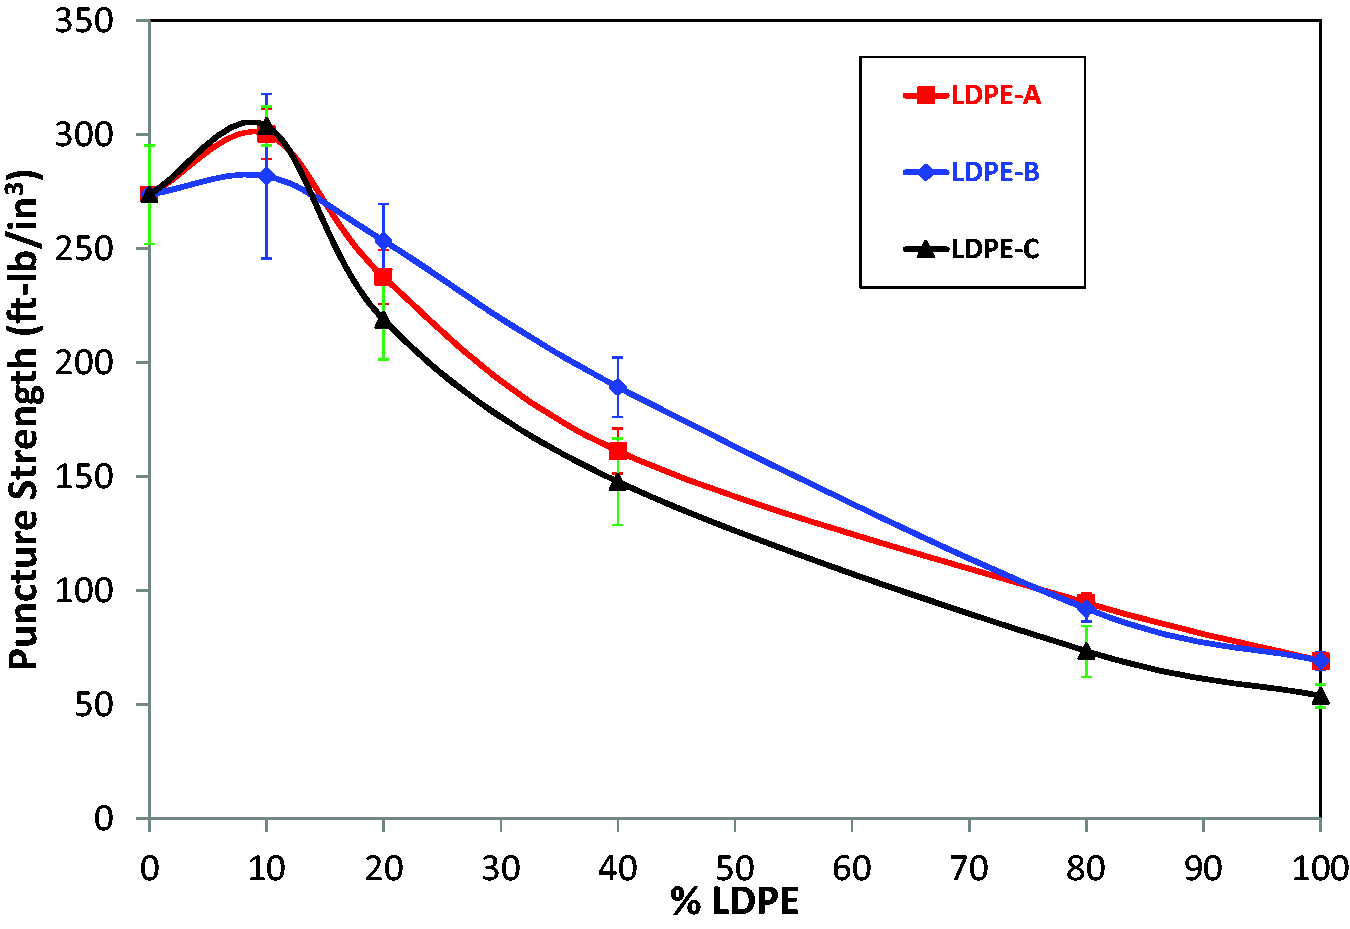
Puncture strength versus %LDPE for LDPE/LLDPE blends (2 mil blown film). LDPE: low density polyethylene.
Conclusions
This study demonstrated that LDPE/LLDPE blend melt strength was significantly higher than the linear rule of mixtures (melt strength synergy) at all blend ratios as observed in the literature. For all three LDPE/LLDPE blends, the 100% LDPE melt strength was lower than the 80% LDPE. The MD tear strengths went through a minimum as the %LDPE increased. A MD tear strength minimum was observed at between 40 and 80% LDPE for all three LDPE resins studied. This observation was related to the MD orientation effects in a blown film and is independent of which LDPE used. LDPE/LLDPE MD tear strength was almost a mirror image of the melt strength curve. In contrast, the CD tear strengths went through a maximum at about 20% LDPE and then showed a continuous decrease with increasing %LDPE. This trend in CD tear strength was the same for all three LDPEs. The LDPE/LLDPE intrinsic tear strength showed a continuous decrease with increasing %LDPE for all three LDPE resins, due to decrease in tie chain concentration. The blend MD tear decreased significantly up to 40% LDPE, a much sharper decrease compared to decrease in intrinsic tear suggesting orientation effects dominating the MD tear behavior (versus intrinsic effect) of the blown films up to 40% LDPE. Dart impact strength and puncture strength of blown films of LDPE/LLDPE blends showed a mostly continuous decrease with increasing %LDPE for all three LDPE resins studied. Intrinsic dart impact strength also decreased with increasing %LDPE, due to decrease in tie chain concentration. The decrease in the film’s dart impact and puncture strength is due to both an increase in the MD orientation (more unbalanced MD/CD orientation) and a decrease in the intrinsic toughness (decrease in the tie chain concentration) as the %LDPE increased.
Footnotes
Acknowledgements
We are thankful to The Dow Chemical Company for the support of this research.
Declaration of Conflicting Interests
The author(s) declared no potential conflicts of interest with respect to the research, authorship, and/or publication of this article.
Funding
The author(s) received no financial support for the research, authorship, and/or publication of this article.