
Abstract
Objective:
The aim of this study was to compare the thickness of the supraspinatus tendon (SST) in participants with type 2 diabetes mellitus (DM) with normal healthy individuals.
Materials and Methods:
There were 80 participants enrolled in the study, with type 2 DM and 80 participants served as a control group. The supraspinatus tendon thickness (SSTT) was assessed using gray-scale ultrasonography.
Results:
The mean SSTT was significantly higher in the DM group than the control group, on the dominant and non-dominant shoulders (6.82 ± 1.23 vs 4.78 ± 0.64 mm; t test = 13.64, p < .001 and 6.86 ± 1.33 vs 4.69 ± 0.49 mm; t test = 14.10, p < .001). Dominant and non-dominant shoulder SSTT in the DM participants significantly correlated with age (r = −0.229 and r = −0.301, p < .05) and glycated hemoglobin (HbA1c; r = 0.753 and r = 0.468, p < .05). HbA1c significantly correlated with SSTT on both shoulders in the control group (r = 0.256 and r = 0.297, p < .05).
Conclusion:
In this cohort, the SSTT was significantly greater for those with DM than those non-diabetic individuals, and in the DM group, it was significantly associated with young age and increase in HbA1c. Sonographic evaluation of SSTT may be a useful diagnostic tool to determine tendinopathy in DM patients, in the absence of shoulder pain.
Diabetes mellitus (DM) is generally categorized into type 1 DM, type 2 DM, and gestational DM, based on etiology and clinical presentation. 1 Diabetes is regarded globally as a major source of morbidity and mortality. 2 According to the International Diabetes Federation (IDF), about 425 million persons are afflicted with diabetes worldwide, with approximately 50% of these undiagnosed.1,3 Musculoskeletal disease is a common complication in patients with diabetes, and shoulder pain is a recurring complaint.4,5 There is a higher prevalence (27.5%) of shoulder disorders in patients with diabetes than the rate (5.0%) in the general population. 1
Two of the most frequent shoulder disorders are frozen shoulder, also known as adhesive capsulitis, and rotator cuff disease. 4 The rotator cuff comprised the supraspinatus, infraspinatus, teres minor, and subscapularis muscles and tendons. 6 Rotator cuff disorders can result from simple inflammations to complete tendon tears and frequently involve the supraspinatus tendon (SST).4,7,8
Supraspinatus tendinopathy refers to the increase in tendon thickness, which occurs as a form of inflammatory response to deleterious stimuli.7,9 The risk factors of supraspinatus tendinopathy include male gender, advancing age, diabetes, abnormal shoulder structure, active sports participation that involve the use of the shoulder and occupations that require excessive overhead activities using the dominant shoulder or both shoulders. Diabetes, regardless of therapeutic compliance, exacerbates the damaging effects of other risk factors making the occurrence of supraspinatus tendinopathy, and subsequently, rotator cuff pathology, a worrisome complication of the condition, due to its potential to bring about physical, psychological and financial burden.4,8,10
Magnetic resonance imaging (MRI) is generally the preferred radiologic technique used in detecting pathological changes in the tendons of asymptomatic shoulders, of patients with diabetes.11,12 However, sonography is readily available globally, non-invasive, more comfortable, faster, provides real-time imaging, and least costly than MRI.10,12–15 Moreover, the assessment of the SST for tendinopathy using sonography has a higher sensitivity but similar specificity compared with MRI. 16
The supraspinatus muscle and SST play an indispensable role in some of the functions performed by the shoulder.17,18 Thus, in those with diabetes, it is essential to detect an increase in SSTT early, so that appropriate treatment to prevent serious complications can commence.19,20 Therefore, the aim of this study was to compare the thickness of the SST in type 2 DM with normal healthy individuals. The specific objectives were: (1) compare the SSTT on the dominant and non-dominant shoulders of the DM cohort, with that of the control group; (2) compare the SSTT on the dominant and non-dominant shoulders, within the DM cohort and the control group; (3) compare the SSTT on the dominant and non-dominant shoulders, between the males and females of the DM cohort and the control group; and (4) determine the factors associated with SSTT in the DM cohort and the control group. The hypothesis posed was that the SST was thicker, on the dominant shoulder, for those with increased age, male gender, and suffering with DM.
Materials and Methods
This was a prospective cross-sectional case-control study. It was conducted over a 6-month period in the radiology department of a tertiary hospital from March to August 2024. Ethical approval for this study was obtained from the relevant Institutional Review Board (UCTH/HREC/33/VOL.III/198). The DM participants for this study were patients presenting in the diabetic clinic of the hospital, as well as being managed for early and late onset DM. The control group consisted of adult participants with no known history of diabetes, whose fasting blood sugar levels were less than 5.6 mmol/L, and glycated hemoglobin (HbA1c) less than 6.5%.
The exclusion criteria for the study included: Past history of trauma to the shoulder, history of shoulder or neck pain, presence of shoulder pathology (e.g., myasthenia gravis, rhabdomyoma, brachial plexus injuries, previous rotator cuff injuries, and being managed for shoulder pain), medical history of stroke (cerebrovascular accident), autoimmune diseases (e.g., rheumatoid arthritis, scleroderma, systemic lupus erythematosus, etc.), pulmonary tuberculosis, human immunodeficiency virus (HIV), wheel-chair and crutches users, history of active sport participation that mainly involve the use of the upper limbs and pregnant women. 8
Sample Size Estimation
The number of participants needed to power this study was completed using Cochrane’s statistical formula, to estimate the required sample size 20 :

where n is the sample size, z is the Z-score set at 1.96 which corresponds to 95% confidence level, and p is the prevalence of rotator cuff pathology in diabetics in a previous study (p = 5.00%). 21
q = 1–p, therefore, q = 1–0.05 = 0.95. d is the margin of error expected which was set at 0.05 to achieve the desired degree of precision.
Therefore, n = [1.962 × 0.05 × 0.95/0.052]
n = 72.99
The sample size calculated was approximated to recruit 80 participants. As a result, 80 DM patients and 80 controls were recruited. Convenience sampling technique was employed to recruit the subjects with DM attending the diabetic clinic, while purposive sampling technique was utilized to select the controls. The participants in both groups were individuals who voluntarily agreed to participate and met the inclusion criteria for the study. After the study was explained and the informed consent forms signed, questionnaires were subsequently provided to all the participants. A detailed history of patients’ demographics, medical history to rule out co-morbidities, and physical examination of the shoulders, which included inspection for symmetry, deformity, and swelling, were completed.
Sonographic Protocol
All sonograms were performed using a Xario100S ultrasound equipment system (Canon Medical Systems, Otawara, Japan) and a high frequency (7-11 MHz) linear transducer. Chaperones were present during examination of all female patients. For the females, a hospital gown was given to cover both breasts, after which the shoulders were then adequately exposed for the sonogram. The SSTs of the DM participants and controls were evaluated on the right and left shoulders.
The Crass and the modified Crass method are the standard sonographic positions commonly utilized in professional settings and for research purposes. This contrasts with the neutral position and partial internal rotation positioning (i.e., Shrug position), which are rarely used.22,23 The Crass position is uncomfortable because it causes excessive pain and stiffness in the joints of elderly and young patients. This further discourages the patients from continuing with the sonographic examination. 24 Therefore, to ensure participation, the modified Crass position was used for the study.
The detailed protocol for examining the SST in the longitudinal axis (i.e., modified Crass method):
Position. The patient was instructed to place his/her palms on the ipsilateral hip region. This was meant to achieve a certain degree of external shoulder rotation. The elbow was positioned to point posteriorly.
Transducer. The footprint of transducer was placed on the anterior shoulder. The transducer orientation was placed in an oblique position (oblique longitudinal) toward the patient’s ear (See Figure 1).
The key areas that were visualized and examined for pathologies included: the articular surface, intra-substance, and bursal surface of the SST, as well as the greater tuberosity. 21
The detailed protocol for examining the SST in the short-axis view (i.e., modified Crass method) (Figure 2):
Position. The patient’s palm was placed at the ipsilateral hip and the elbow pointed posteriorly.
Transducer. The footprint of the transducer was placed on the anterior shoulder. The transducer orientation was moved from an oblique longitudinal axis to a transverse plane by rotating the transducer by approximately 90 degrees.
The key area was the tendon of the long head of biceps being identified, as the landmark for determining SSTT. 21
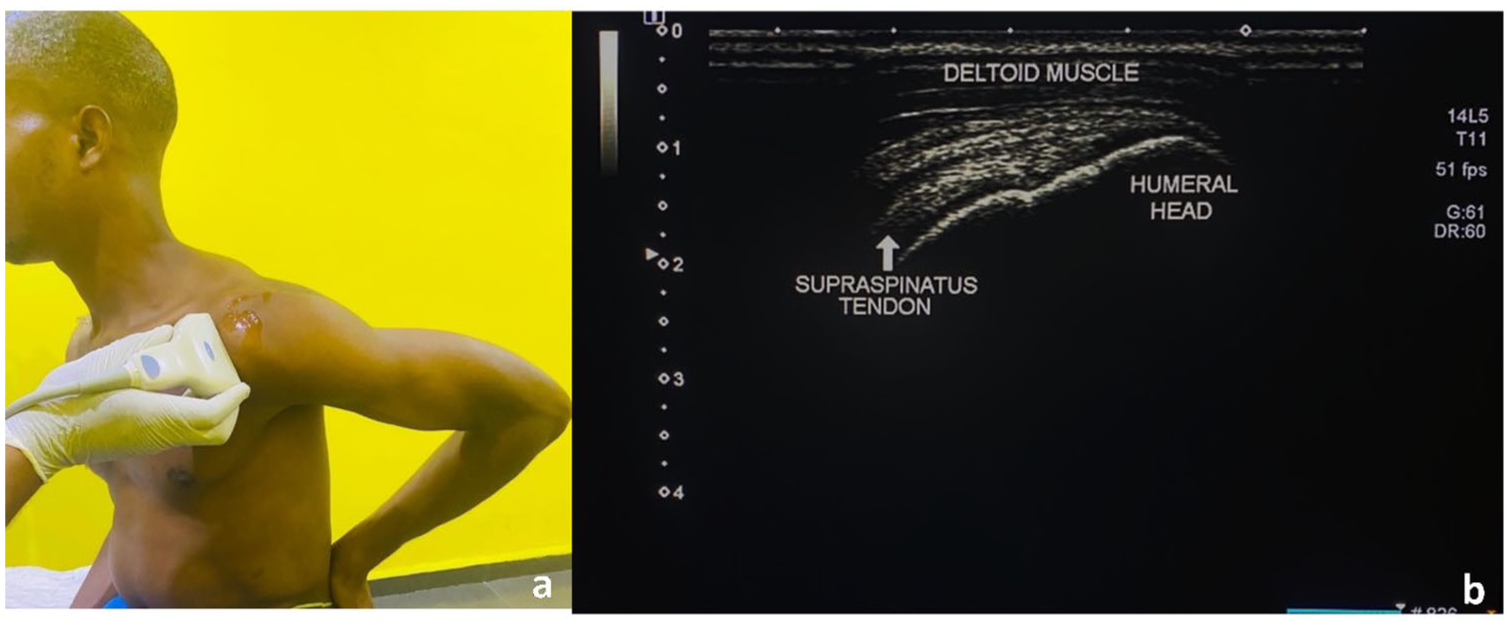
An example of how the modified Crass method was achieved and created a sonogram of the supraspinatus tendon, in longitudinal axis.
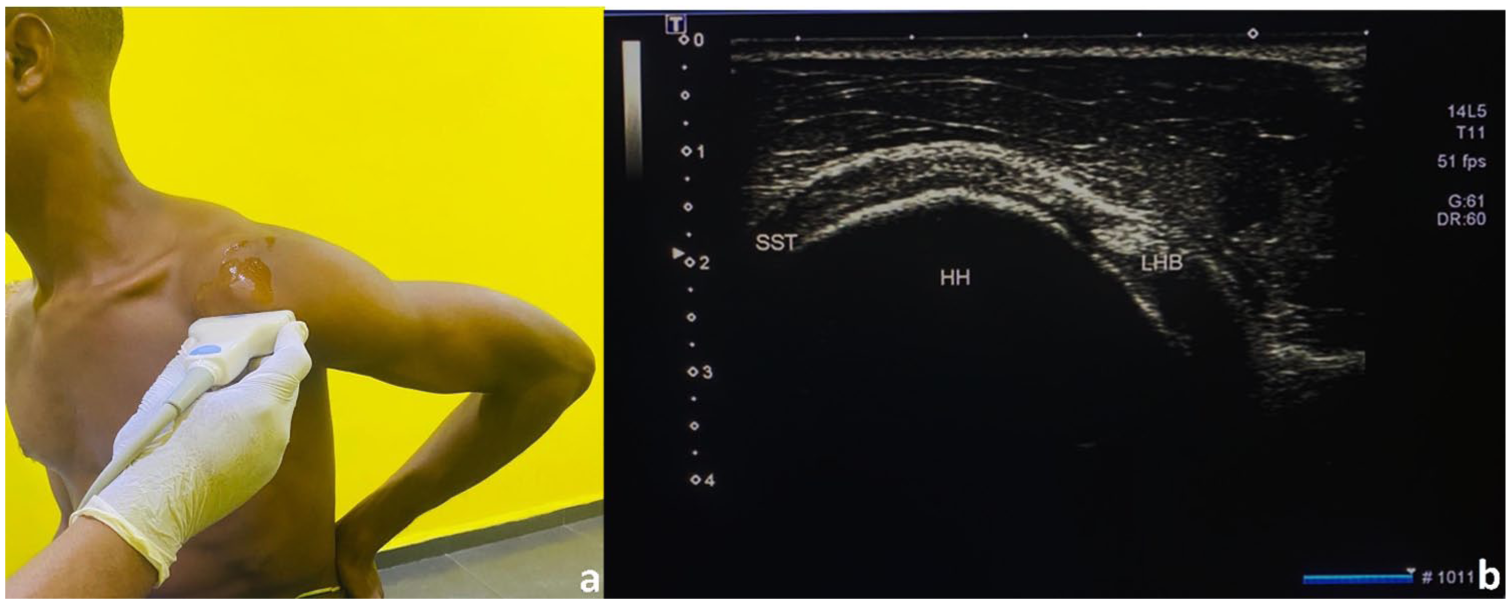
An example of how the modified Crass method was achieved and created a sonogram of the supraspinatus tendon, in short axis. HH, humeral head; LHB, long head of biceps; SST, supraspinatus tendon.
Standard Measurement of SST
The standard measurements are conducted in the short-axis plane: At a point, exactly 10 mm from the edge of the tendon of the long head of biceps, a cursor was placed at the inferior echogenic border of the SST and extended vertically upwards to the superior echogenic border (See Figure 3), and the distance between the two cursors was measured as the SSTT (in mm). 21 Three measurements of the SSTT were taken and the average recorded. The total length of the sonogram for each participant was approximately 20 minutes. The examination of the SST, across all the participants, was conducted by the second author possessed 15-year experience, in musculoskeletal sonography. To prevent bias, the second author was blinded to the group assignment of the participants.
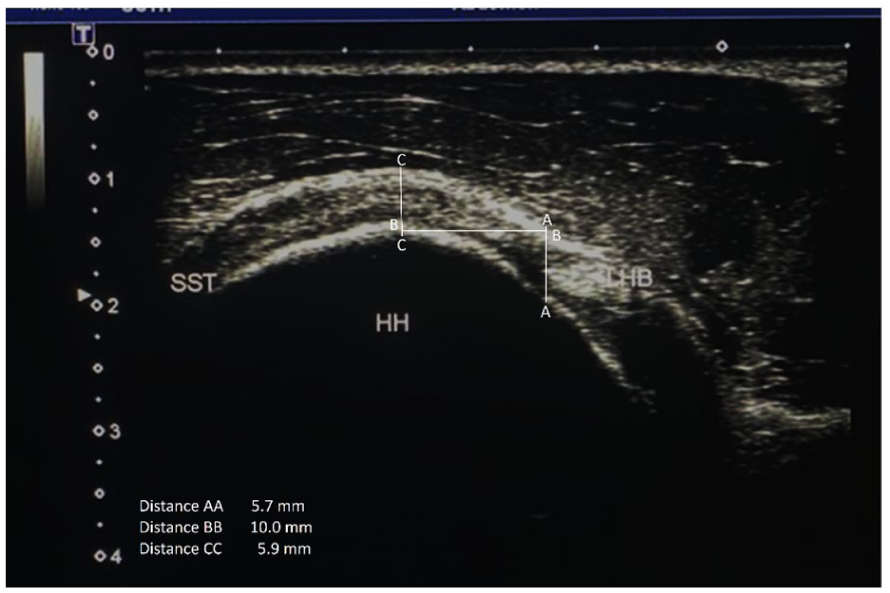
A sample image is provided that shows the vertical line (line AA) drawn adjacent the lateral margin of the long head of biceps tendon, using the ultrasound equipment calipers. A horizontal line (line BB) of length 10 mm is drawn from line AA, at exactly 90 degrees to each other. A vertical line (line CC) is drawn at 90 degrees to the end of line BB. The distance between the upper and lower ends of line CC, which represents the superior and inferior echogenic borders of the supraspinatus tendon, measured in mm, is the thickness of the supraspinatus tendon. HH, humeral head; LHB, long head of biceps; SST, supraspinatus tendon.
Statistical Analysis
The IBM Statistical Package of Social Sciences (SPSS) for windows (IBM Corp., Chicago, IL, USA v 23.0) was used for the analysis of data collected from the participants. Continuous variables (age, body mass index [BMI], HbA1c, SSTT, and duration of DM) were reported as a mean and standard deviation (mean ± SD), whereas categorical variables (gender, marital status, educational status, and employment status) were reported as frequencies and percentages. Correlation was conducted on the variables using Pearson’s correlation analysis. The correlation coefficients were stratified as follows; low strength of correlation (r = 0.10–0.39), moderate strength of correlation (r = 0.40–0.69), high strength of correlation (r = 0.70–0.89) and very high strength of correlation (r = 0.90–1.00). 25 Student’s t test and analysis of variance (ANOVA) were employed to analyze the variables where applicable. Statistical significance was set at p < .05.
Results
The age range of the participants, with DM, was from 25 to 65 years, while that of the control was from 25 to 62 years. The mean SSTT was significantly higher on the dominant shoulder and non-dominant shoulder of the DM participants (6.82 ±1.23 vs 4.78 ± 0.64 mm, t test = 13.64, p < .001; 6.86 ± 1.33 vs 4.69 ±0.49 mm, t test = 14.10, p < .001, respectively) (See Table 1).
The Comparison of the Measured Mean Values, Based on the Variables, Between the Two Participant Groups.
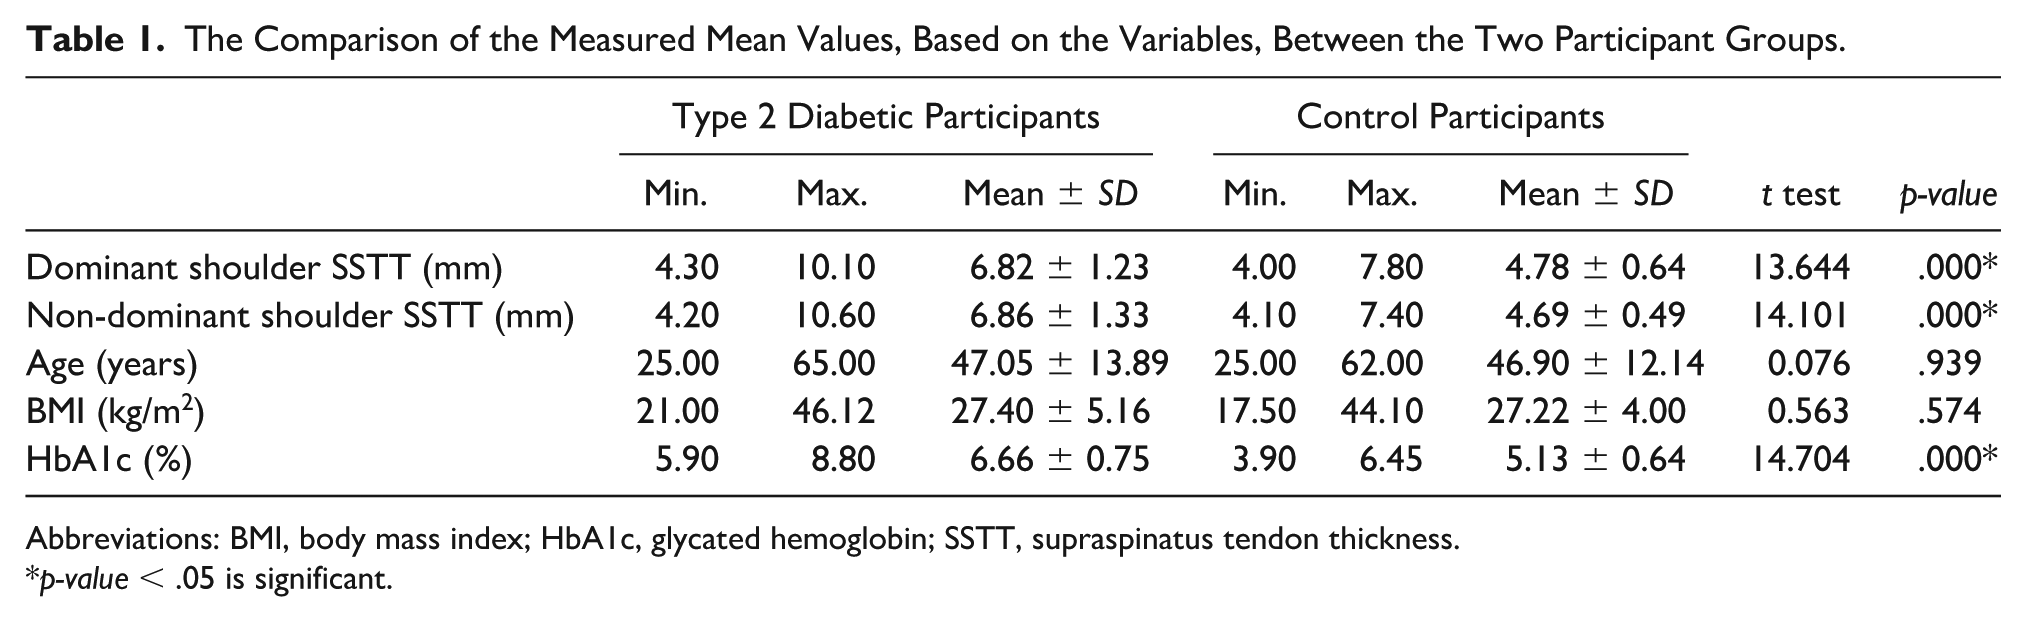
Abbreviations: BMI, body mass index; HbA1c, glycated hemoglobin; SSTT, supraspinatus tendon thickness.
p-value < .05 is significant.
Dominant and Non-Dominant Shoulder SSTT Within DM Cohort and Control Group
There was no significant difference in the mean SSTT of the dominant and non-dominant shoulders of the diabetic participants (t test = −0.14, p > .05) and similarly none was noticed in the control (t test = 1.05, p > .05; See Table 2).
The Mean Supraspinatus Tendon Thickness Evaluation in Dominant and Non-Dominant Shoulders of the Two Participant Groups.
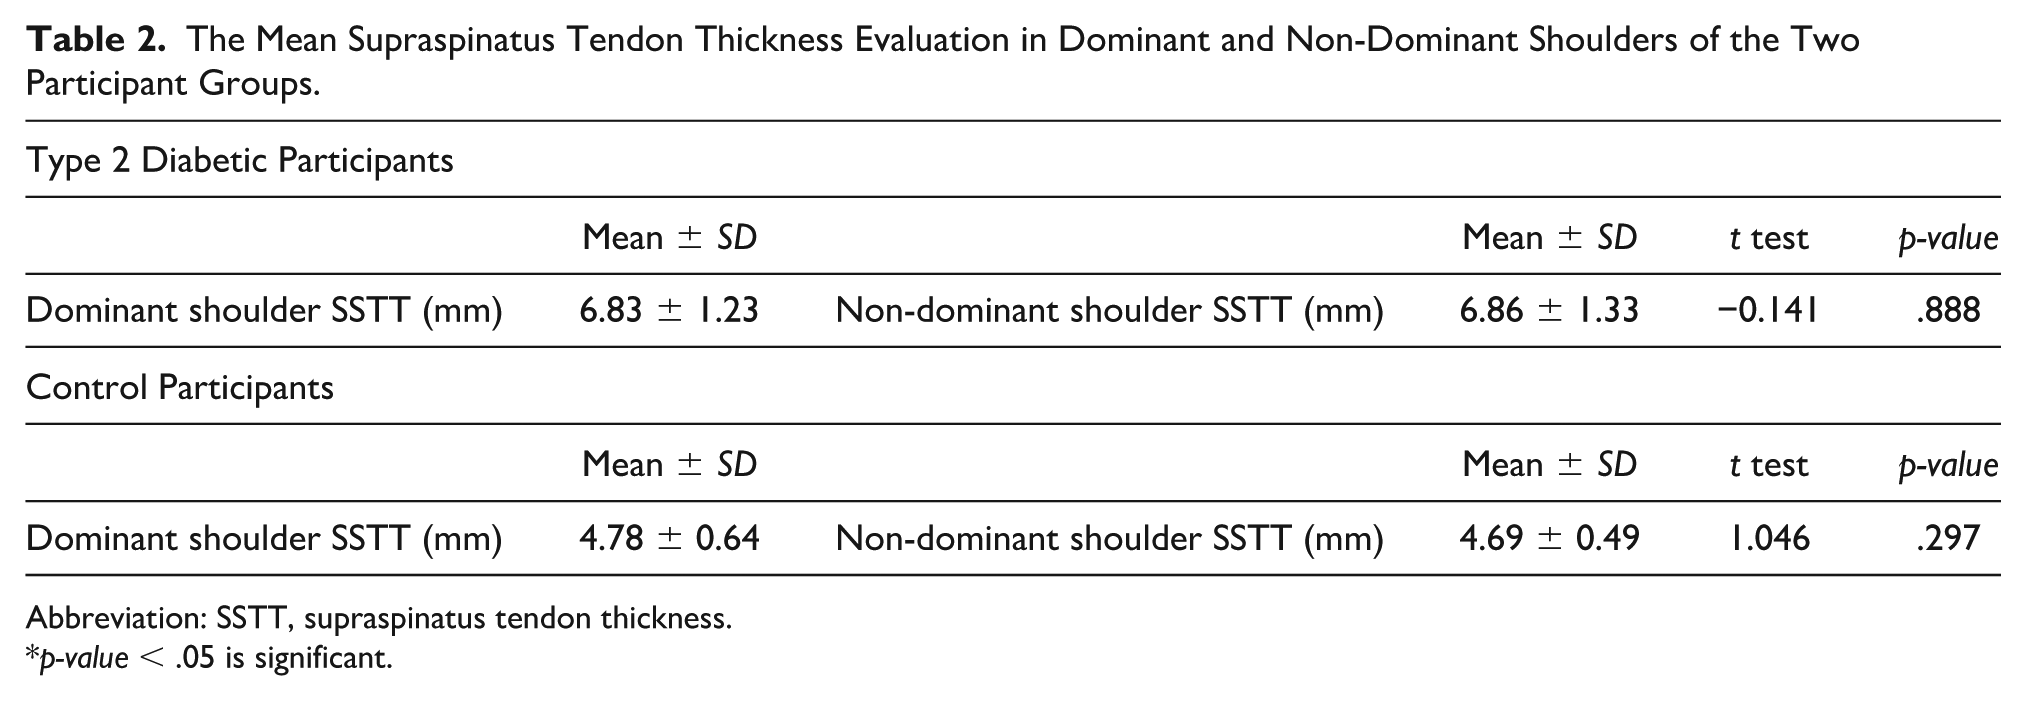
Abbreviation: SSTT, supraspinatus tendon thickness.
p-value < .05 is significant.
Comparison of Dominant Shoulder SSTT and Non-Dominant Shoulder SSTT Between the Males and Females Within DM Cohort and Control Group
The mean SSTT on the dominant shoulder was shown to be insignificantly higher in female participants with DM (6.85 ± 1.24 vs 6.78 ± 1.22 mm, t test = −0.208, p > .05) while it was insignificantly higher in male DM participants (6.97 ± 1.25 vs 6.82 ± 1.37 mm, t test = 0.457, p > .05), on the non-dominant shoulder. The maximum SSTT on the dominant shoulder was seen in males (10.10 mm), while on the non-dominant shoulder, it was seen in females (10.60 mm). Mean age of the DM participants, their BMI, and HbA1c levels were all insignificantly different between the males and females (t test = −1.750, p > .05; t test = −1.194, p > .05; t test = 0.427, p > .05, respectively; See Table 3).
The Descriptive Characteristics, Based on Gender, of the Type 2 Diabetic Participants.
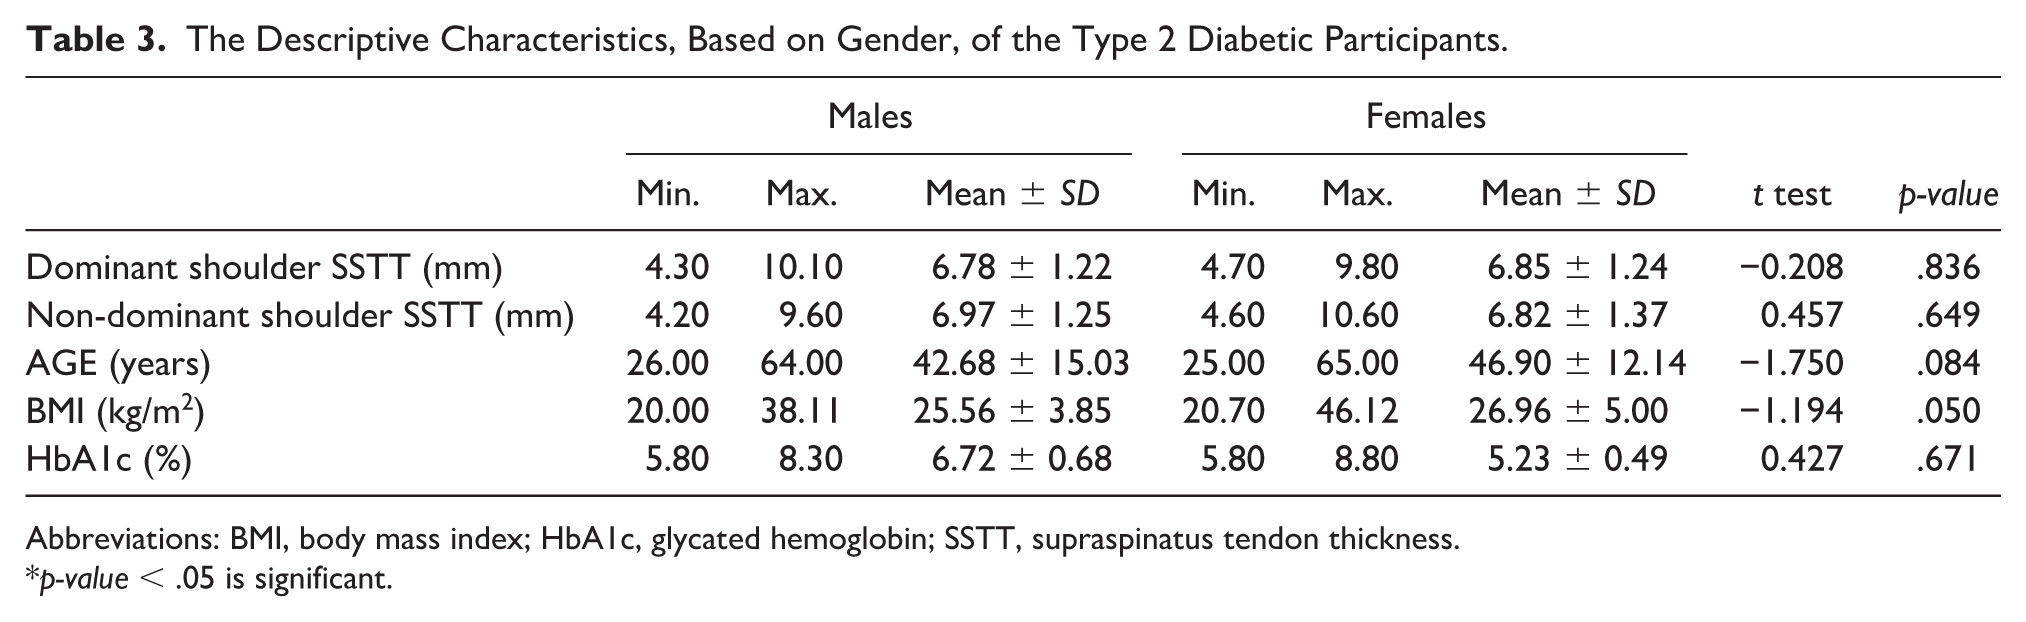
Abbreviations: BMI, body mass index; HbA1c, glycated hemoglobin; SSTT, supraspinatus tendon thickness.
p-value < .05 is significant.
Among the control subjects, the maximum SSTT, on both the dominant and non-dominant shoulders, were noticed in females (9.80 and 7.40 mm, respectively). While the mean age was significantly higher in males (t test = 2.713, p < .05), the mean BMI was significantly higher in females (t test = −4.830, p < .001). Mean SSTT on the dominant shoulder was insignificantly higher in females (6.85 ± 1.24 vs 4.91 ± 0.82 mm, t test = 1.396, p > .05), while on the non-dominant shoulder, it was noted to be insignificantly higher in males (4.75 ± 0.50 vs 4.66 ± 0.48 mm, t test = 0.854, p > .05; See Table 4).
The Descriptive Characteristics, Based on Gender, of the Control Participants.
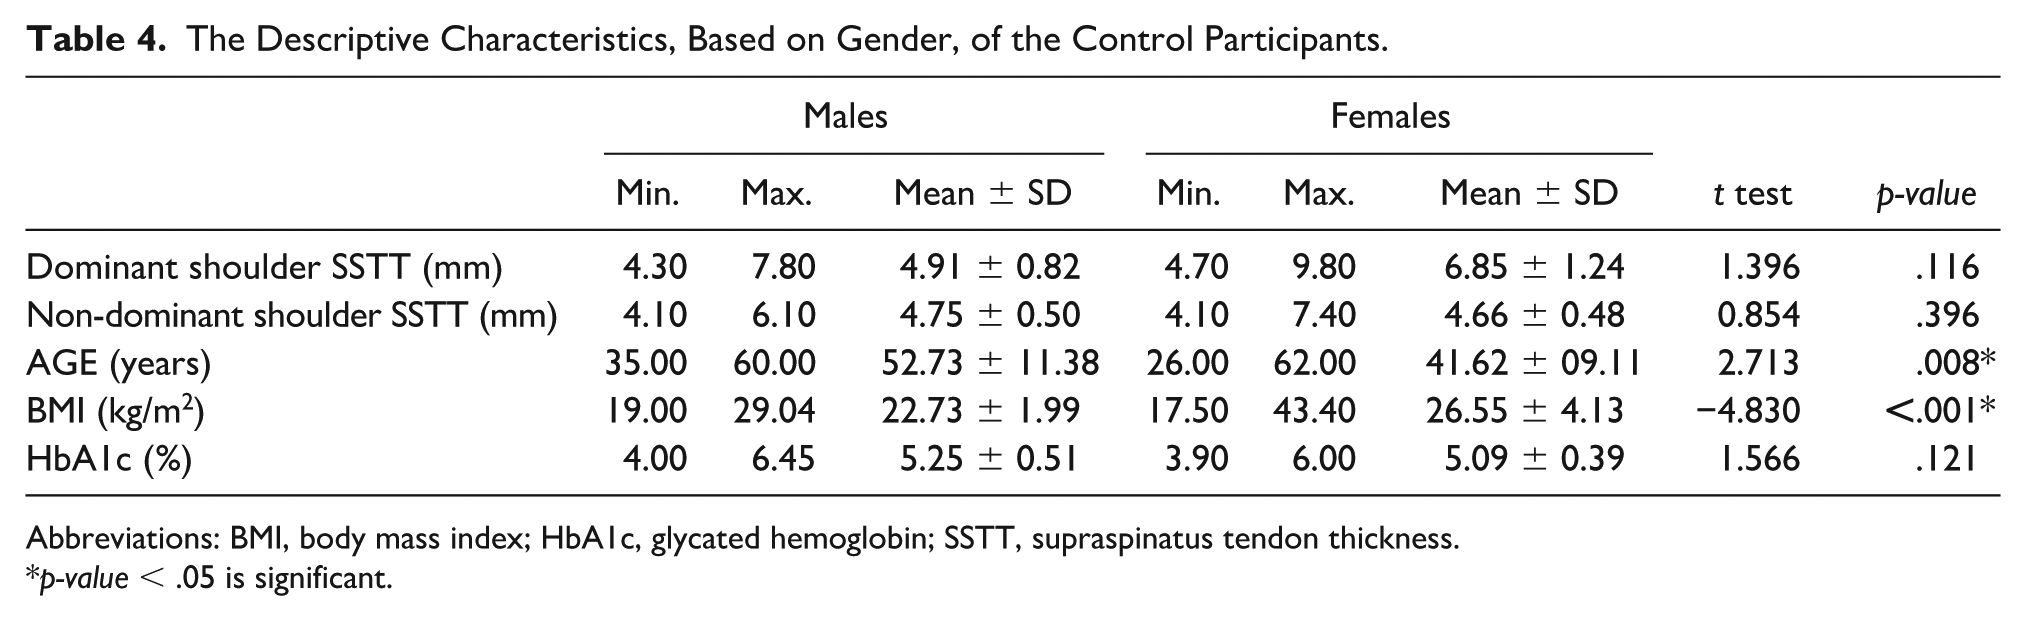
Abbreviations: BMI, body mass index; HbA1c, glycated hemoglobin; SSTT, supraspinatus tendon thickness.
p-value < .05 is significant.
Factors Associated With SSTT Within DM Cohort and Control Group
In the dominant and non-dominant shoulders of the participants with DM, the circulating levels of HbA1c was shown to significantly correlate with SST (p < .001) in a positive fashion, but while the correlation observed was of a high strength (r = 0.753) in the dominant shoulder, the strength was moderate (r = 0.468) in the non-dominant shoulder. HbA1c also showed a significant positive correlation of low strength with SSTT of both the dominant (r = 0.256, p < .05) and non-dominant (r = 0.297, p = .05) shoulders of the control group. Age was shown to have a significant correlation with SSTT on the dominant shoulder (r = −0.229, p < .05) and on the non-dominant shoulder (r = −0.301, p < .05) of the participants with DM, and in both instances, the strength was low and in a negative direction. However, an insignificant relationship was exhibited between age and SSTT on the dominant and non-dominant shoulders of the control participants (See Table 5).
Correlation of the Study Variables Compared With Dominant and Non-Dominant Shoulder Supraspinatus Thickness, Based on the Type 2 Diabetic and Control Participants.
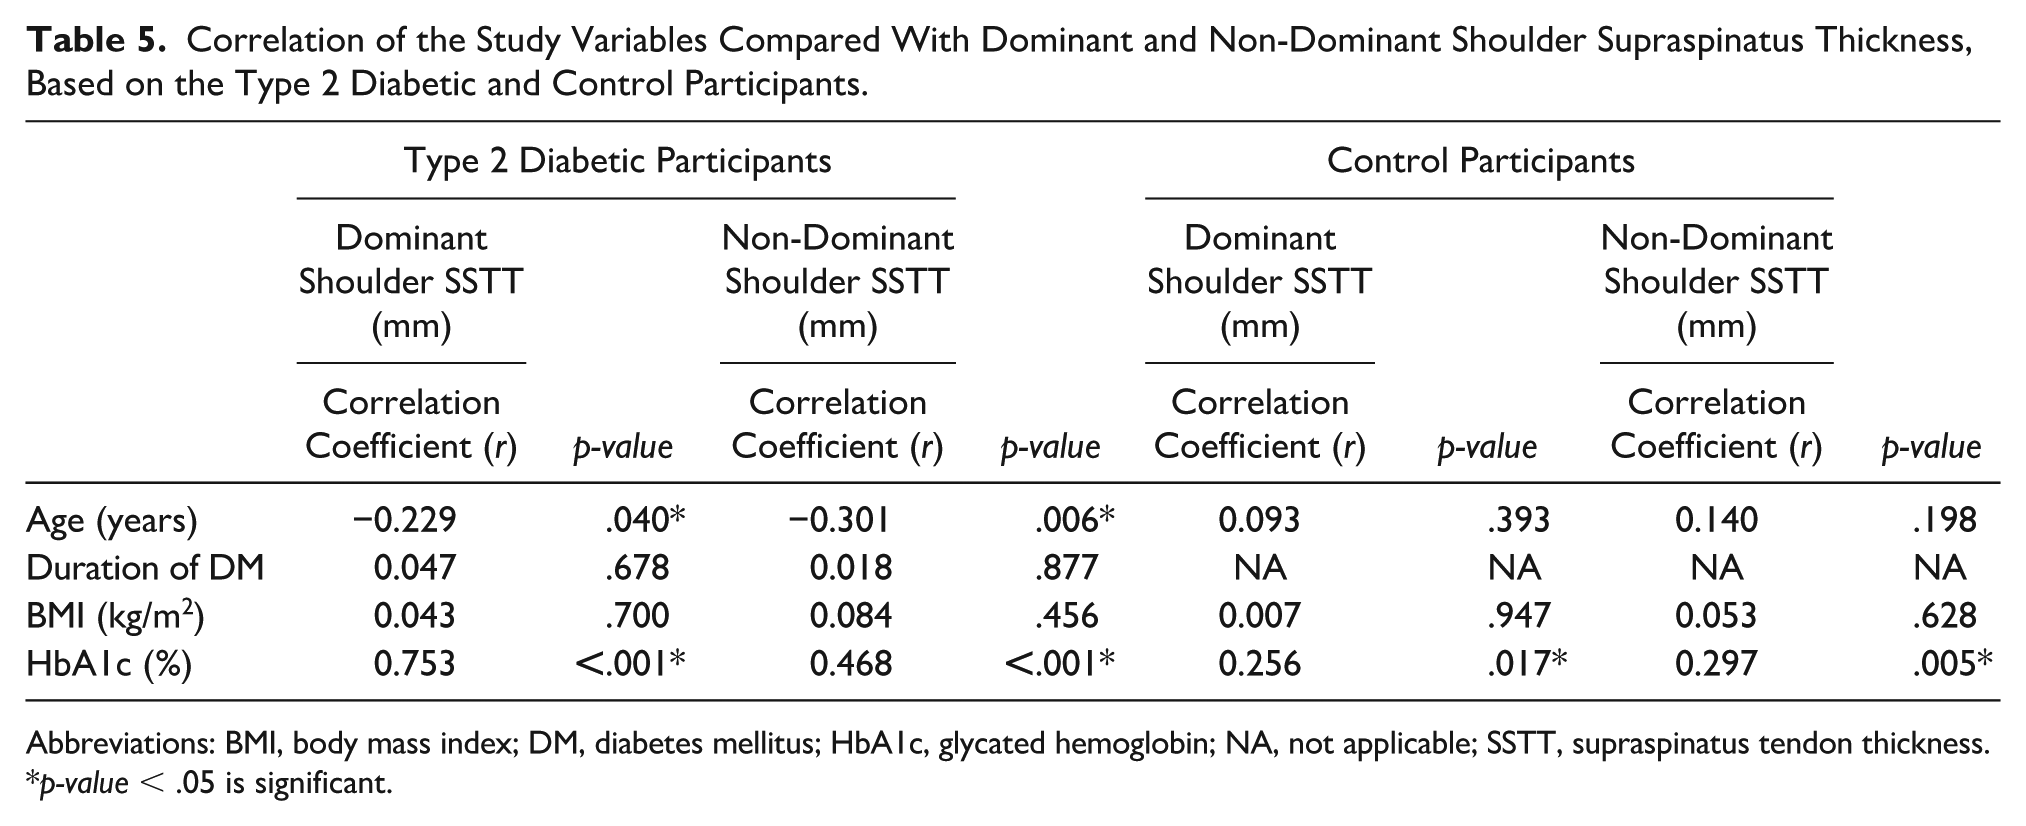
Abbreviations: BMI, body mass index; DM, diabetes mellitus; HbA1c, glycated hemoglobin; NA, not applicable; SSTT, supraspinatus tendon thickness.
p-value < .05 is significant.
Most DM participants were in the 1–9 years’ duration of DM group (60.00%) while the least were in the 20–29 years’ duration of DM group (6.25%). Mean SSTT in the dominant and non-dominant shoulders of the DM participants was shown to progressively decrease as the duration of DM increased but in an insignificant fashion (F-statistics = 0.296 and F-statistics = 0.490, p > .05; See Table 6).
Mean Supraspinatus Tendon Thickness in the Dominant and Non-Dominant Shoulders of Diabetic Participants, in the Duration of Type 2 diabetics.
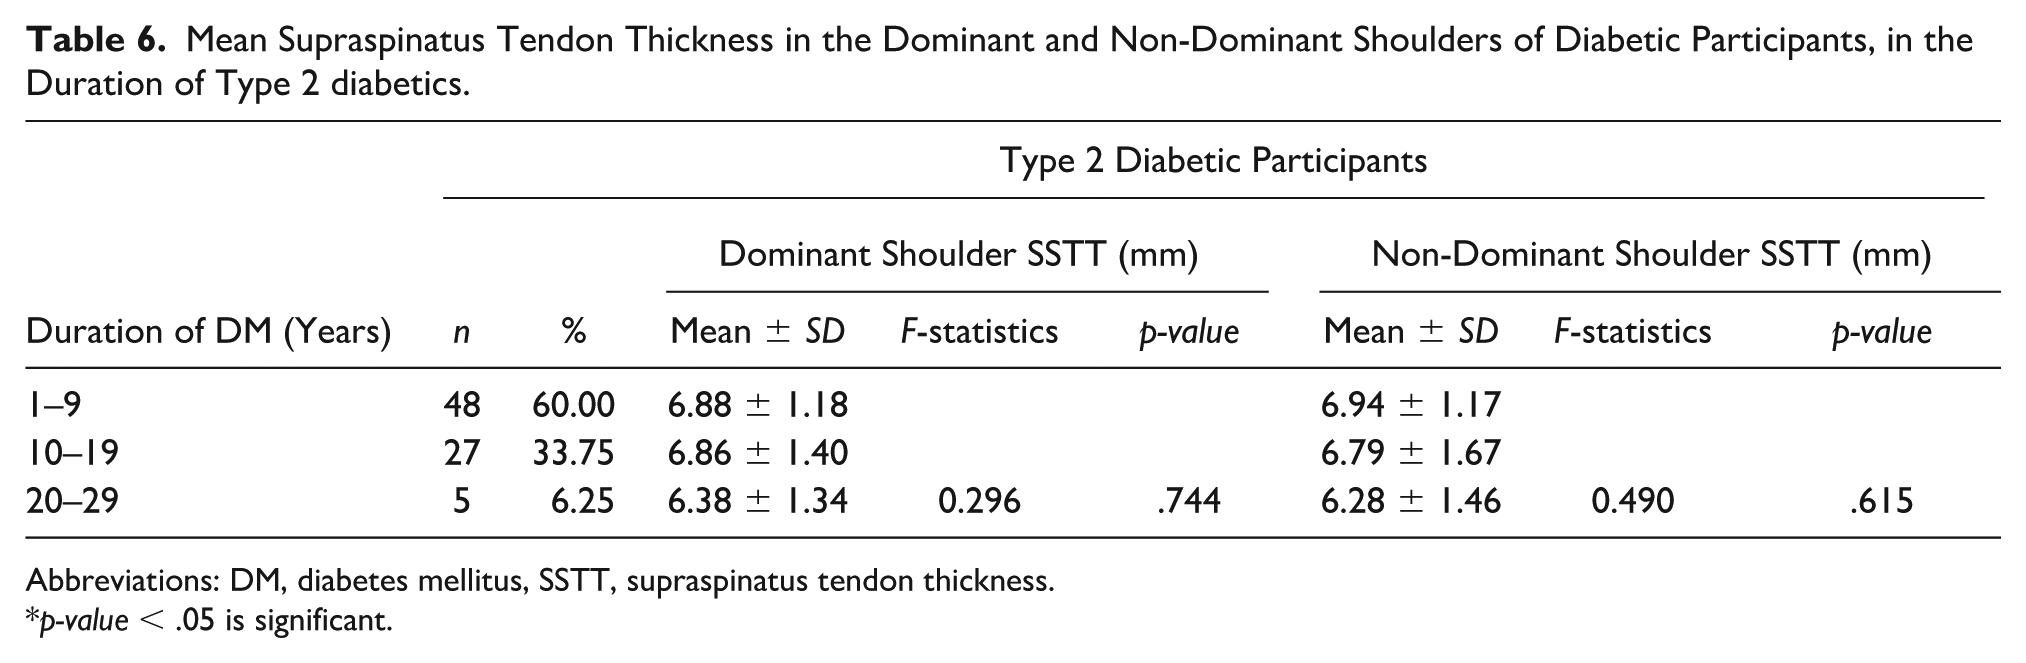
Abbreviations: DM, diabetes mellitus, SSTT, supraspinatus tendon thickness.
p-value < .05 is significant.
Socio-Demographic Features Within DM Cohort and Control Group
There were more female participants (n = 58 and n = 55, respectively) in the DM group and the control group had more females than males (n = 22 and n = 25, respectively). The DM group was observed to have more married, divorced, and widowed participants (n = 58, n = 2, and n = 2) than the control group. The participants who were single were more present in the control group (n = 26). The participants with primary and tertiary education (n = 7 and n = 60, respectively) were also more in the control group than the DM group. Most of the participants in both groups were employed (n = 50 and n = 60, respectively) (See Table 7).
The Descriptive Characteristics of the Study Participants, Divided by Those Who Were Diabetic or Control Subjects’ Participants.
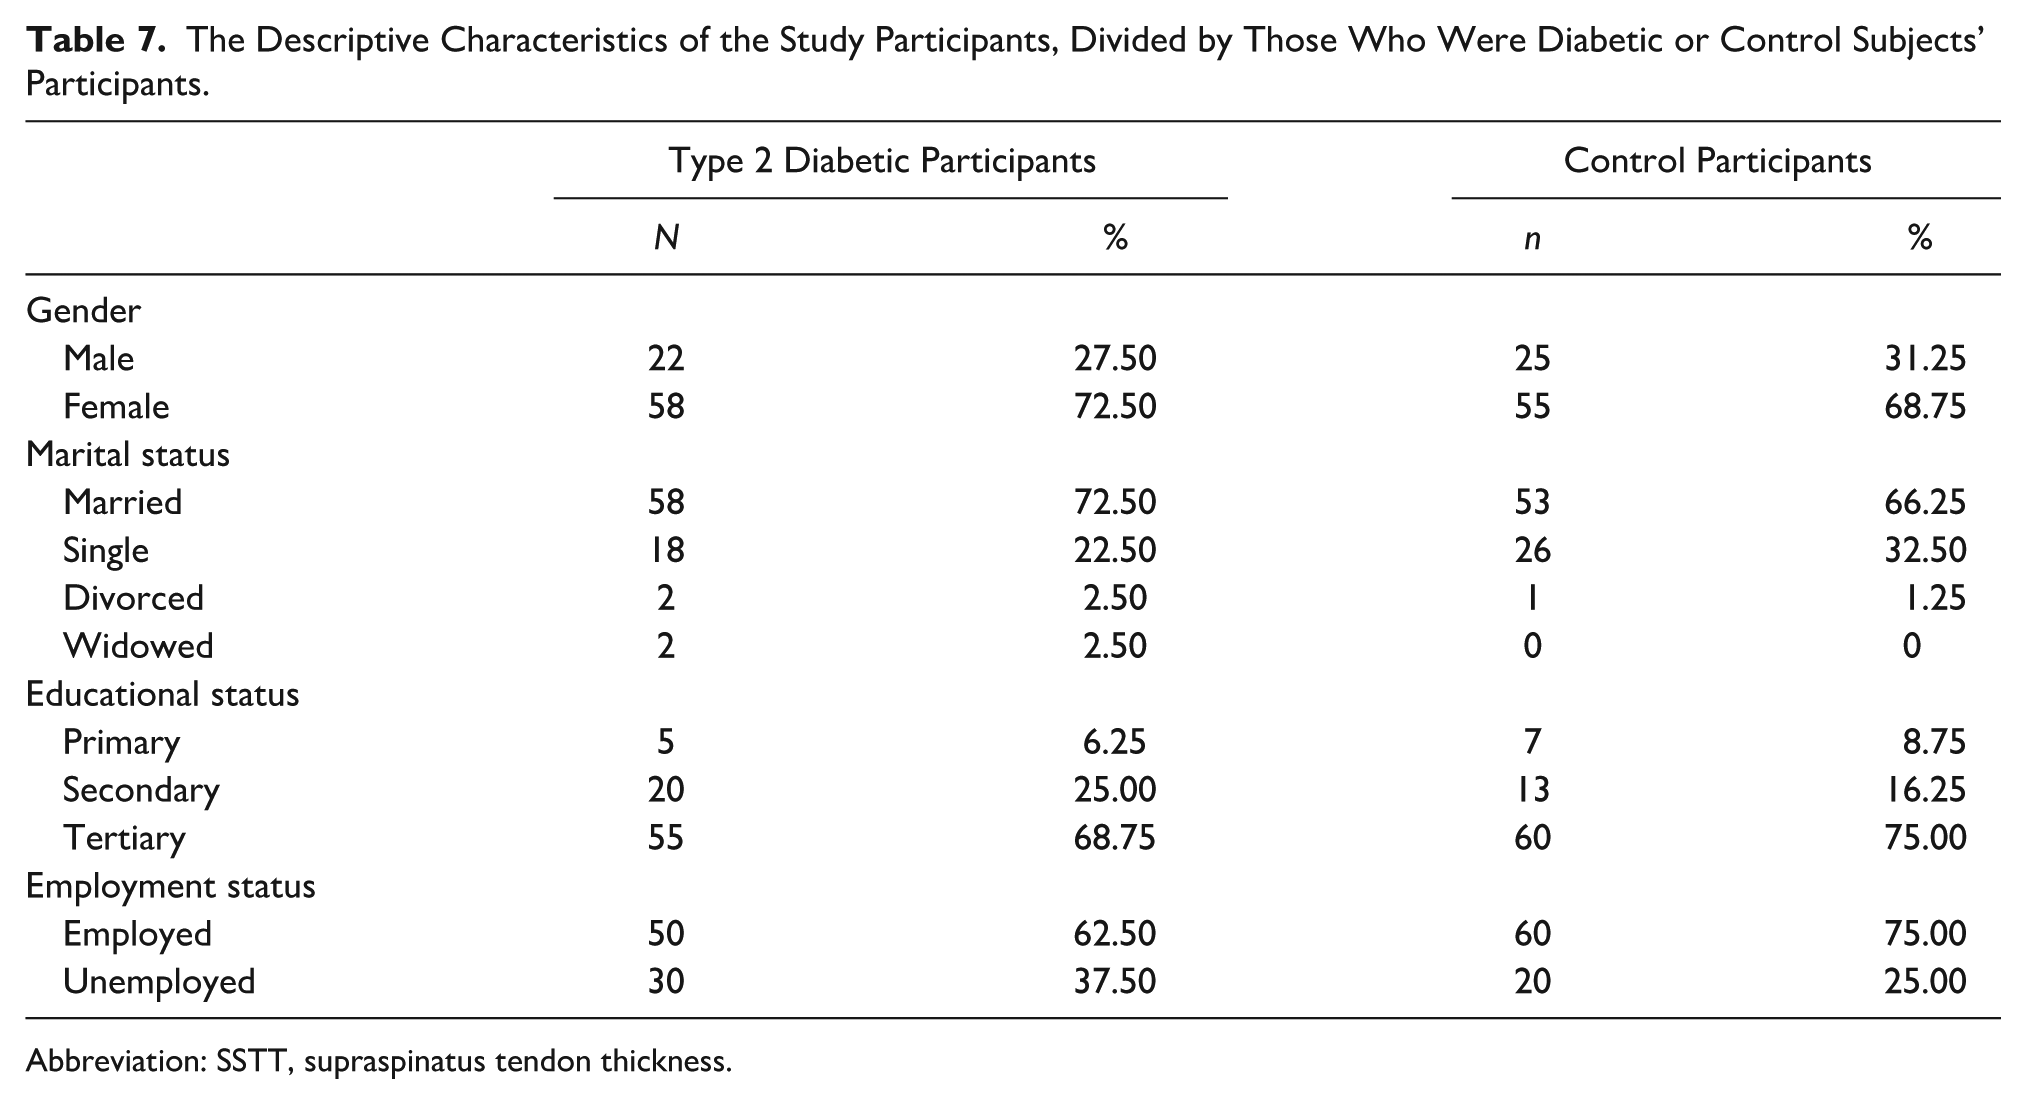
Abbreviation: SSTT, supraspinatus tendon thickness.
Discussion
It was observed in the study that the mean SSTT, on the dominant and non-dominant shoulders, were significantly greater in DM group. In a similar trend, Abate et al., 26 found out that the SSTT of diabetic Italians, above 65 years, was thicker on the dominant and non-dominant shoulders, than the non-diabetics. In congruity, Shingh et al., 27 whose cohort study involved 60 Nepalese participants, above 50 years, reported findings that dovetailed with the study. Uchendu et al. 19 in Nigeria, likewise, noted that SSTT was significantly greater in diabetic participants, on both the dominant and non-dominant shoulders. Still in agreement with the findings of the present study, Nour et al. 28 in Egypt, and Çağlar Okur and Çirçi 29 in Turkey both made same inference based on the SSTT of diabetics.
It has been vastly documented that the accumulation of advanced glycosylation end products in DM profoundly affect the physical and chemical properties of SST proteins, by increasing the degree of intermolecular collagen cross-linkage and results in the reduction of collagen solubility that ultimately make tendons to be tougher, thicker, weaker, and less elastic.18,26 Another opinion propounded that increased SSTT, in individuals with DM, is a consequence of the continuous deposition of thin strands of β2 microglobulin amyloidosis, in the myofibrillar tissues of tendons. 30
In a research study conducted by Elgyoum et al., 31 that comprised 114 healthy Sudanese children, between the age of 4 and 14 years, it was observed that the mean SSTT was 5.31 ± 069 mm while Mohammed et al., 32 whose study was exclusively on 77 healthy Sudanese volunteers, noticed a mean SSTT of 4.83 ± 0.76 mm. Their values were in alignment with the findings in the control participants of the present study.
Age was demonstrated to have a significant negative correlation with dominant and non-dominant shoulder SSTT of the DM participants in this study. However, it had no such relationship with SSTT, in the control group. In variance, Uchendu et al. 19 concisely stated that the superimposition of DM in individuals, who are advanced in age, significantly contributes to the increase in SSTT. Akturk et al. 30 in Turkey, in contrast, opined that the correlation between age and SSTT, in DM participants, was in a positive direction. Kim et al. 33 observed that mean SSTT, significantly increased with age, on the dominant and non-dominant shoulders, of normal individuals. In addition, Ishigaki et al. 34 in Japan, concisely stated that SST was approximately 1 mm thicker in healthy older participants (> 40 years) than healthy younger (< 40 years) counterparts (6.3 ± 1.6 vs 5.2 ± 0.9 mm, p < .05). This further supports the notion that the development of age-mediated tendinous changes is inevitably implicated in the pathophysiology of increased SSTT. 33 Shingh et al. 27 and Nour et al. 28 conversely inferred that there was no meaningful relationship between SSTT and age.
HbA1c in the study was observed to significantly correlate with SSTT on the dominant and non-dominant shoulders in the DM and control groups. In consonance, Büyükşireci et al., 18 inferred that SSTT, on both shoulders, increased in a linear fashion, with HbA1c. Also aligning with the study, Ramchurn et al., 35 observed that mean HbA1c in diabetic participants was significantly higher in those who had tendinopathies, compared with those without it (9.10% vs 8.00%, p < .50). Poorly controlled hyperglycemic environments in DM stimulate uncontrollable inflammation that culminates to the gradual increase in the SSTT.10,28,29
Limitations
The main limitation was the research design that was pre-experimental and has associated internal and external validity. The cohort was formed by convenience and further makes these result unique to these participants. In addition, a linear transducer, operating at 12 MHz is appropriate for musculoskeletal sonography, but this study employed a transducer that operated between 7 and 11 MHz. It is also important to note that C-peptide reagents and test kits, needed to objectively differentiate type 1 and type 2 DM were not available, in the host health facility. It was also observed that some elderly diabetic participants found it difficult to remain still throughout the sonogram of the SST. Finally, potential sampling bias while recruiting subjects might have influenced the conclusions and generalizability to other patients, in the locality of this study.
Conclusion
The SSTT was significantly greater in DM participants than the non-diabetic participants and is significantly associated with young age and an increase in HbA1c. Sonographic evaluation of SSTT may be a useful diagnostic tool, to determine tendinopathy in DM patients, in the absence of shoulder pain.
Further studies on the evaluation of SSTT are advocated for in type 1 diabetics and the pediatric patients. Shoulder function tests, such as Codman’s test, empty can test, and full can test, can be conducted. These provocative test results can be correlated with SSTT in DM, and to determine the thickness, which can contribute to limitations in shoulder joint function.
Footnotes
Acknowledgements
The authors sincerely appreciate the commitment of the staff and heads of the Departments of the Radiology Department and Endocrinology Unit of Internal Medicine Department of the University of Calabar Teaching Hospital, Calabar toward the accomplishment of this research.
Declaration of Conflicting Interests
The authors declared no potential conflicts of interest with respect to the research, authorship, and/or publication of this article.
Funding
The authors received no financial support for the research, authorship, and/or publication of this article.
Ethics Approval
Ethical approval for this study was obtained from the hospital Institutional Review Board (UCTH/HREC/33/VOL.III/198).
Informed Consent
Written informed consent was obtained from all subjects before the study.
Animal Welfare
Guidelines for humane animal treatment did not apply to the present study because no animals were used during the study.
Trial Registration
Not applicable.