Abstract

Powder shipments
Total iron powder shipments were slightly higher at 209 252 t in 2011 (206 058 t in 2010). However, shipments for PM fell by 4·6% to 105 989 t (111 064 t), with growth being seen only in shipments for other applications and for export, which were 69 768 t and 33 495 t respectively.
Domestic shipments of stainless steel power were reported to have fallen in 2011 although final figures are not yet available; shipments in 2010 were 2964 t.
Domestic shipments of MIM are likewise not yet available; shipments in 2010 are reported as 418 t, and increase on almost 40% over the depressed activity in 2009.
Copper powder shipments in 2011 declined sharply by about 10% to 7425 t (8194 t in 2010). Shipments for PM were 5173 t (5791 t), whereas those for other applications and export were 1137 t and 1115 t respectively.
PM part production
Trends in PM production are summarised in Table 1. Machine part production in the second quarter was particularly badly affected by the aftermath of the earthquake, when vehicle production was restricted by supply shortages of non-PM components. While production recovered in the second half of the year to levels comparable with 2010, floods in Thailand and appreciation of the yen were adverse factors. Over the year production fell by 3·4% by volume and by 4·4% in value, to ¥112·7bn, relative to 2010. Over 91% of PM parts production (82 865 t) was for automotive applications.
Japanese PM production/t
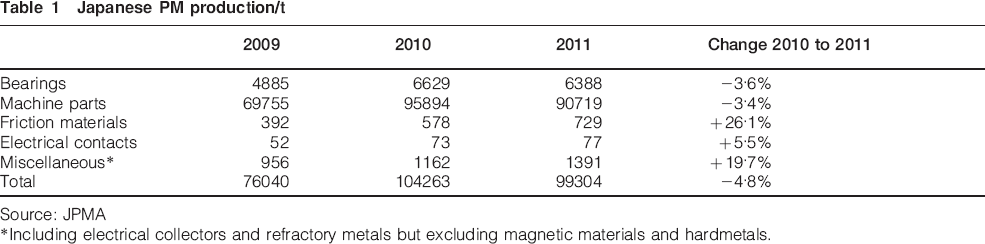
Source: JPMA
*Including electrical collectors and refractory metals but excluding magnetic materials and hardmetals.
JPMA anticipates modest increases in PM parts production in 2012, although the economic conditions in Europe and the strong yen are likely to weaken demand.
JPMA also reports data for PM automotive part usage in 2010. The average weight of sintered parts per vehicle in Japan was 9·6 kg (8·6 kg in 2009), about half the US figure of 18·2 kg and slightly higher than the European value of 8·4 kg. The increasing market penetration of electric and hybrid vehicles is anticipated to restrict further growth in this figure. However, JPMA notes that in 2010 the weight of PM parts in Chinese vehicles increased to 4 kg and is expected to continue to grow more strongly in this and other developing markets.
Of the 9·6 kg in 2010, 52% was comprised of engine components, 24% drive train, 13·2% of chassis and 4·5% electrical components, in line with previous trends.
Bearing production exhibited similar trends to PM parts, recovering later in the year but showing a 3·6% decline in volume and 3·3% decline in value, to ¥13·2bn, relative to 2010. Just over 60% (3852 t) of production was for automotive applications. However, JPMA's statistics indicate that bearing production for automotive machines increased by 9·9% and for electrical machines by 10·3% relative to 2010.
In view of the trend towards higher tolerance and higher performance bearings, JPMA anticipates expansion of bearing production in 2012 and future years.
MIM market
JPMA has also reported, on the basis of a survey of 23 MIM companies (members and non-members), that total Japanese MIM sales in 2011 amounted to ¥11·6bn. Although sales volumes were 2·8% lower than in 2010, strong future growth is predicted, with sales of ¥11·8bn in 2012 and ¥12·7bn in 2013.
Industrial machine parts comprised 19·9% of the market (21·5% in 2010), office automation and IT equipment parts 17·5% (15·7%), automotive parts 14·9% (15·6%), medical appliance parts 14·6% (14·7%), and communication equipment parts 4·3% (6·8%). Strong growth occurred in office equipment as a result of increased demands for magnetic printer components.
In terms of materials, stainless steels continued to dominate, representing 60·4% of production; magnetic material made up 15·3% (up from 12·2% in 2010 as a result of demand for Permendur printer components), Fe–Ni base alloys 11·4%, low alloy steels 3·3%, heavy alloys 3·2%, tool steel 2·6% and others 3·8%.
Asian production
JPMA also reports production statistics for southeast Asia compiled by members of the Asia PM Association and the PM Association of China General Machine Components Industry Association (CMPMA) (Table 2). All countries except Japan and Malaysia reported growth in volumes of iron based part production relative to 2010; this was >10% in India and Singapore. Copper based production was less strong but still showed growth of 1·3% overall. In China, which was by some distance the largest producer of both ferrous and non-ferrous parts, 56% of production was for automotive applications and 32% for electrical machinery.
PM parts production in Asia/t
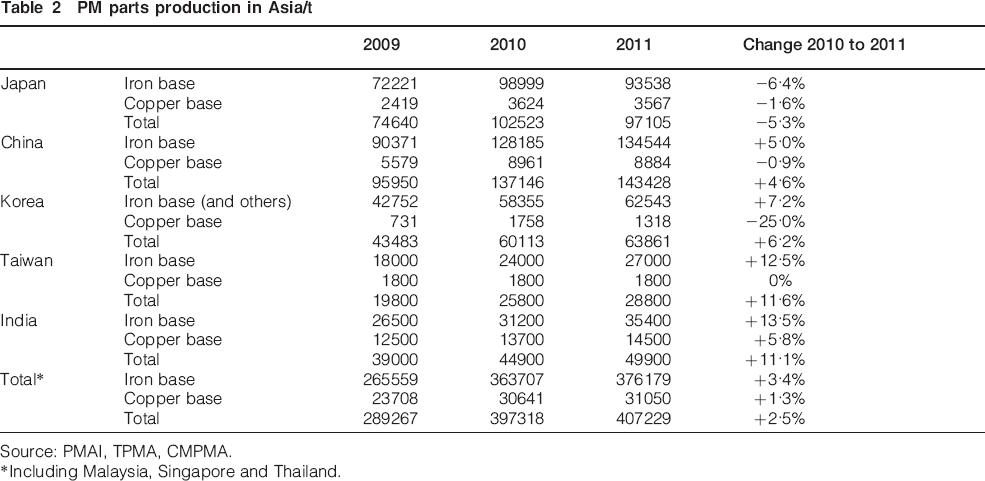
Source: PMAI, TPMA, CMPMA.
*Including Malaysia, Singapore and Thailand.
Further information from: JPMA, Tamagawa Bldg 7F, 2-2-16, Iwamoto-cho, Chiyoda-ku, Tokyo 101-0032, Japan, email