
Abstract
The addition of boron in just a few parts per million can influence the hardenability of steel, provided it remains in solid solution. To protect boron from forming nitrides, titanium and aluminium which have a strong affinity for nitrogen are added in optimised proportions. The amount of soluble boron in such multicomponent systems can be estimated using commercial software available based on thermodynamic databases. Alternatively, the so called simultaneous and sequential methods permit the soluble boron concentration to be estimated using solubility products. The reliability of these methods has been investigated and compared with a different approach, the stepwise method based on the solubility product of various nitrides under equilibrium conditions.
Introduction
The influence of minute additions of boron to the hardenability of steels has been known since the early 1950s (Ref. 1) and many reviews have emphasised its function in the development of steels.2–4 Boron in solid solution has a marked tendency to segregate to austenite grain surfaces in steels, and in doing so, reduces the boundary energy per unit area. The boundary as a consequence becomes a less effective heterogeneous nucleation site for ferrite so that the hardenability of the steel increases. And all these can be achieved with just a few parts per million of boron (5–30 ppm) in solid solution. However, to keep the boron in solution it is necessary to protect it from nitrogen by adding stronger nitride formers such as titanium and aluminium. The required balance of titanium, aluminium, nitrogen and boron can be estimated using phase stability calculations as implemented in commercial software such as MTDATA when used in combination with appropriate thermodynamic databases.5
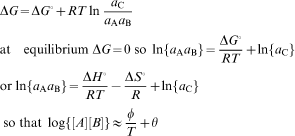
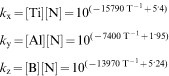
On the other hand, it is often necessary to include the algorithm for calculating soluble boron in open source software6 in which case it is useful to have a simpler and self-contained method of estimating the soluble boron content. For this reason, many researchers use solubility products whose origin also lies in thermodynamic data. For example, given the standard free energy change for a reaction  , equilibrium is given by setting the free energy change ΔG° to zero in the equation in which the reactants and products are referred to the Raoultian standard state (so the activity of the pure compound TiN is unity)
There are a number of further approximations common in the use of such solubility products, particularly when dealing with systems in which there is competition for solute, for example when Ti, B and Al are simultaneously in equilibrium with N. It is sometimes the case that calculations are conducted sequentially, by allowing what is perceived to be the strongest nitride former to first combine with the nitrogen, and then permit the next most potent nitride former to combine with the residue etc., this algorithm is used extensively in the quantitative design of welding alloys containing boron7–10 and in similar alloys where there is competition for oxygen.9,11
The purpose of the present work was to investigate the reliability of the different methods of calculation which are based on the use of solubility products, i.e. the sequential method described above, a ‘stepwise‚ method introduced here and another one where sets of solubility equations are simultaneously solved.12–14 The essence of these methods is illustrated in Fig. 1.
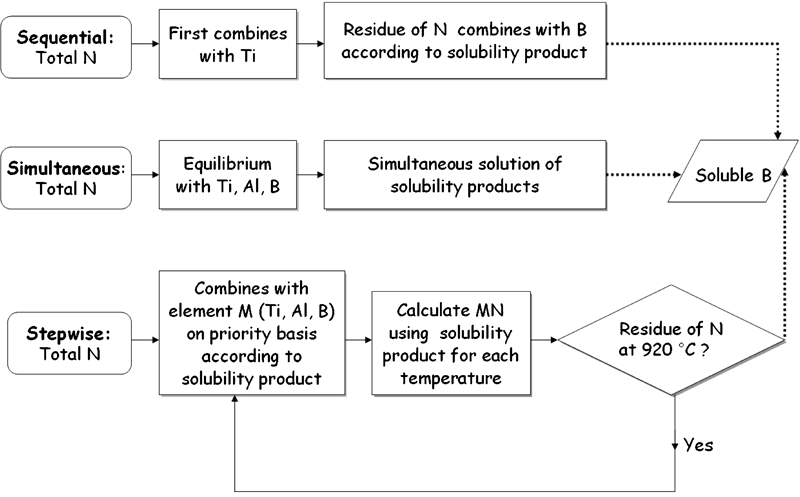
Illustration of sequential, simultaneous and stepwise methods for estimating amount of soluble boron
Analysis
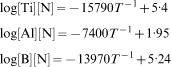
It is assumed here that Ti, Al and B form only nitrides and are in an equilibrium state and follow solubility product equations15–17 where the temperatures are in Kelvin and the terms in square brackets represent dissolved solute concentrations in wt-

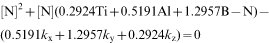
For simultaneous method, the solubility products k are rewritten from equation (2) as
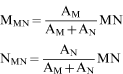
In the stepwise method implemented here, nitrogen combines with element forming at the highest temperature according to solubility product equations. The residual nitrogen is then available for remaining two elements to form nitride, however, it combines with that element forming at next higher temperature. This process continues till any residual nitrogen, otherwise it stops and soluble boron value can be estimated, as shown in Fig. 1. In stepwise method, the temperature at which each precipitate form is calculated by assuming that total nitrogen can combine with Ti, Al and B, and these temperatures are represented as  ,
,  and
and  respectively. For given concentration Ti = 0·01 wt-, N = 0·002 wt-, B = 0·0025 wt-, Al = 0·1 wt-, we can get
  ,
,  and
and  . Comparison of these temperature show TiN will form first as
  is the highest temperature.
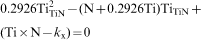
Solving solubility product equations (2) and (3) for Ti and N, a quadratic equation in TiTiN (Ti tied up with N to form TiN)12 is obtained
 is higher than
  . The residual nitrogen then tied up with aluminium according to solubility product equations and if there is further residual nitrogen, it can further combine with boron and finally the soluble boron value can be calculated.
Results and discussion
Of the three methods illustrated in Fig. 1, the sequential method is the most ambiguous because there is a prior assumption about the relative stabilities of phases involved, which can change dramatically with concentration. The assumption that TiN will form first may not be always true. To show this, an example Ti = 0·01 wt-, N = 0·002 wt-, B = 0·0025 wt- and Al varied between 0·04 and 2·0 wt- is considered. By allowing the total nitrogen to combine with titanium, boron and aluminium, the formation of nitrides as a function of temperature are plotted in Fig. 2. From the figure, it is evident that TiN forms only when Al concentration is <0·3 wt-. However, when Al concentration is >0·3 wt-, then AlN will form before TiN and the remaining nitrogen can combine with titanium or boron according to solubility product equations. From this result, it can be safely concluded that the formation of precipitates strictly depend on concentration of elements.
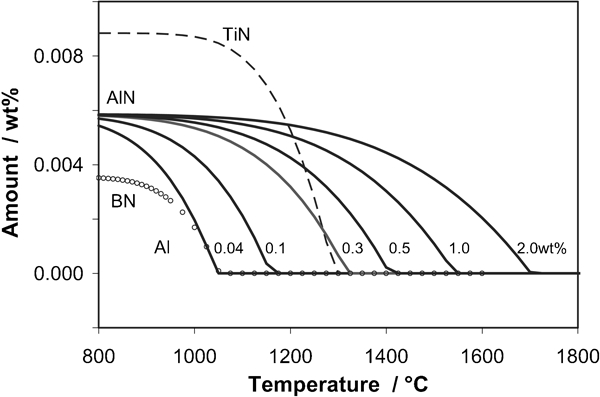
Evolution of nitrides when B, Ti and Al (varied between 0·04 and 2·0 wt-) tied up with whole of nitrogen as function of temperature: circle, broken and solid lines represent BN, TiN and AlN respectively
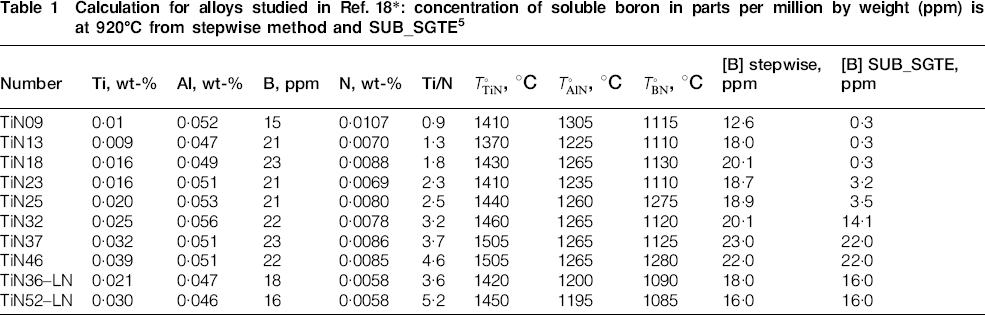
The stepwise method is implemented to calculate concentration of soluble boron in alloys of Shen and Hansen.18 Table 1 shows calculated  ,
,  and
and  , soluble boron at 920°C. For simplicity, the concentration of only Ti, Al, B and N is included for all alloys18 in the table. For comparison, the dissolved boron calculated from SUB_SGTE (ver 10·0) thermodynamic database of commercial software MTDATA (Ref. 5) is also shown in Table 1. For alloy namely TiN37 (ratio Ti/N≈3·7), the concentration of titanium is sufficient to stabilises whole of the nitrogen. As a result, TiN forms, after which there is no nitrogen left and hence total boron remains as soluble boron in austenite. The formation of TiN precipitate along with dissolved boron and nitrogen concentration as a function of temperature from stepwise method are shown in Fig. 3a. The same calculation from SUB_SGTE database is shown in Fig. 3b. The comparison shows there is a good agreement between the results of stepwise and SUB_SGTE calculation. This gives confidence that stepwise method can estimate fairly well the concentration of soluble boron.
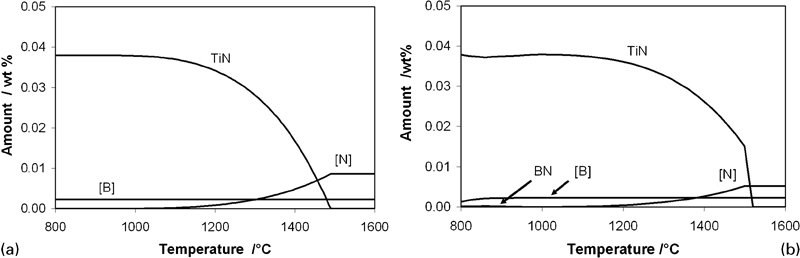
Concentration of nitrides, dissolved boron and nitrogen as function of temperature in TiN37 (Ref. 18) as calculated by a stepwise and b SUB_SGTE database of MTDATA5
Calculation for alloys studied in Ref. 18*: concentration of soluble boron in parts per million by weight (ppm) is at 920°C from stepwise method and SUB_SGTE5
 , °C
, °C , °C
, °C , °C
, °CFor another alloy TiN09 where ratio Ti/N (∼0·9) is less than stoichiometry value (Table 1), TiN forms first and residual nitrogen then tied up with aluminium to form AlN as  is higher than
  . The minute nitrogen left after AlN then combines with boron to form BN. The complex sequence of formation of nitrides are shown in Fig. 4a. As partial boron is being used in forming BN, the dissolved boron value comes out to be ∼12·6 ppm at 920°C. The same calculation from SUB_SGTE database of MTDATA is shown in Fig. 4b. Here also TiN forms first but then it is followed by BN and residual nitrogen after tied up with boron then combines with aluminium to form AlN. As BN forms before AlN, most of boron is tied up with nitrogen and the value of soluble boron is ∼0·03 ppm. The value of soluble boron determined from SUB_SGTE database is small in comparison to 12·6 ppm from stepwise method.
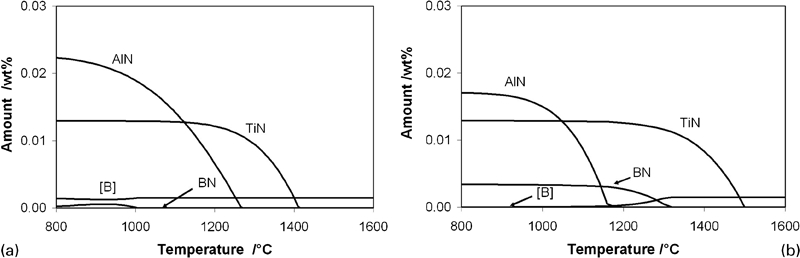
Concentration of nitrides and dissolved boron as function of temperature in TiN09 (Ref. 18) as calculated by a stepwise and b SUB_SGTE database of MTDATA5
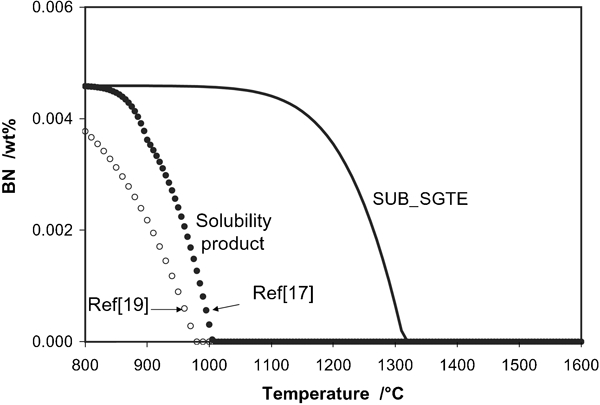
To understand the reason of difference in the soluble boron concentration between two calculations, a steel containing only boron and nitrogen (0·06C–0·0020B–0·0064N) is considered. The evolution of BN precipitate as a function of temperature from SUB_SGTE database5 and using solubility product equations17,19 are plotted in Fig. 5. From the figure, it is apparent that BN from SUB_SGTE start forming at temperature 1320°C, which is much above than 1000°C as obtained from solubility product.17,19 There is huge inconsistency in appearance of BN from solubility product calculation and SUB_SGTE, and the reason for this discrepancy is not clear.
For TiN09 considered (Table 1), as BN forms before AlN, most of the boron is being used in forming BN thus giving small concentration of soluble boron ∼0·03 ppm. This explains SUB_SGTE gives small value of soluble boron as compared to stepwise method when Ti/N<3·42, as shown in Table 1. But when the ratio Ti/N ⩾3·42, then soluble boron value from SUB_SGTE database matches with stepwise method (Table 1) because titanium stabilises whole of nitrogen, so neither AlN nor BN forms. The above discussion suggests calculation of boron nitride from SUB_SGTE database of MTDATA (Ref. 5) needs to be assessed.
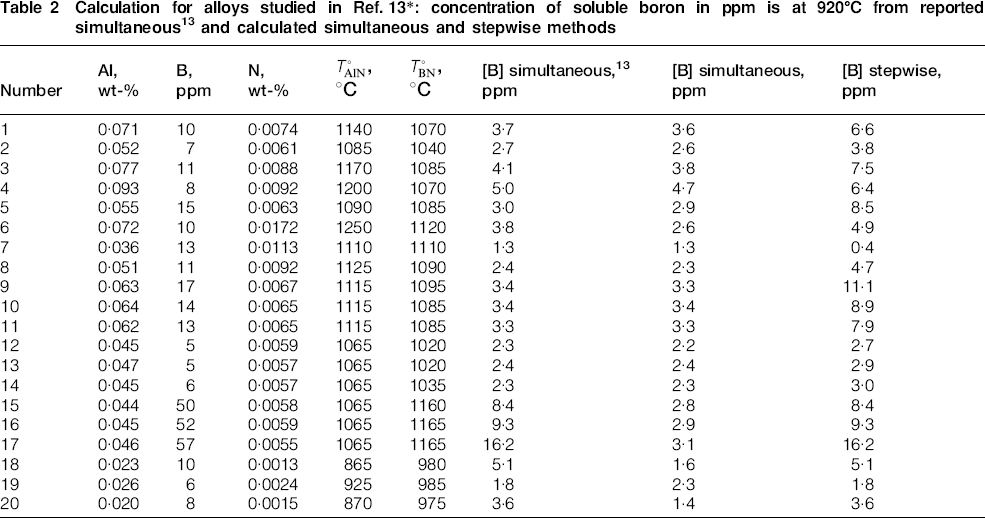
Habu et al.13 used the simultaneous method to calculate the soluble boron in alloys containing aluminium, boron and nitrogen. The results of soluble boron calculation from stepwise and simultaneous methods at 920°C are compared with reported data13 in Table 2 along with concentration of Al, B and N, and  and
and  . The calculated soluble boron concentration for steels 1–14 from stepwise is higher than obtained from simultaneous method. The reason may be as follows: according to stepwise method
  is higher than
  for steels 1–14. Here AlN forms first and the residual nitrogen [N] = N−NAIN then combines with boron. As there is less nitrogen available to form BN, the soluble boron value is estimated to be higher in stepwise calculation with the exception of steel 7. The simultaneous method based soluble boron matches closely with reported values13 for steels 1–14. However, there is discrepancy in the reported data on soluble boron calculation for steels 15–20 as these values match with stepwise method rather than simultaneous method. For these steels 15–20,
  is higher than
  from stepwise calculation, as a result BN forms before AlN according to solubility product.
Calculation for alloys studied in Ref. 13*: concentration of soluble boron in ppm is at 920°C from reported simultaneous13 and calculated simultaneous and stepwise methods
 , °C
, °C , °C
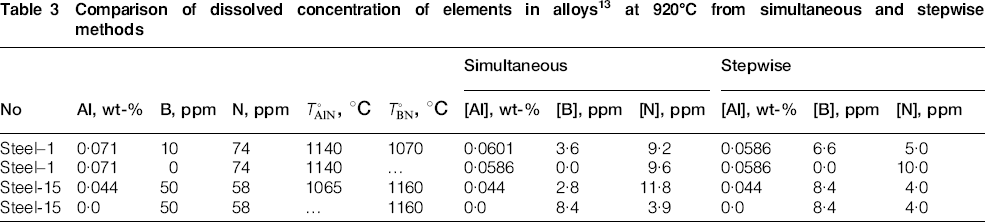
, °CIt is interesting to investigate how both stepwise and simultaneous methods respond in presence of aluminium and boron. The results for steels 1 and 15 are shown in Table 3. In the former case,  is higher than
  , then AlN forms prior and residual nitrogen then tied up with boron. For this case the soluble Al, B and N values are calculated and shown in Table 3. If however boron is removed in steel 1, then concentration of dissolved aluminium, [Al] changes in simultaneous method but it does not change for stepwise method. As AlN forms at higher temperature according to solubility product, [Al] should be independent of boron concentration. For another steel 15, as
  is higher than
  , the presence or absence of aluminium should not change [B]; however, its value changes when estimated using the simultaneous method. As shown in Table 3, simultaneous method gives inconsistent results in presence or absence of elements. When BN exists, then removal of aluminium should not change the value of soluble boron [B]. On the other hand, the stepwise scheme gives the same value of [B] irrespective of the presence of aluminium when
  is higher than
  .
.
Comparison of dissolved concentration of elements in alloys13 at 920°C from simultaneous and stepwise methods
 , °C
, °C , °C
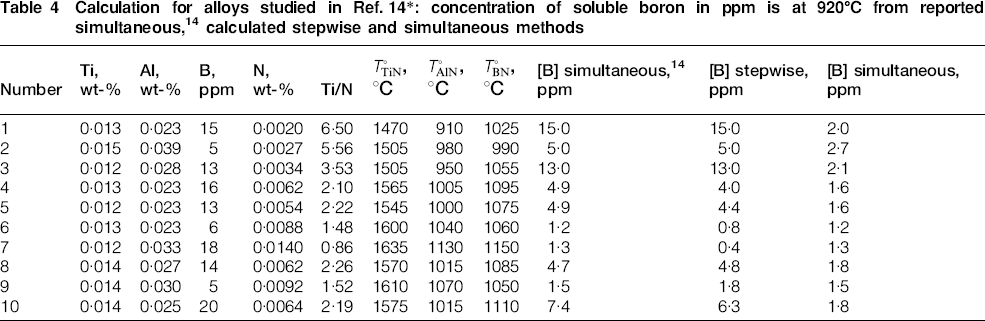
, °CBang and Ahn14 also used simultaneous method to calculate the soluble boron in low carbon steel containing titanium, aluminium, boron and nitrogen by solving solubility product equations simultaneously. Table 4 shows the results of soluble boron calculation from stepwise and simultaneous methods at 920°C are compared with reported simultaneous values14 along with the concentration of Ti, Al, B and N. For all steels 1–10,  is higher than both
  and
and  . It is evident that TiN forms before BN and AlN. The reported boron values do not match with most of the calculations conducted by simultaneous method. Rather these values matches closely with the stepwise method for all steels, with exception of steel 7. The discrepancy in the boron value for steel 7 may be due to the assumption that BN forms before AlN is not correct as
  is just above
  by 20°C and there may be competition of boron and aluminium to tie up with nitrogen. It can be concluded that in general, for the cases considered, the stepwise method performs better than that involving the simultaneous solutions.
 , °C
, °C , °C
, °C , °C
, °CSummary
A simple method ‘stepwise’ is proposed that allows the calculation of soluble boron in any compositional domain of titanium, aluminium, boron and nitrogen. It is based on the assumption that only nitrides can form and are in equilibrium. The software associated with this work can be downloaded from www.msm.cam.ac.uk/map/mapmain.html.6
Stepwise method is compared with existing sequential, simultaneous methods and thermodynamical database SUB_SGTE of commercial software and short comings of these methods are discussed. The work suggests that there is need to revise the calculation of boron nitride in SUB_SGTE database of MTDATA commercial software.5
Footnotes
Acknowledgements
The author is thankful to Professor H. K. D. H. Bhadeshia and Dr S. W. Ooi for useful discussions and to Professor H.-G. Lee for the provision of laboratory facilities at Graduate Institute of Ferrous Technology, POSTECH and to Dr K. Y. Lee from POSCO, Gwangyang.