
Abstract
For the first time, the influence of laser power, scan speed, scan spacing and nominal laser power density on the tensile properties, dimensional accuracy, surface roughness, number of cracks and top surface concavity of samples of Hastelloy X manufactured using a laser powder bed facility, has been assessed systematically on three-dimensional samples. It has been found that the nominal laser power density is the dominant factor, but the influence of scan spacing and scan speed can sometimes be significant. Density of >99·5 can be obtained using most conditions. Cracks are observed at corners of the samples. An optimised process window can be derived from the above systematic analysis under which the component can be built smoothly, with good surface finish and dimensional accuracy, consistent mechanical properties and the properties are comparable with those of forged products.
Introduction
Rapid prototyping has become a mature process to manufacture three-dimensional complex polymer components from their CAD files in one step. In all laser bed machines, a laser or electron beam is used to scan and melt the powder in defined paths on a bed of powder, and the finished layer is withdrawn a certain height (Z increment), followed by the addition of another layer of powder, which is then scanned and melted again. This process is repeated, leading to the creation of a three-dimensional component by melting of the powder layer by layer. The attempt to extend the same concept into manufacturing metallic components using off the shelf powders in one step has made significant progress over the last few years, and several commercial powder bed facilities are now available,1–3 each of which has advantages or disadvantages. ARCAM (http://www.arcam.com) and MTT (http://www.mtt-group.com) machines have atmosphere control, which is essential for manufacturing Ti alloy components. The Phoenix (http://www.phenix-systems.com) machine has a heating system, which can heat up the powder bed to 1200°C, and it is also suitable for processing ceramic powder. EOSINT M270 (http://www.eos.info) has been shown to be capable of manufacturing net shape components routinely using steel, CoCr and some Ni alloy powders. Figure 1 shows examples of the surface finish and complexity which can be commonly achieved by the EOS 270.
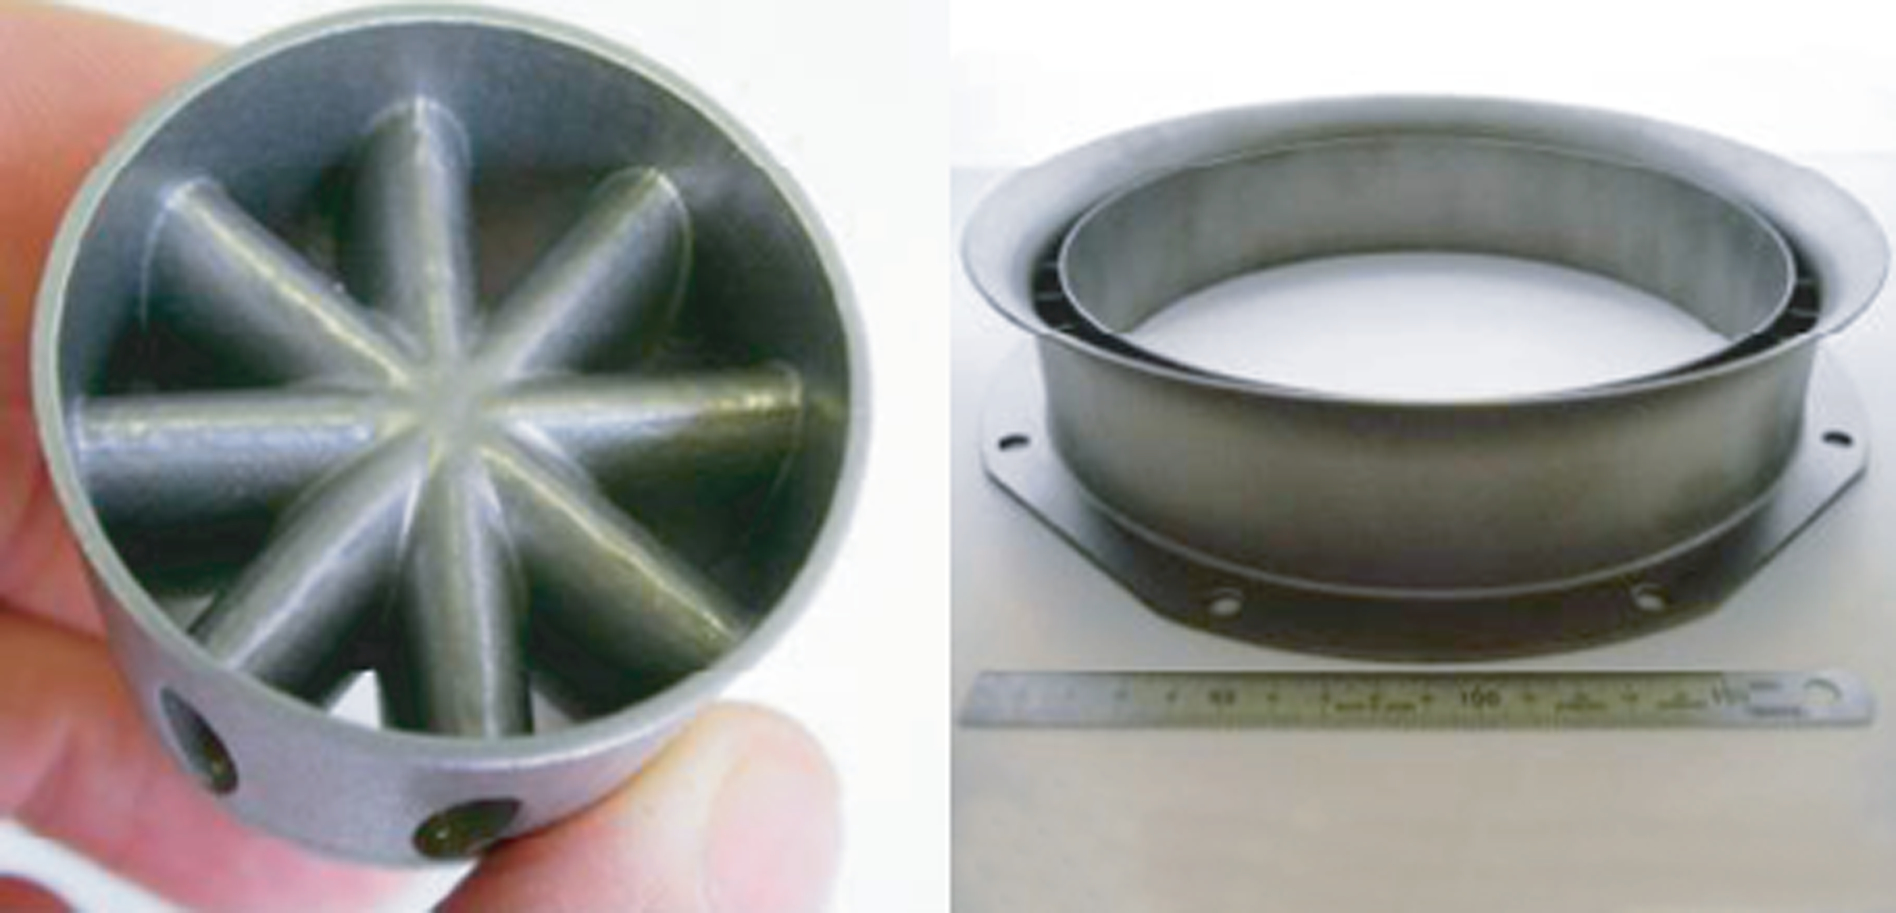
Examples of parts manufactured using EOS 270 from stainless steel powder
The influence of direct laser deposition (DLD) parameters on the characteristics of the DLDed materials, including from steel, Ni, Ti, etc. powders, has been studied.4–14 Wright et al. 4 studied the influence of the type of lasers: CO2 and Nd:YAG on the density of the build of H13 steel powder and the influence of C content in the alloy on the density under a given process condition. It has been found that a Nd:YAG laser appears to produce a higher density product than does a CO2 laser. For a given process condition, the density of a build is determined by the wettability of the alloy, and for steel, this is strongly affected by the C content of the material. 4 It has been found that an increase in the energy of the pulsed laser input via using wider pulse width increases the density of the build of single beads for Waspaloy, 5 and pulsing also suppresses balling. 6 However, too much power can lead to evaporation and thus to a change of alloy composition. Kruth et al. 6 studied the processing window, including the selection of appropriate scan patterns, for a mixture of different types of metal powder particles. It was found that an intermediate range of parameters appears to produce optimum tracks of melting in agreement with the results from Refs. 4 and 5. It was also noted that liquid metals do not wet surface oxide films in the absence of a chemical reaction, and it is very important to avoid this problem by providing sufficient remelting of the previous layer.
Yadroitsev et al. 7 studied the influence of scan spacing on the porosity and tensile properties of laser powder bed deposited In625 and the effect of laser power and scan velocity 8 on the profile of melted or deposited lines of Inox904L steel powder using a Phoenix machine.
It has been found 7 that 120 μm appears to be the optimum hatch distance (i.e. scan spacing, the distance between adjacent laser paths) in terms of porosity, and little difference was found in tensile properties between samples built horizontally and vertically and tested along these directions (those samples had additional scanning between hatches).
For a given laser power, when the scan speed is too high, the melted powder will ball up 8 because the surface tension and melt viscosity increase with decreasing temperature, 9 i.e. with a reduction in the effective laser power input at higher scan speeds. When the scan speed is too slow, the melt volume is increased due to the increase in effective laser power input, together with the increase in the heat affected zone by involving more powder from the vicinity of a melting track. The increase in melt volume and a decrease in melt viscosity, melt hydrodynamics (driven by the Marangoni effect) become dominant, which subsequently leads to uneven build. A steady state build is achieved using an intermediate scan speed, which avoids balling up and an increase in melt volume, which downgrades the surface finish.10,11 The balling effect of melt at high scan speed has been attributed to Plateau–Rayleigh instability and/or to Marangoni convection; it is influenced by powder composition 10 and by scan speed.
Residual stress exists in selective laser melted samples, and the level of stress is affected by the laser scan pattern.12–14 The maximum stress (∼500 MPa) was found to be at the top layer of a build 12 for a particular geometry. This residual stress can be relieved either by in situ remelting/reheating the top surface without powder or by post-build heat treatment. The maximum residual stress at the top layer has been found to decrease with increasing temperature of the substrate. 12
The amount of systematic work on the influence of experimental variables on the properties, surface finish, etc. of samples produced using laser bed technology has been limited, and much of it has been carried out using a single track laser path, which does not reflect the requirements when building three-dimensional components. Recent improvements in the available equipment make it possible to carry out systematic experiments, and the aim of the work reported in the present paper is to identify the process conditions, which provide the best balance of the important characteristics of samples produced using laser bed technology (dimensional accuracy, surface roughness, density, top surface concavity, microstructure and tensile/fatigue properties). This approach is important when accurately shaped components are to be manufactured for use in engineering applications rather than a simple demonstration of shape control or of surface finish. The Ni alloy Hastelloy X has been used in the present work in conjunction with an EOS laser powder bed facility.
Materials and experimental procedures
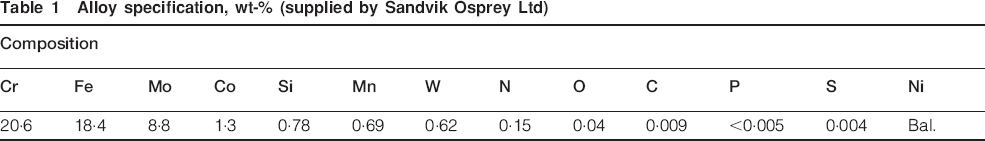
The material used in the present study is Hastelloy X alloy powder supplied by Sandvik Osprey Ltd with a particle size from 20 to 63 μm. Table 1 is the powder compositional specification supplied by Sandvik Osprey Ltd. The chemical composition of the powder supply by Sandvik Osprey Ltd was checked by Inco test. The powder particle size distribution was measured using a Coulter LS 230 instrument in the IRC of the University of Birmingham.
Alloy specification, wt- (supplied by Sandvik Osprey Ltd)
An EOS M270 machine coupled with PSW 3·2 and PSW 3·3 software has been used to carry out the study, which uses a nitrogen shroud to limit oxidation; the nitrogen is generated by a nitrogen generator built into the machine. An oxygen sensor is employed in the part building chamber to monitor the oxygen level. At the beginning, the machine will purge the chamber with nitrogen until the oxygen level reaches 1·5 wt- at which point the DLD, i.e. selective laser melting process, will start automatically.
The software PSW 3·2 is fixed with skin and core configuration. In the skin and core configuration, as shown in Fig. 2a, the skin (i.e. the outer surface of the component) is built with high resolution using smaller increments between layers, to generate a good external surface. The core is built using larger layer increments and faster exposure parameters to improve the build speed. In software PSW 3·3, the skin and core mode can be switched off when required; thus, the whole part is fabricated in a single process step as shown in Fig. 2b. All the samples used in the present paper were manufactured using PSW 3·3 with the configuration shown in Fig. 2b except the results shown in Fig. 12a. The experimental results shown in Fig. 12a are the only experiments, which were carried out using PSW 3·2 and configuration of Fig. 2a.
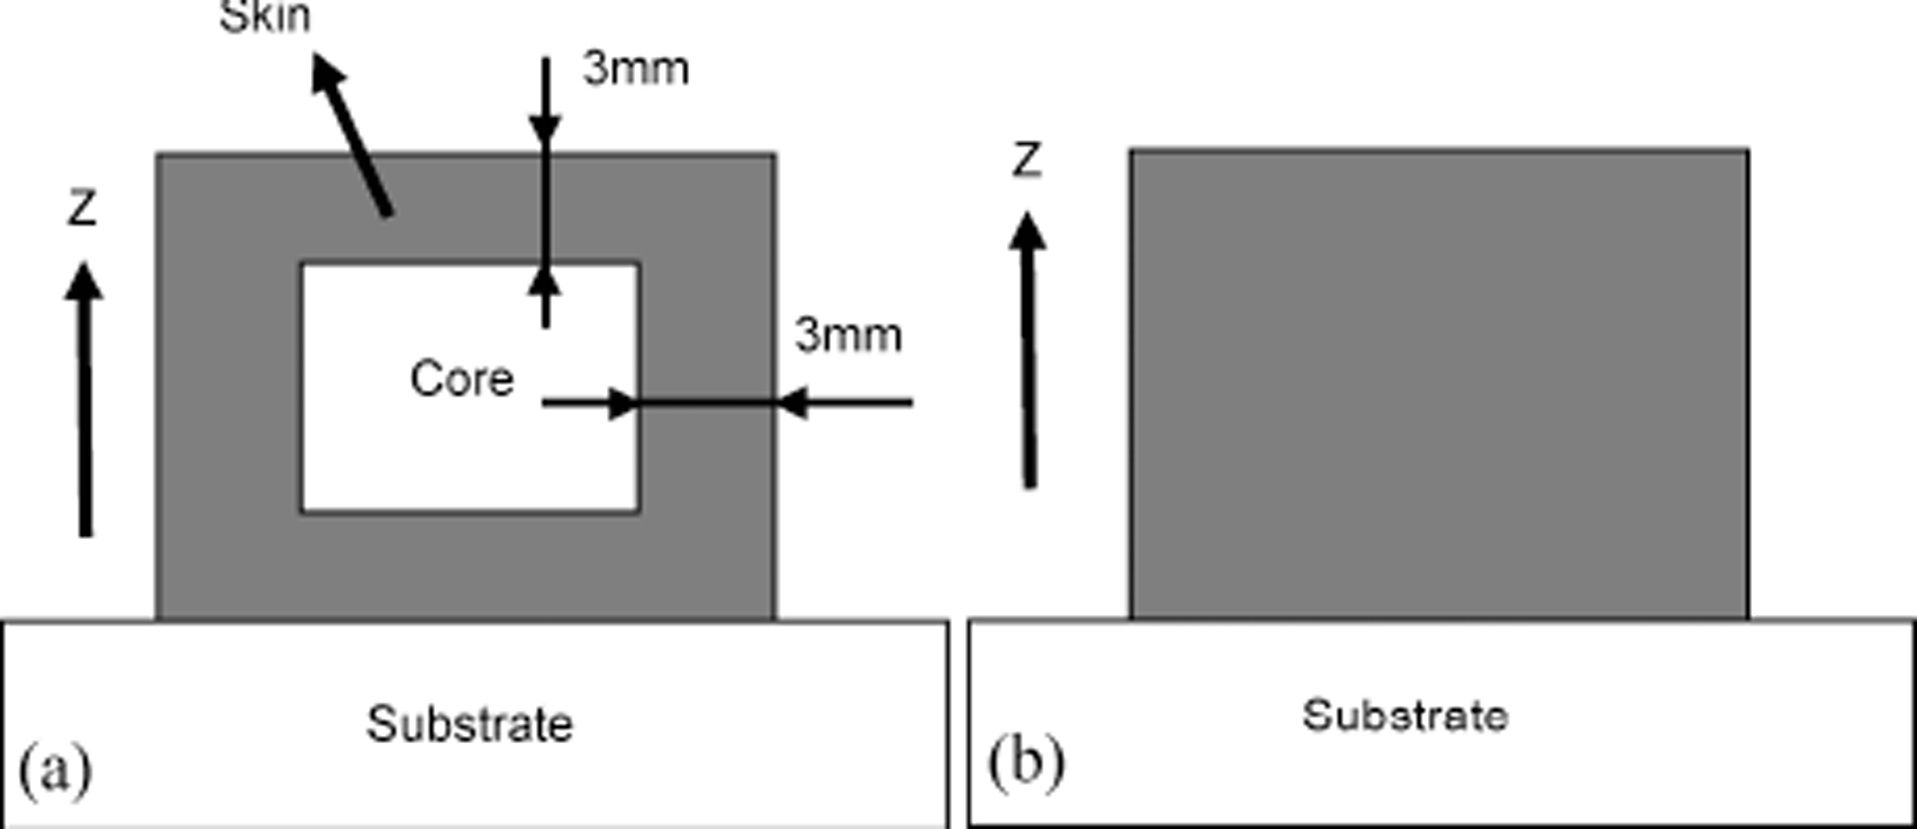
Schematic diagram of direct laser deposition (DLD) showing a core and skin configuration built using parameters with PSW 3·2 to produce an optimised surface finish and b simple blank configuration manufactured using constant conditions throughout with PSW 3·3
Several exposure types are available in EOS M270 machine. Figure 3 is the one laser scanning strategy used in the present study. During building, each layer is divided into several overlapping areas, which are successively scanned in stripes as indicated in Fig. 3. In the present study, the stripe width was 4 mm. Overlapping laser scans are carried out along these stripes one by one until the whole area is scanned. The scan spacing can be varied, and this parameter has been systematically examined in the present study. In the present work, successive layers have used identical scan paths, but of course, it is possible to vary these. The powder bed is lowered by 20 μm between successive layers. After completion of the whole layer of a build, the laser may be used to scan around the whole perimeter in a contour scan. The effect on the surface finish of contour scanning has been studied in the present work.
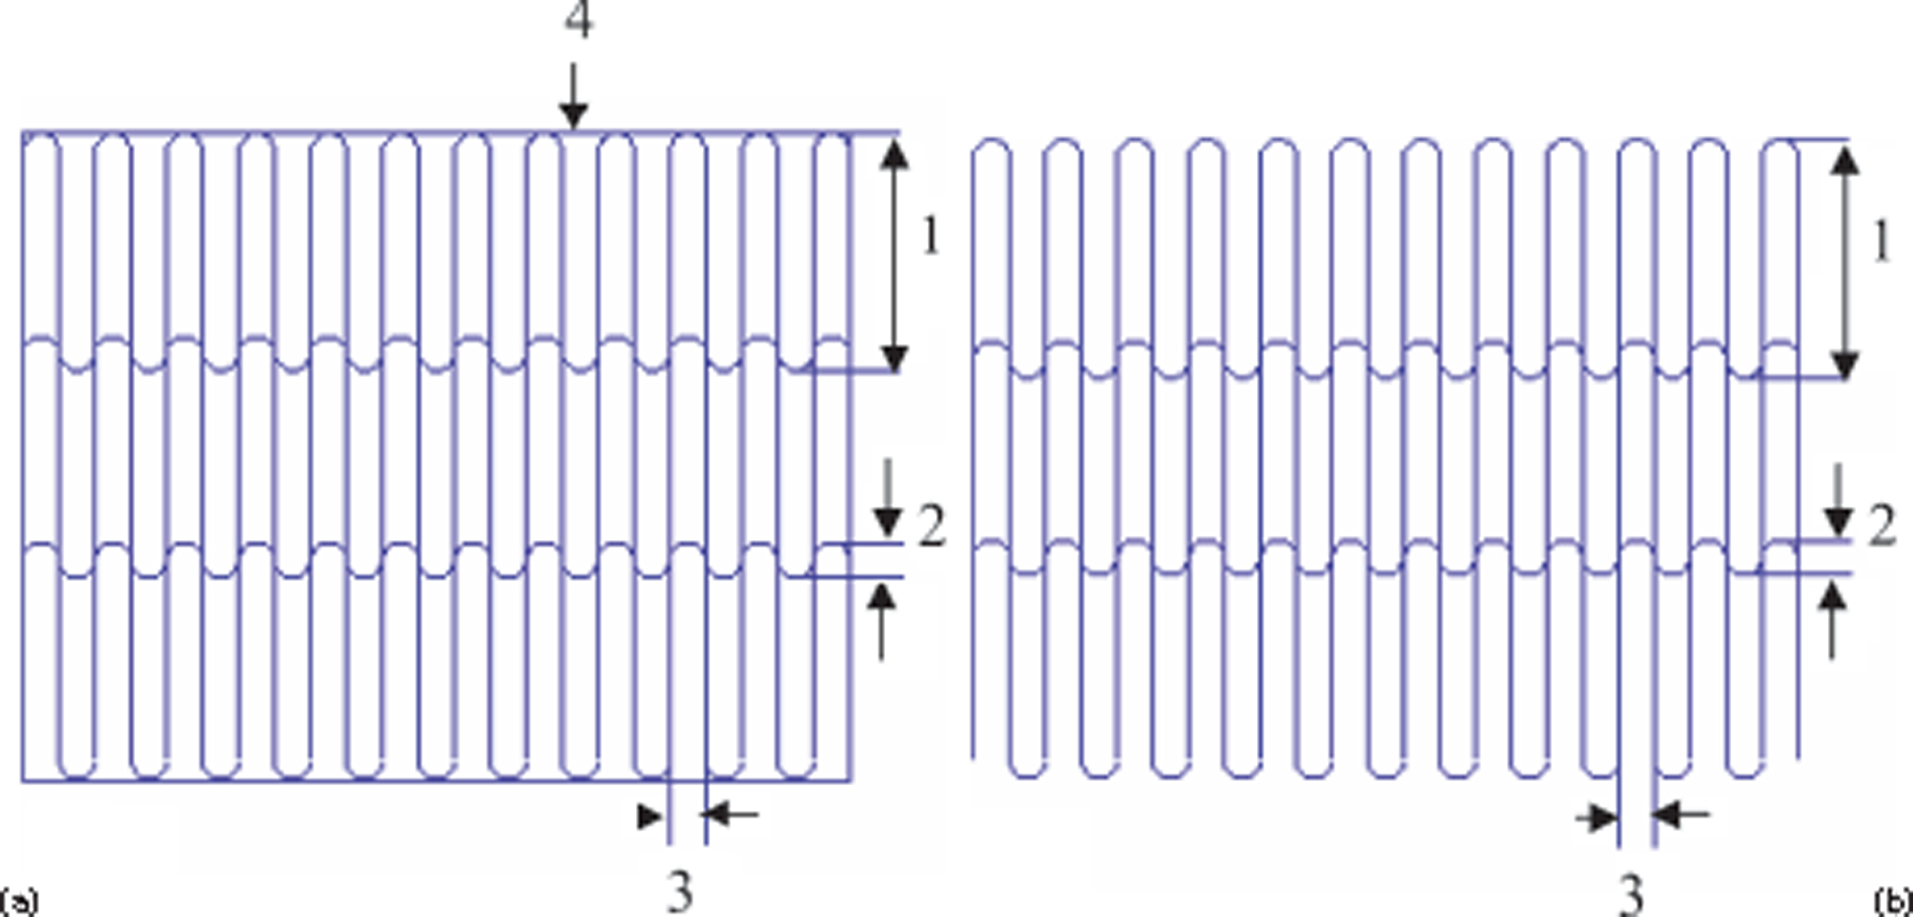
Schematic of laser exposure tracks used to make one layer of sample a with contour scan and b without contour scan: 1: stripe width; 2: overlap of stripes; 3: scan spacing or hatch distance; 4: contour
The substrates used in the laser powder bed facility are standard mild steel plates 250×250×35 mm supplied by EOS. These plates are milled and sand blasted and cleaned with acetone before use.
The experimental parameters have been changed systematically during the present study and parameters scaled to reference parameters, denoted as ‘ref’, e.g. dref as the reference scan spacing, have been used. The exact values of the parameters used are not quoted in the paper, as they are commercially sensitive. Samples of 10×10×12 mm were built as shown in Fig. 3 for study of microstructure, surface finish, build density and dimensional accuracy. Rectangular bars of 10×12×60 mm and cylinders of 10 mm in diameter and 60 mm in height were built, and tensile and fatigue samples were machined from these. The specimens used for four-point bend fatigue tests were built vertically as shown in Fig. 4b, and they are 10×10×63 mm rectangular (63 mm is the height) bars which were cut off from the baseplate using electrodischarge machining into 10×10×60 mm without any heat treatment.
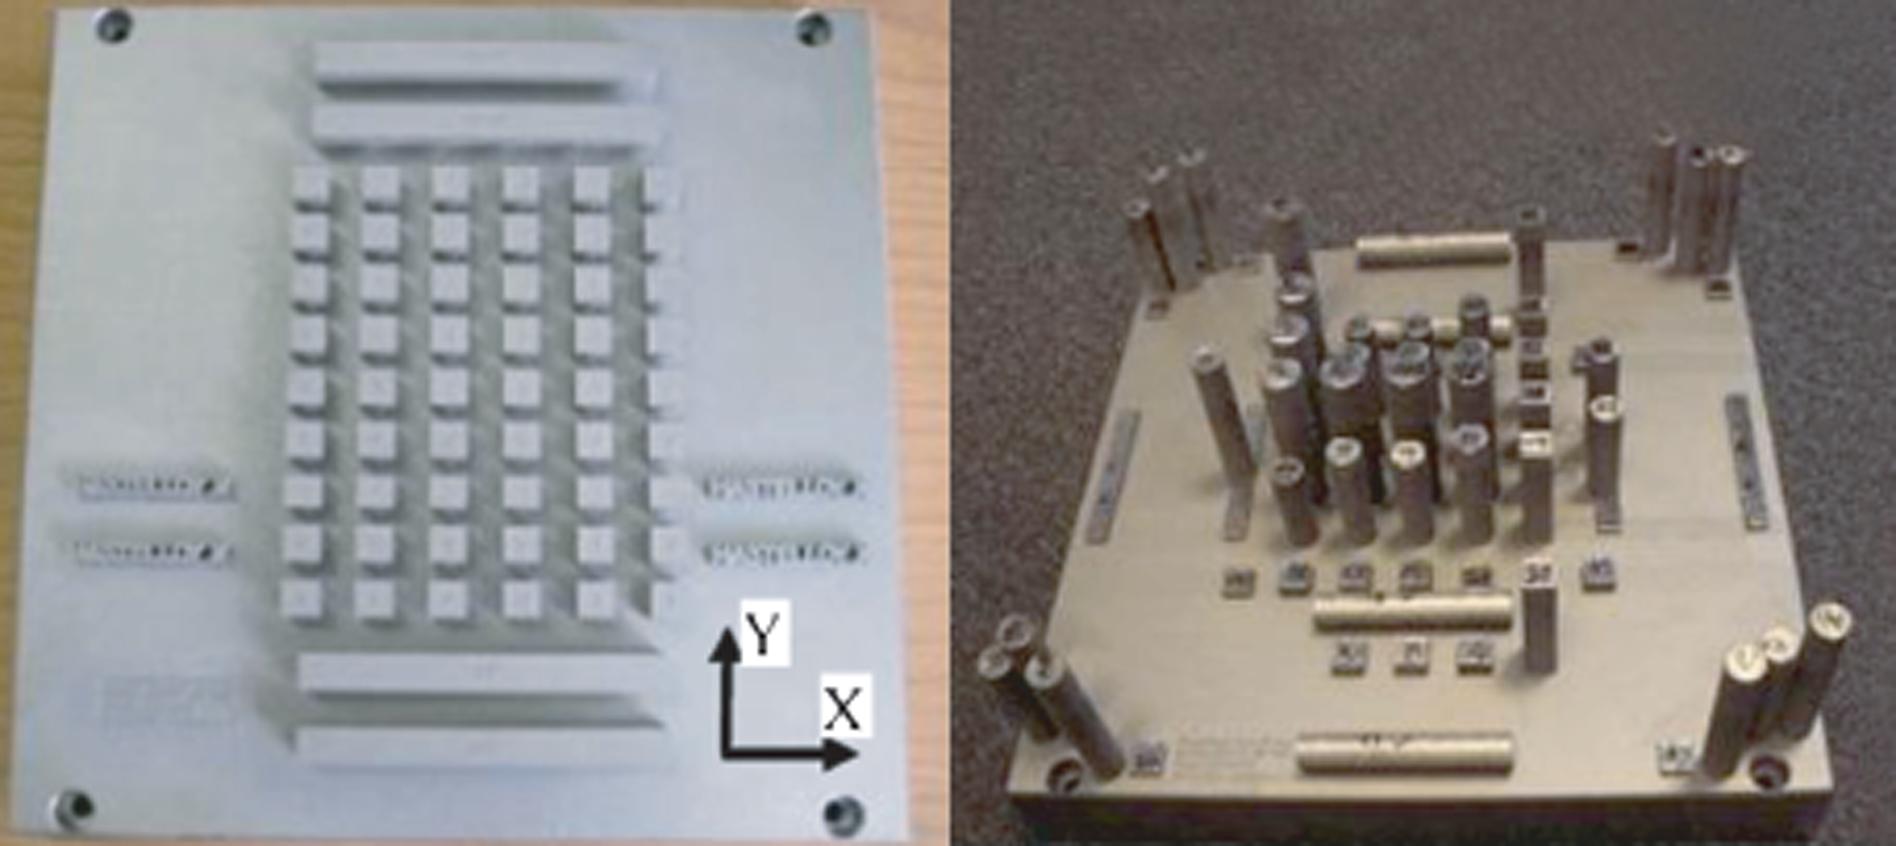
DLDed Hastelloy X samples manufactured for assessment
The density of the laser processed samples was measured by Archimedes method. The dimensional accuracy was measured by micrometer. For each sample, six different locations were measured. The measurements of surface roughness were carried out using a surface profilometer, which has a measurement accuracy of 2 μm. The measurement of the top surface concavity was carried out using a three-dimensional laser scanner, which has a measurement accuracy of 8 μm.
Sections were cut along the X–Z or Y–Z plane, which are parallel to the building direction and X–Y plane, which is perpendicular to the building direction, were mounted, ground and polished for optical and SEM examination.
Tensile tests at room temperature were carried out with a Zwick/Z100 screw drive machine with a 200 kN load cell at a strain rate of ∼10−4 s−1. Initially, the tensile samples were heat treated at 1175°C/30 min using blown air to relieve the thermal residual stress before testing, but once the optimum process conditions were identified, no post-build treatments were used. Four-point fatigue has been carried out using an Amsler Vibrophone with a frequency of ∼100 Hz. The samples used for fatigue testing were manufactured using the optimum condition, and post-heat treatment was not used in consideration of the cost saving required in commercial production. However, some fatigue samples were hot isostatically pressed (HIPped) after DLD to assess the upper limit of the fatigue performance of DLDed material. Some samples were HIPped at 1107°C, at a pressure of 100 MPa for 4 h before being assessed.
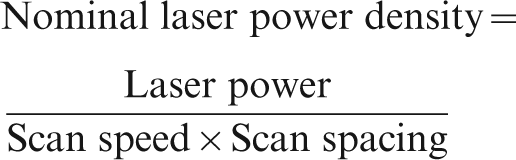
In the design of the experiments laser power, scan speed and scan spacing can be changed independently or simultaneously. To be able to compare the data obtained under different conditions, a term referred to as the nominal power density was introduced for each condition used; this term was calculated in unit of J mm−2 and was obtained by dividing the power in Watts, by the scan speed in mm s−1 and by the scan spacing in millimetres
Results
Chemical analysis
Table 2 shows the analyses of a DLDed sample, and comparing Table 1 with Table 2, it can be seen that there is no significant oxygen or nitrogen pick-up during the DLD process even though the atmosphere of the chamber is nitrogen.
Measured chemical composition of direct laser deposited Hastelloy X, wt-

Influence of processing parameters on dimensional accuracy
The influence of contour scan on dimensional accuracy was measured as a function of nominal laser power density, obtained by varying only the scan speed, and the results shown in Fig. 5 are for measurements in the X scan direction only, since the influence on the Y scan direction was identical. For all nominal power densities used, the results with and without a contour scan are similar, and good consistency is observed in the results among those conditions; in either case, the discrepancy is ∼0·1 mm between the aimed at and the achieved X dimensions. Surprisingly, the scatter about the average dimension was less in the sample made without a contour scan.
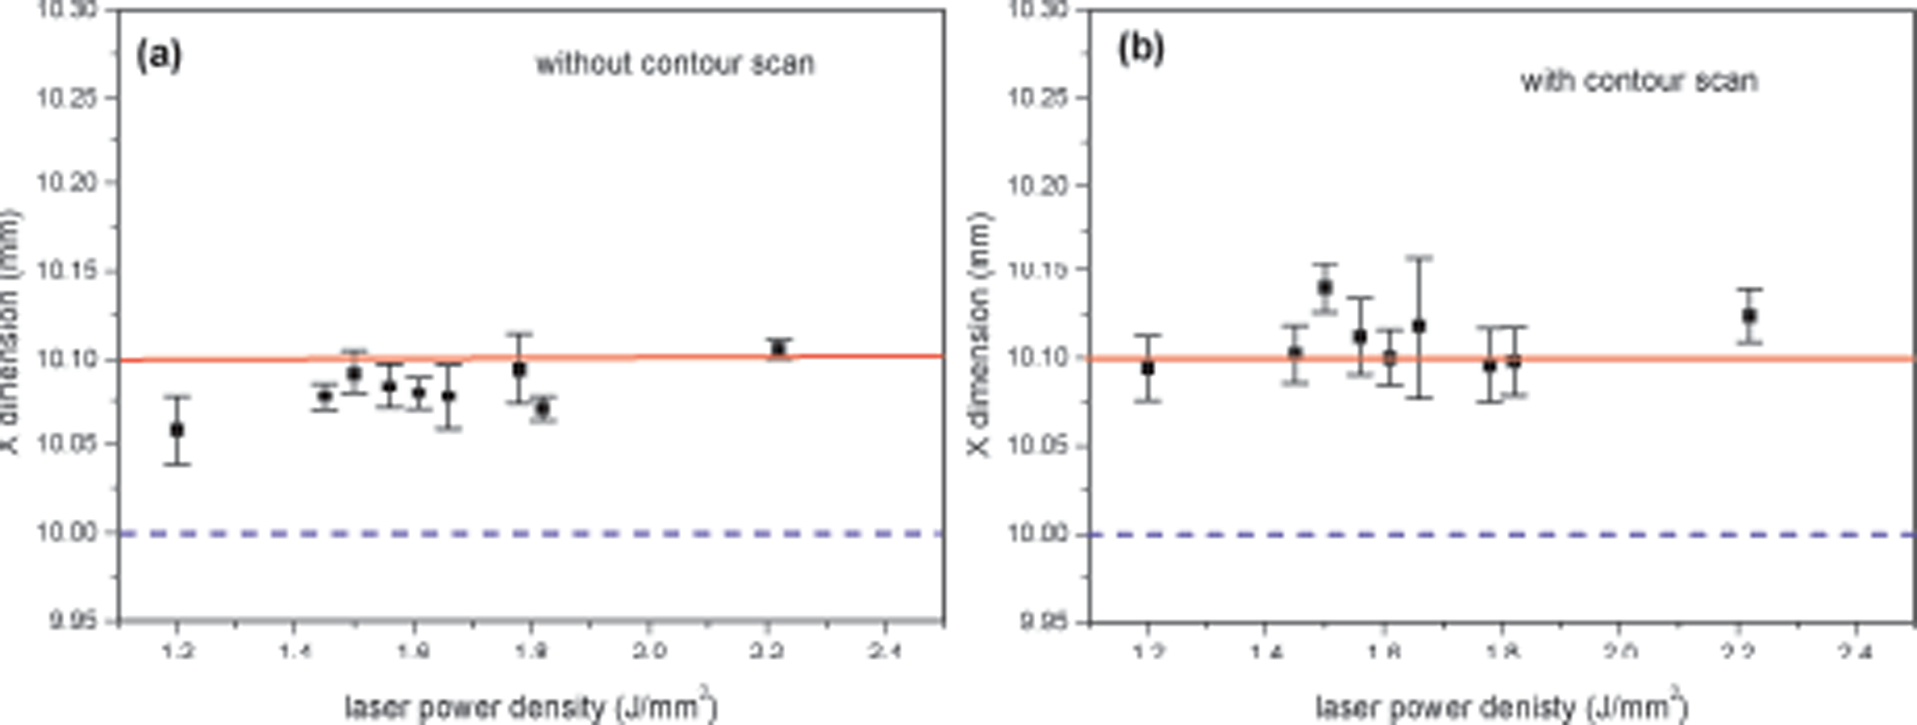
a without contour scan; b with contour scan
Figure 6 shows data obtained without using a contour scan as a function of nominal power density, but in this case, the various values of power density were obtained by varying independently the other variables, scan speed, scan spacing and laser power. In this case, the scatter was much worse with discrepancies of over 0·2 mm being found.
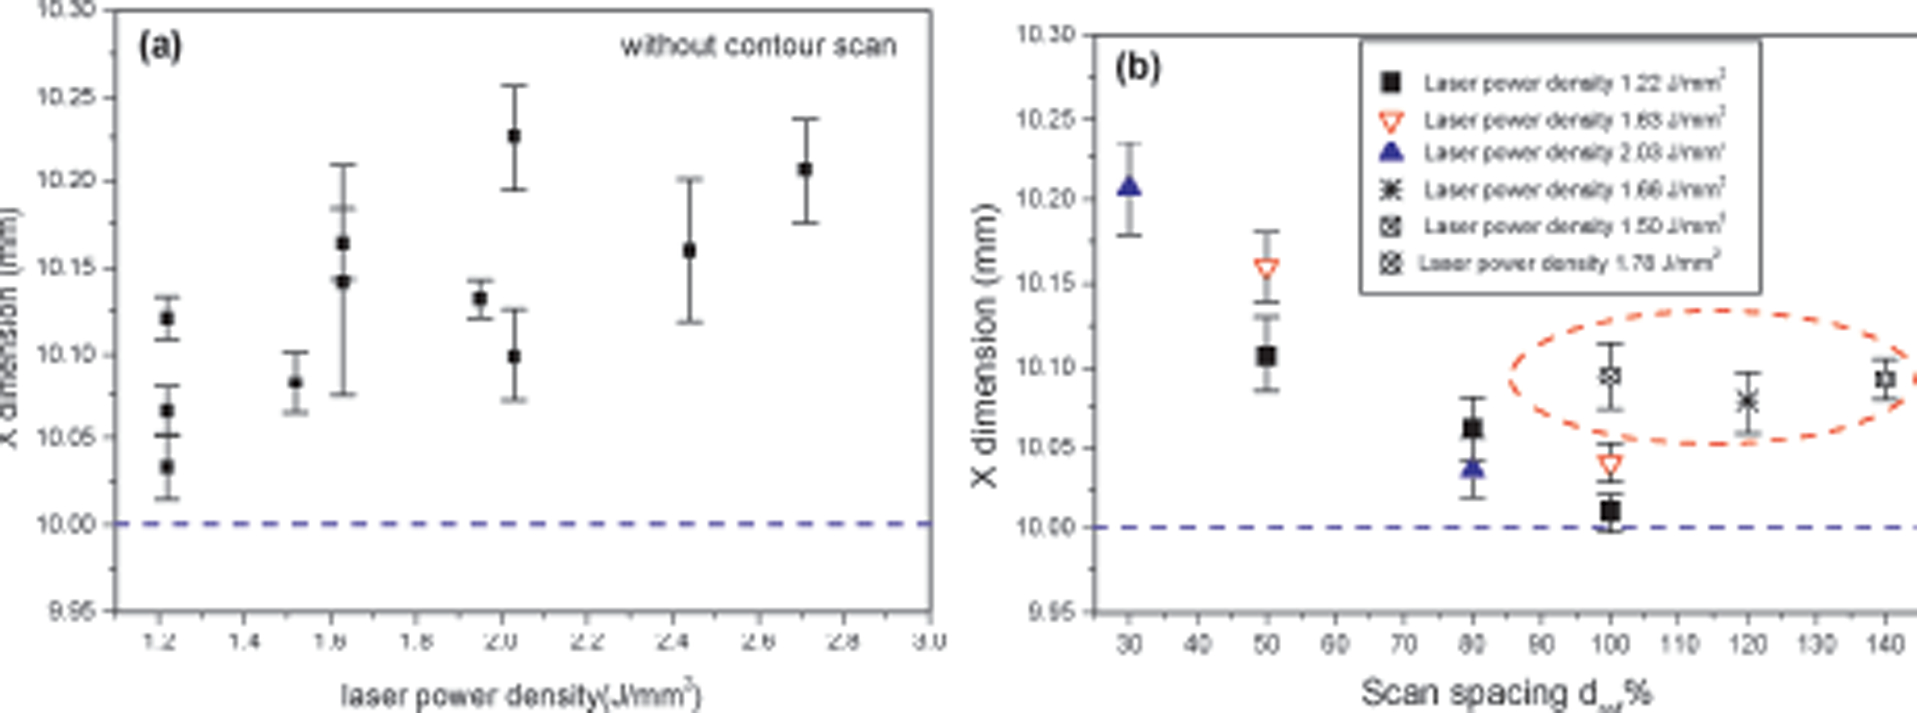
a variation in X dimension of build as function of nominal laser power density with variation in power density being obtained by varying several variables simultaneously and b variation in X dimension as function of scan spacing: data shown in this figure are taken from that shown in Figs. 5 and 6a; again, preset dimension was 10 mm and is shown as dotted line
Some of the data in Fig. 5a and b and in Fig. 6a are replotted against scan spacing as shown in Fig. 6b, and it is obvious that the dimensional accuracy is strongly influenced by the range of scan spacing used. The selected data from Fig. 5b are circled by the dotted line in Fig. 6b. Comparing the dimensions under the same scan spacing, it can be seen that there is a small systematic error between different batches of samples, but in general, it shows that dimensional accuracy is poor, when the scan spacing is very small, and the accuracy improves with increasing scan spacing up to 100 dref, where the optimum accuracy is achieved. With further increasing scan spacing beyond 100 dref, the dimensional accuracy appears to remain similar. These results suggest that the optimum accuracy is obtained with the lowest laser power at a scan spacing of 100 dref.
Influence of processing parameters on surface roughness
The influence of nominal laser power density on surface roughness is shown in Fig. 7 for samples produced with and without a contour scan. The distance between the peak and trough Rmax is plotted against nominal laser power density in Fig. 7a, and the average of the surface roughness profile Ra is plotted in Fig. 7b. It is clear that both Rmax and Ra are reduced, if a contour scan is used and that for this condition, these two parameters are not obvious functions of nominal laser power density. However, if no contour scan is used, both parameters increase with increasing nominal laser power density, and the data all lie above those obtained with a contour scan. Figure 7 shows that with contour scan, the average roughness is ∼7 μm, and the peak to trough roughness is ∼50 μm. Without contour scan, the roughness increases, where Ra is 10–11 μm and Rmax is 85–115 μm.
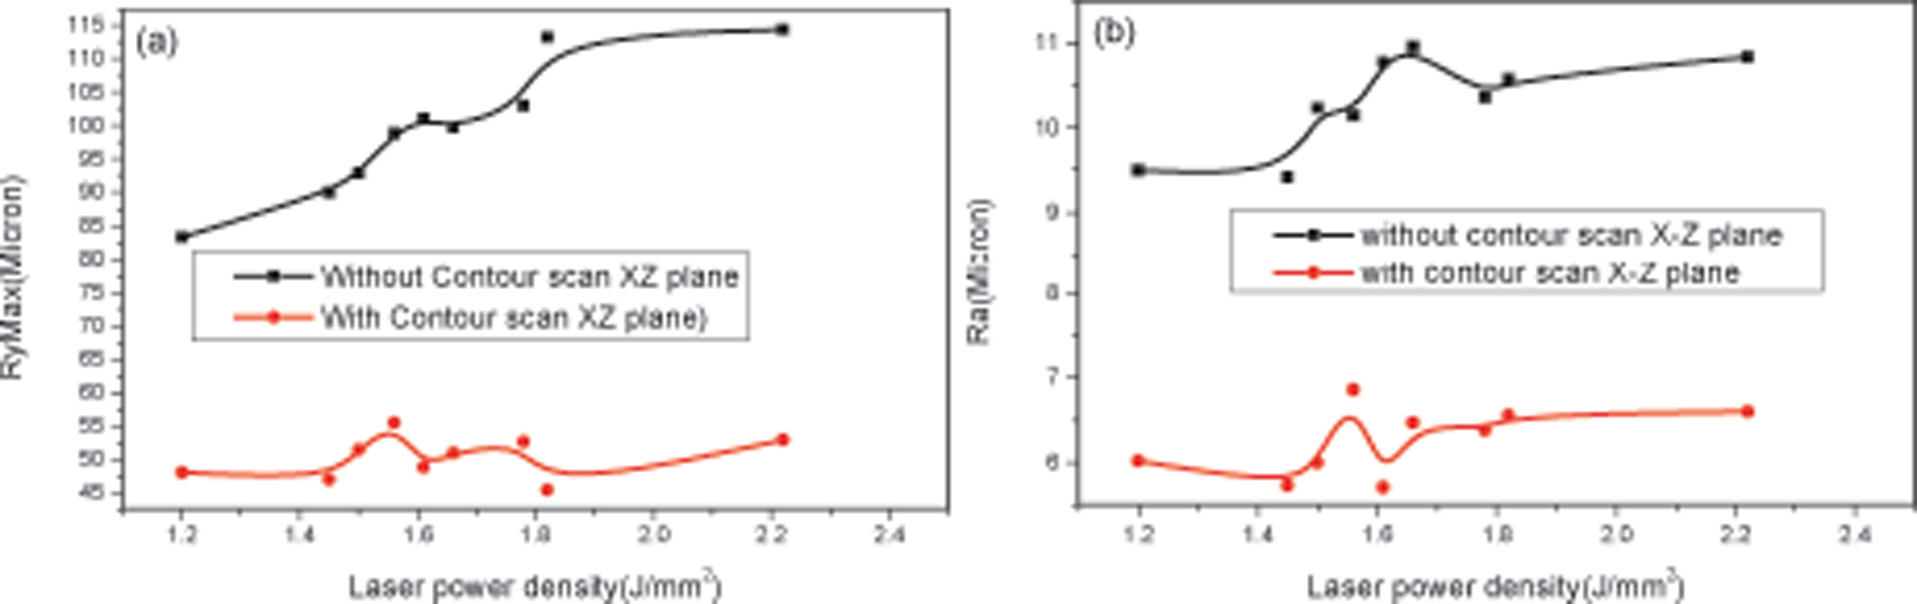
a maximum height between adjacent troughs and valleys Rmax; b average surface roughness Ra
When the average roughness is plotted against scan spacing and scan speed (Fig. 8), it is seen that there is a large scatter in the measurements but that at values above 100 dref, the optimum surface roughness is observed. A similar effect is observed with Rmax. The roughness is also affected by scan speed (Fig. 8b), and within the range of the scan speeds investigated, it appears that the roughness increases with increasing scan speed, although the scatter in the measurements is again large.
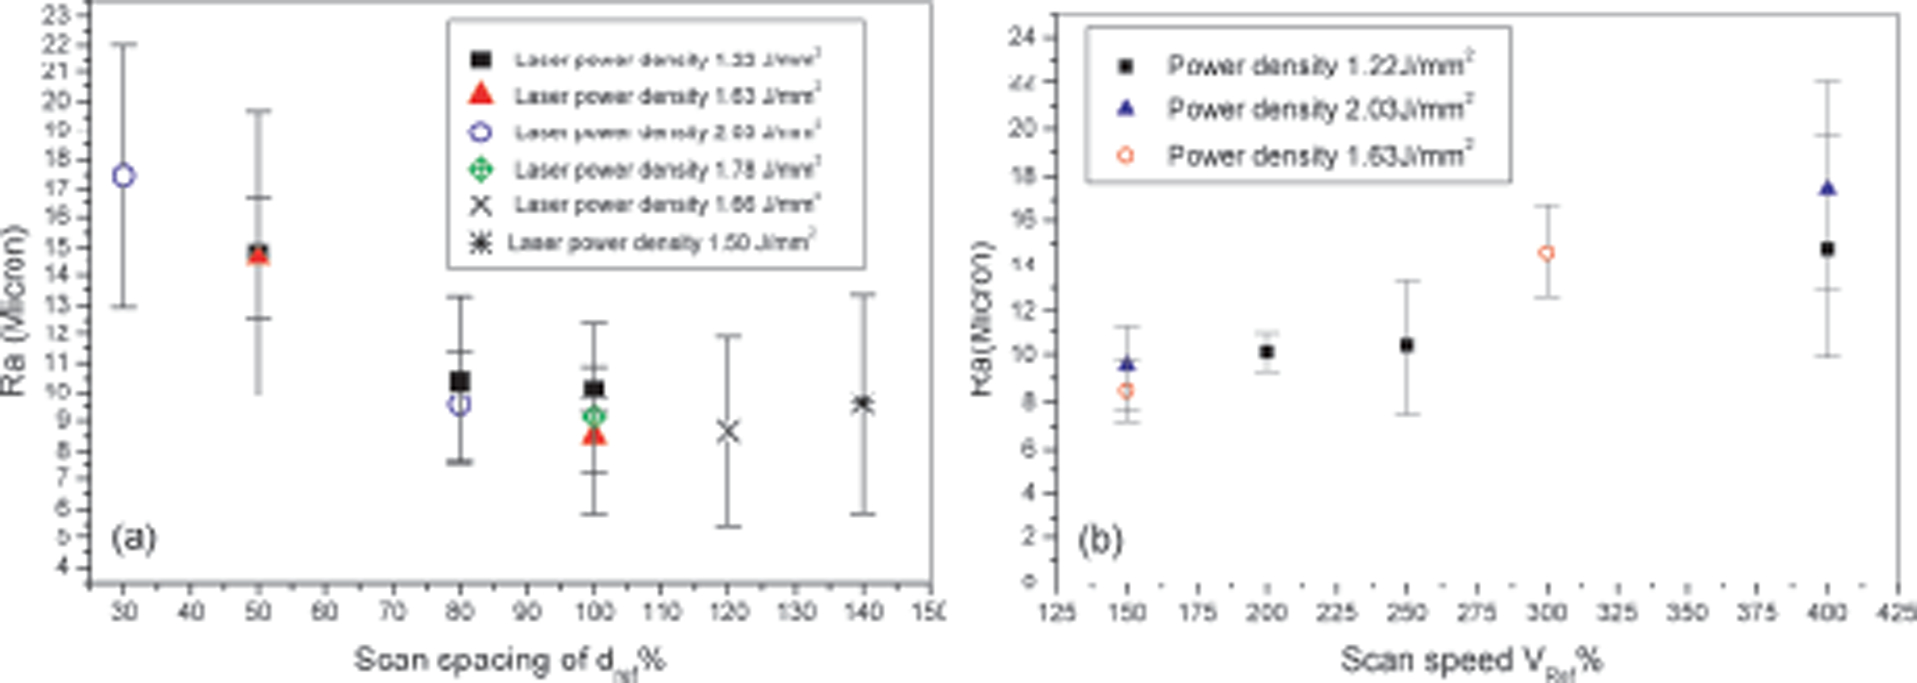
Average roughness of side surface (X–Z plane) a as function of scan spacing and b as function of scan speed
Figure 9 shows examples of XZ cross-sections of samples fabricated using 30 and 100 dref scan spacing, which correspond to the worst and the best surface roughness respectively, as indicated in Fig. 8a. It appears that at the smaller scan spacing, the profile of the melt bead is more arch shaped than that at a larger scan spacing; however, care must be taken when comparing the profiles of the bead and the overlapping, as they are affected by the cutting angle during the metallographic sample preparation. The edge of the samples (arrowed) shows the cross-section profile, where the roughness measurement is carried out, and from those pictures, it is very difficult to see any difference. The detailed measurements of the roughness profile for those two surfaces are shown in Fig. 9c, and it is evident that for a small scan spacing of 30 dref, the roughness is relatively high.
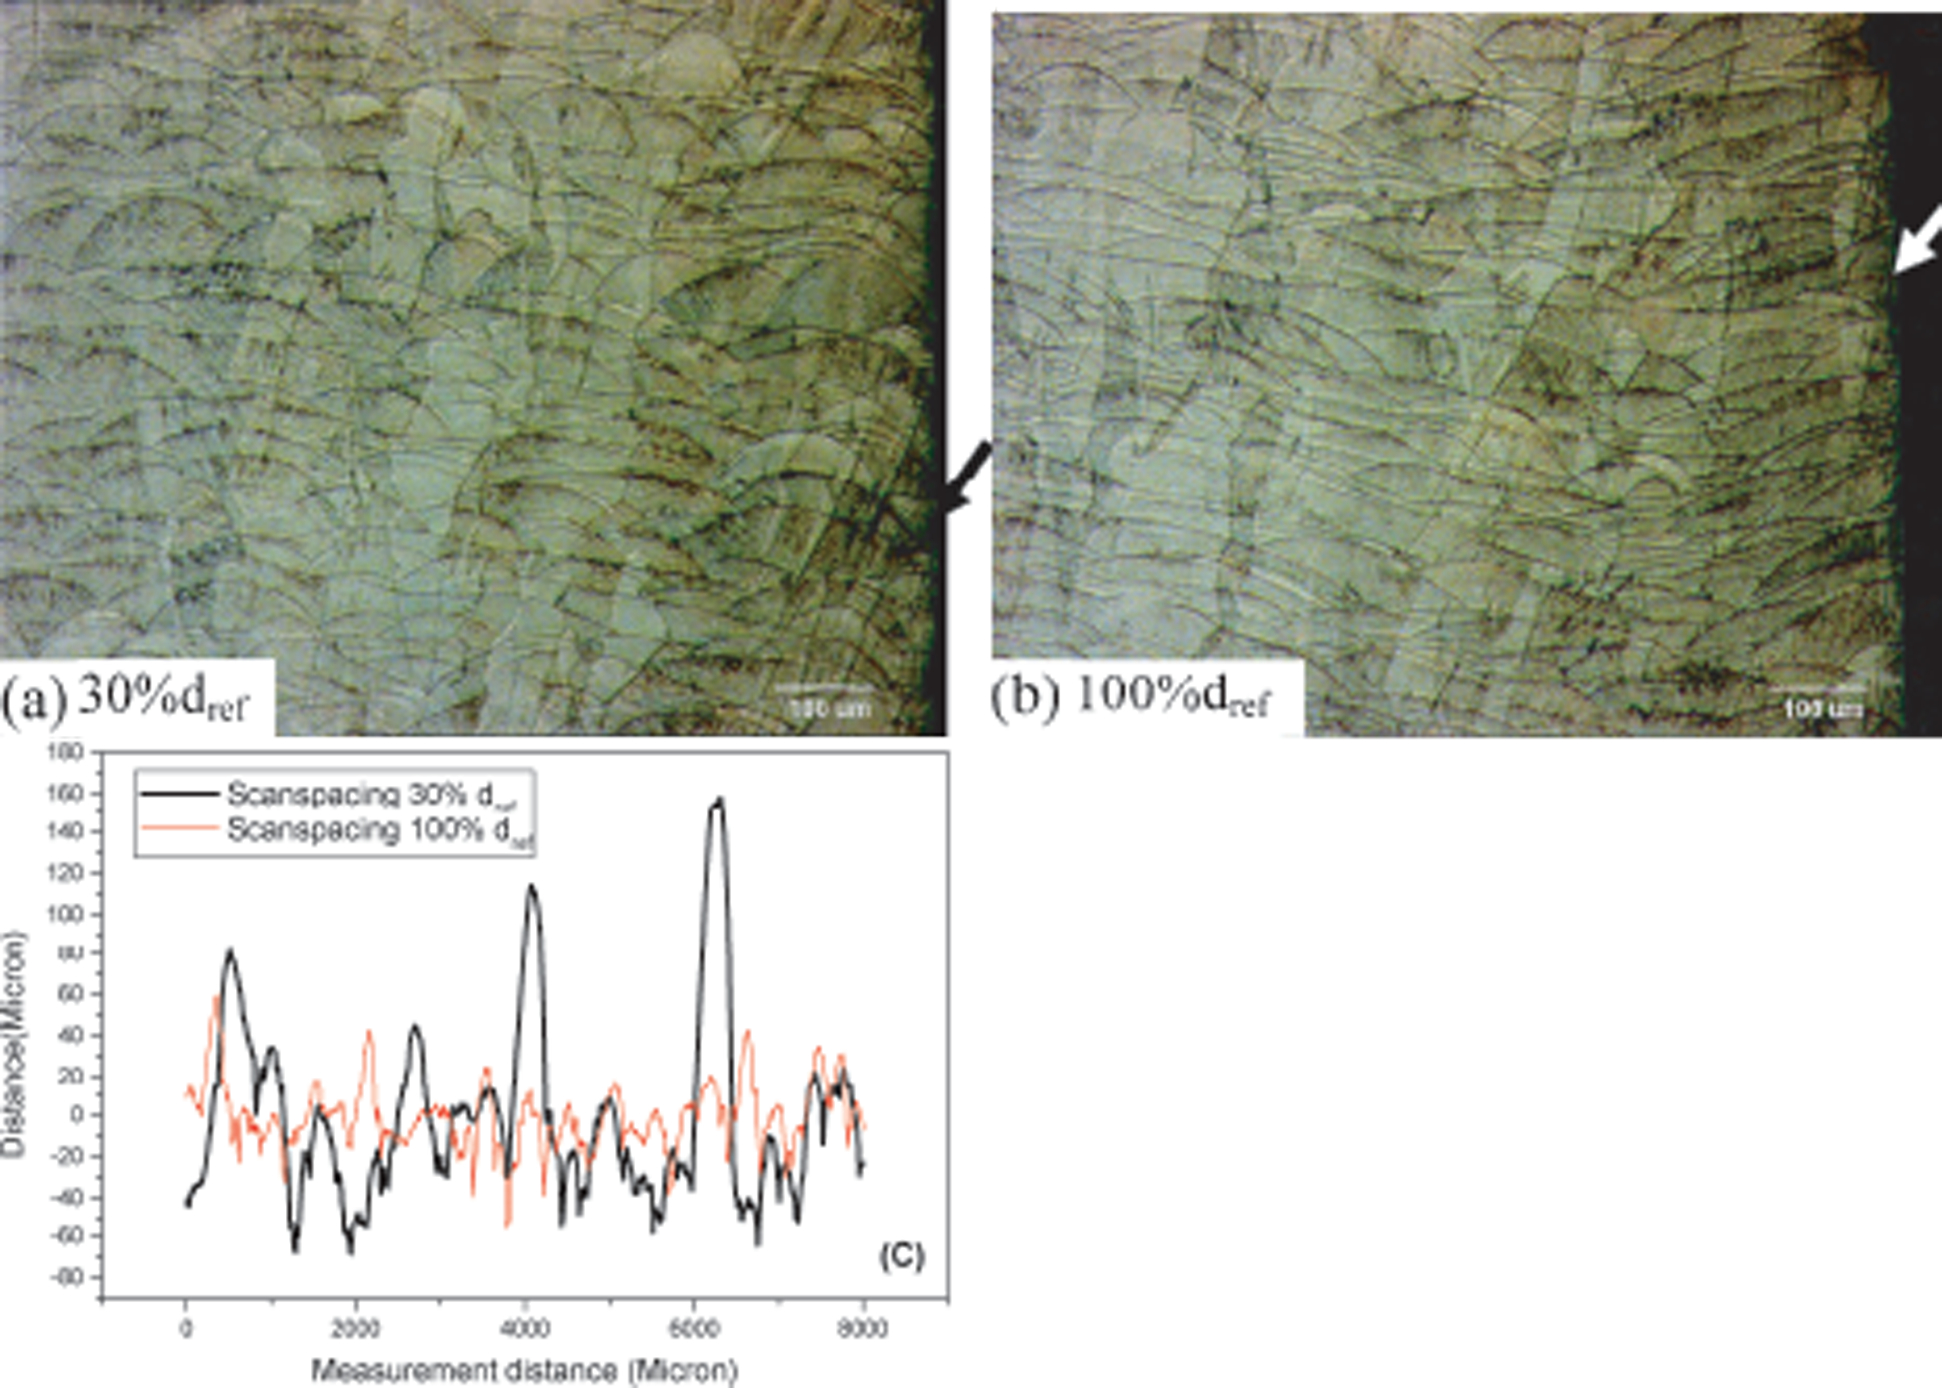
XZ cross-sections of samples manufactured using a 30 and b 100 dref scan spacing: vertical side surfaces of these sections are arrowed, and c profiles of these two surfaces
Influence of process parameters on top surface concavity
It has been found that the top surface concavity generated during the DLD process can be critical to a build. When a large meniscus occurs, a build has to be interrupted, as it stops further smooth addition of powder on top of the build. It is thus essential to understand the influence of the processing parameters on the top surface concavity. An example of a meniscus on the top surface of a build is shown in Fig. 10.
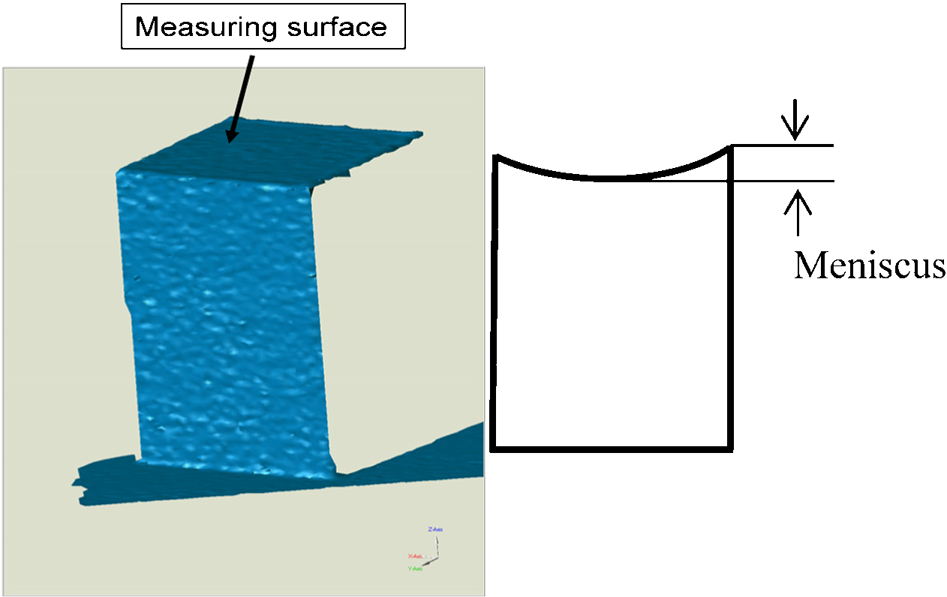
Half of top surface which is used to measure surface concavity
Figure 11 shows the meniscus under a range of laser power densities, and it can be seen that the meniscus is smaller when the laser power density is smaller than 1·5 J mm−2. Above a laser power density of 1·5 J mm−2, the meniscus is large and similar under all the laser power densities investigated. It was also noted that meniscus is not influenced by the laser scan spacing or scan speed.
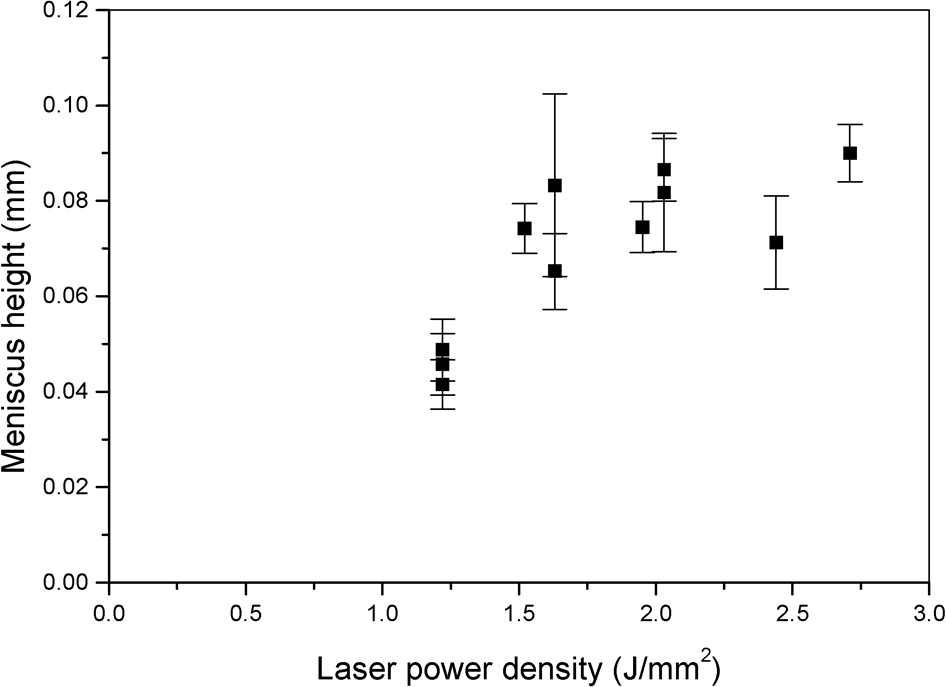
Influence of laser power density on meniscus height on top surface of block sample
Note that the above meniscus measurement is carried out for samples with a height of 15 mm. The meniscus for a given manufacturing condition varies with the sample height because the cooling rate has a significant effect on the meniscus, and the cooling rate varies with increasing height. Further work is needed to understand the influence of laser power density and sample height on meniscus.
Influence of processing procedures on density
Figure 12a shows that a larger scatter in density and lower density are obtained if the core and skin structure is used, and macrostructure examination has shown that porosity tends to occur at the interface between the core and skin. Figure 12b shows the density obtained under a range of nominal laser power density using a simple blank building structure. It can be seen that when the nominal laser power density is above 1·5 J mm−2, the density is better than 99·5. Further increase in laser power density increases the density slightly, but it never reaches the full density, which is obtained from the sample, which has been fully densified through HIPping (Fig. 12). When the nominal laser power density is smaller than 1·5 J mm−2, the density is significantly lower, which is attributed to numerous pores in the samples (Fig. 13), while the lack of full density at high laser power densities is attributed to a high density of cracks as shown in the following section.
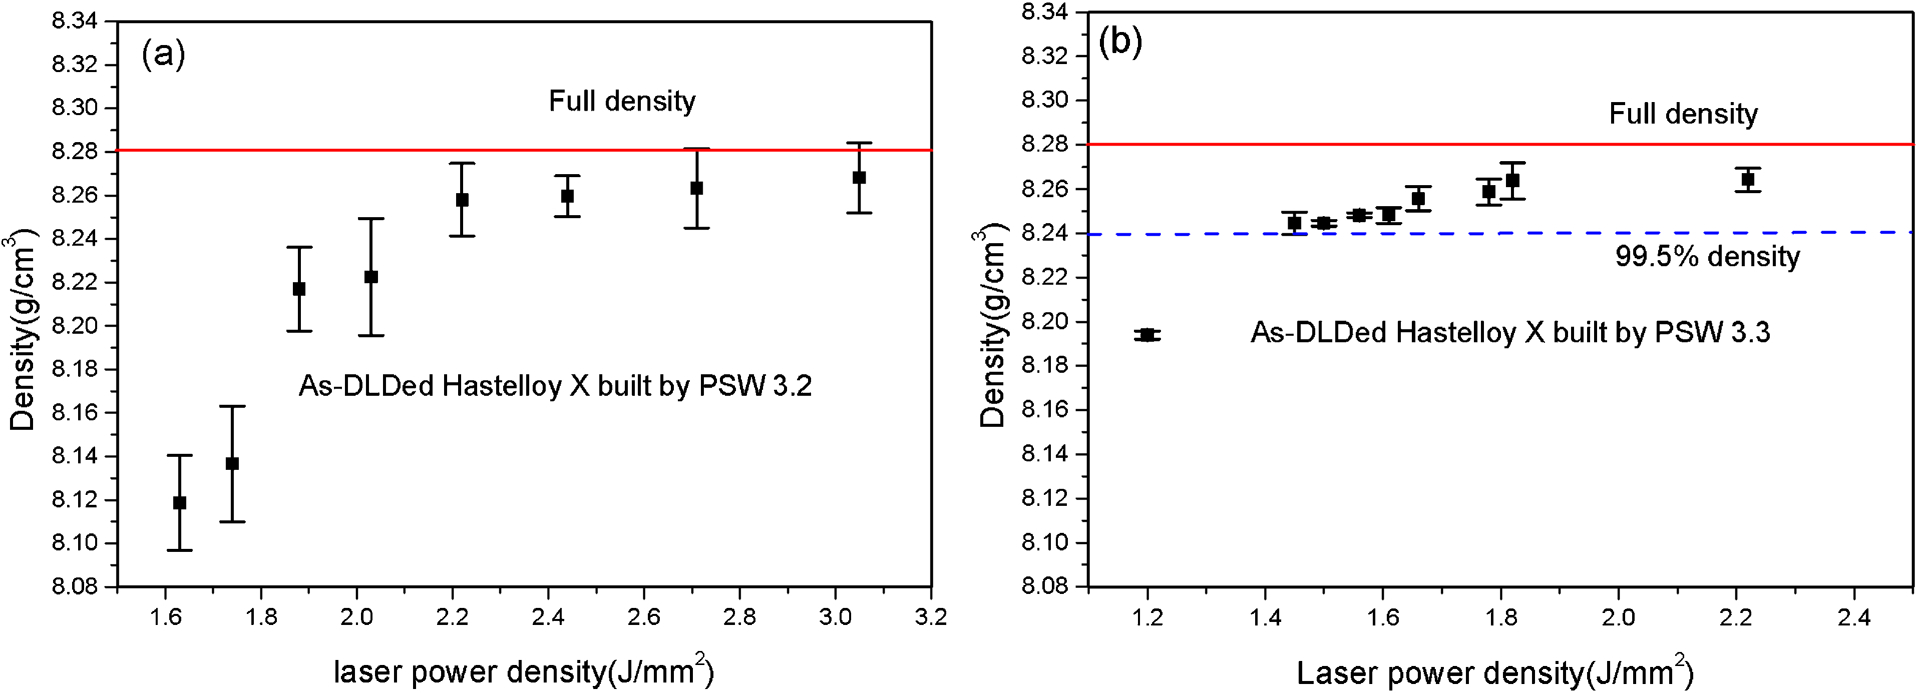
a density obtained using core and skin construction structure; b density obtained using simple blank construction structure
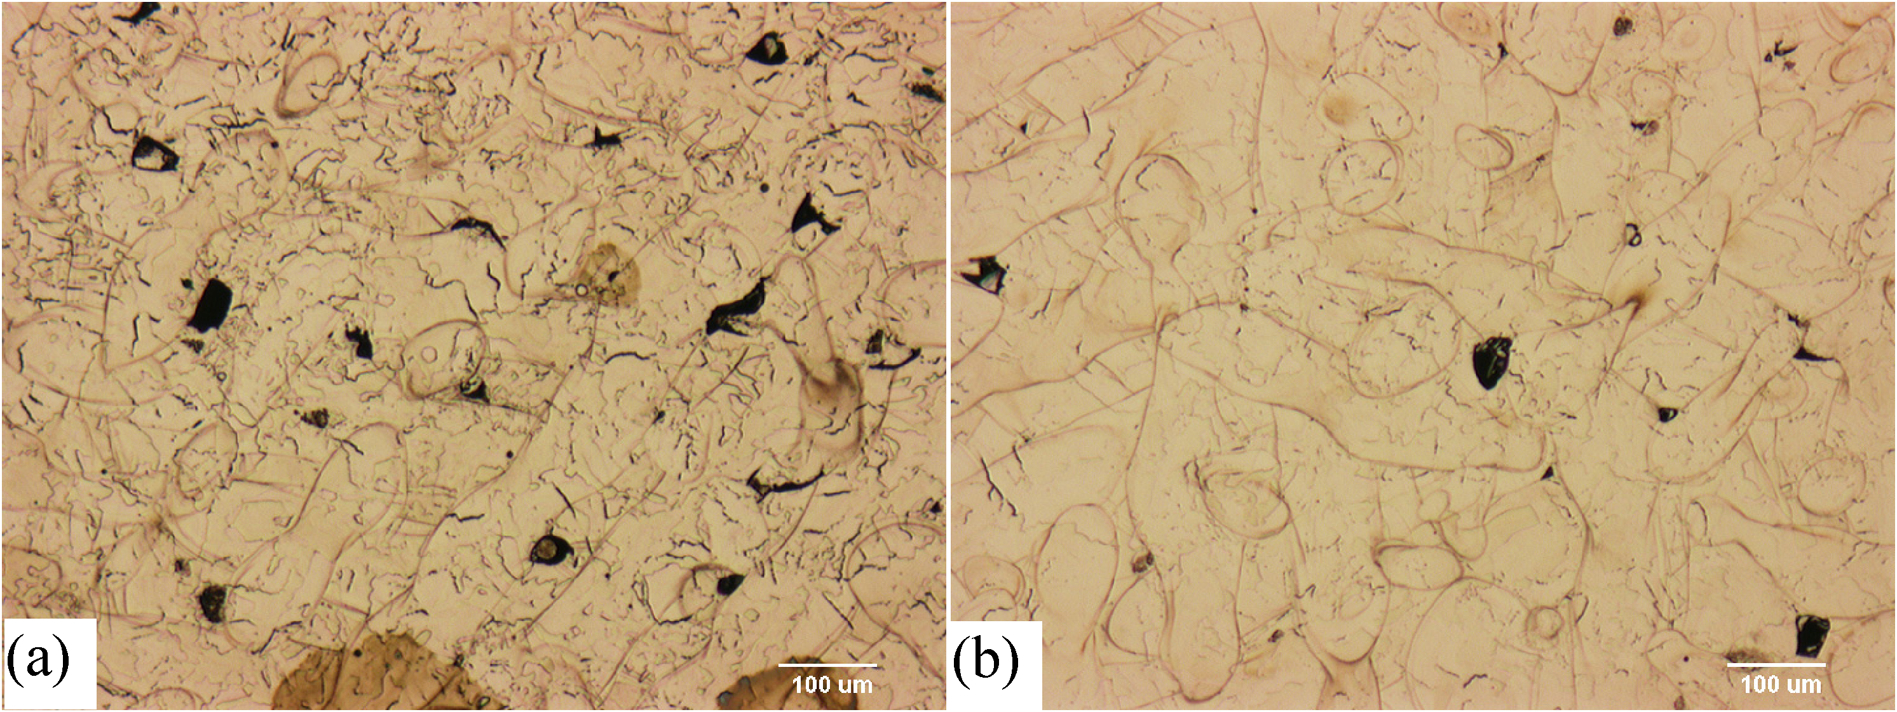
Optical images of samples processed using laser power density smaller than 1·5 J mm−2 taken a from edge and b from centre: dark regions are large pores
Influence of processing conditions on cracking
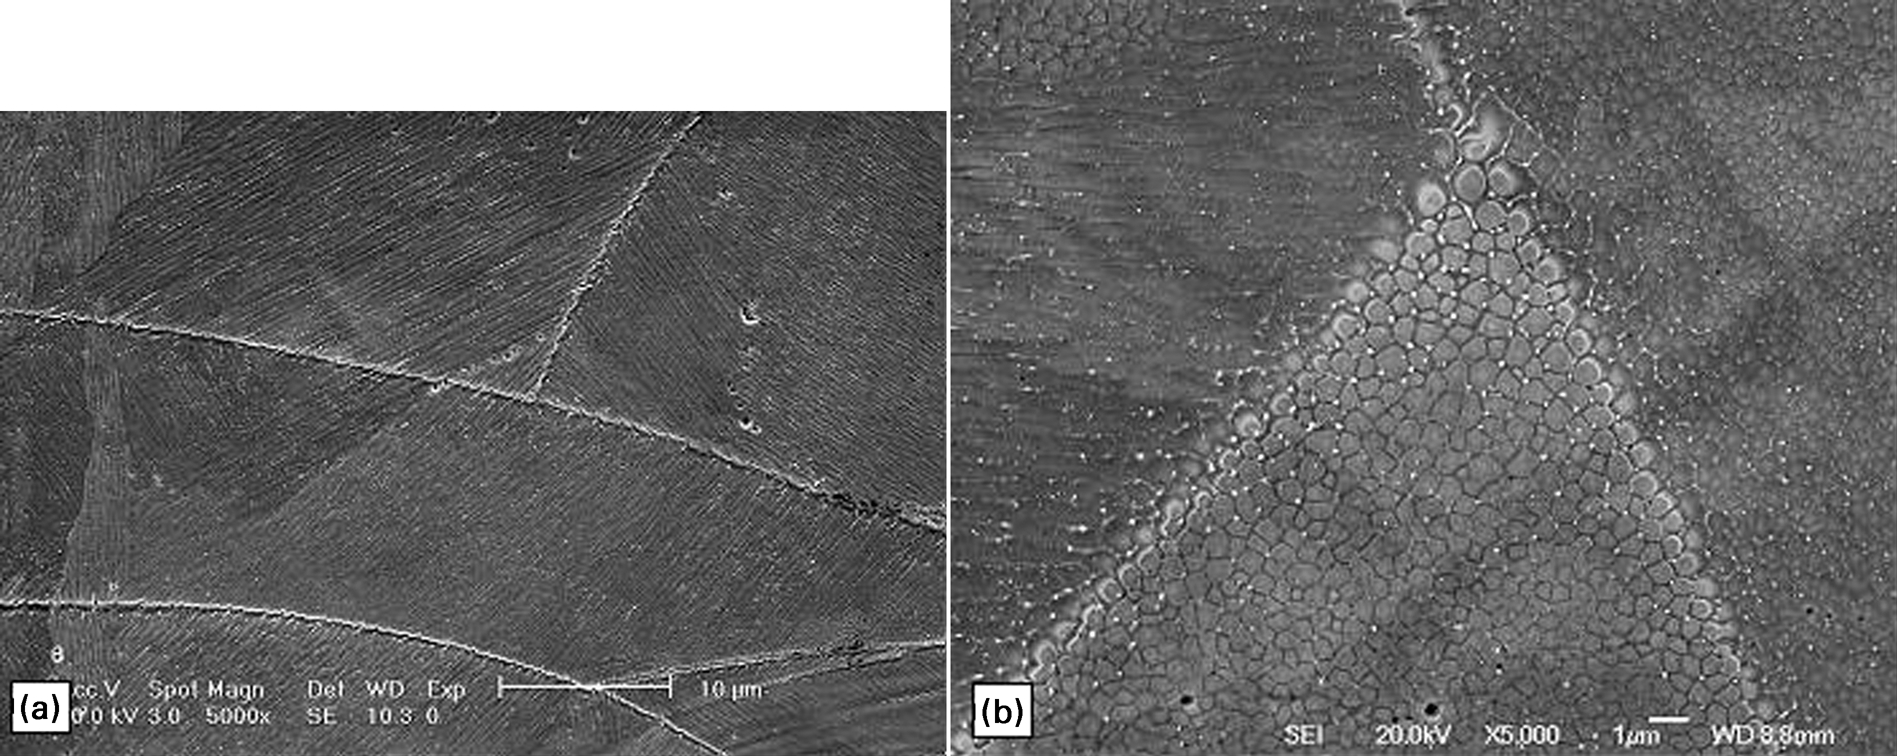
Cracks which are up to 100 μm long and 100 μm deep have been observed in the direct laser deposited Hastelloy X samples manufactured under all the conditions investigated. Typical images of cracked samples at different positions along the height in the XZ plane (i.e. along the building direction) are shown in Fig. 14a, c and d and cross-section (XY section) in Fig. 14b. The cracks appear to be perpendicular to the bead profile as shown in Fig. 14a and d but random on the cross-section (Fig. 14b). There are a higher number of cracks at the corners of a sample than at the centre. It is noted that the crack density at Z = 1 mm (Fig. 14a) is similar to that at Z = 10 mm (Fig. 14d).
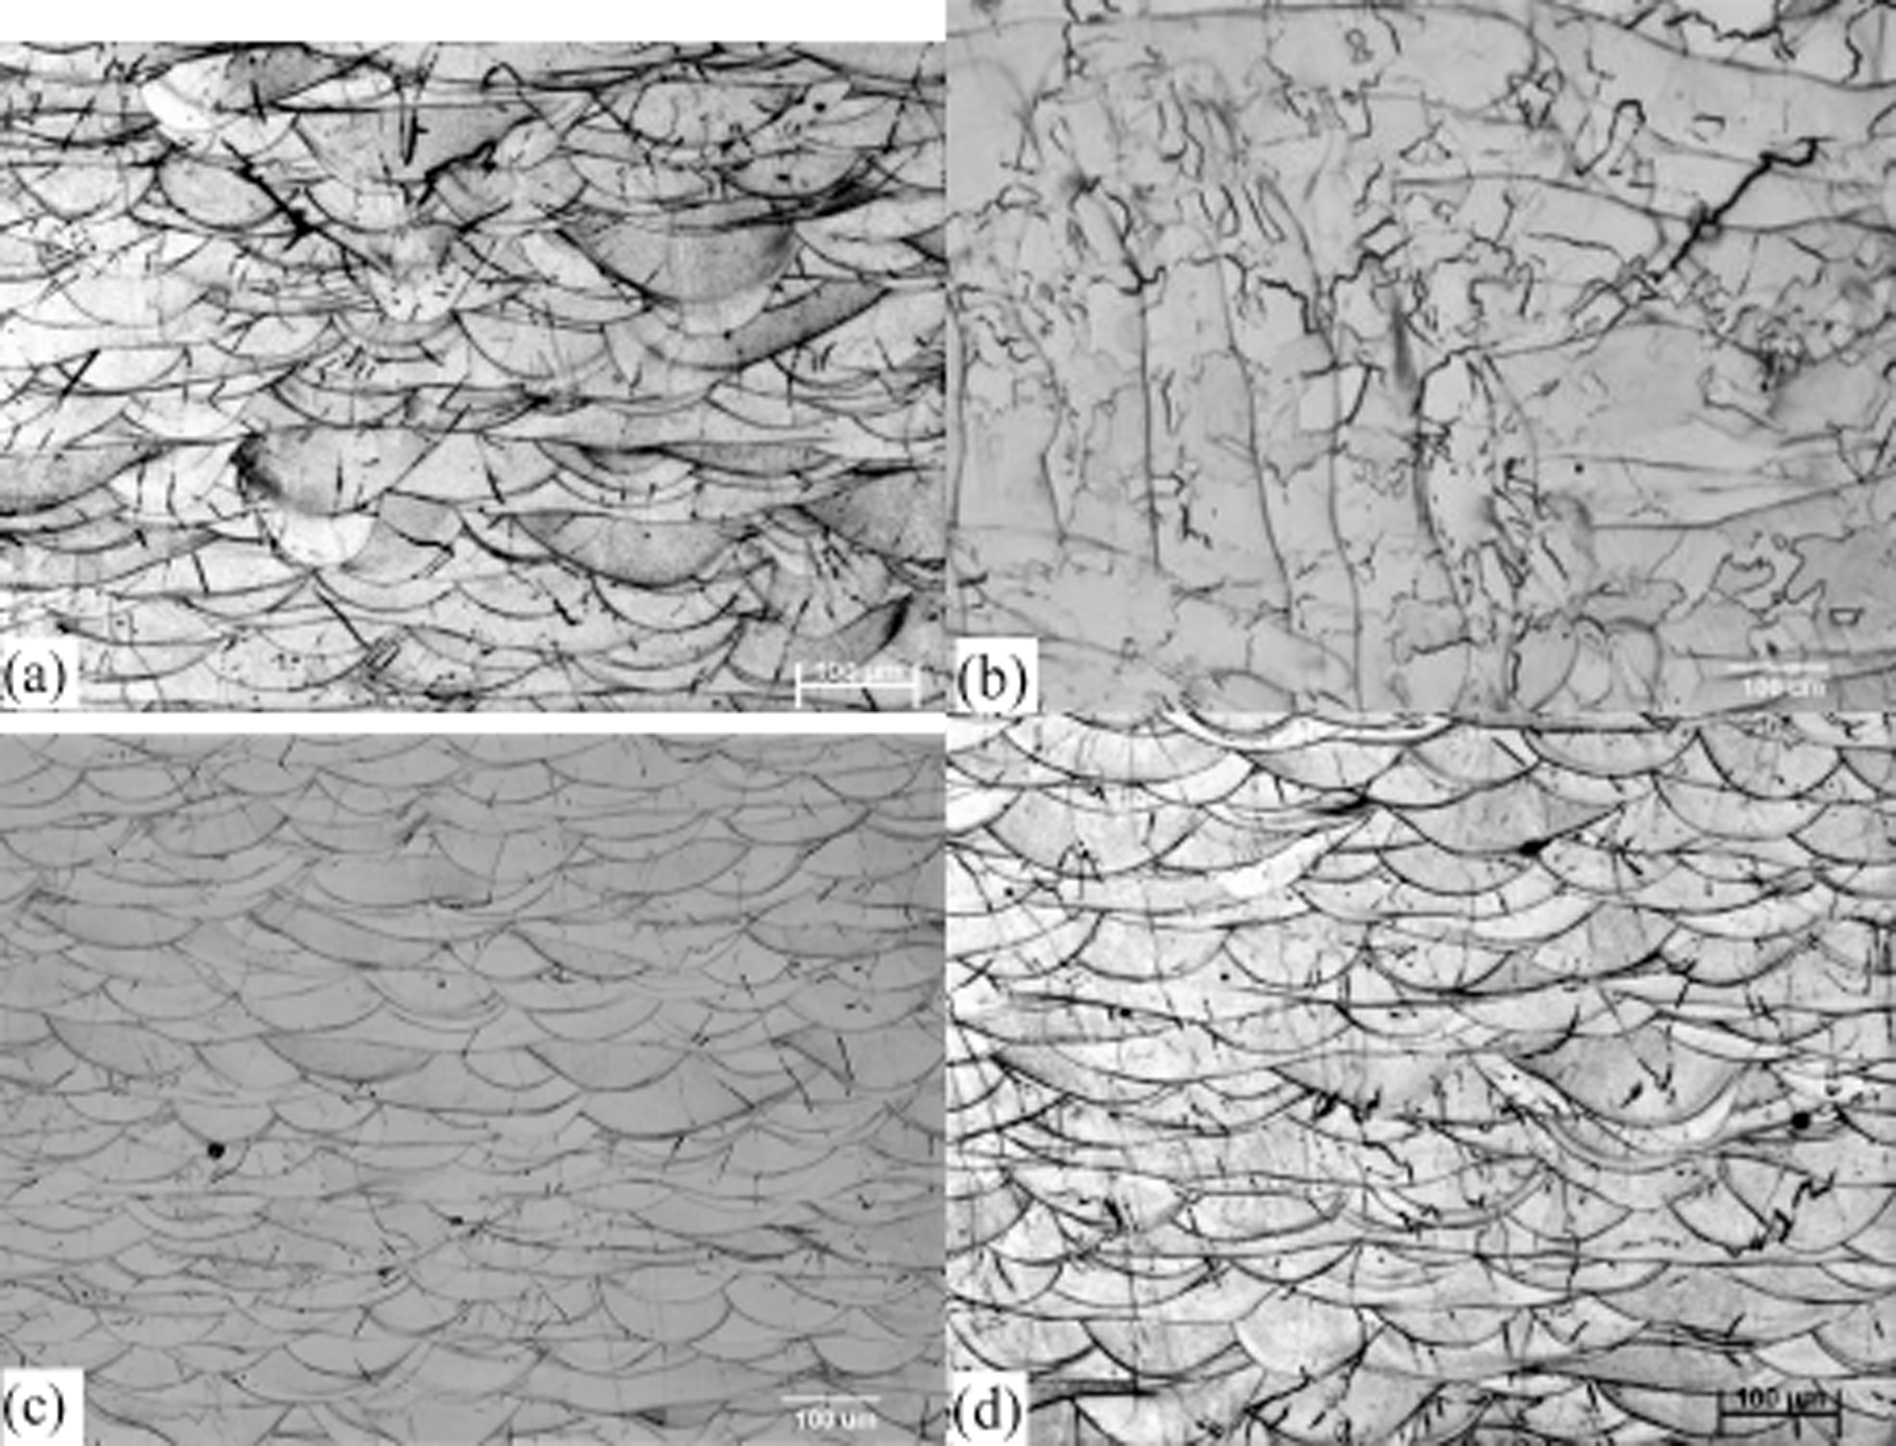
a taken near bottom of sample, Z=1 mm a at corner of sample on side surface (i.e. X–Z plane), b at corner of sample on cross-section (i.e. X–Y plane) and c at centre of sample on side surface (i.e. X–Z plane); d taken near top of stub sample, at Z=10 mm, showing corner of sample on side surface (i.e. X–Z plane)
The number of cracks at the corner of samples produced using a range of values of nominal laser power density is shown in Fig. 15 where the crack density is the number of the cracks over the area of a micrograph, as shown in Fig. 14a. This measurement is not accurate because the areas examined are limited, and the assessment is carried out on two-dimensional sections. Nevertheless, Fig. 15a gives a clear indication that the crack density decreases with increasing nominal laser power density, and when the laser power density is larger than 2 J mm−2, the number of cracks is approaching a minimum, and this trend is confirmed by optical examination of the samples. It is interesting to note that the crack density, in fact, increases with increasing scan spacing (Fig. 15b), and the number of cracks increases markedly when the scan spacing is larger than 100 dref.
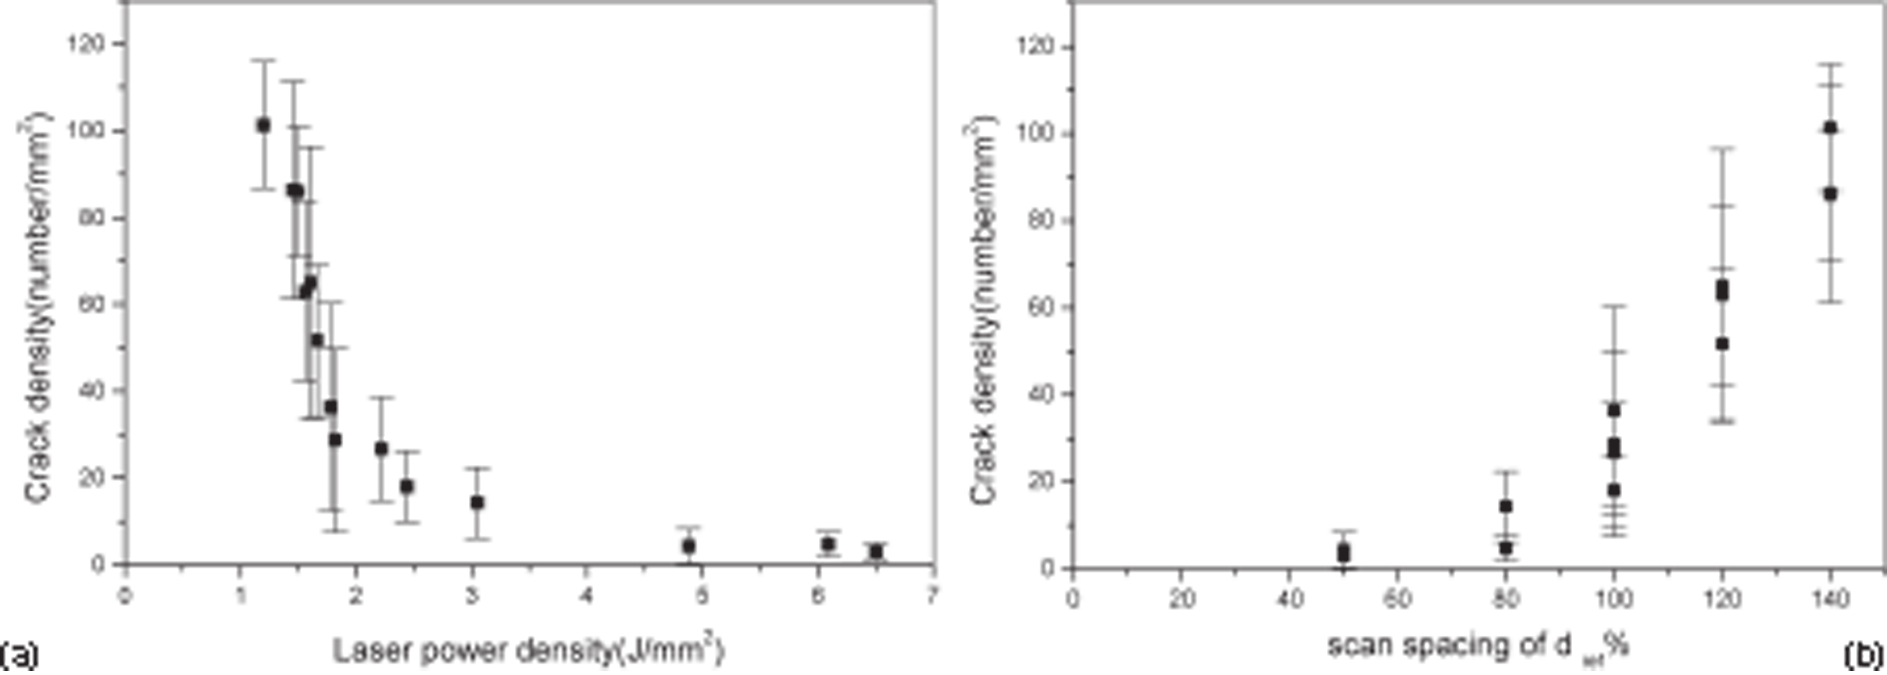
a influence of laser power density on crack density; b influence of scan spacing on crack density
Summary of observations
samples can be manufactured close to specified dimensions and with minimum surface roughness using a scan spacing of 100 dref and a nominal laser power between approximately 1·2 and 1·6 J mm−2 if contouring is applied. A range of laser scan speeds can be used provided they are compatible with the requirement that the laser power density is low and ∼1·22 J mm−2
the top surface concavity is minimised at lower power densities of ∼1·2 J mm−2
macroscopic densities of fabricated samples of 99·5 are achieved if the power density is above ∼1·4 J mm−2
cracking occurs in all samples, but at laser power densities of greater than 2 J mm−2, this is minimised. A scan spacing of 100 dref is also required to minimise cracking.
On the basis of this summary, it appears that there is a window of conditions, which would allow virtually all of the factors (dimensional accuracy, surface roughness, top surface concavity, density, extent of cracking, tensile and fatigue properties) to be optimised. An optimum processing condition for Hastelloy X was thus derived from those windows, which offer the optimum condition for all the above variables investigated.
Microstructure and mechanical properties of direct laser deposited Hastelloy X
Secondary electron scanning images of the microstructure of DLDed Hastelloy X are shown in Fig. 16. The sample examined was manufactured using a nominal laser power density of 1·61 J mm−2. It can be seen that along the X–Z plane within each laser scan path, there are fine columnar grains (Fig. 16a). The orientation of the columnar grains in one laser bead can sometimes extend into the adjacent layer; these layers are under 20 μm thick and correspond to the 20 μm that the powder bed is lowered between laser tracks. Figure 16b shows the cross-section of those fine columnar grains in the transverse direction, where it can be seen that the diameter of columnar grains is less than 1 μm.
Secondary SEM images taken from a side surface and b cross-section of DLDed Hastelloy X sample
An EDX analysis has been carried out to assess the homogeneity of the composition, and no obvious compositional heterogeneity has been detected in the as DLDed samples within the accuracy of EDX.
Tensile properties of DLDed Hastelloy X
Preliminary work using a range of process conditions showed that the tensile properties were inconsistent between samples manufactured at the corners, centres and edges of the substrate as shown in Fig. 17a. It was found using the optimised condition that the tensile properties were consistent for samples built in all locations on the substrate even without post-heat treatment or HIPping, and typical tensile curves obtained using the optimum condition are shown in Fig. 17b. Forged Hastelloy X has 0·2 proof stress of 367 MPa, ultimate tensile strength (UTS) 787 MPa and 40 elongation. 15 The as DLDed samples using optimum processing parameters have a 0·2 proof stress of ∼800 MPa, a UTS of ∼900 MPa and 28 ductility, which is adequate for structural applications.
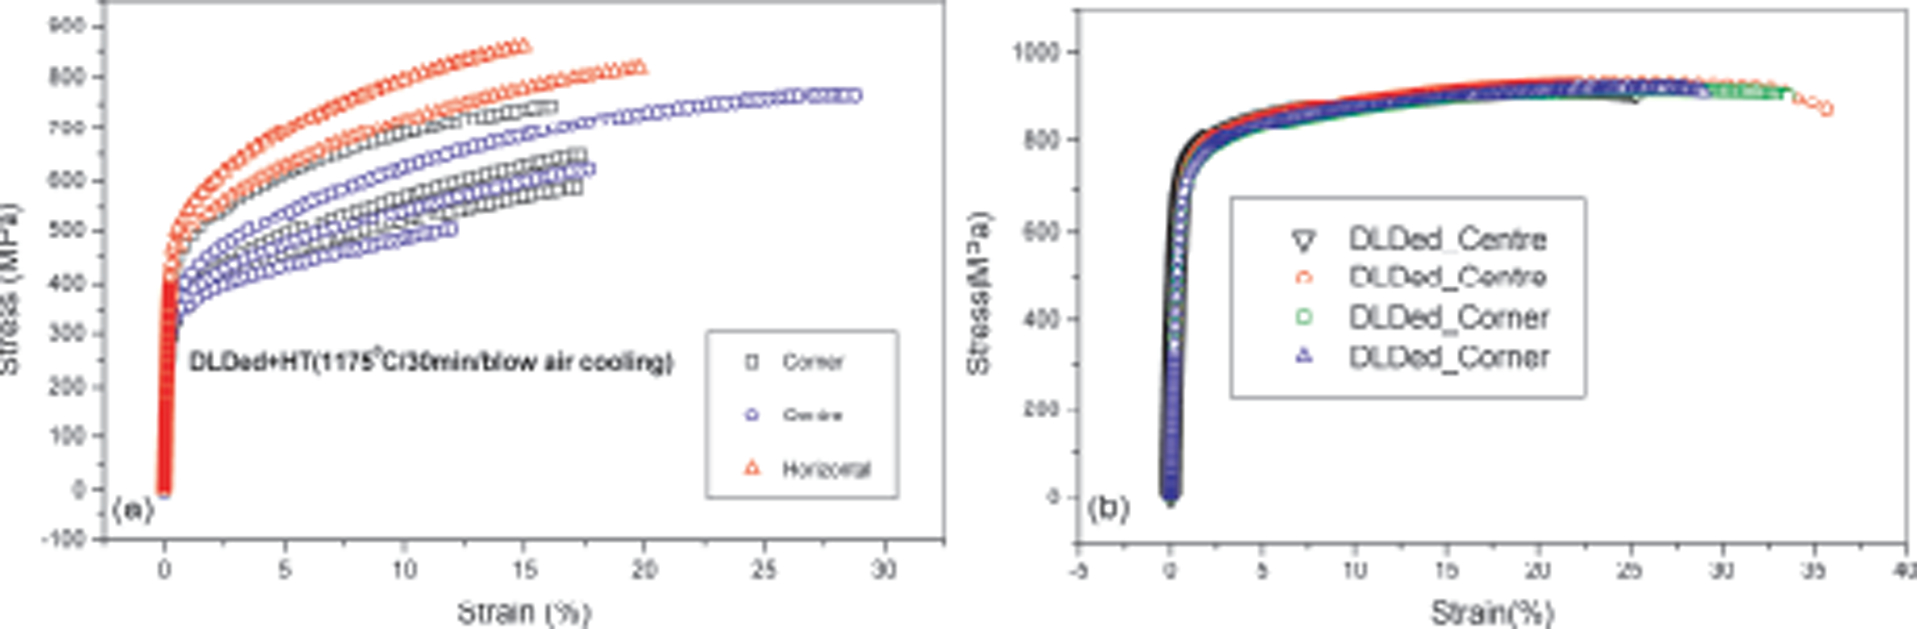
a room temperature tensile property of DLDed+HTed (1175°C/30 min/blown air cooling) Hastelloy X and scatter of property for samples built at corner and at centre of substrate using non-optimised process conditions, and b tensile property and consistency obtained in as DLDed built using optimum process condition
A typical fracture surface of tested samples, whose results are shown in Fig. 17a is shown in Fig. 18a and b. It is clear that the fracture is ductile, although the fracture surfaces contained some unusually deep holes (arrowed), which have been found to be often associated with unmelted powder particles at a closer inspection. Fracture surfaces for the samples built using the optimum process condition are shown in Fig. 18c and d. Apart from an occasional deep void, unmelted powder particles are rarely observed.

a, b fracture surface of sample manufactured using non-optimum process conditions (tensile results shown in Fig. 17a) and arrows point to unmelted powder particles; c, d fracture surface of sample that was manufactured using optimum process condition
Four-point bend fatigue data
Four-point bending fatigue testing is often used to evaluate the surface integrity of a material; thus, it has been used here to assess the surface performance of the DLDed material. The four-point bend fatigue testing results for samples built using the optimum processing condition are shown in Fig. 19. It can be seen that the fatigue limit of the as DLDed Hastelloy X is ∼550 MPa and that there is no significant difference in the fatigue property of samples built in the vertical and in the horizontal directions. It is noted that HIPping before testing increases the fatigue limit to ∼700 MPa and also reduces the scatter in fatigue performance. This is somewhat surprising as HIPping cannot close the cracks, which are connected to the surface, but the cracks within a sample and the surface condition of the as DLDed and the DLD+HIPped ought to be similar, and further investigation is under way. Comprehensive assessments of mechanical properties obtained for different processing conditions and different testing temperatures, together with the influence of texture, are outside the scope of this paper, and they will be reported shortly in a separate paper
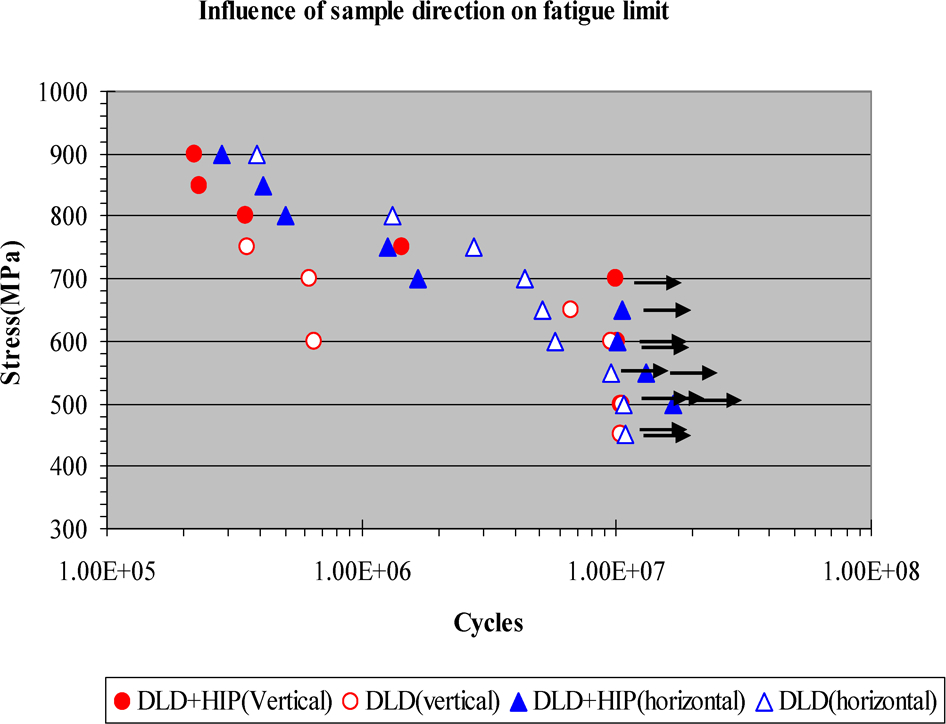
Four-point bending fatigue results of Hastelloy X built horizontally and vertically using optimum processing condition and with or without post-HIPping: arrows indicate ‘run-out’ of samples, i.e. samples were not failed after cycling 10E7 cycles; all samples contain as DLDed surface
Discussion
To understand the influence of DLD processing parameters on the characteristics of a build, such as dimensional accuracy, surface condition, top surface concavity, etc., a detailed study, coupled with process modelling and measurement of thermal profiles, needs to be carried out, and this will form part of the future work. In the present paper, some general comments will be given on the influence of processing parameters.
It has been observed that laser scan spacing has an effect on the dimensional accuracy and surface roughness. When the scan spacing is very small, it is likely that the temperature of the molten powder and solid interface is higher, and the heat affected zone is bigger, which leads to more half-melted powder attached to the solid surface as observed by Yadroitsev et al. 8 This is in agreement with the surface roughness measurement shown in Fig. 6b.
Within the scan speed range investigated, it is noted that the surface roughness increases with increasing scan speed. Previous work10,11 has suggested that at very high scan speed, the melted metal can ball up due to Plateau–Rayleigh instability, i.e. to reduce the aspect ratio, length/diameter of the liquid cylinder, to lower the surface energy. 16 The dynamics of this process was studied by Rayleigh for liquids with negligible viscosity. 17 For iron or other metals, the ‘break-up or balling’ of the liquid stream requires time in the range of 0·5 ms at the melting point of the metals,10,17 and this is well below the typical solidification time during DLD. 10 It is understandable that such a string of ‘balls’ formed under higher scan speeds will lead to a poorer surface finish in contrast to a smooth and continuous track obtained under lower scan speeds. Despite that, the current surface finish obtained under optimum process conditions using EOS 270 has been found to be acceptable for many applications without further machining.
The surface roughness at the top surface of a sample (horizontal plane) has been found to be less sensitive to scan spacing or scan speed, as the surface tends to be smeared after the last layer of melting. However, the macroprofile of the top surface, i.e. the top surface concavity is in fact critical to the smooth and continuous build of three-dimensional, especially large, components. Figure 11 shows that the top surface concavity is affected by the laser power density, where a smaller power density appears to produce a smaller concavity. At the top layer of a tall sample, thermal conduction via the deposited sample itself becomes small, and cooling is conducted via the surrounding powder, which leads to faster consolidation of the circumference, i.e. the edge of the sample rather than that of the middle material on the top layer. The volume of material in the central region, which remains for longer times at high temperatures, increases with the height of the sample, and this is likely to result in an increase in shrinkage at the centre of the sample, thus forming a concavity at the top of the sample. This situation can be lessened by using a lower power density, but this degrades other properties.
Examination of the macrostructure of the samples has shown that many cracks are present in the samples, especially at the low power densities, which are perpendicular to the laser beads. Within each sample, most cracks are observed at the corner of a sample and the fewest at the centre, which indicates that they are induced by thermal residual stress. Residual stress analysis 12 has shown that the maximum residual stress in a DLDed sample in a powder bed is at the top layer of the samples after the sample is cooled to room temperature. Examination of crack density at the corner of the samples at the height of 10 mm has shown that the number of cracks is similar to, but not more than, that observed near the substrate at Z = 1 mm. This appears to indicate that even if the residual stress might be higher with increase of the sample height, as predicted by Shiomi, 12 the number of cracks is not necessarily increased, as cracking is influenced by not only the magnitude of the residual stress, but also by the relationship between the strength and the level of stress at different temperatures. Hastelloy X maintains almost constant tensile strength up to 750°C, and beyond that, the strength of the material drops very quickly with temperature, together with a decrease in ductility. The thermal residual strain generated during cooling of a melt obviously varies with the temperature, and it is at present difficult to define at what temperature the thermal residual stress exceeds the UTS and thus at what temperature would cracking occur.
At a higher laser power density, more energy is input into the sample, which results in a higher average temperature in the sample, subsequently a smaller cooling rate, therefore fewer cracks. In practice, the thermal profile and the cooling rate are influenced by laser power, scan speed, scan spacing, laser path, sample geometry and temperature itself.18,19 Computer modelling is required to take into account the influence of all of these factors to fully understand the relationship between operating conditions and crack density in DLDed materials.
A large scatter in the tensile properties is found between the samples taken either from the corner or from the centre of the built samples when non-optimised conditions are used, and some unmelted powder particles have been observed on the fracture surface. This scatter could be influenced by the fraction of unmelted particles in the gauge volume, which would contribute to crack initiation and fracture of the material. Although at the corner of a sample, more cracks are present, those areas would have been machined off in a tensile sample, and the cross-section of a testing sample within the gauge section is mainly the centre of a sample where the number of cracks is relatively small. Clearly, it would be useful to manufacture tensile samples to net shape, so that all cracks induced during fabrication are present in the test samples. Under the optimum process condition, the scatter in mechanical properties is markedly reduced, and the examination of the fracture surface of those samples has revealed almost no unmelted powder particles, although a deep void is occasionally seen.
The four-point fatigue strength obtained from samples, which were processed using optimum, is also very good, but detailed analysis of the four-point and tension–tension fatigue data will be published in a paper focused on the mechanical properties of laser bed samples.
Conclusion
It appears that there is a process window, which allows virtually all of the factors (dimensional accuracy, surface roughness, top surface concavity, density, extent of cracking, mechanical property) to be optimised. Under these optimum conditions, the tensile and fatigue properties are similar to those of forged samples.
Footnotes
Acknowledgement
The present work is sponsored by Rolls-Royce plc, Derby, UK, and the authors would like to thank Dr G. Young for her skilled management of the project and Dr P. Andrews, Dr M. Ley, Dr J. Allen, Dr N. Glover and Dr K. Young for useful discussion. The authors are grateful to Mr C. Brancher for the use of EOS 270 machine in Materials Solution Ltd, and in particular to Dr T. Illston, who manufactured all the samples for the programme and Dr N. Wain for measuring top surface of concavity using a three-dimensional laser scanner.