
Abstract
Free surface roughening of polycrystalline austenitic stainless steels during tensile and deep drawing deformation is investigated using scanning white light interferometry. A fractal analysis method is applied to analyse the surface profile data in two directions which are perpendicular to each other. It is shown that the surface profile is fractal within the length and is on the same order of magnitude as the grain size. The Hurst exponent H of the two deformation modes in different directions stabilises at H≈0·85. While the correlation lengths are different, the value in the longitudinal direction is about two times larger than the one in the transverse direction. The relationship between root mean square roughness and strain appears to be linear, and the roughening rate in tensile deformation is larger than the one in deep drawing deformation.
Introduction
Free surfaces of metals become rougher during plastic deformation. This roughness is undesired for many applications because it can influence important properties such as reflectivity, frictional behaviour and corrosion resistance. In addition, it provides initial sites for strain localisation, which may degrade the formability of a material. Hence, extensive investigations on the roughening of free surfaces have been reported. These studies show the influence of strain, grain size, stress mode and texture on surface roughness characteristics. The surface roughness is found to increase linearly with strain and depends linearly on grain size.1–5 The roughness increment was irrespective of the stress state,6 whereas texture was found to have a great influence on the roughness.7–9 Most of these studies are aimed at finding the mechanisms of surface roughening during deformation. A number of studies have shown that plastic deformation roughens a surface by introducing slip bands within grains and strain incompatibilities between grains.3,8,10 The latter is the major factor for the measured surface roughness parameters.
Recently, fractal theory was introduced to study the surface roughness during deformation. Zaiser et al.11 found that copper samples deformed in tension develop self-affine roughness over a large range in length scales. Wouters et al.1,7 did further investigations of the surface roughening process using a height–height correlation technique, and found the statistical parameters α, ξ and ω to be a good approach to obtaining valuable information about the nature of the roughness and the underlying physical mechanisms. However, these experiments were only conducted in tensile deformation mode.
In the present study, the authors aimed at gaining more knowledge of the nature and development of roughness of polycrystalline metal surfaces under different deformation modes: tensile deformation and deep drawing. In this paper, fractal analytical method is applied to give descriptions of the rough surface, and surface roughness are compared between two deformation modes, which is useful to predict the roughness by deep drawing deformation. And it gives a direct insight into the typical length scales that play a role as the roughness develops.
Experimental procedure
Materials and preparation
Austenitic stainless steel sheets with an initial thickness of 4 mm were deformed in tension and deep drawing. The chemical composition of the material is 0·0204C–9·188Ni–17·167Cr–0·046Mo–3·127Mn–0·474Si–0·0234P–0·0015S–0·138Ti wt. Dog-bone shaped tensile specimen (30 mm gage length, 5 mm gage width and 4 mm gage thickness) orientated parallel to the rolling direction and circular flat-plate deep drawing specimen (186 mm diameter and 4 mm thick) were used for the experiments. The grain size was measured in both the rolling direction and the long transverse direction by the linear intercept technique. The surface morphology was examined by a non-contact high-precision three-dimensional surface profilometer (Micro-XAM) with a lateral resolution of 0·725 μm and height resolution of 0·1 nm.
Experimental setup
The specimens were polished to a mirror finish before deformation. The tensile sample was deformed with a standard tensile testing machine at a tensile speed of 1·5 mm min−1. The sample was unloaded at total (true) strain values of ϵ = 6·14, ϵ = 12·29, ϵ = 22·51 and ϵ = 29·37, and the surface profile was examined with the Micro-XAM instrument. The deep drawing sample was deformed with a drawing ratio of DR = 1·813 to obtain a cup with a diameter of 110 mm and height of 68 mm. Since the clearance between the punch and die was 5·7 mm which is greater than the sheet thickness, the inner surface of the cup was not contacted by the punch during deep drawing. After deformation, a strip sample with 10 mm width was spark cut along the axial direction on the cup wall. Several locations on the inner surface of the strip sample were investigated with the Micro-XAM instrument for samples obtained with true strains of ϵ = 15·01, ϵ = 26·79, ϵ = 38·64 and ϵ = 52·26.
Data analysis
Assuming the profile of the rough surface with self-affine properties,11 the mean height differences 〈|y(x)−y(x+L)|〉 were evaluated as a function of L for each of the profiles by averaging over all pairs (x+L) within the profile. Self-affine behaviour implies
Most of the literature expresses the roughness of the entire surface through an estimation of the mean of the amplitude distribution. The popular method is the root mean squared roughness (rms), which is expressed as
Results
Fractal character of tensile surface
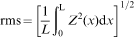
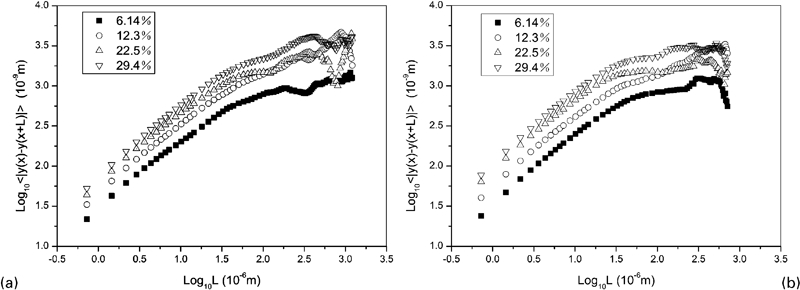
The results of the deformed tensile sample surface measured in the direction parallel to the tensile axis and the direction orthogonal to the former are shown in Fig. 1. Typical plots exhibit linear fit to the first section of the structure function, that is, the curve indicates a self-affine scaling behaviour on a certain length scales. Hurst exponents deduced from the slope of the roughness plots (and the corresponding fractal dimension DF = 2−H) are shown in Fig. 2a. The error bars reflect the scatter of exponents obtained from different profiles taken at the same strain. In the longitudinal direction of the tensile sample, the value of H is small for small strains, but increases with increasing strain. Above a strain of 12·3, the value of H is almost the same and is 0·88. However, in the transverse direction, the value of H stabilised to ∼0·88.
Roughness plots for profiles obtained after tensile deformation to certain strains
Fractal dimension and Hurst exponent as function of strain
Fractal character of deep drawing surface
The log–log plots of the function of the deep drawing surface profile are illustrated in Fig. 3. As the tensile sample surface, these plots exhibited a linear relationship for small distances. However, in the direction orthogonal to the cup axis, the plots exhibited two sections of straight lines, which mean that the surface was bifractal. The Hurst exponent H determined from the roughness plots is shown in Fig. 2b. The value of H increases initially with increasing strain, but reaches a constant value of 0·89 for the two directions of the deep drawn sample surface.
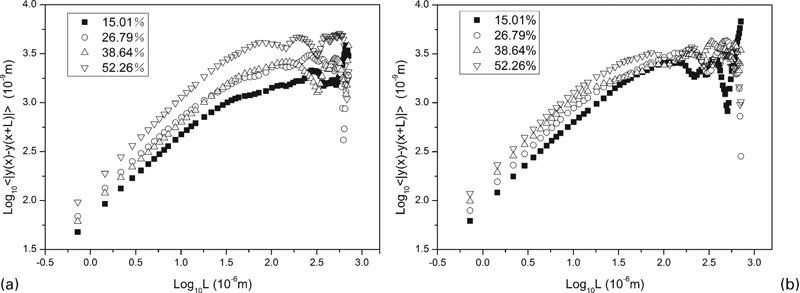
Roughness plots for profiles obtained after deep drawing at different strains
The correlation length ξ of the two sample surfaces in different directions were plotted in Fig. 4. There were gaps in the different directions. For the transverse direction, the ξ stabilised to a value of ∼30 μm, which is the same order of magnitude as the grain size (21 μm). In the longitudinal direction, however the ξ is ∼60 μm for the two samples.
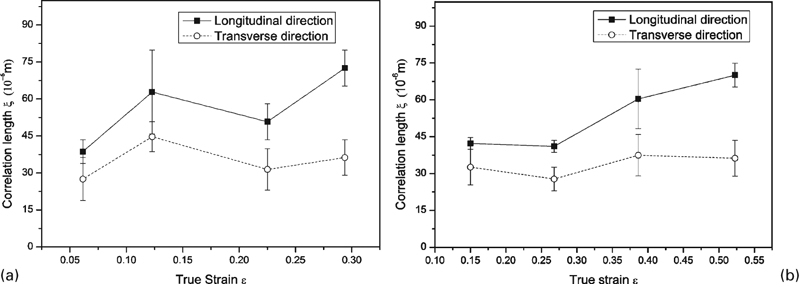
Correlation length ξ
The rms surface roughness of the two samples was shown in Fig. 5. The values of rms appear to lie on a straight line for each direction of the samples, and there was a small difference for the two samples in the different directions. For the tensile sample, the rms in the longitudinal direction is a little larger than the one in the transverse direction. However, the rms in the longitudinal direction is a little smaller than the one in the transverse direction for the deep drawn sample.
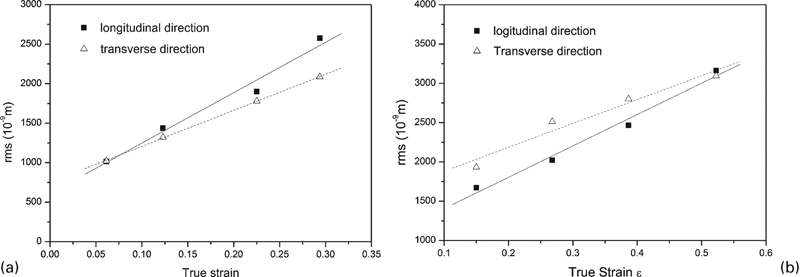
Root mean square roughness as function of strain in two directions
The average values for rms as the function of true strain in the two different deformation modes are shown in Fig. 6. It can be seen that the trends of plots can be represented by a linear fit for each sample with different slopes (5469·4 in tension test and 3515·7 in deep drawing).
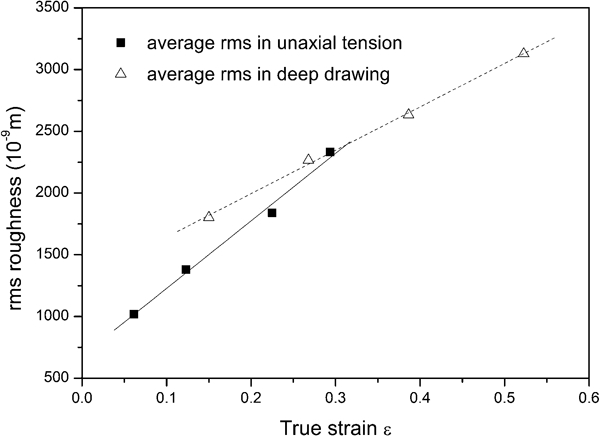
Average rms roughness in tension test and deep drawing deformation
Discussion
The surface structure of plastically deformed metal samples in terms of self-affine properties was reported by Zaiser et al.11 for the first time. The authors analysed the rough surface profiles in terms of self-affine roughness. From Figs. 1 and 3, it is clear that the height difference correlation functions are scaling invariant. To demonstrate self-affine roughness more convincingly, the authors performed a check by multiscaling analysis where the authors evaluate the nth order structure function12
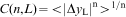


Figure 7 shows that power–law relationship is indeed observed in certain scale. Within the scaling regimes, there is a weak n-dependence of the scaling exponent Hn = 0·70−0·77 for 1⩽n⩽4, thus the available data are consistent with self-affine scaling. So the rough surface profiles caused by deformation indeed develop self-affine roughness.
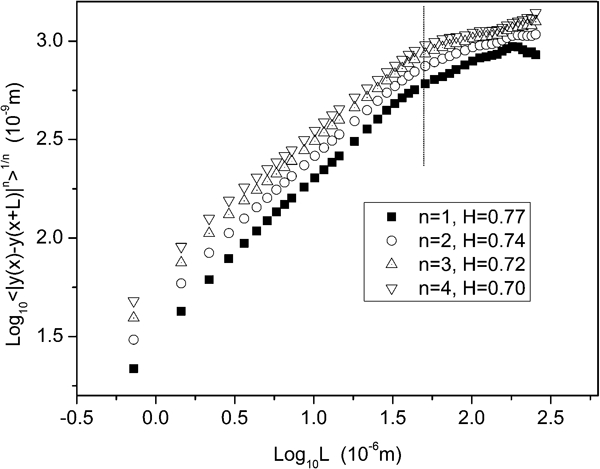
Multiscaling analysis of surface profile taken at ϵ = 6·14 during tensile deformation in longitudinal direction; dotted line indicate limits of scaling regimes used in fitting scaling exponents Hn
Wouters et al.1,7 did studies on the roughness of deformed metal surface and got many valuable results by height–height correlation functions. In the authors’ experiments, the H value is higher than the values obtained by Zaiser et al.11 (H = 0·75), and is close to the value obtained by Wouters et al.1 (H = 0·88±0·05). The explanation for the difference can be that the measurement is conducted with different scan sizes between the two groups. The scan sizes performed by Zaiser et al. is smaller, or on the order of the grain size, which excludes the influence of the roughening mechanism that acts on the grain size scale. This is different from the scan sizes adopted by Wouters et al. which is 10 times larger than the grain size. In the authors’ experiments, the scan size is almost 20 times larger than the grain size, which enables the roughening mechanism that acts on the subgrain and grain size scales to be included. Furthermore, the H value of the two deformation modes are the same, which means that the value of H≈0·88 for deformed metal surfaces may be universal. The correlation lengths are different in the two directions of the surface profile for the two deformation modes, but the values are on the same order of magnitude as the grain size. The ξ in the longitudinal direction is approximately one time larger than the value in the transverse direction, which can be related to different stains in the two directions.
Figure 5 clearly shows the roughness to increase linearly with increasing strain, but the slopes are different for the two directions for both deformation modes. For the tensile testing sample, the roughness in the two directions is initially the same, and the roughness in the longitudinal direction increases faster than the one in the transverse direction as the strain increases. It may be related to the strain anisotropy. Grains at the free surface have less restrain than grains under the surface and the deformation of the grains become different as the strain increases. However, for deep drawing sample, the roughness are different at small equivalent strains (the roughness in the transverse direction is larger than the one in the longitudinal direction), but the gap decreases with strain increasing. It can be linked with the deep drawing deformation where radial shrinkage can create destabilising effect of the inner surface, which induces a larger roughness in the transverse direction.
In Fig. 6, the average roughness is plotted as a function of strain for the two deformation modes, which is useful for engineering application. It is clear that the average roughness increase linearly. Assuming that the linear relationship between rms roughness and grain size, the rms roughness equation can be written as

Conclusion
The value of statistical parameters Hurst exponent H, correlation length ξ and rms roughness ω were gained to obtain information of the roughening mechanisms by different deformation modes.
It is shown that the surface profile obeys self-affine structure on the magnitude of grain size and the H values are close under the two deformation modes. The correlation length is directional and the value in the longitudinal direction is about two times larger than the one in the transverse direction. The roughening mechanism is different in the two deformation modes. During deep drawing, the inner surface may be unstable because of shrinkage in the transverse direction. As a result, the surface profile of deep drawing sample is bifractal. The roughening process is correlated to the strain state. In the tension test, the roughness rms in the longitudinal direction is larger than the one in the transverse direction, while the result is reverse during deep drawing deformation. The average rms increases linearly with strain increasing for the two deformation modes, and the roughening rate during tensile deformation is larger.
Footnotes
Acknowledgements
The authors acknowledge Fang Bian and Shuxue Sun for their assistance during the deformation testing of the research.