
Abstract
A TEM study has revealed, for the first time, the presence of small (∼3 nm in diameter) voids attached to T1 (Al2CuLi) precipitates present in an artificially aged Al–Cu–Li alloy (Al–2·90Cu–1·63Li–0·29Mg–0·28Ag–0·13Zr). These voids do not form from quenched in excess vacancies but are nucleated at the T1 phase/alloy interface from excess vacancies generated during oxidation of the TEM sample. It is concluded that these voids result from the Kirkendall effect with rapid oxidation of the TEM metal surface occurring by molecular oxygen migration through a highly defective surface oxide layer.
Introduction
The fabrication of nanoscale hollow core oxide particles is one of the new areas of investigation in the field of nanotechnology. Several recent publications1–3 indeed report the production of various hollow core oxide nanoparticles, which are made mainly from pure metals [Al (Ref. 3), Co (Ref. 1), Cu (Ref. 3), Fe (Ref. 2), Ni (Ref. 4), Pb (Ref. 3), Y (Ref. 5), and Zn (Ref. 3)]. In this technology, the starting materials are nanosize metal particles, which are subsequently oxidised. During oxidation, excess vacancies are generated at a metal/oxide interface but are trapped within the oxide shell. Since vacancy supersaturation can be easily achieved inside the shell, voids are nucleated at the metal/oxide interface or in the internal region of the remaining unoxidised metal particle. Complete consumption of metal atoms by oxidation, accompanied by an enlargement of voids, eventually creates a hollow core oxide particle. The formation of these voids is reported1–6 to be due to the Kirkendall effect.7
Most recently, the authors have observed the presence of small (∼3 nm in diameter) voids lying inside the transmission electron microscope (TEM) specimen of an Al–Cu–Li alloy. The formation mechanism of these voids was thought to be similar to that of the hollow core oxide particles because a TEM specimen has some geometrical resemblance, in such a way, to trap oxidation induced excess vacancies between two surface oxide films. There is only one report on voids in this class of alloy system by Papazian et al.,8 who found much larger (>1 μm) voids as a result of high temperature (∼500°C) oxidation. The voids described in the present investigation are much smaller (∼3 nm) and have never been reported previously.
In the present communication, an attempt has been made to understand how such small voids are formed in aged Al–Cu–Li alloys and why these voids are attached to the T1 (Al2CuLi) phase precipitates. It will be shown that these voids are most likely formed during or after TEM specimen preparation because TEM specimens provide a convenient geometry for retaining excess vacancies generated during spontaneous oxidation at room temperature. A mechanism, whereby these voids are formed, will be discussed in terms of the Kirkendall effect.7
Experimental
An Al alloy of composition Al–2·90Cu–1·63Li–0·29Mg–0·28Ag–0·13Zr (in wt-%) was used in this investigation. Bulk samples were solution treated at 530°C for 90 min and then cold water quenched (<20°C). Samples were finally aged at 150 or 160°C for up to 1000 h in an air circulating furnace. An experiment was also conducted, whereby samples were aged at 150°C under vacuum.
For TEM observations, thin (∼150 μm) slices were prepared from the aged bulk alloy blocks (25×25×20 mm) by first cutting 1 mm thick specimens using a diamond saw, followed by successive grinding on P600 and P1200 SiC papers. Slices were always sectioned away from the surfaces of the aged blocks. Discs of 3 mm diameter were then mechanically punched out from the slices. Three types of techniques were used for preparing final TEM samples: electropolishing, focused ion beam (FIB) lift-out9 and conventional mechanical polishing, followed by ion milling. For electropolishing, the 3 mm discs were electropolished to perforation using a Struers’ Tenupol-5 (Struers, Ballerup, Denmark) in a cooled (–30°C) solution of 5%HOCl, 1·5%HNO3 and 93·5%CH3OH at 20 V. Focused ion beam specimen preparation was carried out using an FEI FIB200 machine (FEI Ltd, Cambridge, UK) operated at an accelerating voltage of 30 keV. Plan view samples were mechanically polished down to the thickness of ∼50 μm and then dimpled in the centre region. The dimpled sample was finally thinned to perforation using a Fischione Model 1010 (Fischione Instruments, Export, PA, USA) low angle ion milling machine. Transmission electron microscopy samples were always examined immediately after completion of thinning (usually within 10 min).
Transmission electron microscopy was conducted using JEOL JEM-2011 and JEM-2200 electron microscopes (JEOL Ltd, Tokyo, Japan) operated at an accelerating voltage of 200 kV. High angle annular dark field (HAADF) images were recorded on JEOL-2100F and Tecnai G2 F20X-Twin TEMs.
Results and discussion
Figure 1 shows TEM result of the (110) cross-section of the alloy aged at 150°C for 1000 h. In this image, taken in a slightly underfocused condition, two sets of the T1 precipitates are seen edge on, lying parallel to the  and
and  planes of the alloy matrix. In addition to the T1 precipitate, a number (∼1·3×1016 cm−3) of small (∼3 nm in diameter) voids (marked with symbol V) are seen. The size of these voids is seen to be very uniform. It should be pointed out that these voids were not observed for the in focus condition but appeared only in defocus conditions. A careful examination of the microstructure indicates that the majority of the voids are attached to the T1 precipitates. To the authors’ knowledge, there have been no previous publications that report the presence of such small (∼3 nm) voids in this class of Al alloys. Aging at 150°C under vacuum did not change or influence the appearance of voids.
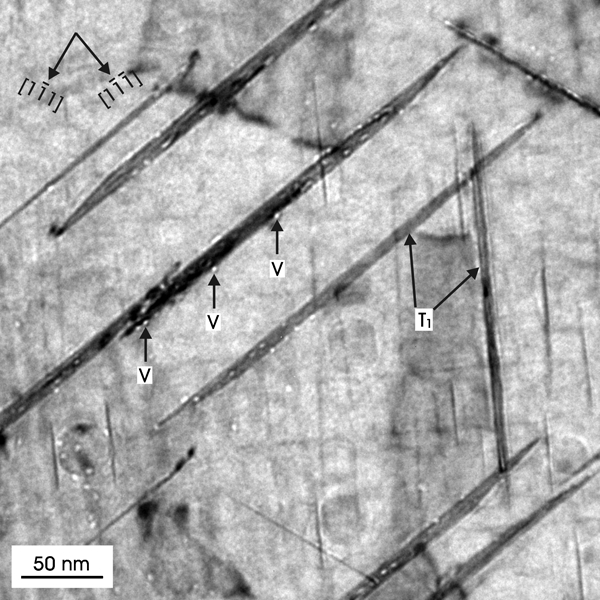
Image (TEM) showing numerous voids attached to T1 phases of Al–Cu–Li alloy: voids are indicated with symbol V, while T1 phases are marked with arrows
Identification of voids using defocus contrast technique
It is interesting to consider why the existence of such small voids has not been observed until now in this particular alloy system. One possible answer is that these voids were too small to be seen by conventional in focus imaging, and thus, only the defocus contrast technique10–12 can reveal their presence. Small (0·5–5 nm) strain free objects, such as voids, exhibit very little amplitude contrast and thus are not easily recognisable under the in focus condition. Upon defocusing, however, the appearance of Fresnel fringes around the edge of these voids will make the voids visible. Fresnel fringes originate from interference between electron waves going inside and outside a void. Since these small voids can become visible only by a change in phase, for example, by defocusing, they are called phase objects. 11 11,12 The voids seen in Fig. 1 are thus phase contrast images decorated with Fresnel fringes. The use of the defocus contrast technique also confirmed that the as quenched (and naturally aged) alloy did not contain any voids. Thus, the voids observed in this study did not originate from a quenching process, whereby voids could nucleate by agglomerations of quenched in excess vacancies.
It should be remembered that voids are not the only phase object in this material. Small particulate matter, such as precipitates, however, can also act as a phase object. To establish the identity of phase objects unambiguously, a through focusing exercise is required. As seen in Fig. 2, the image of a phase object undergoes contrast reversal upon through focusing. In the case of voids, a spherical or a penny shaped void appears roughly as a white circle surrounded by a dark ring in underfocus conditions, whereas it shows up as a black circle surrounded by a white ring in overfocus conditions (see voids marked with symbols X and Y in Fig. 2). Thus, it is concluded that white circular features appearing in the underfocus condition in Fig. 1 are voids. If these objects show up as a dark circle with a white ring in underfocus conditions, they are not voids but could be particles with a higher mean inner potential than that of the alloy matrix or could be oxide/foreign particles lying on top of the specimen surface. For detecting these phase objects, therefore, it is essential to image them in the underfocus condition. The use of the defocus contrast technique has thus established that the objects attached to the T1 precipitates are voids.
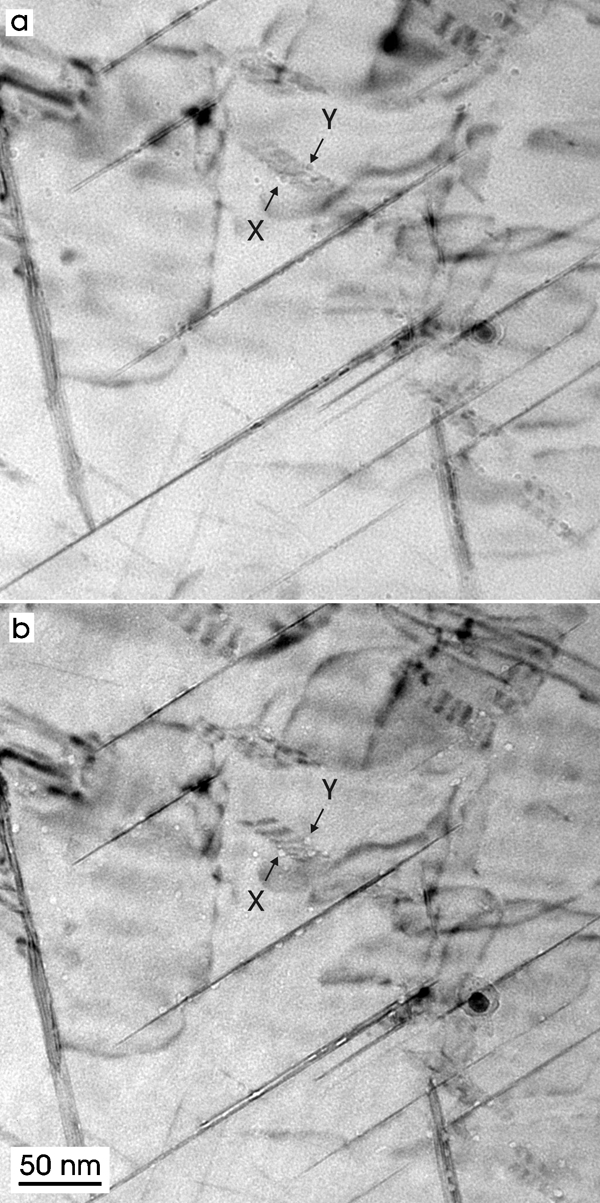
Images of voids taken in a overfocus (Δf = +580 nm) and b underfocus (Δf = −580 nm) conditions. Δf denotes amount and sign of defocus. Two corresponding voids are marked with symbols X and Y.
Origin of voids
The next question is how such small voids are formed in this alloy. It was established that the observed voids did not originate from the quenching process, whereby voids could nucleate by agglomerations of quenched in excess vacancies. A simple calculation involving the number of vacancies required to form a 3 nm diameter void (∼900) and the measured void density (∼1·3×1016 cm−3) indicates that even if the equilibrium concentration of vacancies at the solution heat treatment temperature (∼10−4) was maintained at room temperature, there would be insufficient vacancies to create the voids observed. Another consideration was that the voids could have been introduced during TEM specimen preparation. To test this idea, two other preparation methods (FIB lift-out and conventional mechanical polishing/ion milling) besides the electropolishing technique were used to see how the type of thinning method might affect the void structure seen in Figs. 1 and 2. It was found, however, that the void structure was essentially the same regardless of the method of specimen preparation used. Thus, it was concluded that voids were not introduced by the type of TEM specimen preparation method.
The only other possible source of void formation is due to oxidation. In fact, there is one previous paper that reported8 observations of large (>1 μm) voids in an Al–Li related alloy (Al–2·58Li–1·06Cu–0·56Mg–0·07Fe–0·02Si–0·021Ti–0·08Zr, in wt-%) after high temperature (∼500°C) oxidation in air. Although the alloy used in the present study was not deliberately oxidised at such a high temperature, a lower temperature oxidation process could occur during and after the 150 or 160°C aging of bulk samples. If such an oxidation was possible in this alloy, voids could have originated by the same mechanism as that proposed for the high temperature oxidation.8 However, aging under vacuum did not affect void formation. According to observations by Papazian et al.,8 fast moving Li atoms are preferentially oxidised, creating a Li denuded zone near the alloy surface. The Li denuded zone is not replenished fast enough by slow moving Al atoms, thus leaving excess vacancies inside the zone. These excess vacancies will agglomerate and finally form voids at some distance below the alloy surface. As will be discussed further in the next section, an underlying mechanism for this void formation is due to Kirkendall effect, and it can certainly explain why small voids were formed by oxidation in the alloy. It should be noted that oxidation in the alloy may have occurred either during the 150/160°C aging or during TEM specimen preparation performed at ambient temperatures. Spontaneous oxide formation is also expected to continue upon room temperature storage even after the TEM specimen preparation. It will be shown that oxidation occurring during the post-TEM preparation stage is most crucial in determining the possibility of void formation.
Oxidation induced excess vacancy formation followed by generation of Kirkendall voids
During oxidation, two types of Kirkendall phenomena can exist in an alloy. This is schematically illustrated in Fig. 3. The type I Kirkendall diffusion occurs inside the oxide M–O between Li+/Al3+ and O2−. A condition for the occurrence of Kirkendall diffusion requires the following diffusivity inequality
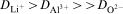
 ,
,  and
and  denote the diffusivities of Li+, Al3+ and O2− respectively. The formation of hollow core oxide particles is claimed1–6 to be due to the type I Kirkendall effect. Type II occurs inside the alloy M and involves the following inequality: DLi>DAl, where DLi and DAl are the diffusivities of Li and Al atoms in the Al–Li alloy. Which Kirkendall diffusion dominates depends on the nature of the rate determining step. The reason why the type I Kirkendall diffusion is not significant in the alloy is that the formation kinetics of the surface oxide is not the rate determining step.
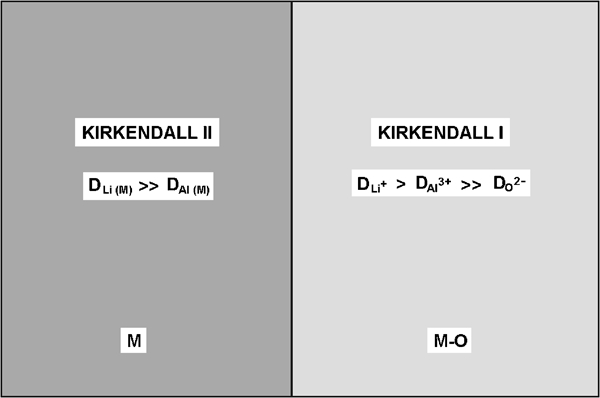
Two types of Kirkendall processes, I and II, occurring during oxidation of Al–Li alloy M: type I occurs in oxide M–O between Li+/Al3+ and O2−, whereas type II involves between Li and Al in Al–Li alloy, M (M = Al–Li alloy; M–O = Al–Li oxide)
The fact that the formation kinetics of the surface oxide in the alloy is not the rate determining step can be explained in terms of the nature of the surface oxide. Al generally forms a very coherent oxide with limited thickness.13 In the case of an Al–Li alloy, Li may break up this coherency by forming more open structure, which allows molecular oxygen to migrate without going through an ionisation process and then to react with the surface of the alloy. If this is the case, an escape of Li atoms to the surface is unlimited. Consequently, the diffusion of Al and Li atoms inside the alloy matrix becomes the rate limiting step. It was also found8 that the concentration profile of Li measured by the nuclear microprobe technique can be best fit to theoretical predictions if the surface Li contents are assumed zero or near zero. This result strongly suggests that surface oxides on the Al–Li alloy are more defective than that on pure Al.
Based on the above discussion, it can be concluded that the void formation observed in the alloy can be attributed to the type II Kirkendall effect, in which Li atoms are faster diffusing species, thus causing an uneven flow of Al and Li atoms. The diffusivity difference between Li and Al atoms can be estimated using published diffusivity data. Based on diffusivity data listed in Table 1, the diffusivities of Al, Li and Cu in an Al matrix at 20, 150 and 160°C are computed, as seen in Table 2. It is clear that the diffusivity of Li at 20°C is seven orders of magnitude larger than that of Al. This large difference in diffusivity is indeed consistent with possible Kirkendall effect between Al and Li atoms in the alloy used in the present study.
Published diffusivity values for Al, Li and Cu in Al–Li–Cu alloy*
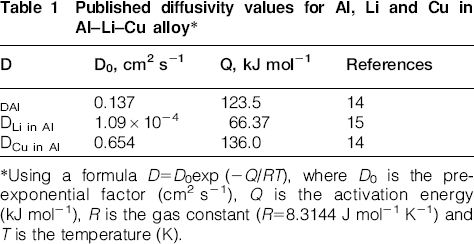
*Using a formula D = D0exp (−Q/RT), where D0 is the pre-exponential factor (cm2 s−1), Q is the activation energy (kJ mol−1), R is the gas constant (R = 8.3144 J mol−1 K−1) and T is the temperature (K).
Calculated diffusivity values for Al, Li and Cu atoms in Al at 20, 150 and 160°C*
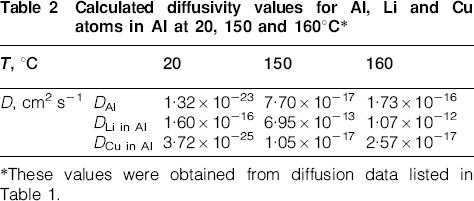
*These values were obtained from diffusion data listed in Table 1.
Transmission electron microscopy specimen as vacancy confining geometry
A nanoparticle has a convenient geometry for confining oxidation induced excess vacancies. If such a geometrical configuration is responsible for oxidation induced void formation, a TEM specimen also has geometry suitable for trapping vacancies between two top and bottom surface oxide layers. For this reason, a surface oxide layer for TEM specimens can be considering as a two-dimensional vacancy mask, as opposed to a three-dimensional one for a nanoparticle (see Fig. 4). In the two-dimensional geometry, oxidation induced vacancies can dissipate laterally over the film plane, although they can be confined between two surface oxide films separated by the specimen thickness (100–150 nm). Note that the degree of vacancy confinement decreases with increasing specimen thickness. Thus, vacancies are less confined in TEM specimens than those in nanoparticles, making the formation of voids less plausible. The average diffusion distance of Li atoms can be estimated using the relationship x = (2Dt)1/2, where x is the average distance that an atom can travel, D is the diffusivity and t is the time. Li atoms can travel the average of ∼10 nm in 1 h at room temperature. This diffusion distance is sufficient to form a thick oxide, as seen in Fig. 5. Figure 5 is a plan view lattice image taken from an electropolished TEM specimen of the aged alloy. There is a thin edge region containing only the amorphous oxide film M–O and a mixed amorphous oxide/crystalline metal layer M+(M+O). This amorphous oxide layer is indeed thick as predicted. In fact, this oxide film grows thicker upon room temperature storage.
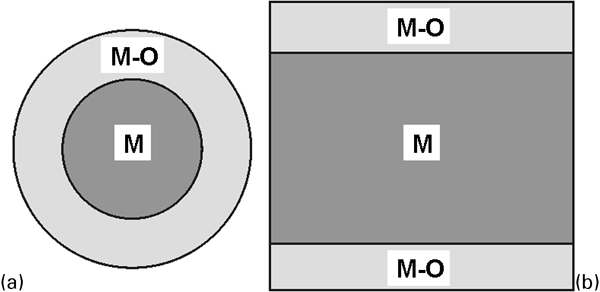
Comparison of two oxidised metal geometries (M = Al–Li alloy; M–O = Al–Li oxide)
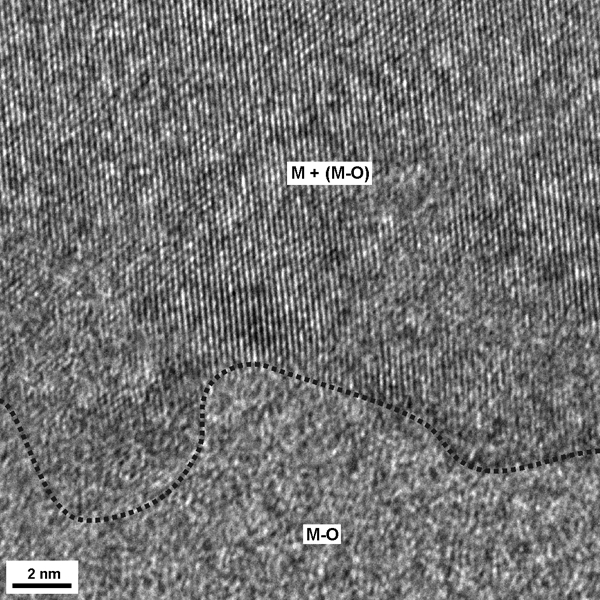
Lattice image from electropolished TEM specimen of aged alloy, showing thin edge region containing only amorphous oxide film M–O and mixed amorphous oxide/crystalline metal layer M+(M+O) [M = Al–Li alloy; M+(M–O) = (Al–Li alloy)+(Al–Li oxide)]
In support of an idea that voids might have been generated inside TEM specimens, the authors speculate that the observed voids were formed not during bulk aging at 150 or 160°C but were generated during and/or after TEM specimen preparation. Since the present TEM specimens were prepared at room temperature, the authors conclude that room temperature oxidation is responsible for the observed void formation in the alloys. Nevertheless, it should be remembered that the TEM specimen geometry is not the only requirement for observing oxidation induced voids. In addition, a site for void nucleation is needed after vacancy supersaturation is achieved.
T1 phase as preferential site for void nucleation
Transmission electron microscopy observations of the aged alloys have revealed that many voids are attached to the T1 phase. This result strongly suggests that the T1 phase must contain a preferential site for void nucleation. It was previously shown16 that the hexagonal T1 phase grows by the lateral motion of the ledge on the (0001) plane. Thus, the ledges are an important element for the growth of the T1 phase. The single ledge height corresponds to the c value of this hexagonal phase,17 which is 0·940 nm. Many of the voids attached to the T1 phase suggest that the ledges lying on the broad (0001) face might be preferred sites for void nucleation. These ledges represent the coherent/semicoherent interface between the T1 phase and the Al alloy matrix. From the orientation relationship of  ,18 the amount of mismatch at the ledge between the T1 phase and Al can be estimated. The c value of 0·940 nm for the T1 phase and a (111) interplanar spacing of 0·2338 nm for the Al alloy can be used to estimate the amount of misfit present at these ledges. Here, the value of pure Al was used as an approximate value for the lattice constant of the alloy. Multiplication of the (111) interplanar spacing by 4 yields 0·9352 nm, which can be compared with c value of T1 of 0·940 nm, leading to a modest misfit value of 0·5%. As seen in Fig. 6, atomic imaging by HAADF indeed indicates that the four {111} planes of the alloy align with the unit cell height of the T1 phase. This mismatch of 0·5% causes the ledge region of the precipitate to exert a local tensile stress in the Al alloy matrix. This tensile stress could in turn help attract oxidation induced excess vacancies towards the ledge region. When a critical vacancy concentration for void nucleation is reached, voids can be generated preferentially at these ledges. Figure 7a is a TEM image of voids attached to the T1 phase of the alloy, and Fig. 7b is a schematic view showing how voids might form from oxidation induced excess vacancies at the ledges of the T1 phase under the influence of a tensile stress.
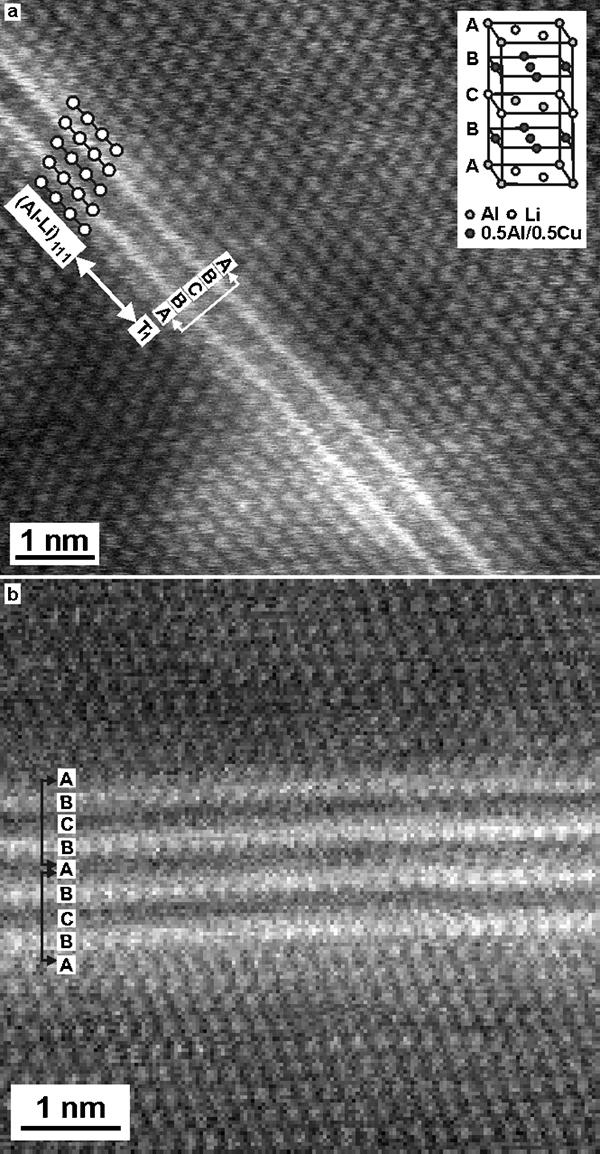
T1 phases taken by high angle annular dark field imaging: structural model of T1 phase proposed by Huang and Ardell19 is inserted in: a a single layered T1 phase showing A/B/C/B/A/ sequence and its structural relationship to 111 planes of alloy; b doubled layered T1 phase
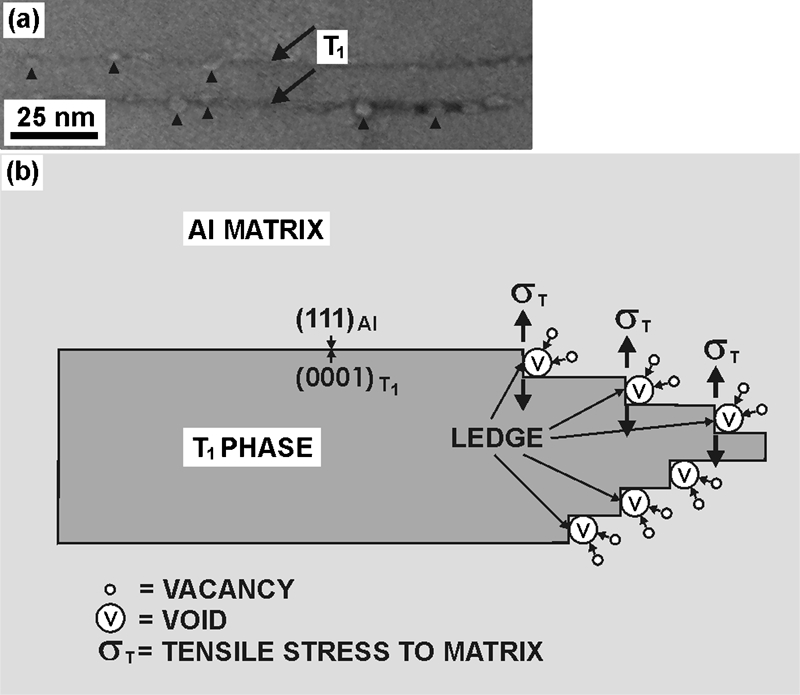
a a number of voids (marked with black triangle) attached to T1 precipitate of alloy and b schematic illustration showing how voids could nucleate preferentially at ledges of T1 precipitate from agglomerations of excess vacancies under influence of tensile stress σT, which is developed from misfit between alloy matrix and T1 phase
Conclusions
Using the defocus contrast technique, the authors have observed, for the first time, the presence of small (∼3 nm) voids in an Al–2·90Cu–1·63Li–0·29Mg–0·28Ag–0·13Zr alloy aged at 150 or 160°C. Most of these voids were found attached to the T1 phase precipitates. Although this alloy was not deliberately oxidised, the only probable cause for the presence of such small voids is thought to be due to oxidation, which generated excess vacancies. The excess vacancies then agglomerated to form voids at the T1 phase. The presence of the T1 phase provides a convenient site for agglomerations of oxidation induced excess vacancies and subsequent void nucleation. The ledges of the T1 phase were thought to be preferential sites for excess vacancies to nucleate voids because the ledges open the lattice of the alloy matrix by exerting a tensile stress to the matrix.
Contrary to the oxide of a pure Al metal, the present alloy forms porous surface oxides. In TEM specimens, a thin oxide layer can form on both the top and bottom surfaces during/after TEM specimen preparation. These surface oxide layers will act as a mask preventing vacancies from escaping to the surfaces. These trapped oxidation induced vacancies can then agglomerate at the ledges of the T1 phase and eventually form voids. In view of the fact that the geometry of TEM specimens is suitable for retaining vacancies, the authors conclude that these voids must have been formed during/after TEM specimen preparation rather than during the aging treatment.
Footnotes
Acknowledgements
The authors would like to thank Dr Serguei Belochapkine for preparing an FIB cut TEM specimen and Dr David Williams for useful discussion. The authors also thank the Application & Research Group, Electron Optics Division, JEOL Ltd and Dr Dong Tang at the FEI Ltd for taking the HAADF micrographs used in ![]() respectively.
respectively.