
Abstract
An online model is presented for the prediction of temperature distributions in the bar in the roughing mill of a hot strip mill. The model consists of an analytic model for the prediction of temperature distributions in the interstand zone, and a semianalytic model for the prediction of temperature distributions in the bite zone. The prediction accuracy of the model is examined through comparison with predictions from a finite element model.
List of symbols
forward slip, 
heat transfer coefficient due to air cooling, at the bar surface
heat transfer coefficient at the roll/bar interface
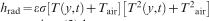
heat transfer coefficient due to radiation, at the bar surface
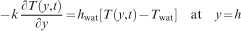
heat transfer coefficient due to water cooling, at the roll surface
heat transfer coefficient due to water cooling, at the bar surface
bar inlet thickness
bar outlet thickness
thermal conductivity
contact length at the roll/bar interface
bar length in the interstand zone
reduction ratio
roll radius
shape factor 
air temperature
roll temperature at the roll/bar interface
bar temperature at the roll/bar interface
water temperature
bar inlet temperature
bar exit temperature
normal component of the velocity vector
x, y component of the velocity vector
bar velocity in the interstand zone
roll tangential velocity
bar velocity at the roll/bar interface
bar inlet velocity at the bite zone
bar outlet velocity at the bite zone
roll/bar interface
emissivity of bar surface

effective strain

effective strain rate
coefficient of Coulomb friction
penalty constant
heat capacity
Stefan–Boltzmann constant

flow stress
normal stress
tangential stress
back tension, in a stress unit
front tension, in a stress unit
roll angular velocity
plastic deformation zone(bite zone) in the bar
Introduction
In hot strip mills and plate mills, the bar, while moving along the processing line, is subject to complex cooling and reheating, including heat loss due to air cooling and contact heat transfer, water cooling by either the descaling water or the spray water, heat generation due to plastic deformation and friction, and, sometimes, heat supply form the reheating device such as a bar heater. Since product quality – product dimensions, metallurgical and mechanical properties of the strip, and production economy – production speed, roll life, power consumption – are all critically influenced by the bar temperature, sound process control in general requires a precision model for the prediction and control of the bar temperature.
Several types of model have been proposed which may be applicable to the prediction of the bar temperature. Laasraoui and Jonas,1 based on an explicit finite difference model, calculated the temperature distribution across the thickness of the strip during hot strip rolling. Chen et al.,2 based on an integrated finite difference model and an explicit dynamic relaxation model, analysed the plastic deformation and heat transfer occurring in the strip. Devadas and Samarasekera.3 and Tseng,4 based on an Eulerian finite difference model, analysed the steady state thermal behaviour of the strip and that of the work roll. Yamada et al. 5 and Hwang et al.,6 based on an finite element (FE) model, rigorously treated the interdependence by conducting a coupled analysis of the thermomechanical behaviour of the strip and the thermal behaviour of the work roll. Recently, an analytic model7 was proposed for the prediction of temperature distribution across the thickness of the strip in the finishing mill of a hot strip mill.
In this paper, we present an analytic model for the prediction of the temperature distributions in the bar moving on the interstand zone of the roughing mill of a hot strip mill. Also presented is a semianalytic model for the prediction of temperature distributions in the bite zone. Then, it is demonstrated that the two models may be combined to produce an online model for the prediction and control of the bar temperatures while being processed in the roughing mill. The prediction accuracy of the proposed model is examined though comparison with the predictions from a FE process model.
FE model
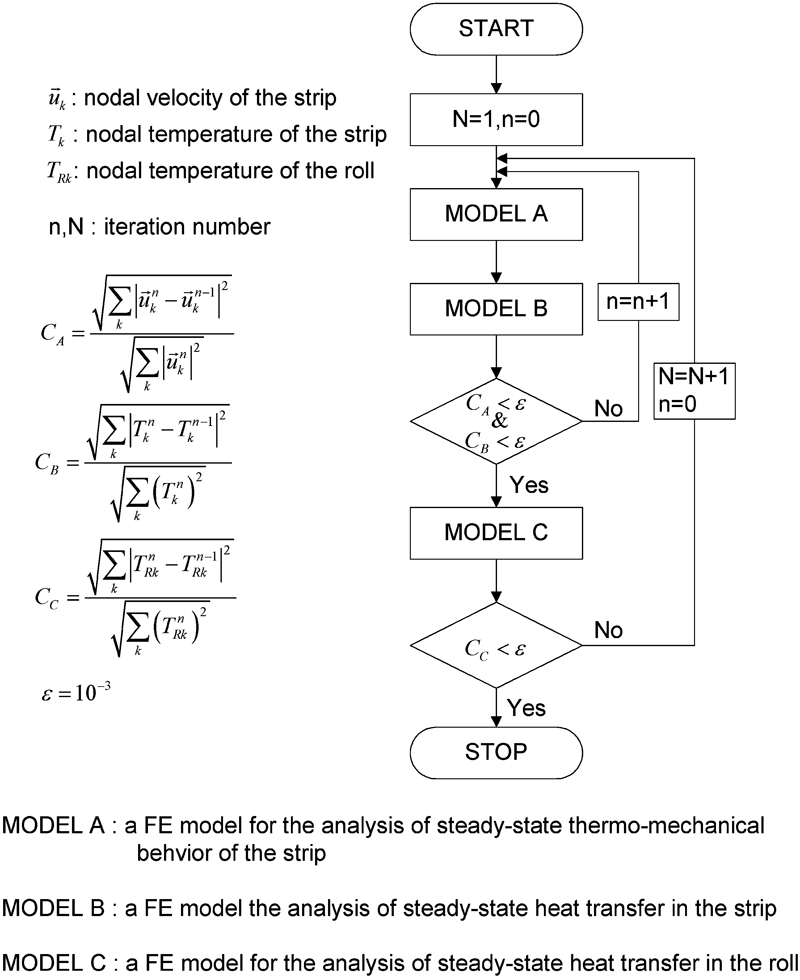
The FE model used for the examination of the prediction accuracy of an online model consists of four basic FE models: a model for the analysis of steady state thermo–viscoplastic deformation of the strip (Model A), a model for analysis of steady state heat transfer in the strip (Model B), a model for the analysis of steady state heat transfer in the work roll (Model C) and a model for analysis of non‐steady state heat transfer in the strip (Model D). As shown in Fig. 1, interaction between the thermal behaviour of the work roll and that of strip caused by roll–strip contact, as well as interaction between the thermal and mechanical behaviour of the strip, are taken into account by iterative solution schemes. Details regarding the process model and its solution accuracy are given elsewhere.8 The predicted temperature distribution in the strip as well as in the roll is illustrated in Fig. 2. Clearly seen is the effect of heat transfer from the strip to roll at the roll/strip interface, as well as the effect of heat generation in the strip due to plastic deformation.
Integrated FE model for analysis of thermomechanical behaviour of strip
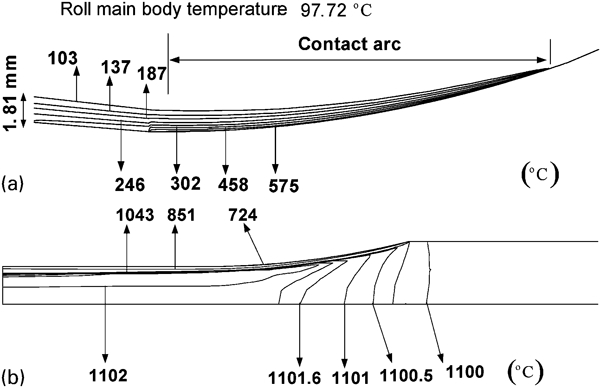
a temperature distributions in roll near bite zone, b temperature distributions in bar at bite zone, predicted from FE process simulation. Process conditions: carbon per cent of the bar material = 0·155; T 1 = 1100°C; ω = 2·718 rad s−1; R = 650 mm; H 1 = 211 mm; H 2 = 179 mm
Analytic model for prediction of bar temperature in interstand zone
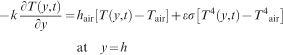
On emerging from the reheating furnace, the bar is subject to high pressure water jet for descaling, losing a substantial amount of heat. After descaling, the bar again starts to lose heat by air cooling, before and after passing through the roll gap. In general, the thermal history of a cross‐section of the bar is different from that of another cross‐section away from it, and consequently, the temperature distributions in the bar are not only time dependent but also three‐dimensional.
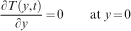
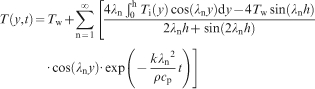
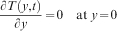
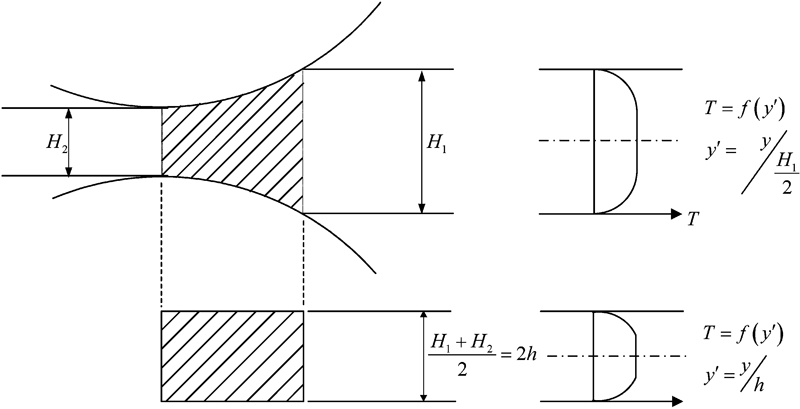
Neglecting the variation of the temperature in the transverse direction, the present problem may be transformed into an initial boundary value problem, as follows:
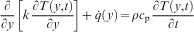
heat equation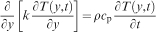
Then, equation (3) becomes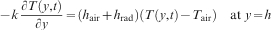


Temperature distributions in bar in interstand zone: T air = 20°C, h air = 6·96×10−6 W mm−2 °C−1
Approximate model for prediction of heat flux and heat generation in bite zone
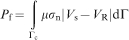
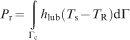
The bar temperature varies in the bite zone, mainly due to contact heat transfer and heat generation induced by plastic deformation. Let P
d, P
f and P
r

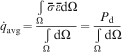
The average heat generation occurring in a particle flowing though the bite zone may approximately be given by
By examining the actual distribution of 

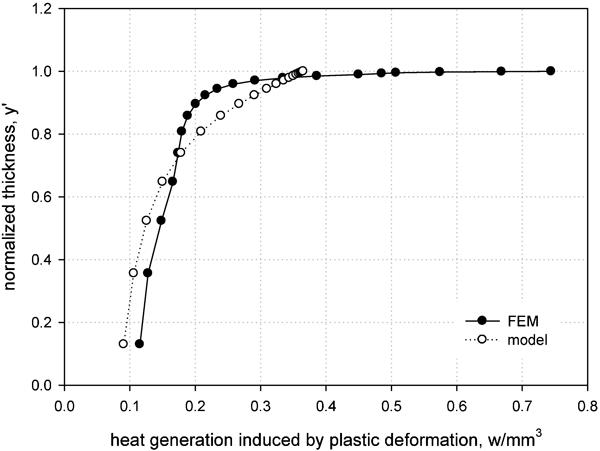
Average heat generation in bite zone of R1 stand, pass 1 (Process conditions are shown in Table 1)
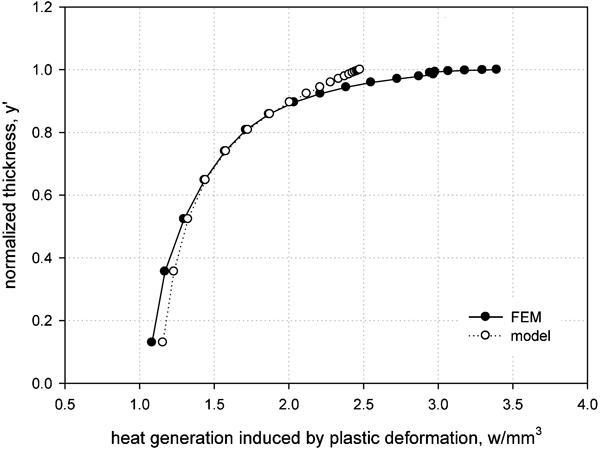
Average heat generation in bite zone of R2 stand, pass 3 (Process conditions are shown in Table 1)
FE process conditions
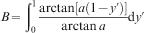
Integration of equation (14)
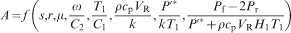
It is found from a series of FE process simulation that the effect of ω and 
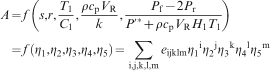
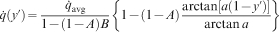
Selecting α = 5, the distribution of 
Semianalytical model for prediction of bar temperature in bite zone
Note that heat transfer then average heat flowrate at the roll and bar interface s calculated from


Approximation of bite zone and inlet temperature distributions
We may solve the problem by using the method of eigenfunction expansion. The solution procedure is described in detail in the Appendix.
The result may be summarised as follows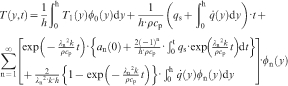
The following procedure may then be taken to predict the temperature distribution in the bite zone:
calculate P f and P r from the mathematical expressions derived by Lee et al. 8
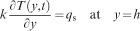
calculate q s from equation (22)
calculate P d from the mathematical expressions derived by Lee et al. 8 and A from equation (21)
calculate heat generation, from equation (19)
calculate the temperature distribution, from equation (28).
Verification of model
A roughing mill consists of several mill stands, as shown in Fig. 7a . Because the length of the processing line as well as the bar length is extremely large, the FE simulation considering the bar as an analysis domain is impractical in the light of the computational efficiency. An alternative choice would be to divide the roughing mill into several subzones. As shown in Fig. 7b , each zone may be classified into one of the following four types: the first zone, which represents a region located in front of the first mill stand, the last zone, which represents a region located between the last mill stand and somewhere downstream, near the finishing mill for example, an interstand zone, and a bite zone. The FE simulation may be preformed for each zone in sequence, starting from first zone and employing the temperatures predicted at the current zone as the inlet boundary conditions for the next zone.
a outline of roughing mill and b definition of subzones
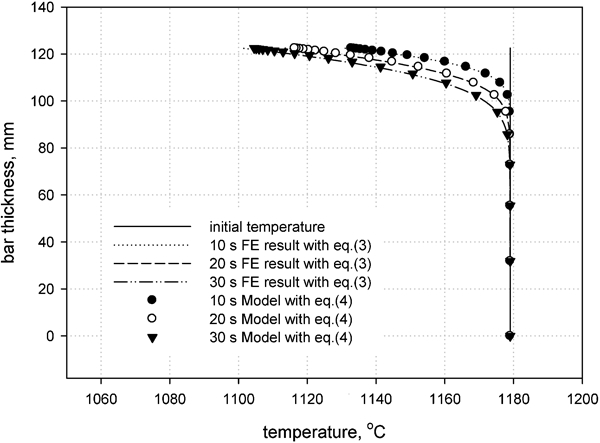
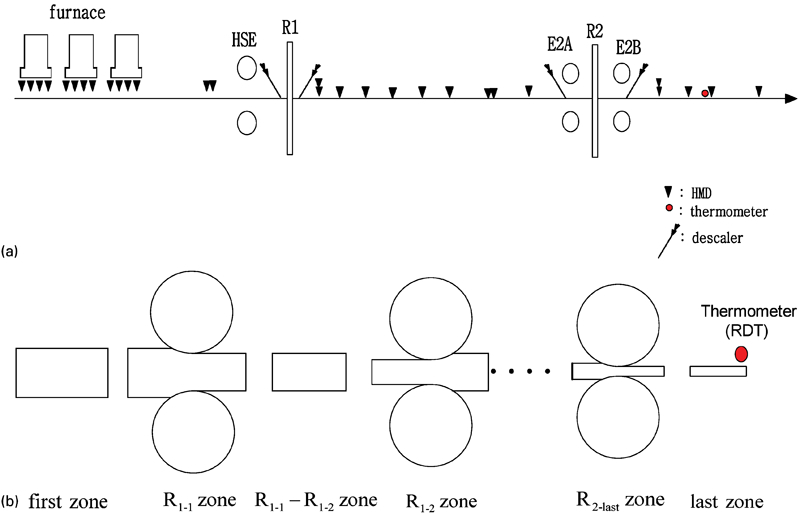
The predictions are in excellent agreement with FE predictions, as partially illustrated in Figs. 8 and 9, and also with measurements, as shown in Fig. 10, indicating that the assumptions made for the derivation of the interstand zone model as well as for the derivation of the bite zone model are valid. It is noted that the average strip temperature may possibly be seriously underestimated if the measurement of the surface temperature is made near the roll exit. It is also noted that at the roughing mill draft temperature (RDT) zone from which finish rolling starts, the temperature difference between the surface and the centre of the bar may become as high as 150°C, as shown in Fig. 11, indicating that, if it is assumed that the bar temperature is uniform and equal to its surface temperature, the strip temperature may possibly be underestimated at the end of finish rolling.
Temperature distributions at inlet of the bite zone of R1 stand pass 1 and at outlet of bite zone of R1 stand, pass 1 (Process conditions are shown in Table 1)
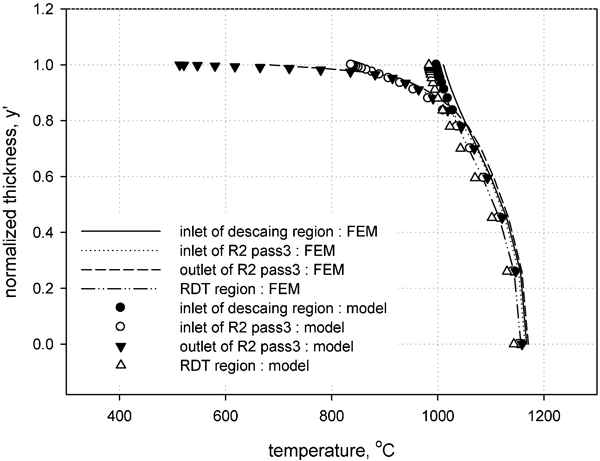
Temperature distributions at inlet of bite zone of R2 stand, pass 3 and at outlet of bite zone of R2 stand, pass 3 (Process conditions are shown in Table 1)
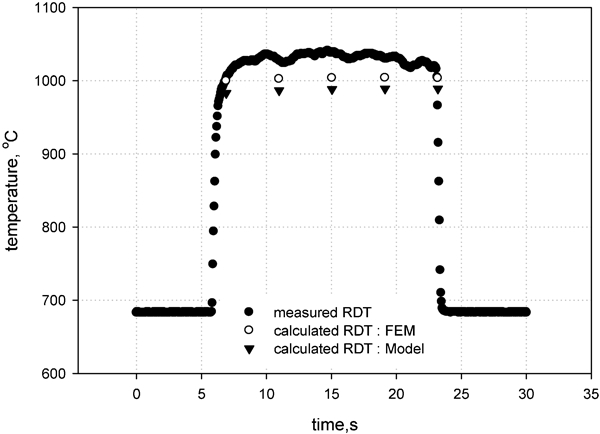
RDT temperatures, measurement and prediction
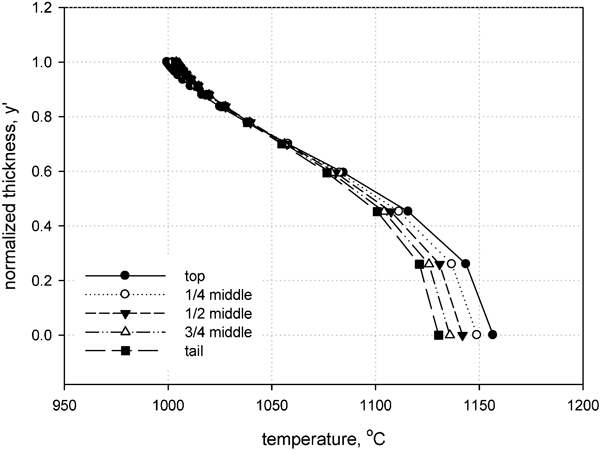
Temperature distributions in bar at RDT zone
Conclusions
The model presented in this paper may serve as an effective tool for the precise control of production speed and pressure of water sprayed in the interstand zone, to achieve the desired RDT. The model may also serve as a sound basis for exactly deducing the temperature distributions and the average temperature of the bar from the measurement of the surface temperature made in the production line, which is vital for enhancing the predicting accuracy of the models for predicting the roll force and roll power, as well as those for predicting the metallurgical behaviour of the product.