
Abstract
The thermal or process efficiency in gas metal arc welding (GMAW) is a crucial input to numerical models of the process and requires the use of an accurate welding calorimeter. In this paper, the authors compare a liquid nitrogen calorimeter with an insulated box calorimeter for measuring the process efficiency of Fronius cold metal transfer, Lincoln surface tension transfer and RapidArc, Kemppi FastRoot and standard pulsed GMAW. All of the controlled dip transfer processes had a process efficiency of ∼85% when measured with the liquid nitrogen calorimeter. This value was slightly higher when welding in a groove and slightly lower for the RapidArc and pulsed GMAW. The efficiency measured with the insulated box calorimeter was slightly lower, but it had the advantage of a much smaller random error.
Introduction
When undertaking the numerical modelling of a welding process, it is important to know the process efficiency and to understand how this varies with the welding waveform and the weld geometry. The process efficiency η can be calculated with the following equation1

Although a number of methods can be used to calculate the nominal energy input from the power supply, the most accurate method is
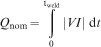
When this is divided by the duration of the weld, it is often called the ‘average instantaneous power’.
The weld arc power input to the plate is commonly measured with the Seebeck calorimeter,2–
5 which calculates the heat loss from an insulated box. The box is closed after welding, and water is subsequently used to cool it down to room temperature. The temperature difference between the inlet and outlet water flows is measured and integrated to give an estimate of the total energy input to the plate. Although it is claimed that the method is accurate to within 1% once the sample is in the calorimeter,3 each measurement can take up to 6 h,5 and the heat losses that occur before the sample being put into the calorimeter need to be considered. More recently, a number of authors have used a liquid nitrogen calorimeter,6–
9 since measurements can be made much more rapidly. After completing the weld, the plate is rapidly inserted into a Dewar containing liquid nitrogen, and the amount of liquid boiled off is measured. By knowing the vaporisation energy of liquid nitrogen, the calorimetric energy input to the plate can be determined with

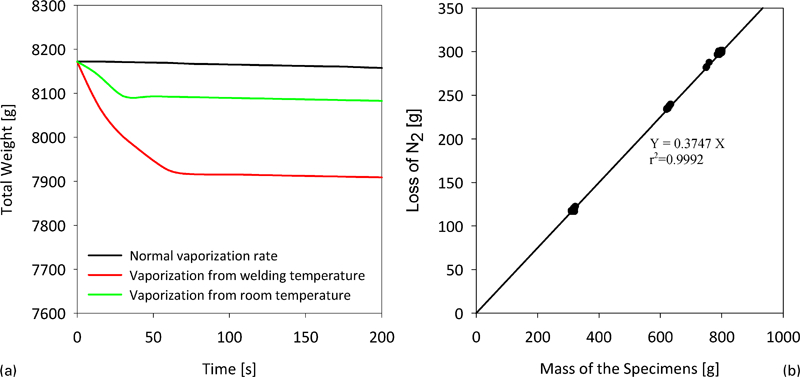
In the final method used by Cantin and Francis,10 the weld is performed in an insulated box, and the final stabilised temperature of the welded plates and backing bar is measured. The calorimetric energy input to the plate is found by
One disadvantage common to all of the above methods is the uncontrolled heat losses which occur. Some examples are the heat losses which occur before insertion into the calorimeter or those that occur before the calorimeter is being sealed. The dry calorimeter method described above also has the problem of the heat losses through the insulated box. A method which overcomes these problems is to back-calculate the value from a numerical model.11 Although this method overcomes this problem, there are other problems with this method, such as the uncertainty in thermocouple measurements, material properties and, in particular, the boundary condition which exists between the sample and the backing bar.
These methods have been applied to a variety of processes, including gas tungsten arc welding (GTAW),2, 4, 5, 10 gas metal arc welding (GMAW)3, 6, 7, 9, 12 and plasma arc welding.2, 3 The process efficiency for the consumable electrode processes is generally about 10–20% higher than that for non-consumable processes.3 Different authors have reported widely varying values of process efficiency for GMAW, which is the subject of this investigation. Although most articles claim that it lies between 80 and 90%,3, 9, 12 some articles have reported values as low as 70%.6, 7
Although there are different transfer modes in GMAW, the ones relevant to this article are spray, pulsed, dip (sometimes called short circuiting) and controlled dip transfers, which are described in the work of Norrish.13 Spray transfer occurs at large currents and wire feed speeds, and involves a continuous stream of small diameter droplets. Pulsed transfer is characterised by a pulsed current waveform, and a droplet is detached with each pulse. The droplet has a similar size to that of the wire diameter, and the process has low levels of spatter. Dip transfer occurs when the currents and voltages are generally low and the wire ‘dips’ into the weld pool. Without electronic control of the power supply, the short circuit causes a significant increase in current, which results in an explosive rupture of the wire and high levels of spatter. A number of power supply manufacturers have developed methods for overcoming this problem based on the early work of Broughton and MacGregor,14 which involves detecting and reducing the current before the short circuit occurs. Examples are Lincoln surface tension transfer (STT) and Kemppi FastROOT, and as the name suggests, metal is transferred to the weld pool by surface tension. All these processes have low levels of heat input. Fronius have developed a process called Cold Metal Transfer (CMT),15 which combines controlled dip transfer with an oscillating wire motion, and it is claimed that this power supply has an even lower heat input. One final power supply, which is relevant to this work, is Lincoln RapidArc, where there is sufficient current during arcing to cause spray transfer. Although it is claimed that short circuiting occurs in this process, an extensive investigation by Pepe10 indicated no evidence for this, and the process was characterised by pulsed spray transfer.
When comparing the process efficiency of the different transfer modes, investigators have found little difference between constant voltage and pulsed transfer.6, 12 However, two articles have reported that the efficiency with dip or STT (controlled dip) modes is significantly higher, up to 95%.7, 12
One of the interesting questions raised about process efficiency measurements is, ‘What happens to the energy that is not transferred to the workpiece?’. The heat losses will be in the form of either evaporation of the weld metal, radiation, convection or conduction from the welding torch. Obtaining accurate values of each of these contributions is difficult. DuPont and Marder3 claimed that the losses from the weld pool and the surrounding area combined accounted for only 1–2%. Presumably, the remaining heat losses (10–20%) come from arc radiation. This is supported by the theoretical work of Tanaka and Lowke,16 who claimed that 18% of the heat loss was from arc radiation and a further 5% came from conduction and radiation from the tungsten cathode in GTAW.
This still does not explain the approximately 10–20% difference in process efficiency measured between consumable and non-consumable processes. DuPont and Marder3 claimed that the higher efficiency in GMAW is because the electrode heating is added to the heat of the process, whereas in GTAW, this heat is lost in the torch. However, if the heat loss from the electrode in GTAW is ∼5% as claimed by Tanaka and Lowke,16 a further explanation is required. This may be provided by the difference in arc temperature between GMAW and GTAW. Interestingly, few measurements have been made of the arc temperature in GMAW, and it has often been assumed that temperatures similar to GTAW (up to 20 000 K under the electrode) are obtained.17 Recent arc temperature measurements by Zielińska et al. 18 indicate that this may not be the case and that a peak temperature of 13 000 K may occur in GMAW. It was postulated that this lower temperature was due to the cooling effect of iron vapour from the wire. The reduced radiation losses from the lower temperature arc may explain the higher efficiency of GMAW. Finally, numerical investigations such as those of Lim et al. 19 state that energy transfer to the welded plate is from both the arc and the liquid metal transfer from the wire. To the authors’ knowledge, no investigations have examined the efficiencies of these individual contributions.
In this paper, the authors aim to better understand the process efficiency of controlled dip transfer GMAW processes and compare them with a standard pulsed GMAW process. In addition, a liquid nitrogen calorimeter is compared with an insulated box calorimeter to determine the most effective method for measuring the process efficiency.
Experimental
Liquid nitrogen calorimeter
In the experiments, the authors used mild steel EN440 G3Si1-S355JR of size 100×200×2 mm. Before welding, the surface of each of the plates was ground and degreased with acetone. The filler metal used was 1 mm diameter EN10025-S355JR with a shielding gas mixture containing 20%CO2 and 80%Ar. The plates were clamped away from the weld with aluminium clamps.
Three trials were performed with the liquid nitrogen calorimeter. In the first trial, the authors investigated the effect of the welding duration time on the process efficiency. The trial used the Fronius CMT15 process. The standard synergic line for this material was used with a wire feed speed of 7·8 m min−1, a welding speed of 0·5 m min−1 and a contact tip to work distance of 13·5 mm. The welding duration time was varied between 5 and 24 s. In the second trial, the delay time between completing the weld and inserting the sample in the liquid nitrogen Dewar was varied. The delay time is required to unclamp the plate and transfer it to the Dewar, and the average time for this operation under normal conditions was ∼5 s. These tests varied the delay time between 5 and 900 s while keeping the welding time constant at 10 s.
The third trial involved a comparison between Fronius CMT, Lincoln RapidArc and STT and Kemppi FastROOT processes. These trials used wire feed speeds between 3 and 9·4 m min−1, a contact tip to work distance of 13·5 mm, welding speeds between 0·2 and 0·8 m min−1 and a welding time of ∼10 s.
In all the welding trials, the arc voltage was measured at the contact tip, and the current was measured by a LEM PR1030 probe attached to the power cable, which gave an output voltage which is proportional to the current. A Yokagawa oscilloscope was used to record instantaneous values of arc voltage and current (via the probe) and wire feed speed (via a tachometer) at a sampling rate of 5000 Hz. The energy input from the power supply was calculated with equation (2).
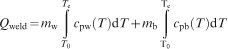
The liquid nitrogen was contained in a Statebourne Cryogenics Dewar which was 150 mm in diameter and 297 mm in height. The Dewar was always filled to <75% capacity, which avoided liquid nitrogen being lost due to splashing. The weight loss due to liquid nitrogen vaporisation was measured using a Salter Brecknell B220 scale and was used to calculate ΔmWT and ΔmRT (equation (3)). Typical plots of the change in mass of the Dewar, due to normal vaporisation, and welding and room temperature samples, is shown in Fig. 1a. Note that the mass loss due to normal vaporisation is accounted for in the calculations. Rather than doing a separate test for each room temperature sample, it is possible to determine a calibration curve which relates the nitrogen mass loss to the mass of the specimen, which is shown in Fig. 1b.
a comparison between normal vaporisation rate of liquid nitrogen with vaporisation from welding and room temperature samples, and b correlation between mass of specimen and amount of liquid nitrogen evaporated for samples initially at room temperature
Insulated box calorimeter
The base material used for the experiments was S235 J2, and two material sizes were used for the analysis. The first, which was used for the bead on plate (BOP) experiments, was 250 mm long, 50 mm wide and 5 mm thick. The other sample, which was used for the square groove (SG) experiments, had the same overall dimensions except that the thickness was 12 mm and it had the machined slot, which is shown in Fig. 2a. All samples were sandblasted before welding, except for two of the SG samples, where the original milled condition was used to determine the effect of different reflectivities.
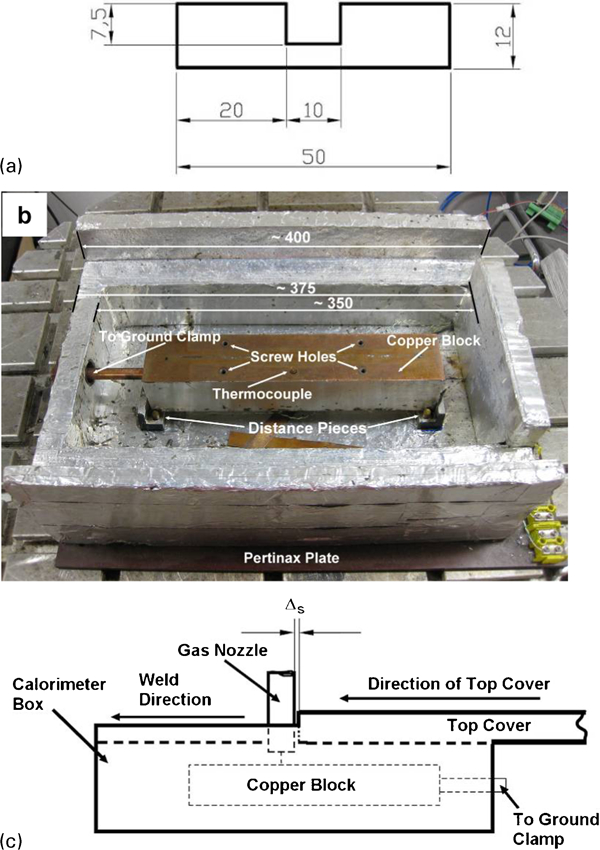
a dimensions of groove, b calorimeter design showing inside of insulated box with copper block and c schematic showing how calorimeter works while welding
The filler wire used for the trials was 1·0 mm diameter G3Si1 (DIN EN440). Ar with 18%CO2 was used for the shielding gas, which had a flowrate of 12 L min−1. The contact tip to work distance was 12 mm for all the welds, and the torch was mounted normal to the plate surface. Synergic lines were used for both the pulsed and CMT processes, and the wire feed speed was set to 8 m min−1 for all welds and the travel speed to 0·6 m min−1. For the 210 mm length welds, the duration of each weld was 21 s. The welding conditions were repeated three times for the BOP welds and two times for each of the SG welds. The energy input to the plate was calculated with equation (2), and the arc voltage (at the contact tip) and current (via an LEM probe) were measured with a Tektronix DPO 4034 oscilloscope.
The calorimeter design is similar to that reported by Cantin and Francis10 and is shown in Fig. 2b and c. The steel plates are attached to a large copper block, and a cover is placed on top of the weld (Fig. 2c). Three thermocouples are used to measure the temperature of the copper block and are placed at the beginning, middle and end of the block. The inside of the calorimeter is constructed from polyurethane foam, which is coated with a self-adhesive aluminium foil. The foil is used to reflect the radiant heat back into the calorimeter to reduce heat loss. Although there will be some heat loss with the device, both the specific heat and thermal conductivity of the polyurethane are very low.
The calorimetric energy input to the plate is calculated with equation (4). Since the total temperature rise is usually relatively small (20–30°C), constant values of specific heat were used and multiplied by the temperature difference before and after welding. A value of 484 J kg−1 K−1 was used for the specific heat of S235, and a value of 388 J kg−1 K−1 was used for the copper backing bar. Both of these values were obtained from unpublished sources, but are similar to those reported by Holman.20 The total mass of the steel and copper components was measured with an accurate scale.
Results and discussion
Liquid nitrogen calorimeter
The results from the trial that investigated the effect of the welding time are shown in Fig. 3a. Although there is a large amount of scatter in the results (±8%), they indicate that the process efficiency reduces with increasing welding time. The reduction in efficiency is caused by conduction from the sample into the jig, as well as by convection from the sample after it is welded. An exponential curve has been fit to the data since it will asymptote to an efficiency of 0% for infinite weld times. Note, however, that for the range of weld duration times investigated in this study, the relationship is approximately linear. Indeed, the process efficiency is reduced by 12% after a 25 s weld compared with one that (theoretically) takes 0 s. A similar plot showing the effect of the delay time between completing welding and inserting the specimen into the liquid nitrogen Dewar is shown in Fig. 3b. This plot demonstrates how increased delay times reduce the calculated process efficiency. Thus, to calculate the actual process efficiency, it is necessary to subtract the errors due to both the welding and delay times. For a 10 s weld, the welding time error is ∼3%, and for a 5 s delay, the delay time error is 2%. Hence, the total error is 5%, which is applied to the results in the welding process comparison in Fig. 3c. Although the results are shown as a function of the arc power, the influence of this parameter is weak. In similar investigations, DuPont and Marder3 found little effect of the current on the process efficiency, while Bosworth13 found a small reduction with increasing burn-off. Of more interest is the difference in efficiency between the processes, which indicate that the STT, FastROOT and CMT processes have a process efficiency of ∼85%, while the RapidArc process has the lowest efficiency of 78%.
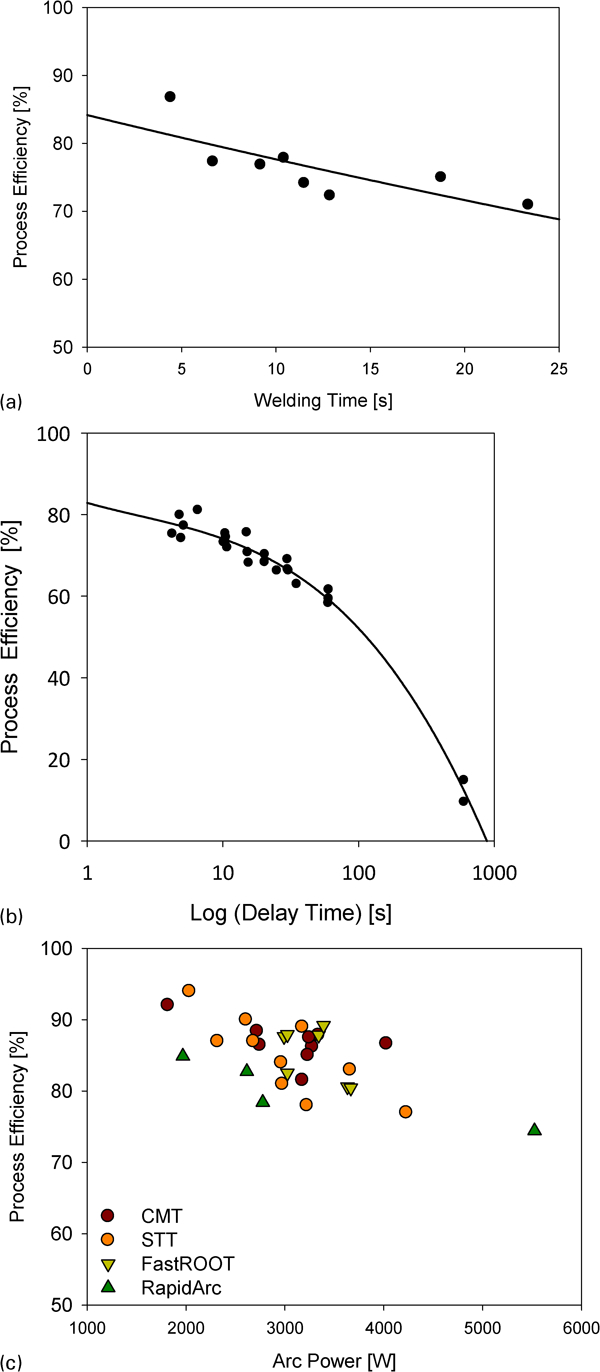
Effect of a welding duration time, b delay time and c welding process on process efficiency
The relatively low process efficiency of the RapidArc process is a surprising result. As stated previously, the peak current is sufficient to induce spray transfer. Indeed, Pepe9 showed that the peak current was in excess of 400 A compared to 250–350 A for the other processes. In addition, the arc voltage is 2–4 V greater, which can also lead to lower process efficiencies due to the greater arc length, as demonstrated by Bosworth.12 Finally, it should be noted that the efficiencies in Fig. 3c are plotted against the average arc power, rather than the instantaneous arc power. Most articles in the literature report processes which are in steady state, so the average and instantaneous powers are identical.
Insulated box calorimeter
A typical plot of the temperature versus time from the thermocouples in the insulated box calorimeter is shown in Fig. 4. As demonstrated by this plot, the temperature reaches a steady state value of ∼200–300 s after welding. The slope of this curve was measured after the system reached steady state and indicated a temperature drop of ∼0·21°C every 100 s, which corresponds to a heat loss rate of ∼5·3 W. This value was used to adjust the subsequent calculations for the energy input to the plate.
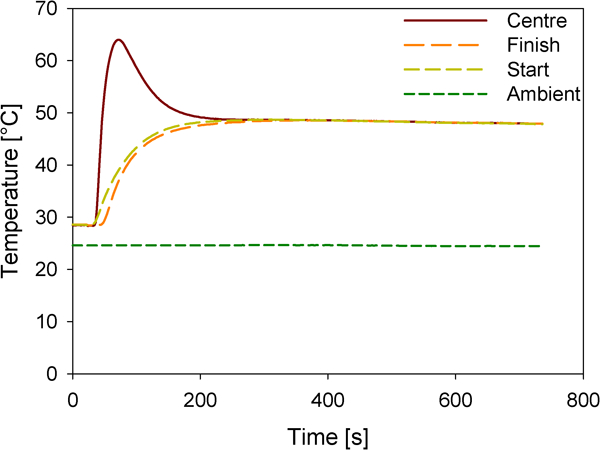
Temperature measurements from CMT BOP weld
A plot of the calorimetric power input and the average instantaneous power is shown in Fig. 5a. The error bars in this plot and the subsequent one indicate the spread in the experimental data, rather than the standard deviation due to insufficient data. The plot of the powers shows how the CMT process has approximately 35–40% lower average instantaneous power than the comparable pulsed GMAW (GMAW-P) process for the same wire feed speed. There was no significant difference between the milled and sandblasted surface preparations in either the calorimetric power input or the average instantaneous power. Hence, the surface condition has little effect in terms of increasing the absorption. Note that this is to be expected if the welding temperature oxidises the surface in the vicinity of the arc.
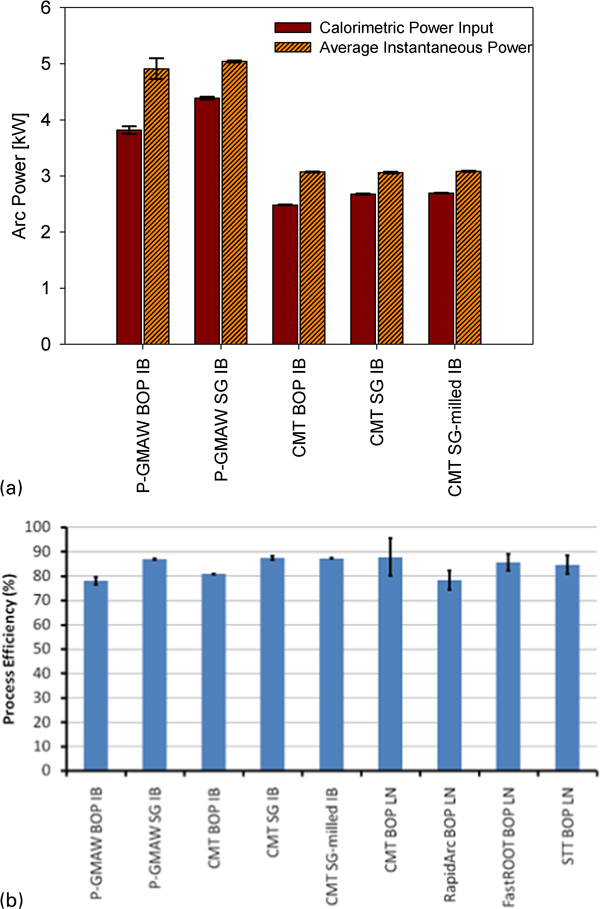
a calorimetric power input and average instantaneous power and b process efficiency for different geometries, power supplies and measurement methods (IB: insulated box; LN: liquid nitrogen)
The process efficiencies are shown in Fig. 5b and include average values from the liquid nitrogen calorimeter. These results indicate a relatively small difference in process efficiency between the GMAW-P and CMT processes. This finding contradicts Bosworth,12 who investigated dip transfer and found an efficiency of 94% compared with 85% for the standard process. Similarly, Hsu and Soltis7 found that the process efficiency of the dip and STT modes was 85% compared with 73% for the standard process. In pure short circuiting mode, there is no electronic control of the power supply, which reduces the current when the short circuit occurs. Therefore, a considerable amount of the heating will occur resistively, without the corresponding radiation heat loss. In CMT (and STT), there is very little resistive heating due to the current being electronically reduced during short circuiting. Therefore, the heat is provided predominantly with the arc, which has the associated radiation heat loss. Hence, it is not surprising that the efficiencies are similar to the GMAW-P process. The 7–9% difference in efficiency between the BOP and SG welds is significant and indicates that this radiation heat loss is now being captured by the walls of the groove. This is in agreement with the findings of Bosworth.12
Comparison between calorimetric methods
Irrespective of the method used, accurate measurements of weld process efficiency are difficult and fraught with both systematic and random errors. Unless the systematic errors are accounted for, this can lead to underestimates of the actual process efficiency. Only the CMT process is common to both calorimetric methods, with the liquid nitrogen method giving an average value of 88% and the insulated box method giving a value of 81%. One reason for the lower value with the insulated box method is that although an error was included for the conductive heat losses from the box, this did not include a value based on the duration time like the first set of experiments (Fig. 3a). This loss would capture the effects of convection, which were not adequately accounted for. Overall, the efficiencies measured in this work are consistent with those of researchers who claim that the efficiency for GMAW is between 80 and 90%.3, 5, 12
Both calorimetric methods are considerably faster than the Seebeck calorimeter, with the liquid nitrogen measurement taking ∼1 min and the insulated box calorimeter taking 5–6 min. One particular advantage with the insulated box calorimeter is the much smaller random error. Although only two or three experiments were undertaken for each condition, the error was less than ±1·5%. This contrasts with up to ±8% error in measurements with the liquid nitrogen calorimeter. The main disadvantage of the insulated box calorimeter is that it requires a reasonably accurate prediction of the specific heat for the materials being welded. This may be difficult to obtain for exotic materials.
Conclusions
In this paper, the authors demonstrated how both the liquid nitrogen and insulated box calorimeters can be used to measure the process efficiency of various controlled GMAW processes. The following were demonstrated.
The causes of systematic error need to be estimated and included in the calculations.
All of the controlled dip transfer processes measured with the liquid nitrogen calorimeter had a process efficiency of ∼85%, compared with 78% for the Lincoln RapidArc process. It was postulated that the lower efficiency of this process was due to the higher peak current and/or voltage, which causes spray transfer.
The process efficiency of Fronius CMT was only marginally greater (3%) than that of GMAW-P when measured by the insulated box calorimeter.
Welding in a groove increased the process efficiency to ∼90% since much of the radiation heat loss was absorbed by the side walls.
The welding efficiency for the CMT process was lower (7%) when measured with the insulated box calorimeter compared with the liquid nitrogen calorimeter. It was suggested that this may be due to the absence of the welding duration time error in the insulated box calculations.
Both calorimetric methods are considerably faster than the Seebeck calorimeter. The insulated box calorimeter has the advantage of much less random error than the liquid nitrogen calorimeter.
Footnotes
Acknowledgements
The authors would like to thank BP for their financial support of this work as well as Fronius International GmbH (Wels, Austria), which provided the facilities to perform the insulated box experiments. In addition, the authors wish to thank Mr B. Brooks, Mr F. Nielsen, Mr H. Hackl, Mr W. Stieglbauer, Mr A. Leonhartsberger, Mr G. Miessbacher and Dr A. Eder for their support and guidance.