
Abstract
A lot of welding fumes are generated due to the evaporation of magnesium during welding aluminium alloys using Al–Mg welding wires. Fume formation is mainly evaluated by two methods. An average formation rate can be calculated by collecting the fumes formed during a constant welding period. The other one is carried out by observing the droplet with a high speed video. However, these two methods become invalid in quantitatively evaluating the evaporation rate of magnesium in peak or background period during pulsed metal inert gas arc welding. In this paper, a novel method was developed to evaluate the evaporation rate and flux of magnesium in the peak period. First, a robot welding system was used to produce a series of droplets by shutting down the peak current at different times in the peak period. Second, the magnesium contents of these droplets were analysed. Finally, the evaporation rate and flux of magnesium in the peak period were calculated.
Introduction
A lot of welding fumes are produced during welding of aluminium alloys using 5xxx welding wires, which generally contain several per cents of magnesium for preventing weld cracks.1 This is owing to the high vapour pressure of magnesium.2 Fume formation has been studied in many industrial materials.3– 17 In mild steel, the fumes are composed of 40–60%Fe and several per cents of Mn or Si.3– 5, 10 In stainless steel, the fume compositions are reported to be 15–35%Fe, 11–17%Cr and 4–10%Ni.4 In aluminium alloy, the fumes contain 40–50%Al and 5–10%Mg.3 In some cases, nearly the same amount of magnesium as aluminium is detected from smuts.18, 19 The welding fumes can be affected by many welding conditions, such as shielding gas, arc current and voltage, which may change metal transfer modes.4– 6, 8, 9, 11, 13, 15 When the metal transfer mode changes from globular to spray,6, 15 the fume formation rate generally decreases. Concerning the arc current, the pulsed current reduces the fume formation rate, especially in alternating current mode.5, 17
Fume formation mechanisms have been studied by many researchers. The potential fume sources are classified as follows:12
the droplet surface
exploding droplet of the constricted neck during detachment
weld pool
spatters.
The most intensively discussed one is the fumes generated from the droplet surface, which is considered to be the principal origin of fumes.20 Fumes from the droplet surface are often related to its temperature and surface area.9, 17 Several models are proposed to predict the droplet temperature and calculate the metal evaporation and condensation and, finally, the metal vapour leading to fume formation.21– 24 Recently, methods for calculating the metal vapour production rate are reviewed.25 The droplet temperatures are measured using a calorimeter17, 26, 27 or two-coloured pyrometry28, 29 to obtain the average temperature or distribution. Not only the evaporation of droplet before detachment from the wire tip but also that during its transfer through the arc is reported to contribute a significant portion of the total fume formation rate.30 In another report,21 however, the evaporation resulting in fume formation from the droplets during their flying in arc may be neglected because it is small compared with the evaporation from the droplet before detachment. Fume formation caused by droplet explosion near the constricted neck is thought to be related to the boiling of magnesium.31 During pulsed arc welding, many of these can be avoided by controlling current waveforms.32 Fumes may be mainly generated from the weld pool by the evaporation of volatile elements, like magnesium and zinc in aluminium alloys or manganese in stainless steels in gas tungsten arc welding33 or laser welding.34– 36 It is reported that the evaporation from the weld pool can be ignored in gas metal arc welding.3, 21 In gas tungsten arc welding, the dominant evaporation element in 5xxx aluminium alloys is reported to be magnesium and can be predicted by the Langmuir equation.37 However, it is reported that the Langmuir equation overestimates the vaporisation rate at one atmospheric pressure.36, 38 By considering the pressure gradient driven mass transfer above the weld pool, the magnesium loss in laser welding of aluminium alloy is predicted.36 Recently, a modified Langmuir equation is used in laser welding simulation.39 About the fume formation from spatters, the effect of oxidation is discussed.16 It is reported that spatters do not substantially contribute to the fume formation because only spatters larger than a few millimetres can oxidise and produce a significant amount of fumes.
In welding aluminium alloys, pulsed metal inert gas (MIG) arc welding is generally used in many industrial fields.40 5xxx welding wires are used in many cases because of their high strength and corrosion resistance. However, fume generation is an issue in using these wires. It therefore becomes important to evaluate the fume formation from the droplet surface because the short circuiting can be controlled to nearly zero in pulsed MIG arc welding and evaporation from the weld pool can be ignored.3, 21 Up to now, the welding fumes are quantitatively evaluated by measuring the formation rates.41 Recently, a method is proposed to measure particulate fumes.42 In pulsed MIG arc welding, different arc currents are used in peak and background periods. Therefore, it is natural to consider that the fume formation behaviour is different between peak and background periods.43 However, there are no reports that discuss the evaporation phenomena in peak and background periods separately.
In this paper, a novel method was proposed to quantitatively evaluate the evaporation rate and flux of magnesium in peak period during pulsed MIG arc welding of aluminium alloys. First, wire feeding was stopped as soon as peak current was shut down at a predetermined time from the beginning of peak current, i.e. a droplet growth time TS to obtain a droplet. Second, by changing TS, a series of droplets was obtained, and a relationship between droplet volume and TS was established. By measuring the droplet surface area from a series of high speed video images, a relationship between the droplet surface area and TS was established. Third, the magnesium contents in these droplets were measured by an energy dispersion X-ray analyser (EDX), and a relationship between the magnesium content and TS was established. Finally, the evaporation rate and flux of magnesium in the peak period were calculated.
Experimental
A TAWERS arc welding system by Panasonic Welding Systems was used to produce a series of droplets, as shown in Fig. 1. After a predetermined droplet growth time TS, the peak current was abruptly shut down to zero, and the wire feeding was stopped. The shaded area in Fig. 1a shows the wire length fed after shutting-down, which was short enough (<1 mm) for preventing the wire from dipping into the weld pool. By changing TS, a series of droplets with different sizes were produced. The welding conditions and chemical compositions of the materials used are shown in Tables 1 and 2 respectively.
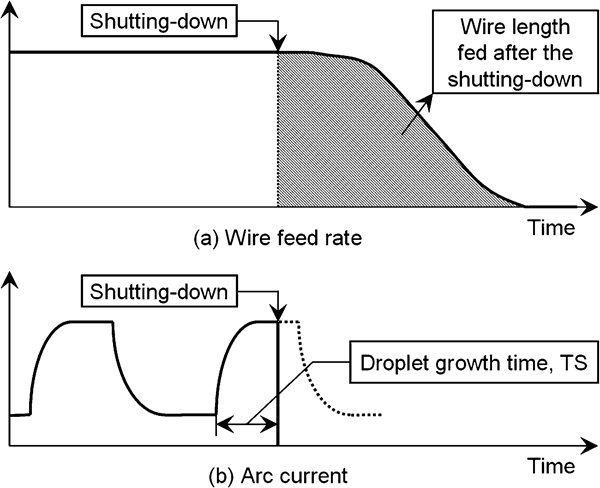
Schematic illustration of shutting-down
Materials used and welding conditions
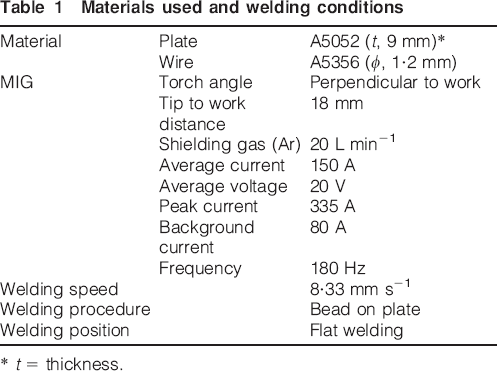
* t = thickness.
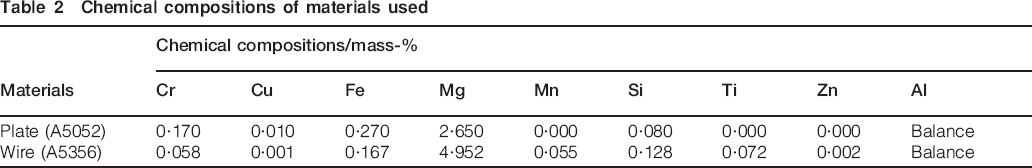
Chemical compositions of materials used
The methods for measuring droplet volume and surface area are shown in Fig. 2. An optical microscopic photo of the droplet cross-section was separated from its bottom with a 0·1 mm pitch into many cylinders or tubes. The total droplet volume was obtained by measuring the volumes of these cylinders or tubes. A high speed video image of the droplet was separated with a 0·14 mm pitch into many cylinders. The droplet surface area was obtained by measuring the side areas of these cylinders. Five droplets with the same conditions were used to measure the droplet surface area.
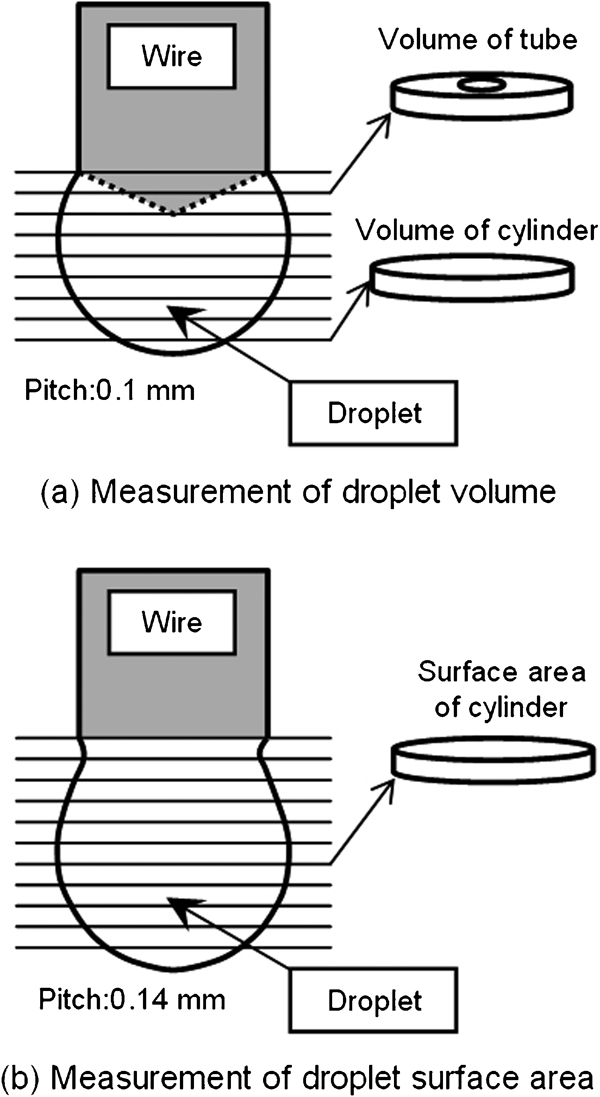
Schematic illustration for measuring droplet volume and surface area
An EDX analyser (JED-2200, JEOL) was used to analyse the magnesium contents in these droplets. Five droplet samples at the same welding conditions were used. In order to eliminate the effect of magnesium segregation, an area analysing mode with a view area of 180×240 μm was used. Three analyses were conducted at each analysed point during which the second and third analysed positions were shifted 90 μm from the first one along its both sides. The average value of these three measurements was used. The analysis error was confirmed within 6%.
A high speed video (Fastcam-NEO, Photon) was used to observe the droplet formation at 4000 frames/s. A diode laser of 23 W (wavelength, 930 nm) for illumination and a band pass filter (wavelength, 930 nm; full width at half maximum, 8·5 nm) were used.
Results
The evaporation phenomena of magnesium from the droplet at wire tip in the peak period during the pulsed MIG arc welding of aluminium alloys were quantitatively discussed. In the section on ‘Droplet growth behaviour’, the relationship among droplet volume, droplet surface area and droplet growth time TS is established by producing a series of droplets with different sizes. In the section on ‘Magnesium content in droplets’, the relationship between magnesium contents of the above droplets and TS is obtained. In the section on ‘Evaporation rate and flux of magnesium’, according to the above established three relationships accounting for TS, the evaporation rate and flux of magnesium in the peak period are calculated.
Droplet growth behaviour
The typical droplet appearances are shown in Fig. 3. It is seen that each of the droplets is nearly spherical and symmetrical with respect to the wire axis. The photos of TS = 0·70–1·60 ms show the droplets before detachment. The photo of TS = 1·66 ms shows a droplet that has just detached from the wire tip. The relationship among droplet volume Vdrop (mm3), droplet surface area Sdrop (mm2) and TS (ms) is shown in Fig. 4. When TS was under 0·5 ms, the droplet volume and surface area increased slightly. When TS was 0·5–1·6 ms, the droplet volume and surface area increased abruptly. By subtracting the droplet volume at TS = 0 ms from the one immediately before detachment, it is calculated that the droplet diameter was nearly the same as the wire diameter. The curve fitting of the measured droplet volume and surface area is shown in equations (1) and (2). The root mean square errors of equations (1) and (2) are 0·02 mm3 and 0·13 mm2 respectively


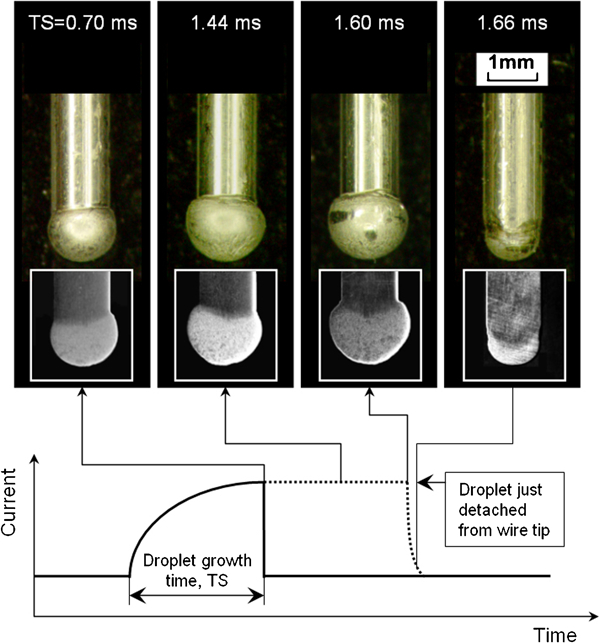
Droplet shapes at different droplet growth times
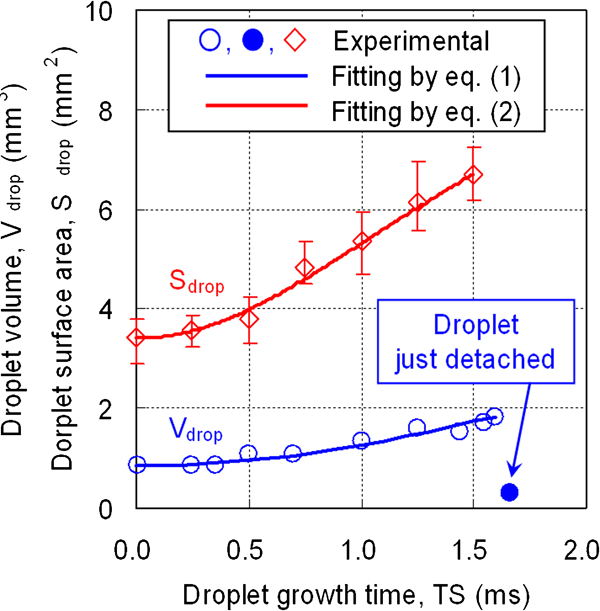
Droplet volumes and surface areas as function of droplet growth time
Magnesium content in droplets
The magnesium contents on the droplet surface are shown in Fig. 5. The horizontal axis shows the angle from the droplet bottom. When the angles are ⩽90°, the magnesium contents were 4·1 mass-%, which was nearly 1·0 mass-% lower than that in the wire. When the angle is 135°, the magnesium content was 4·7 mass-%, which was 0·6 mass-% higher than that at the droplet bottom. The reason why the magnesium content at 135° was higher than that at the other positions is attributed to the fact that this region was near the droplet–wire boundary, and one part of magnesium in wire was analysed with the area analysing mode. The magnesium contents in the droplet cross-section are shown in Fig. 6. The maximum errors of each analysed point were within 0·3 mass-%. It is seen that the magnesium contents perpendicular to the wire axis were 4·2 mass-%, which was nearly equal to the one shown in Fig. 5 when the angle was ⩽90°. On the other hand, the magnesium contents along the axis of wire were 4·1 mass-% in the molten area, which was nearly equal to the value analysed perpendicular to the wire axis.
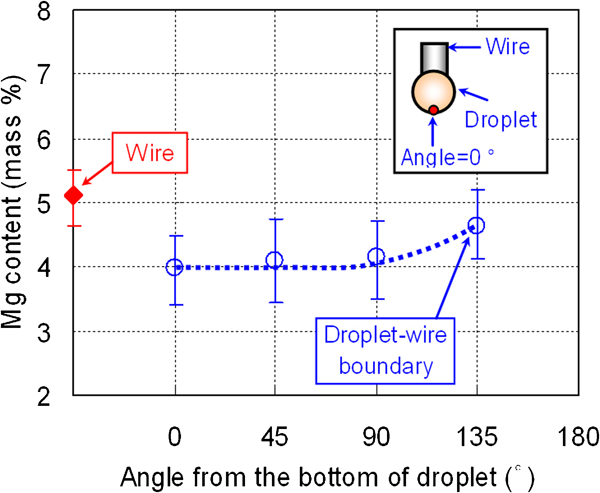
Magnesium contents around droplet surface (TS = 1·44 ms)
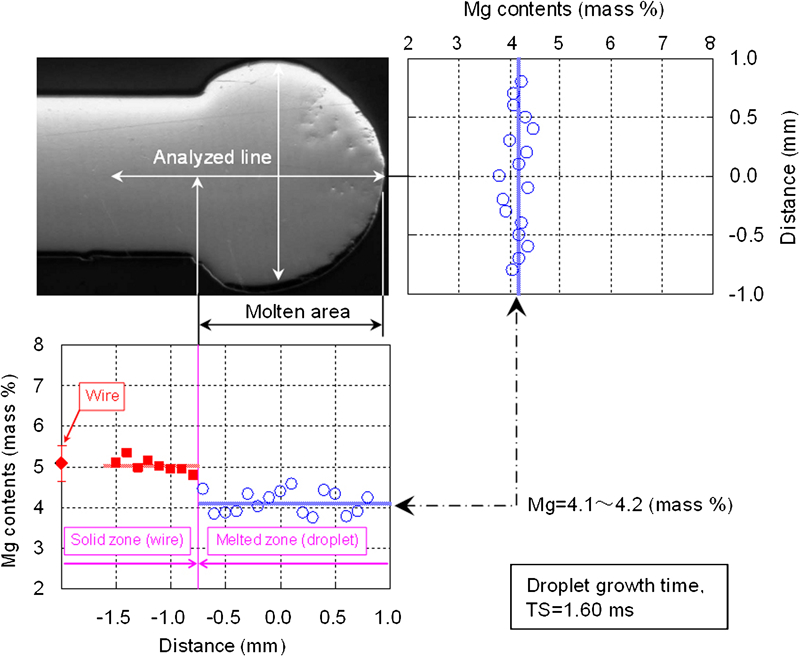
Magnesium content distribution in droplet
From the above analysed results, it is clear that the magnesium distributed in the droplet uniformly except in the region near the droplet–wire boundary. The reason is considered as follows. During pulsed MIG arc welding, a high peak current caused a strong convection in droplet.26, 44 It is this convection that made the magnesium distribute in the droplet uniformly. This is also reported in the gas metal arc welding of mild steel.45 In the following analysis, the magnesium content at the droplet bottom is used to represent the magnesium content in the droplet. The relationship between the magnesium content CMg (mass-%) and TS (ms) is shown in Fig. 7. The magnesium content immediately after the droplet detachment was 4·48 mass-%. When TS was 0, the magnesium content was 4·63 mass-%. The increase in magnesium content from 4·48 mass% just after the droplet detachment to 4·63 mass-% at TS = 0 is considered to be due to the supplement from the wire melted in the background period. It is therefore considered that magnesium was mainly evaporated in the peak period. With increasing TS the magnesium content decreased from 4·63 to 4·0 mass-% at the end of the peak period. The decrease in magnesium contents with increasing TS is considered to be caused by the evaporation of magnesium because the droplet temperatures were reported to reach their boiling points.17, 26, 31, 46 The curve fitting of the analysed magnesium content is shown in equation (3). The root mean square error of equation (3) is 0·06 mass-%.
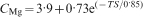
Magnesium contents as function of droplet growth time
Evaporation rate and flux of magnesium
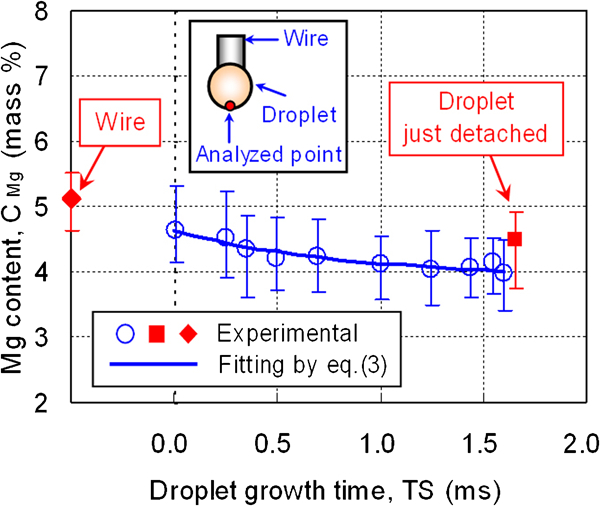
Using equations (1)–(3), the evaporation rate and flux of magnesium in the peak period were calculated. The calculating method is shown in Fig. 8. First, one peak period was divided by a time interval ΔTS ( = 0·01 ms) into TS(i) (i = 0, 1, 2, 3, …, n), where i = 0 corresponds to the beginning of the peak period. Vdrop(i), Sdrop(i) and CMg(i) (i = 0, 1, 2, 3, …, n) were calculated from equations (1)–(3) by inputting TS = iΔTS. Second, the evaporation rate of magnesium was calculated by the following five steps by putting i = 1, 2, 3, …, n.
Calculation method of magnesium evaporation rate and flux
calculating the magnesium mass WdMg(i−1) at TS(i−1), where WdMg(0) corresponds to TS = 0 and is calculated by multiplying Vdrop(0) with CMg(0)
calculating the magnesium mass WdMg(i) at TS(i)
calculating the magnesium mass WwMg in the welding wire melted in one time interval ΔTS
calculating the evaporation rate of magnesium Vvap(i) (g min−1) at TS(i) from equation (4)
 (4)
(4)
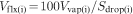
calculating the evaporation flux of magnesium Vflx(i) (g cm−2 s−1) at TS(i) from equation (5)
 (5)
(5)
The calculated evaporation rate and flux of magnesium in the peak period are shown in Fig. 9. According to the relationship among evaporation rate, flux and TS, one peak period can be divided into three regions. In region I (TS = 0–0·2 ms), a slight decrease both in evaporation rate and flux was confirmed. This is considered to be caused by the following. During TS = 0–0·2 ms, the peak current increased very fast. The anode root area on the droplet surface, therefore, spreads very quickly. Even this, the current density in the anode root is considered to be much higher than the succeeding peak period. In region I, the evaporation is considered to be mainly contributed by the one from the anode root area. In region II (TS = 0·2–1·2 ms), the evaporation rate increased very fast with increasing TS, and the flux increased slightly and finally reached a saturated value of 0·556 g cm−2 s−1. When TS increased into region III, the increase in evaporation rate slowed down a little and reached 2·275 g min−1 at the end of the peak period. On the other hand, the flux in region III decreased slightly. The tendencies of the evaporation rate and flux in regions II and III are considered to be related to the droplet formation behaviour. This will be discussed in the section on ‘Evaporation rate and flux in peak period’.
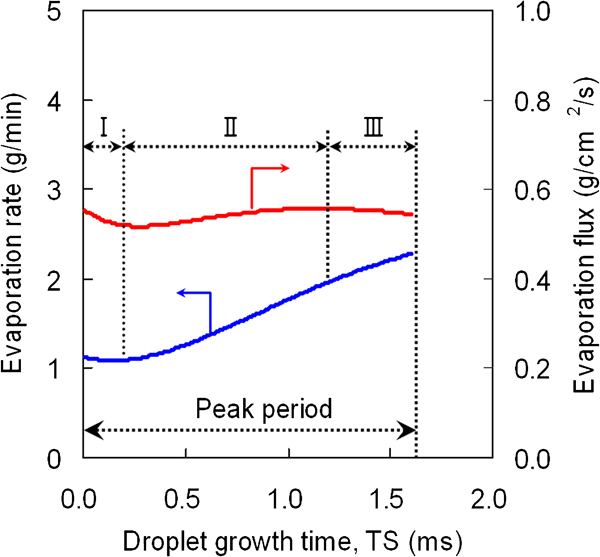
Calculated evaporation rate and flux of magnesium
Discussions
Evaporation rate and flux in peak period
As shown in the section on ‘Evaporation rate and flux of magnesium’, one peak period was divided into three regions according to the evaporation rate and flux of magnesium. The evaporation phenomena in region I was explained by the evaporation from the anode root area on the droplet surface. In this section, the evaporation phenomena in regions II and III are discussed from the view point of droplet formation. A series of high speed video images is shown in Fig. 10. Figure 10a shows the image at TS = 0 ms, Fig. 10b–g shows the images in the peak period, and Fig. 10h and i shows the images of the transition period from peak to background period. Figure 10j–r shows the images in the background period. It is seen from Fig. 10e that a neck formed near the droplet–wire boundary. From Fig. 10e–i, the neck became constricted because of the large pinch force caused by the peak current or transition current. It is also seen from Fig. 10f–l that many particulate fumes (shown as arrows) formed from the droplet surface. These particulate fumes were considered to be a mixture of magnesium and aluminium caused by the localised abrupt boiling of the molten droplet surface, because the droplet temperature became so high, nearly reaching its boiling point.17, 26, 31, 46 This is supported by the literature that both magnesium and aluminium are detected from fumes or smuts.3, 17– 19, 46 The time to particulate fume formation was measured as ∼1·35 ms from the beginning of the peak period. By comparing the results shown in Figs. 9 and 10, it is considered that the transition from region II to III nearly corresponds to the generation of the particulate fumes. From the abovementioned results, it is suggested that the evaporations in regions I and II were dominated by the evaporation of magnesium. In addition, it is suggested that the evaporation in region III was also mainly the evaporation of magnesium but accompanied with a mixture of magnesium and aluminium, which were observed as particulate fumes.
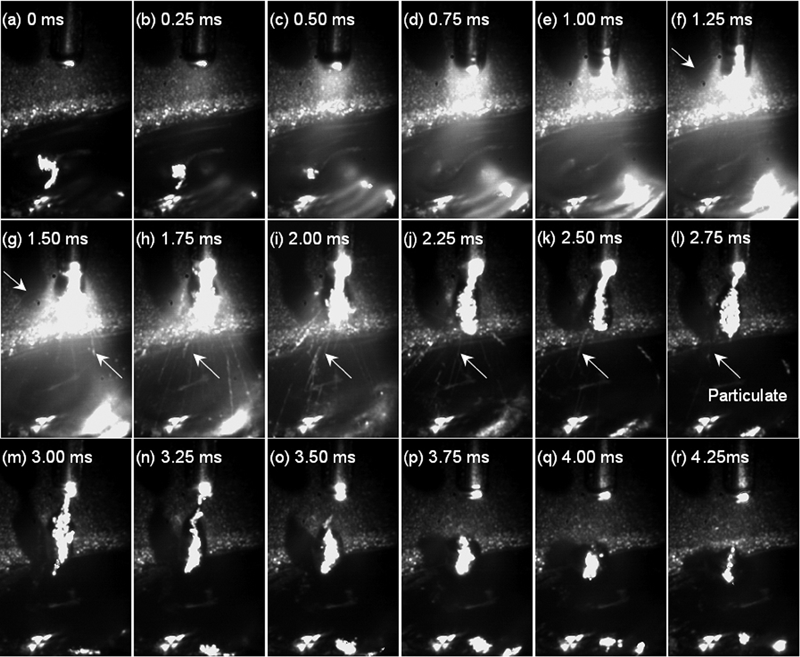
High speed video images of droplets formed at wire tip
Several parameters are considered to affect the evaporation phenomena from the droplet surface. Shielding gas and its flowrate and pulsed parameters are discussed as follows. During pulsed MIG arc welding of aluminium alloys, pure Ar is generally used. Sometimes, a mixture with He is used. The addition of He is reported to increase the fume formation rate.4 In this study, the authors used pure Ar as shielding gas. Therefore, only the effect of its flowrate needs to be discussed. According to the study on stainless steel, the fume generation rate is not affected by the gas flowrate when using a stable globular or spray transfer.15 The reason is considered to be that the plasma flowrate in arc is high enough,47 compared with the gas flowrate, to dominate the transportation of metal vapour from the droplet surface. The effect of pulsed parameters on fume formation has been reported by several authors,17, 30, 43 which can be classified as the effect of pulsed parameters on the droplet transfer mode.17, 32 In pulsed arc welding, the most stable transfer mode is one droplet by one pulse, which was used in this study. At this condition, the fume formation rate is also considered to be low.24
Estimation of droplet temperature
The evaporation of magnesium from the droplet surface is considered to be dominated by the droplet temperature.9, 17, 21–
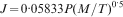
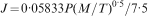
23 In order to confirm the coincidence of the calculated results of the evaporation rate and flux of magnesium in this study with the literature, the droplet temperature was estimated from the evaporation flux obtained. At the vacuum condition, the Langmuir equation is usually used to express the evaporation flux J (g cm−2 s−1) of metal37

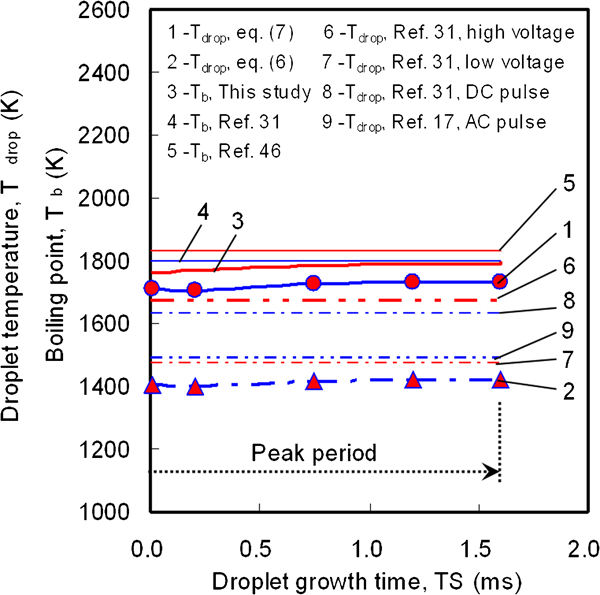
Calculated droplet temperature, boiling point and literature data
Conclusions
In this paper, the authors have developed a novel method to quantitatively evaluate the evaporation rate and flux of magnesium in the peak period during the pulse MIG arc welding of aluminium alloys. According to the calculated evaporation rate and flux of magnesium in the peak period, one peak period can be divided into three regions. In region I (TS = 0–0·2 ms), both the evaporation rate and the flux decreased slightly. In region II (TS = 0·2–1·2 ms), the evaporation rate increased abruptly, and the evaporation flux increased slightly. In region III (TS = 1·2–1·6 ms), the increase in evaporation rate slowed down a little, and the evaporation flux decreased slightly. The evaporation both in regions I and II was considered to be dominated by the evaporation of magnesium. In region III, the evaporation was suggested to be mainly the evaporation of magnesium and also accompanied with a mixture of aluminium, which was observed as particulate fumes. The droplet temperature in the peak period was calculated to be about 1700–1730 K.