
Abstract
Although Ti–6Al–4V alloys show reasonable weldability characteristics, the joint properties are greatly influenced by the welding processes. Microstructures and tensile and impact properties of welded Ti–6Al–4V alloy were evaluated for high vacuum electron beam welding, CO2 laser beam welding and gas tungsten arc welding. The resultant tensile and impact properties of the welded joints are correlated with the weld metal microstructure and hardness. The results indicate that the electron beam welding is more suitable for Ti–6Al–4V sheet welding and the welding seam without defects can be obtained. The full penetration butt welds are obtained by gas tungsten arc welding process, but they have many drawbacks such as wide weld seam, big deformation and coarse grains. Laser beam welding has many advantages such as the narrowest weld seam, the least deformation and the finest grains, but it should be studied again for the reasons of unstable welding technologies and strict condition.
Introduction
Titanium alloys have been successfully applied for aerospace, ship and chemical industries, etc. because they possess many good characteristics such as high strength to weight ratio, corrosion resistance and excellent weldability.1 With the development of titanium industries, many welding methods such as gas tungsten arc welding (GTAW), beam welding, resistance welding and diffusion welding have already been developed. Because of their high chemical activity, titanium alloys are easy to absorb harmful gases (oxygen, hydrogen and nitrogen) and many problems such as low mechanical properties and unstable structures would appear.1– 3 Gas tungsten arc welding is a most common welding method for reactive materials like titanium alloy. Laser beam welding (LBW) with high energy density and welding speed is a new welding technology. High vacuum electron beam welding can protect joints from gaseous contamination.
Mohandas et al. 4 investigated the fusion zone (FZ) microstructure and porosity in electron beam welds of α+β titanium alloy and reported that the porosity at low welding speed was low and the scale of martensite lath depended on welding speed. Early work by Sundaresan et al. 5 showed the influence of dc and ac pulsing on solidification structure of α+β titanium alloy welds and the effect of grain refinement on tensile behaviour. The influence of temperature below 450°C on the tensile properties of LBW of dual phase Ti–6Al–4V titanium alloy was investigated by Wang et al. 6 Wu et al. 7 investigated the microstructure evaluation and fracture behaviour for EBW of Ti–6Al–4V and reported that disordered and short needle morphology of weld microstructure made the fracture mechanism complex. Saresh et al. 8 investigated the effects of EBW on thick Ti–6Al–4V titanium alloy and found that the joint quality of single sided partial penetration welds can be improved by using two pass double side welding technique with lesser beam power. Balasubramanian et al. 9 developed mathematical models to predict the tensile properties of pulsed current gas tungsten arc welded Ti–6Al–4V alloy. Cao and Jahazi10 reported the effect of welding speed on surface morphology and shape, welding defects, microstructure, hardness and tensile properties of Ti–6Al–4V alloy welded using a high power Nd:YAG laser.
From the literature review, it is understood that extensive research work has been carried out on welding of Ti–6Al–4V alloy. However, most of the published information is focusing on any one of the welding processes. There is no literature available comparing the tensile properties and microstructural features of GTAW, LBW and EBW joints of Ti–6Al–4V alloy. Hence, the present investigation was carried out to compare the tensile properties and microstructural characteristics of GTAW, LBW and EBW joints of Ti–6Al–4V alloy.
Experimental
The rolled plates of Ti–6Al–4V alloy of 75×300×5·4 mm were welded, maintaining the rolling direction of plates as normal to the welding direction. After machining and cleaning, with the gaseous protection of helium and argon, CO2 LBW (DC035 Slab CO2 laser; Rofin Sinar Laser GmbH) and GTAW processes were carried out. The filler rod of 3 mm diameter was used for GTAW process. Electron beam welding was carried out on a low kV EBW machine of 60 kV and 80 kW capacity (Techmata, France). Rolled plates of 5·4 mm thick were butt welded at a constant beam voltage of 55 kV and a beam current of 50 mA at 0·65 m min−1. The chemical compositions for the parent metal and filler rod are shown in Table 1. Table 2 shows the parameters of welding processes used to fabricate the joints. The standard impact and tensile (both unnotched and notched) samples were prepared according to the ASTM E23-08 and ASTM E8-08 specifications respectively. Three specimens from each joint were prepared and the average values are taken for the discussion of tensile and impact toughness properties. The unnotched tensile, notched tensile and notched bar impact specimens were prepared by wire cut electrical discharge machining (EDM) method and necessary care was taken against any distortion and altering of the mechanical properties during cutting.
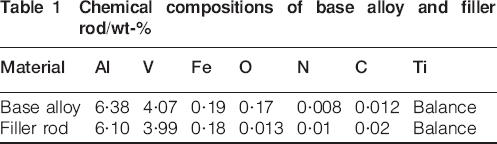
Chemical compositions of base alloy and filler rod/wt-%
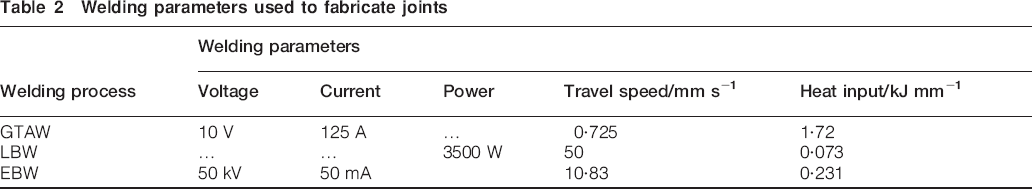
Welding parameters used to fabricate joints
Tensile testing was carried out using a 100 kN electromechanical controlled universal testing machine (model: UNITEK-94100; FIE-Bluestar, India). The 0·2% offset yield strength was derived from the load–displacement curve. The microstructure of the joint was analysed at various locations using an optical microscope (model: ML7100; Meiji, Japan) and a transmission electron microscope (TEM; model: CM20; Philips UK). The microstructure analysis of joints by the optical microscopy observation was done with the aid of Kroll's reagent. Hardness measurement was done across the weld centreline by a microhardness tester (model: HMV-2T; Shimadzu, Japan) with 500 g load and 15 s dwell time. The fractured surfaces of tensile smooth specimens were analysed through a scanning electron microscope (S400N; Hitachi). For revealing the detailed microstructural evolution in base alloy, GTAW, EBW and LBW of joint weld metal were also studied by a TEM. Thin foil disc specimens for TEM observation were cut parallel to the rolling direction of the sheet from the base alloy and perpendicular to the welding direction from the centre of the weld. The specimens were mechanically polished to a thickness of 0·1 mm, twin jet electropolished in a solution (6 vol.-%HClO4+34 vol.-%C4H9OH+60 vol.-%CH3OH) at −40°C and finally observed on the TEM operated at 120 kV. X-ray diffraction (XRD) was used for primary phase identification of the FZ and base alloy. Measurement parameters for XRD were as follows: Cu Kα radiation, accelerating voltage of 40 kV and tube current of 150 mA. Diffraction patterns were obtained in the step, 2θ mode in the range of 10–80° using an X-ray diffractometer (model: UltimaIII; Rigaku, Japan).
Results and discussion
Macrostructure
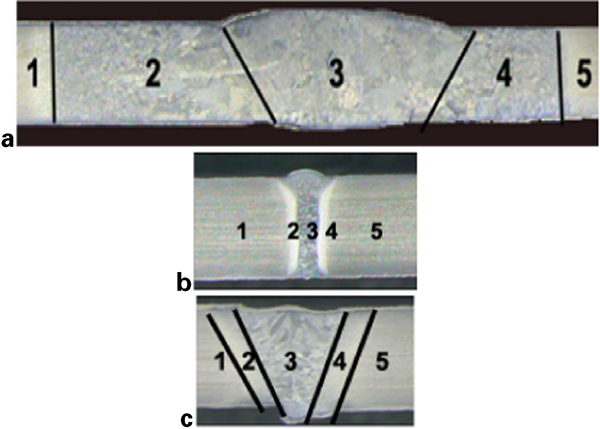
The macrographs shown in Fig. 1 clearly reveal the difference in weld bead geometry of the three different welding processes. Gas tungsten arc welded joint possesses wider weld FZ compared to the other two welding processes (Fig. 1a). Laser beam welded joint possesses narrow weld FZ and narrow heat affected zone (HAZ) compared to the other two welding processes (Fig. 1b).11 The reverse triangle shape and clear fusion line appeared in LBW joint. The sample welded using EBW process shows the weld FZ of intermediate width between GTAW and LBW processes (Fig. 1c). The small narrow undercuts at the toe ends of EBW seams were also observed, which are the characteristic nature of the process.1
Macrographs of welded joints
Microstructure
Optical and TEM images of base alloy and weld metal region of the joints are presented in Fig. 2. The microstructure of the base alloy shown in Fig. 2a consists of slightly elongated grains of α (light) and transformed β (dark) containing some acicular α.12 It is well known that deformed materials experience recovery and recrystallisation when annealed, and the TEM observation indicates that there exist a large amount of substructures in the base metal (BM), as shown in Fig. 2b. The optical micrograph of GTAW FZ shown in Fig. 2c contains the coarse serrate and acicular α structures of grain boundary α, massive α and Widmanstätten α+β structure.12 In GTAW TEM image (Fig. 2d), the Widmanstatten pattern ‘α’ is clearly evidenced and is characterised by dislocation free equiaxed primary α and transformed ‘β’ with lamellar α+β structure. The weld FZ in titanium alloys is characterised by coarse, columnar prior-β grains that originate during weld solidification. The size and morphology of these grains depend on the nature of the heat flow that occurs during weld solidification. The FZ β grain size depends primarily on the weld energy input, with a higher energy input promoting a larger grain size. The reason for the grain coarsening of the GTAW joint can be justified by the heat input involved in this process. The heat input supplied in GTAW process was 1·72 kJ mm−1 (Table 2) which is higher than those in the LBW and EBW processes. The higher heat input leads to longer cooling time, resulting in the grain growth and coarse grained structure of massive α and Widmanstätten α+β. Three-dimensional or mixed two-dimensional/three-dimensional heat flow conditions, such as those present in single pass and multipass GTAW weldments, promote the formation of more complex, multidirectional β grain morphologies. At lower cooling rates associated with GTAW (10–100°C s−1 or 18–180°F s−1), a coarser structure of Widmanstätten α plus retained β, or a mixture of this structure and α' 13 could be achieved. The optical micrograph of LBW FZ (Fig. 2e) shows the fine acicular α' (martensite) structure. In LBW TEM image (Fig. 2f), very fine α lamellae of acicular morphology is observed. The presence of primary α, β and α′-like (martensite) structure is also observed (Fig. 2f). The heat input associated with LBW process is 0·073 kJ mm−1 which is the lowest of the three processes considered. The lowest heat input leads to faster cooling rate (100–10 000°C s−1 or 180–18 000°F s−1) and finer grains of α lamellae.13 Figure 2g shows the optical micrograph of EBW FZ, revealing the serrate and regular plate shaped α structures. The equiaxed grains appear at the matrix. From the TEM image of EBW FZ (Fig. 2h), the degrees of fineness in α platelets are clearly visible. In addition to the finer microstructure, the acicular morphology is also observed in the same TEM image. The heat input of EBW process is (0·231 kJ mm−1) intermediate between GTAW and LBW processes. Relatively higher heat input compared to LBW process leads to slower cooling, which will be a little slower than that of LBW joint, resulting in ‘α’ platelets instead of lamellae because the lamellae are allowed to grow further.
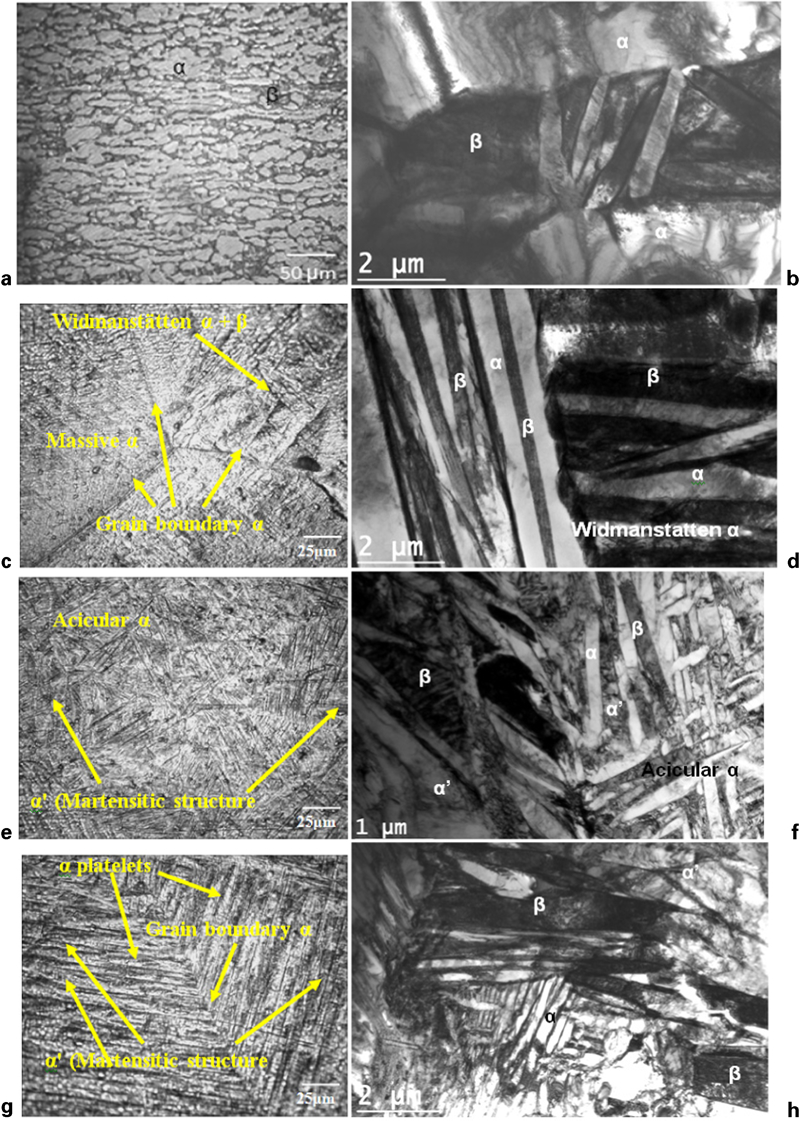
Optical micrograph (left) and TEM images (right) of base alloy and weld metal
The grain size of the weld metal region is influenced by the heat of the welding processes. Of the three welding processes used in this investigation to fabricate the joints, GTAW process has higher heat input compared to LBW and EBW processes (Table 3). Higher heat input will lead to slower cooling rate and slow cooling rate will result in coarser microstructure in this weld. In LBW joint, the presence of martensitic structure is also observed. The high self-quenched rate associated with LBW process certainly promotes the diffusion less transformation of the ‘β’ phase into martensitic microstructure.
Mechanical properties of base alloy and weld metal*
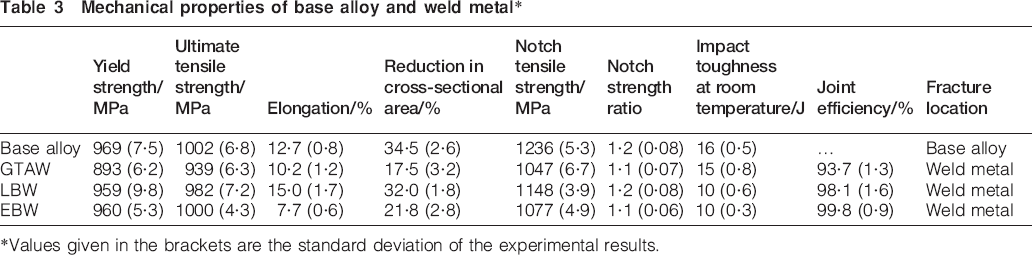
*Values given in the brackets are the standard deviation of the experimental results.
X-ray diffraction analysis
The XRD investigations were performed on each specimen in order to determine the phase composition. The diffraction patterns are presented in Fig. 3. The main peaks of the four specimens (Fig. 3a–d) reveal two phases, hexagonal (α) and cubic (β); in weld metal specimen, the presence of intermetallic phases like aluminium, titanium, titanium carbide (TiC) and vanadium carbide (VC) peaks is also observed. In contrast to other specimens, GTAW weld metal (Fig. 3b) has TiC peaks while the other two welded specimens do not reveal such peaks in their XRD patterns. The hexagonal phase is dominant in base alloy (Fig. 3a), LBW (Fig. 3c) and EBW (Fig. 3d) weld metals; whereas in GTAW weld metal, ‘β’ phase concentration is comparatively higher, which indicates that the amount of retained ‘β’ is more in this joint. Since α′ (martensite) peaks could be revealed at low intensity, in these four specimens, it is hard to identify martensite in any of the four specimens. The presence of higher concentration of cubic β phase in addition to intermetallic phases like aluminium, titanium, TiC and VC peaks could be the reason for lower mechanical properties of GTAW joint. The predominant hexagonal phase could be attributed to higher mechanical properties for base alloy, EBW and LBW joints compared to GTAW joint.
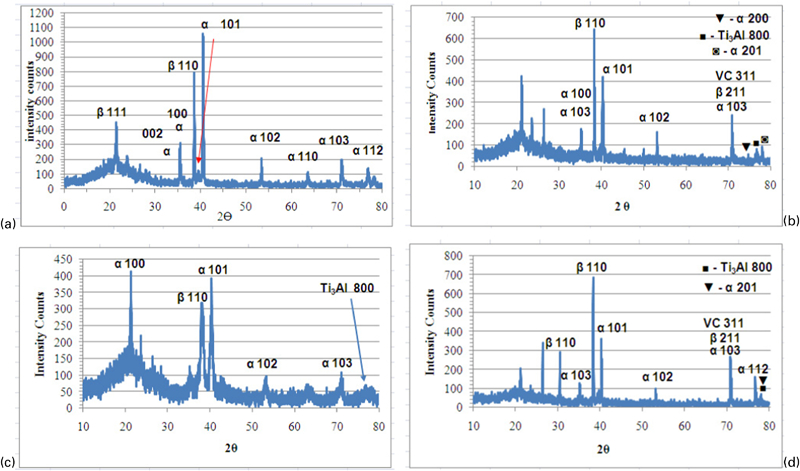
X-ray diffraction patterns for base alloy and weld metal
Tensile properties
Table 3 presents the transverse tensile properties of the base alloy and welded joints. In each condition, three tensile specimens were tested and the average of the results is presented in Table 3. The yield strength and tensile strength of unwelded parent metal are 969 and 1002 MPa respectively. But the yield strength and tensile strength of GTAW joints are 893 and 939 MPa respectively. This indicates that there is a reduction in strength values due to GTAW process. Similarly, the yield strength and tensile strength of LBW joints are 959 and 982 MPa respectively, which are lower than those of the parent metal. However, the yield strength and tensile strength of EBW joints are 960 and 1000 MPa respectively. Of the three welded joints, the joint fabricated by EBW process exhibited higher strength than GTAW and LBW joints. Elongation and reduction in cross-sectional area of unwelded parent metal are 12·7 and 34·55% respectively. But the elongation and reduction in cross-sectional area of GTAW joints are 10·2 and 17·5% respectively. This suggests that there is a reduction in ductility due to GTAW process. Similarly, the elongation and reduction in cross-sectional area of LBW joints are 15 and 32% respectively, which are higher than those of the parent metal. However, the elongation and reduction in cross-sectional area of EBW joints are 7·7 and 21·8% respectively. Of the three welded joints, the joints fabricated by LBW process exhibited higher ductility than GTAW and EBW joints. The joint efficiency of GTAW joints is ∼93·7% and the joint efficiency of LBW joints is 98·1%. Of the three welded joints, the joints fabricated by EBW process exhibited a relatively higher joint efficiency of 99·81%.
The transverse tensile properties of the welded joints presented in Table 3 indicate that the EBW joint exhibited superior tensile properties compared to GTAW and LBW joints. During tensile test, all three joints invariably failed at weld region. This indicates that the weld region is comparatively weaker than base alloy region and the joint properties are controlled by weld metal. The higher strength of the BM is mainly attributed to the presence of α and transformed β containing some amount of acicular α. The acicular morphology grain structure gives good combination of strength and toughness of this base alloy. In fusion welding, the dilution of base alloy in weld metal is a common phenomenon. The grain size of the weld metal also plays a major role in deciding the joint properties of titanium alloys. The amount, size, shape and morphology of α phase and density of α/β interfaces also dictate the joint properties.
Mechanical properties of composite weld structures in titanium alloys depend on structural characteristics of each weld region, which in turn depend on the specific thermal cycle(s) imposed during welding. In addition to prior-‘β’ grain size, weld zone mechanical properties in Ti–6Al–4V are significantly influenced by the manner in which the high temperature, body centred cubic ‘β’ phase transforms on cooling to the low temperature, hexagonal close packed phase. Characteristics of this ‘transformed ‘β’ microstructure depend principally on the cooling rate from above the β transus temperature, which is correspondingly influenced by the welding process, process parameters and other welding conditions (such as workpiece geometry and fixturing). The high cooling rates associated with low energy input welding processes such as LBW and EBW promote transformation of β to α′ martensite. This extremely fine, acicular transformation product exhibits high strength and hardness. At the lower cooling rates associated with GTAW, a coarser structure of Widmanstätten ‘α’ plus retained ‘β’, or a mixture of this structure and α′, is produced, which exhibits yield and tensile strengths inferior to those of base alloy and ductility and toughness greater than those of an entirely martensitic microstructure (LBW and EBW joints).13 The lowest strength of GTAW joint is mainly attributed to the presence of coarse serrate structures of grain boundary α, massive α and Widmanstätten α+β. The highest strength of EBW joint could be contributed by the weld metal microstructure containing fine serrate and regular plate shaped α microstructures. Intermediate strength achieved by the LBW joint might be attributed to the acicular morphology of the joint and coarse grained HAZ microstructure.
Impact toughness and hardness properties
Three Charpy impact toughness test results are averaged and presented in Table 3. The impact properties of BM is 16 J at room temperature, when it was welded by GTAW process, the weld metal exhibited 15 J which is lower than that of the BM and is the highest impact strength achieved by welding compared to the other two welding processes. The impact toughness of LBW and EBW joints is 10 J each. The equal value of impact toughness might be contributed by the inherent nature of high energy density welding processes.
Figure 4 shows the hardness variations across the weld centreline of the joints. The hardness of base alloy is 340 HV, while the weld metal hardness of GTAW, LBW and EBW joints are 385, 436 and 417 HV respectively. The LBW joint shows the highest hardness level which is greater than those of GTAW joint, EBW joint and base alloy. The GTAW joint shows the lowest hardness level among the joints. In HAZ locations of the GTAW, LBW and EBW joints, the hardness values are around 360, 400 and 393 HV respectively.
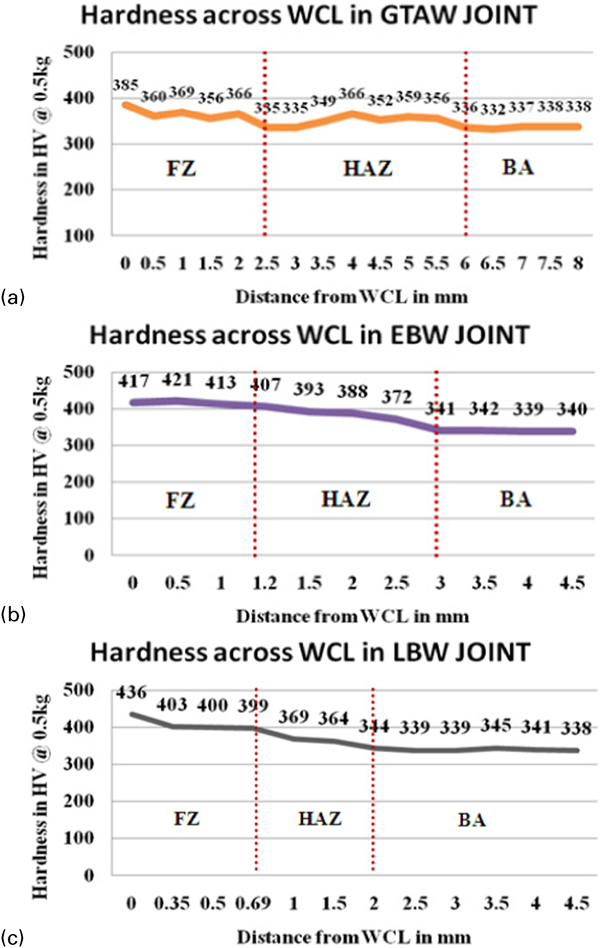
Microhardness survey across weld centreline
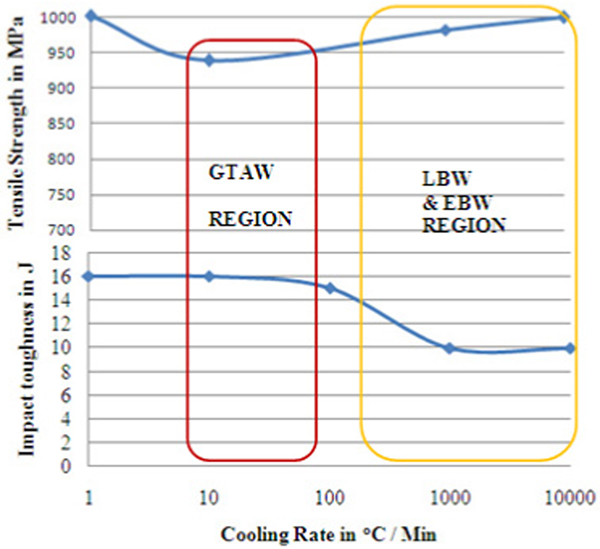
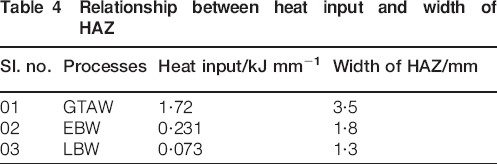
The reasons for why the microhardness evaluation in weld metal by EBW process is smaller than that by LBW process is that the harmful gas by EBW is the least compared to others and the joint would not be contaminated. The microhardness values are slightly significant in affecting the mechanical properties because the inherent nature of the process selected has more influencing factors over. The width of the FZ was observed to be 2·5–5·0, 0·7–1·5 and 1·5–3·0 mm for GTAW, LBW and EBW process weldments. The relationship between the heat input and width of the HAZ was evaluated and is presented in Table 4. From Table 4, the widths of the HAZ were observed to be 3·5, 1·3 and 1·8 mm for GTAW, LBW and EBW process weldments respectively. In addition, the relationships between the heat input of the welding process, the microstructural evaluation with respect to base alloy microstructure and the resultant tensile and impact properties were developed and are presented in Table 5. From Table 5, one can easily understand the significant effect of heat input level, cooling rate and microstructural, tensile and impact toughness properties. The relationships between cooling rate and tensile strength and impact toughness values are plotted in Fig. 5. From Fig. 5, it is clear that the faster cooling rate yields good strength properties with little compromise with impact toughness energy absorption.
Relationship between heat input and tensile and impact toughness properties
Relationship between heat input and width of HAZ
Relationship between cooling rate, microstructural evaluation and its resultant tensile and impact toughness properties*
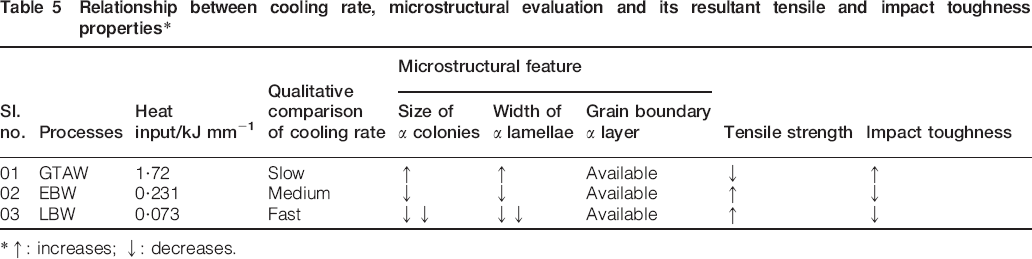
*↑: increases; ↓: decreases.
Fracture surface
The fractographs of tensile test specimen are displayed in Fig. 6. The modes of failure for the tensile test BM and the welded joints are ductile with microvoid coalescence in all cases (Fig. 6a–d). Figure 6a shows the fractographs of base alloy and it contains finer equiaxed dimples. There is appreciable size variation in the dimples observed in GTAW joint (Fig. 6b). The parallelly aligned finer dimples with grain boundary α are observed in LBW joint (Fig. 6c). This could be the reason for the highest ductility with intermediate tensile strength for this LBW joint. The fractograph of the EBW joint (Fig. 6d) reveals the finer dimples, but at the same time, the presence of numerous secondary cracks can also be observable.14 The preferred nucleation site may be the presence of micropores in this joint. The size variation in the dimple is also observed. The dimple size exhibits a directly proportional relationship with the strength and ductility, i.e. if the dimple size is finer, then the strength and ductility of the respective joint are higher and vice versa.15
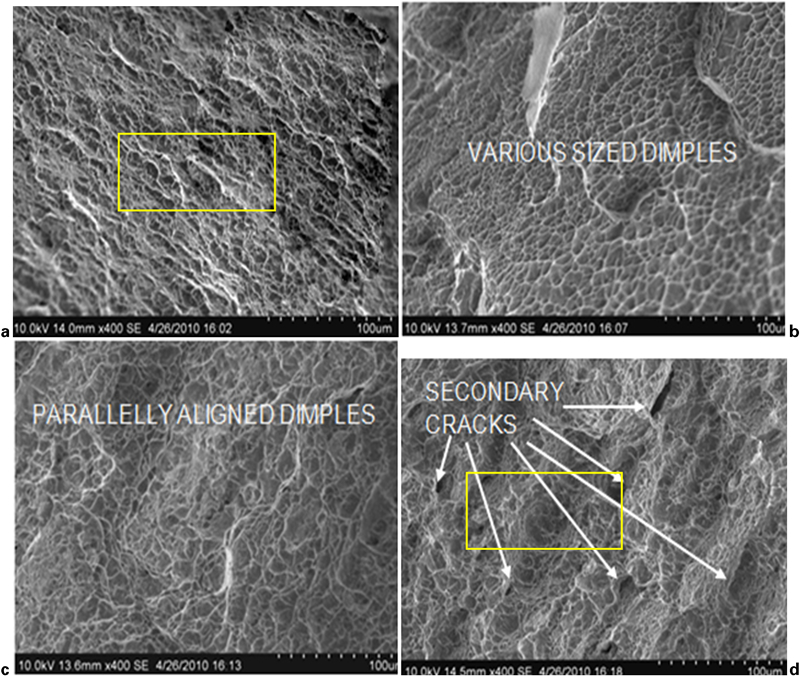
Fractographs of tensile test specimens
Conclusions
The tensile and impact properties of GTAW, LBW and EBW joints of Ti–6Al–4V alloy were evaluated and correlated with respective microstructural features. From this investigation, the following important conclusions are derived.
Of the three welded joints, the joint fabricated by EBW process exhibited higher strength and the enhancement in strength is ∼6% compared to GTAW joint, and 2% compared to LBW joint. The presence of fine serrate and regular plate shaped ‘α’ microstructures in weld metal is responsible for the enhancement in tensile strength of EBW joint.
Of the three joints fabricated, joint fabricated using GTAW process exhibited 35% higher impact toughness compared to the joint fabricated by LBW and EBW processes due to the presence of coarse serrate and acicular α structure of grain boundary α, massive α and Widmanstätten α+β in weld metal region.
Hardness is higher in weld metal region compared to HAZ and base alloy regions irrespective of welding technique. Lower hardness is recorded in the GTAW joint (385 HV) and the higher hardness is recorded in the LBW joint (436 HV).
Footnotes
Acknowledgements
The authors wish to record their sincere thanks to the Combat Vehicle Research and Development Establishment (CVRDE), Avadi, Chennai, Government of India for providing financial support to carry out this investigation through a Contract Acquisition for Research Services project (No. CVRDE/MMG/09-10/0043/CARS).