
Abstract
Extruded and T6 tempered plates of 7042, an Sc modified Al–Zn–Mg–Cu alloy, were joined by friction stir welding (FSW) at a constant weld velocity and various pin rotation speeds (PRSs). At a low PRS, hardness decreased from each edge of the weld to a local minimum at the weld centre, but at a high PRS, the hardness initially decreased from each edge of the weld, but then rose towards the weld centre. The transition in the hardness profile was related to different heating and cooling conditions during FSW. Differential scanning calorimetry of baseline and welded samples revealed that the volume fraction of strengthening particles within the weld regions strongly depended on the weld conditions. For FSW heating rates, secondary phase dissolution/precipitation temperatures are in proximity to the welding temperatures. The maximum welding temperature during FSW increased from ∼250 to 450°C as the PRS increased from 175 to 400 rev min−1.
Introduction
As the aerospace industry produces new and more efficient airframes, the need to provide high strength, lightweight alloys that meet the aggressive design objectives for mechanical performance, manufacturability and service life arises. Conventional Al–Zn–Mg–Cu 7000 series alloys are widely used in aerospace applications due to their favourable mechanical properties. However, these properties will degrade above 150°C due to the coarsening and/or dissolution of the strengthening phases within the microstructure. Additions of Sc and Zr to 7000 series alloys can stabilise the microstructure at these elevated temperatures and can augment the mechanical performance through the formation of fine, secondary strengthening phases such as Al3(Sc,Zr). 1 1,2 Because the nanometre sized Al3(Sc,Zr) particles also stabilise the microstructure formed during hot working operations and inhibit recrystallisation during heat treatment, the potential for enhanced residual properties following joining operations, such as friction stir welding (FSW), arises.3
Friction stir welded joints display excellent mechanical properties when compared to conventional fusion welds, and as such, the aerospace industry is embracing FSW technology and implementing new welding capabilities into their manufacturing sectors.4– 6 Over the last 15 years, numerous investigations have sought to characterise the principles of FSW and to model the microstructural evolution. The current status of FSW research has been well summarised by several notable researchers.7– 10 The following research programme examines the microstructural characteristics of Sc modified Al–Zn–Mg–Cu extrusions (7042-T6) joined by FSW and correlates the observed trends in hardness to the volume fraction of the main strengthening particles [Guinier–Preston (GP) zones, η′] and the equilibrium phases [η (MgZn2) and/or T (Al2Mg3Zn3)] within the weld zone.11 It has been assumed that FSW does not change the size and volume fraction of the Al3(Sc,Zr) precipitates due to their high thermal stability.12
Differential scanning calorimetry (DSC) has proved to be a powerful technique in investigating precipitation processes in Al alloys. 13 13,14 By detecting the heat variations due to the phase transformations, the technique is able to identify the temperature ranges in which they occur. Combined with hardness measurements, the DSC enables the correlation of microstructural changes to the mechanical properties. For example, Dixit et al. utilised DSC to study the nucleation of precipitates within the nugget of friction stir welded aluminium 2024 and to correlate the weld microstructure to mechanical properties. 15 15,16 The aim of this paper is to show how the DSC analysis may be implemented to the investigation of FSW welds in other advanced Al alloys.
Experimental
Alloy chemistry and heat treatment
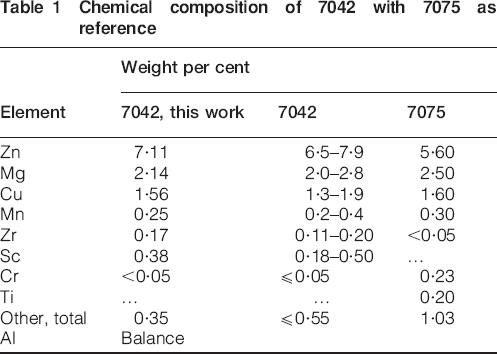
The chemical composition of 7042 used in this work is summarised in Table 1 along with that of commercial aluminium 7075 for reference and comparison.1 The 7042 Al alloy developed by UES, Inc. has recently been registered by the International Aluminum Association and its nominal composition is also given in Table 1. Whereas 7075 primarily utilises chromium to control grain growth and recrystallisation, 7042 utilises the synergistic combination of scandium and zirconium to stabilise the microstructure. In addition, the 7042 chemistry has a higher level of zinc than 7075. The zinc level of 7042 is more akin to that of the 7050 or 7136 alloys.
Chemical composition of 7042 with 7075 as reference
For this investigation, 76 mm diameter 7042 billets were produced by direct chill casting and then hot extruded into 50·4×6·35 mm bars, providing the extrusion ratio of 14∶1. Following extrusion, the bars were heat treated to a T6 temper through the following schedule:
solution heat treatment at 460°C for 1 h followed by an additional hour at 480°C
rapid quench in water to room temperature
age at 120°C for 19 h.
Friction stir welding and post-weld investigation
After heat treatment, the bars were cut into twelve 305 mm long pieces and sent to the Edison Welding Institute (Columbus, OH, USA) to produce six longitudinal friction stir welds. The diameter of the FSW tool shoulder was 17·8 mm, the pin diameter tapered linearly from 10·3 mm at the tool shoulder to 7·7 mm at the tip, and the pin depth was 6·1 mm. With a constant weld velocity of 2·1 mm s−1 and a constant applied force of 22 kN, unique welds were produced at the following pin rotation speeds (PRSs): 175, 225, 250, 300, 350 and 400 rev min−1. Subsequent to joining, the welded panels were stored at room temperature and allowed to naturally age for at least 30 days before testing and investigation. For each weld condition, Vickers hardness measurements were performed on the entire section perpendicular to the weld direction at an indentation load of 9·81 N. The distance between sampling points was 1 mm. Small samples (approximately 20–50 mg) were extracted from the heat treated baseline material and from the weld centre of each welded sample for thermal analysis. The samples were sealed in Al pans and analysed in a Perkin Elmer Jade differential scanning calorimeter using an argon atmosphere. Depending on the data desired, samples were heated from room temperature to 400°C at a constant heating rate that ranged from 10 to 100°C min−1.
Results and discussion
Effect of heating rate on phase transformations during DSC and FSW experiments
Figure 1 displays the DSC trace for the T6 tempered baseline extrusions obtained at a heating rate of 10°C min−1. Two primary peaks are revealed in the figure: an endothermic peak occurring at 165°C and an exothermic peak occurring at 216°C. The endothermic peak likely corresponds to the dissolution of the non-equilibrium η′ phase, the main strengthening phase in 7000 series alloys formed during aging at 120°C, and the exothermic peak likely corresponds to the subsequent formation of the equilibrium η and/or T phases.8– 11 There is another endothermic peak above 400°C, not shown in Fig. 1, which is caused by dissolution of the η and/or T phases.11 Although the heating rate used to obtain this data is typical for DSC analysis, heating rates during the FSW process will certainly exceed this value. In addition, since the dissolution and formation of secondary phases are thermally activated processes, the positions of the endothermic and exothermic peaks will shift to higher temperatures with an increase in the heating rate. If the heating rate is sufficiently high, as in FSW, it is possible that the phase reactions will occur at temperatures in the proximity of the welding temperatures. As such, the microstructure and properties of friction stir welded Sc modified aluminium extrusions will strongly depend on the heating rate and temperature associated with the FSW process.
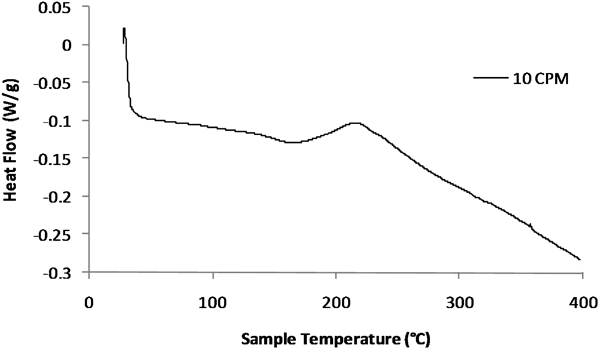
Differential scanning calorimetry trace for baseline material using heating rate of 10°C min−1
DSC traces of the baseline material were also obtained using heating rates
of 50, 75 and 100°C min−1 (the fastest heating rate permitted
by the equipment). Figure 2
demonstrates the shift in the peak positions with increasing heating rate.
The endothermic peak shifts from 165°C at 10°C min−1
to 205°C at 75°C min−1 (the endothermic peak obtained
at 100°C min−1, however, is not evident in the DSC trace
as it is shielded by a simultaneous exothermic reaction), and the exothermic
peak shifts from 216°C at 10°C min−1 to 262°C
at 100°C min−1. The relationship between the peak position Tp
and the heating rate ν can be expressed in the following
linear relationship
17
17,18
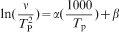

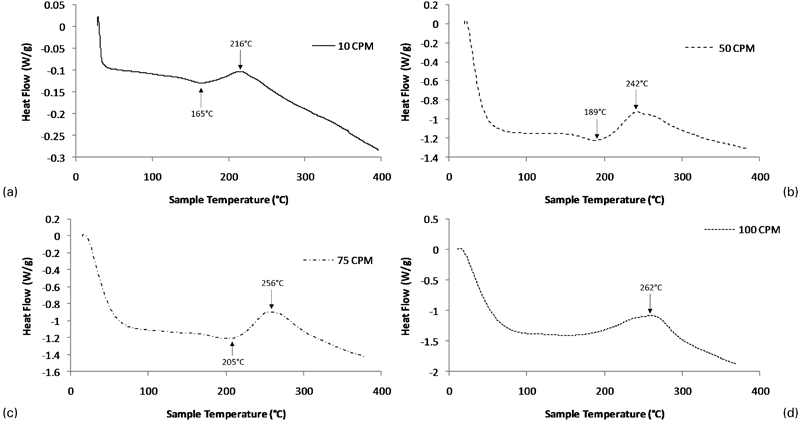
Differential scanning calorimetry traces of baseline material at different heating rates
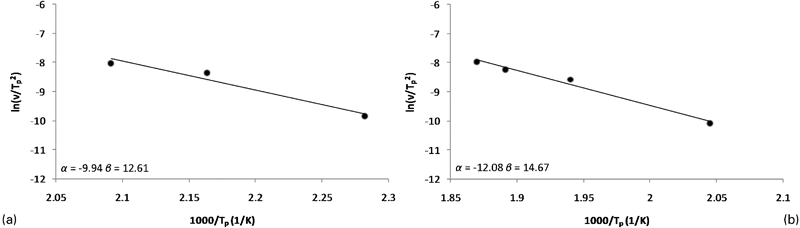
Linear regression and constant values for a endothermic and b exothermic peaks
A thermal model was developed using NX numerical modelling software that can predict the welding temperatures and heating rates in various locations of the welded extrusions. Details of the model, including calibration, boundary conditions and tool/workpiece slip behaviour, are fully discussed elsewhere. 23 23,24 The model simulates 1 min of FSW and, therefore, provides the temperature distribution for a 126 mm weld (the weld speed is 2·1 mm s−1). Two nodes from the model were selected to represent the weld centre and the weld edge, i.e. the interface between the weld and the heat affected zone within the base material. Each node was located 63 mm from the starting position of the tool, i.e. halfway through the length of the final weld length. With each node initially located ahead of the advancing tool, the nodes experience an increase in temperature as the tool approaches and a decrease after the tool passes, as representatively shown in Fig. 4 for a PRS of 250 rev min−1. The temperature transients for these nodes, therefore, can estimate the maximum heating rates experienced during welding at the weld centre and weld edge for each of the weld conditions under investigation (note that the model does not distinguish between the advancing and retreating sides of the weld). Based upon these heating rates and equation (1), the expected temperatures corresponding to the positions of the endothermic and exothermic peaks were determined and compared to the welding temperatures.
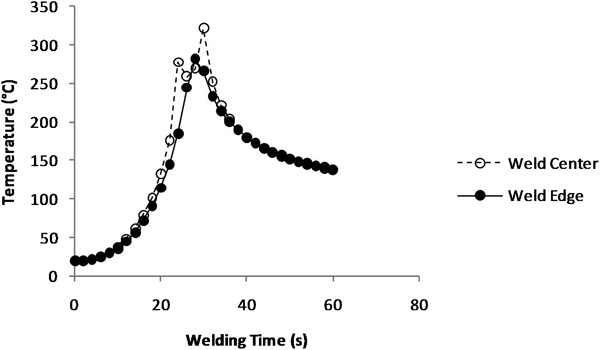
Representative transient temperature profiles from 250 rev min−1 condition for weld centre and weld edge nodes located halfway along weld length
Table 2 presents the anticipated peak positions for the maximum heating rates for each weld condition according to the node location along the width of the weld. In addition, presented in the table are the maximum predicted welding temperatures for each node under the various weld conditions. When comparing the weld temperature to the peak positions for the endothermic and exothermic reactions occurring during DSC heating, it is somewhat instructive to define ΔTendo and ΔTexo as the difference between the weld temperature and the endothermic and exothermic peak positions respectively. Thus, a negative value for the temperature difference indicates that the weld temperature is below the reference temperature, and a positive value indicates that the weld temperature is above the reference temperature.
Endothermic and exothermic peak positions and welding temperatures for each weld condition according to weld edge and weld centre
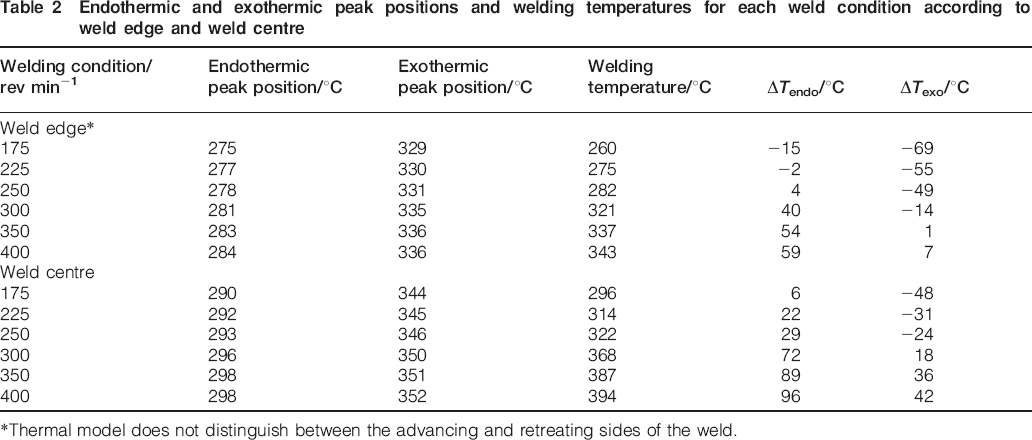
*Thermal model does not distinguish between the advancing and retreating sides of the weld.
Figure 5 presents the hardness profile measured across the friction stir weld for the 250 and 300 rev min−1 weld conditions. The shape of the hardness profile of the 250 rev min−1 condition is representative of the 175 and 225 rev min−1 weld conditions, just as the shape of the 300 rev min−1 hardness profile is representative of the 350 and 400 rev min−1 conditions. The figure clearly reveals a transition in the hardness behaviour between the lower weld energies and the higher weld energies. At 250 rev min−1, the hardness decreases from each edge of the weld to a local minimum at the weld centre (a V shape). In contrast, at 300 rev min−1, the hardness initially decreases from each edge of the weld, but then rises towards the weld centre (a W shape). As suggested by the DSC analysis and by examination of the weld temperatures in relation to the endothermic and exothermic peak positions, the temperature of the weld edge always trails the temperature of the weld centre. As such, at lower weld energies, i.e. weld speeds of 175–250 rev min−1, the temperature of the weld centre is beyond the endothermic peak position of the η′ dissolution, while the temperature of the weld edge is slightly below or at this position (Table 2). This indicates that at the low weld speeds, most of the η′ particles already transform to coarser η particles in the weld centre resulting in overaging. After cooling, this weld centre region contains equilibrium phases and low hardness. At the same time, at the weld edge, most of the η′ particles dissolve but have yet to reprecipitate into the equilibrium η phase at these welding conditions. Upon cooling to and holding at room temperature, decomposition of the supersaturated solid solution occurs with a formation of GP zones, which partially restore the hardness of the weld edge regions. This latter situation is somewhat similar to the heat treatment known as retrogression and reaging,8 when an aged alloy is heated and held for a short time at a temperature in the range 200–280°C, to dissolve almost all η′ particles but avoid precipitation of equilibrium η particles, quickly quenched and reaged. The retrogression and reaging process has been found to be beneficial for 7000 series alloys as it considerably reduces susceptibility to stress corrosion cracking.8
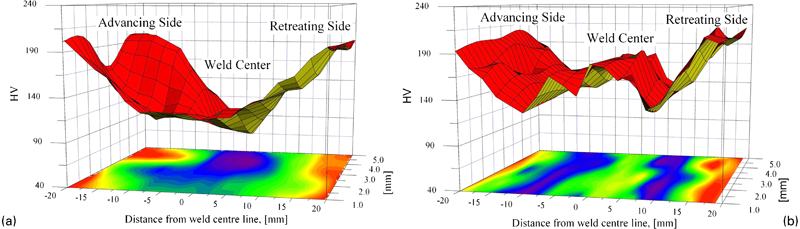
Hardness profile across Al–Sc friction stir welds
As the weld energy increases, i.e. the weld speed increases >300 rev min−1, the temperature of the weld centre moves beyond the exothermic peak position of the η and/or T precipitation, indicating that these precipitates start to dissolve in the Al matrix. At the same time, the edge temperature reaches the exothermic peak position, corresponding to the largest volume fraction of equilibrium η and/or T phases. This gives rise to the transition in the hardness profile between the 250 and 300 rev min−1 conditions observed in Fig. 5. Being softer than weld edges just after welding, the weld centre now has the ability to increase in hardness with holding time (natural aging) due to precipitation of GP zones from the supersaturated solid solution. At the same time, the weld edges, which now contain equilibrium phases, do not have this ability for natural aging. As a result, after holding at room temperature for a certain time, the weld centre becomes harder than the weld edge.
In all these cases, the observed hardness peak in welded regions is, therefore, due to particle dissolution during welding, formation of supersaturated solid solution upon cooling to room temperature and reprecipitation of GP zones during holding at room temperature after welding. At low PRS, the supersaturation is produced by dissolution of metastable η′ particles, while at high PRS, by dissolution of equilibrium η and/or T particles. To prove this suggestion, DSC samples were excised from the weld centre, advancing side and retreating side of the weld for the 400 rev min−1 condition. Figure 6 presents these DSC traces obtained at a standard heating rate of 10°C min−1. For the weld centre, a strong endothermic peak corresponding to GP zone dissolution occurs at 132°C, and for the advancing side, a weaker endothermic response occurs at 134°C. The weaker response of the advancing side demonstrates that the concentration of GP zones after welding and cooling in the 400 rev min−1 condition is greater at the weld centre than at the weld edge. Interestingly, the DSC trace of the retreating side shows almost no endothermic response, suggesting a minimal concentration of GP zones on this side of the weld after processing.
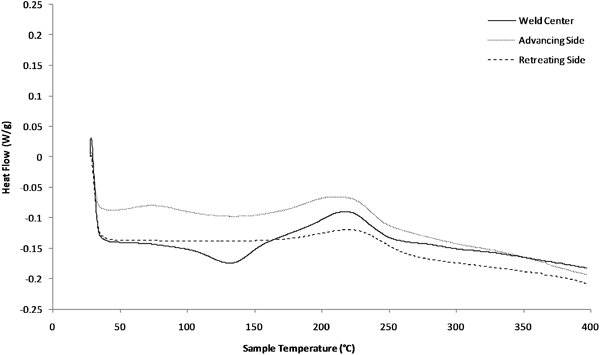
Differential scanning calorimetry traces of weld centre, advancing side and retreating side at 400 rev min−1 (heating rate: 10°C min−1)
Location of weld fracture
Examination of the endothermic and exothermic peak positions may also give insight into the fracture location of the tensile specimens. In this study, fracture occurred at the weld centre or towards the advancing side of the weld, as representatively shown in Fig. 7 for each weld condition. The figure reveals that at 175 rev min−1, the tensile specimen fractured at the weld centre, but as the weld energy, i.e. the PRS increased, the fracture location moved towards the advancing side. At 300 rev min−1, the tensile specimen clearly fractured on the advancing side of the weld, but beyond this weld energy, the fracture location returned to the weld centre. At lower PRSs, when the weld centre is softer than the weld edge, fracture of the tensile specimens will occur at the weld centre. As the weld energy increases, the weld centre will gradually become harder than the weld edge, and the fracture location of the tensile specimens, therefore, will move away from the centre. Beyond 300 rev min−1, all weld temperatures have surpassed the exothermic peak location, and fracture of the tensile specimens returns to the weld centre. Reprecipitation upon cooling and natural aging after welding will also impact the fracture behaviour of the weld.
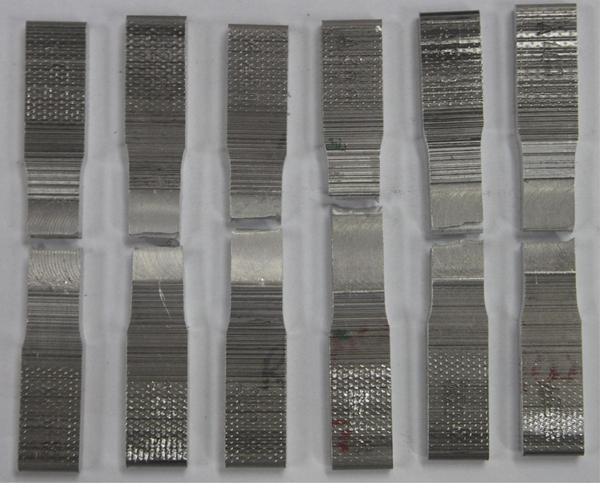
Tensile specimens and fracture locations; from left to right: 175, 225, 250, 300, 350 and 400 rev min−1 (advancing side towards top of photograph)
The shift in fracture location from the weld centre towards the advancing side, rather than the retreating side, suggests that the advancing side is softer. Viewed in the context of weld temperatures in relation to the endothermic and exothermic peak positions, the data, therefore, suggest that the retreating side temperature lags behind the advancing side. As the weld energy increases from the lower PRS to the higher PRS, the advancing side temperature will reach the endothermic peak position ahead of the retreating side and will become depleted in strengthening precipitates (η′). The retreating side, whose temperature has yet to reach the endothermic peak position, will retain a greater concentration of secondary phases than the advancing side, and the weld centre, whose temperature is approaching the exothermic peak position, will enrich itself in the more equilibrium phases (η and/or T). As such, the advancing side will be the softest location of the weld, and the fracture location will shift from the weld centre to this area. The secondary phase characteristics of the advancing side, therefore, are a blend of that observed for the retreating side and weld centre. Recall the post-weld DSC traces for the 400 rev min−1 condition, where the weld centre showed a strong endothermic response at 132°C (GP zone), the retreating side effectively showed no endothermic response in this temperature range, and the advancing side showed a weak endothermic response at 134°C.
Post-weld microstructure
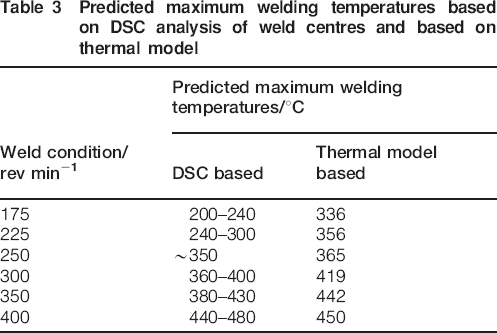
Samples were excised from representative weld centres for all weld conditions, and DSC traces were obtained for each sample utilising a standard heating rate of 10°C min−1. Figure 8 displays these traces, which were then used to ascertain the microstructural characteristics after welding and to predict the maximum welding temperature experienced for the various process parameters. Table 3 summarises the predicted temperatures based on the DSC data and those based on the thermal model (the maximum temperatures predicted by the thermal model did not necessarily coincide with the nodes selected for the previous analysis). The information in the table demonstrates that there is very good agreement between the predicted temperatures for all weld conditions, except 175 and 225 rev min−1. For these process parameters, the thermal model predicts a higher maximum temperature than is indicated by the DSC traces. A discussion of the DSC data follows.
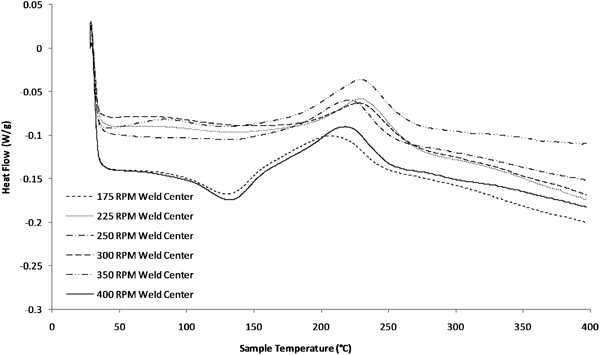
Differential scanning calorimetry traces from weld centre for each weld condition (heating rate: 10°C min−1)
Predicted maximum welding temperatures based on DSC analysis of weld centres and based on thermal model
At 175 rev min−1, the weld centre reached 200–240°C for a short time and rapidly cooled. The η′ particles, which were present before FSW, dissolved in this temperature range, producing a supersaturated solid solution. However, η and/or T particles did not nucleate due to restricted kinetics. After welding and holding at room temperature, natural reaging occurred with the formation of GP zones, resulting in the endothermic reaction at 132°C during DSC heating when these GP zones dissolved.
The traces from the 225 and 300 rev min−1 samples show almost similar intensity in the endothermic reaction upon heating in the DSC, indicating that they were equally supersaturated with solute elements (Mg, Zn and Cu) during FSW. For the 225 rev min−1 sample, complete overaging did not occur and the matrix was slightly supersaturated with the alloying elements; while for the 300 rev min−1 sample, the FSW temperature was somewhat higher and some equilibrium η and/or T particles started to dissolve, resulting in slight supersaturation of the matrix. Therefore, the maximum temperature for 225 rev min−1 is anticipated to be 240–300°C, and that for 300 rev min−1 is predicted to be 360–400°C. At 250 rev min−1, the weld was overaged during FSW and only a very small amount of GP zones formed during holding at room temperature after welding. The predicted maximum temperature, therefore, is ∼350°C.
For 350 rev min−1, a greater amount of the η and/or T phase was dissolved and more supersaturation occurred and resulted in more pronounced natural aging and endothermic reaction during DSC heating. The temperature of the weld centre is expected to be 380–430°C. Finally, at 400 rev min−1, the majority of η and/or T phases dissolved, and supersaturation similar to that observed in the 175 rev min−1 sample was formed. Upon cooling to room temperature, natural aging occurred and dissolution of the GP zones during DSC heating led to a pronounced endothermic reaction at 132°C. The weld centre temperature is predicted to be 440–480°C.
Conclusions
Scandium modified Al–Zn–Mg–Cu alloy extrusions, heat treated to the T6 temper, were friction stir welded at five, unique PRSs: 175, 225, 250, 350 and 400 rev min−1. For welds obtained at PRS up to 250 rev min−1, the hardness across the weld decreased from each edge to a local minimum at the weld centre (V shaped). However, for welds obtained at PRS >300 rev min−1, the hardness initially decreased from the weld edges, and then rose at the weld centre (W shaped). DSC analysis of the welds revealed that the hardness profile correlates to the process temperature relative to the dissolution temperature of the non-equilibrium η′ phase (endothermic peak) and the formation temperature of the equilibrium η (MgZn2) and/or T (Al2Mg3Zn3) (exothermic peak). During FSW, these peak positions depend on the process heating rate. Therefore, for PRS <250 rev min−1, the weld centre temperature is beyond the endothermic peak position of the η′ dissolution, while the temperature of the weld edge is just below or at this peak position. This results in almost complete dissolution of the phase in both regions but in higher volume fraction of the equilibrium η and/or T phases in the weld centre. As a result, higher supersaturation of the aluminium matrix with alloying elements will occur at the weld edges upon cooling after welding. For PRS >300 rev min−1, the weld centre temperature moves above the exothermic peak position of η and/or T precipitation, while the edge temperature moves above the endothermic peak position and close to the exothermic peak position. This results in higher supersaturation at the weld centre upon cooling after welding due to dissolution of equilibrium η and/or T phases. During holding at room temperature after welding, reprecipitation of GP zones and an increase in hardness occur in the supersaturated regions. The hardness profile, therefore, transitions to a W shape where the weld centre becomes harder than the surrounding material. The maximum weld temperatures suggested by DSC analysis of the microstructure and those predicted by the computational thermal model show good agreement for PRS >225 rev min−1.
Footnotes
Acknowledgements
The authors would like to acknowledge the Polish Ministry of Science and Higher Education (grant no. N507 446337) and UES, Inc. for their support of this work. O. Senkov acknowledges financial support through the US Air Force Research Laboratory Contract no. FA8650-10-D-52226.