
Abstract
The feasibility of measuring residual stresses in self-pierce riveted (SPR) joints by neutron diffraction technique was investigated. The main challenge involved dealing with the very small dimensions of SPR joints. Two different joints were examined: aluminium–steel and steel–steel. Even though small dimensions were involved, meaningful results were obtained. In the rivet head, tensile stress was observed for the steel–steel sample, whereas only compressive stress was observed for the aluminium–steel. The residual stress in the rivet head was higher at the centre and lower at the edge for both joints. Stresses in the sheet material beside the rivet wall and at a distance of three times the rivet radius from the rivet axis were not significant. For the SPR joints examined, the maximum value of residual stress was compressive and occurred in the rivet leg. The results are discussed according to the physical events involved during the process.
Introduction
The joining of sheet metal is a very important part of the manufacturing process of many industries, especially automotive, due to the very high volumes and production rates involved. Joining technologies for sheet metal include resistance spot welding, arc welding, friction stir welding, laser welding, adhesive bonding, mechanical fastening using nuts, bolts and screws, conventional riveting, clinching and newly developed self-pierce riveting (SPR). Resistance spot welding is widely used in the automobile industries as it is a well known and proven technology, and the industries are comfortable with this technique, having considerable experience. To meet the increasing demand for energy efficient vehicles, the automotive industry is using more and more lightweight, high strength materials, such as galvanised steel, aluminium and magnesium, 1 1,2 but direct welding of these dissimilar metals is difficult or impossible as they undergo some fusion process, which may lead to the production of a different and unwanted phase. High thermal conductivity and a surface oxide layer are also crucial for welding, particularly for aluminium alloy. Hence, mechanical fastening techniques (clinching, nuts and bolts and riveting) are increasingly being considered by designers.3– 5 Nuts and bolts and conventional riveting require predrilled holes, which make the process slower, and clinching generally produces joints with lower strength than SPR.6– 9
Self-pierce riveting is a cold forming process used to fasten two or more sheets of material (Fig. 1). Several events occur in this process: a tubular rivet is driven through the top sheet, piercing but not perforating the bottom sheet, accompanied by flaring of the legs in the bottom sheet under the guidance of a suitable die.10 As the lower sheet is not pierced, the resulting joint is resistant to gas and liquid penetration and therefore resistant to corrosion.11 Self-pierce riveting is increasingly used in materials and dissimilar combinations that are difficult or even impossible to join by spot welding. For this reason, SPR has drawn increasing interest and applications in recent years. The advantages of SPR include simple process with no predrilled holes required, fast cycle time and easy automation; no waste material is produced so it is good for the environment, high strength and better fatigue properties are achieved; low energy requirement so there is relatively low cost; very little or no damage to precoated material; and ‘water tight’ joint is formed.12– 19 Rivet as well as sheet materials should have sufficient ductility to deform without cracking. As ply materials increase in hardness, strength or thickness, the ability of a rivet to pierce and deform in a ductile manner becomes more limited, narrowing the operating window in terms of joint quality and performance. Forces for setting the rivet are high, typically 30–50 kN. Previous studies show that a joint may look good, but microcomputed tomography shows some cracking in the same joint. 20 20,21 To fully understand the behaviour of SPR joints, it is important to understand how the residual stress distribution arises from the riveting process. Residual stresses as high as 1075 MPa have been predicted by other researchers but not validated. 22 22,23
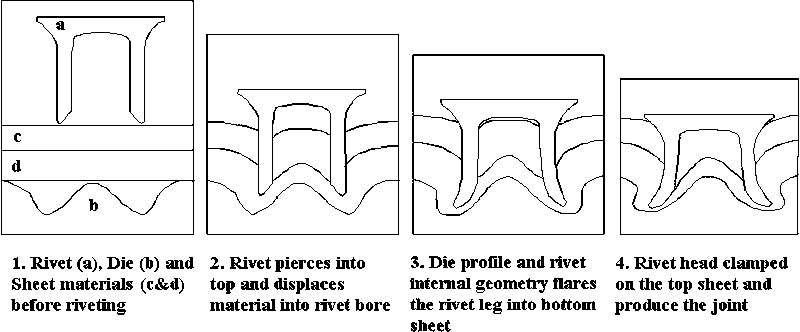
Schematic illustration of SPR process
Residual stresses are defined as self-equilibrating stresses within a stationary solid body when no external forces are applied.24 These stresses may arise from misfits in the natural shape between different regions, different parts or different phases.25 Residual stress cannot be measured directly in practice but can be obtained from a measure of the elastic strain, displacement or secondary quantity, which can be related to stress, such as the speed of sound or magnetic signature.25– 27 Measurement techniques for residual stress can be divided into destructive and non-destructive methods. Some well known destructive tests are layer removal, hole drilling, block sectioning, contour method and deep hole drilling. Block sectioning provides a single stress measurement, hole drilling provides depth profiles and the contour method provides area maps of residual stress. 28 28,29 The advantage of the hole drilling method is that it is not limited to crystalline material, and this technique can be applied to plastics, composites and coated materials.30 On the other hand, non-destructive techniques usually measure some parameters that are related to stress. Some non-destructive tests are X-ray, magnetic and eddy current, ultrasonic, neutron diffraction and synchrotron diffraction techniques. 26 26,27 X-ray is limited to a depth of 5 μm, whereas neutron diffraction can measure the strain up to 50 mm deep in steel. 24 24,25 However, X-ray diffraction has a high spatial resolution and faster acquisition time due to a low diffraction angle compared with neutron diffraction. Synchrotron diffraction is more suitable for strain mapping experiments for finite element model validation, while neutron diffraction is more suited for deep line stress profiling experiments. 25 25,31 For SPR joints made of high strength steel materials, neutron diffraction is the most appropriate technique among non-destructive methods. The purpose of the present study is to evaluate the feasibility of measuring residual stress in different SPR joints using neutron diffraction.
Experimental
Self-pierce riveted joints were produced using hydraulic rivet setter, die and rivets provided by Henrob (UK) Pty Ltd and sheet coupons 150 mm long and 50 mm wide. Five joints were made at 25 mm spacing using rivets and die selected according to the total ply thickness and sheet materials, as shown in Figure 2 Figs. 2a and 3a.
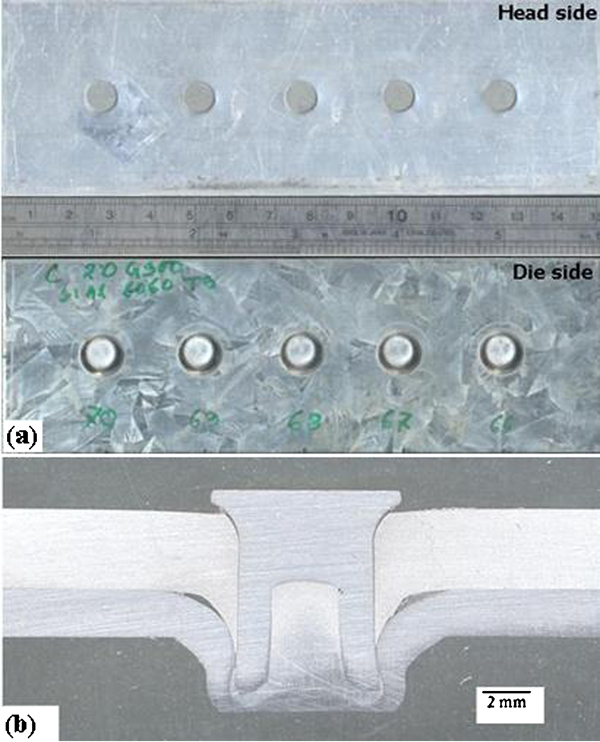
a aluminium–steel riveted joint under investigation and b cross-section of middle joint, sectioned after neutron diffraction measurements were made
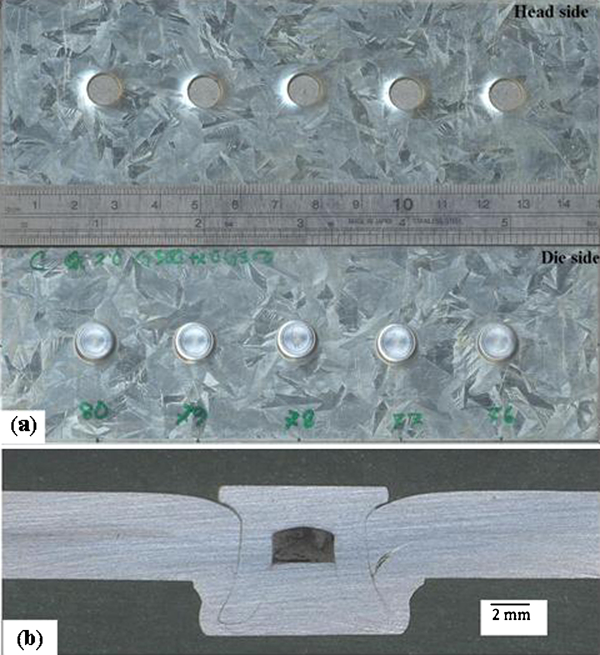
a steel–steel riveted joint under investigation and b cross-section of middle joint, sectioned after neutron diffraction measurements were made
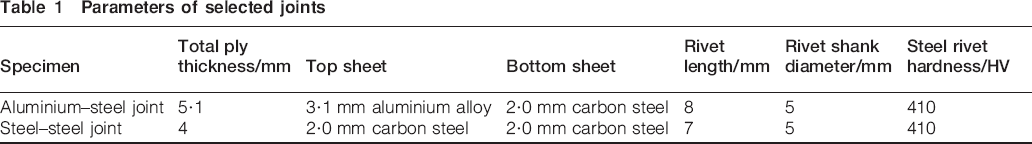
To study the feasibility of measuring the residual stress in rivet and ply materials, first, sheet coupons of aluminium and steel were chosen to ensure that all the diffracted peaks could be determined easily from either rivet or bottom sheet, as the diffraction angles for steel and aluminium are different. To study further the feasibility of measuring the residual stress in rivet and ply materials, sheet coupons of steel and steel were chosen to compare with the previous results. Force and displacement were measured during the riveting process, and it was observed that, for both conditions, all five joints showed reproducible behaviour during the riveting operation ( Figure 4 Figs. 4 and 5). The maximum force was 49 kN, and the rivet setting pressure was 215 bar, whereas the preclamp pressure was 130 bar. Joints 68 and 78, located in the middle of the sample shown in Figs. 2a and 3a, were chosen for the residual stress measurement; the parameters are given in Table 1.
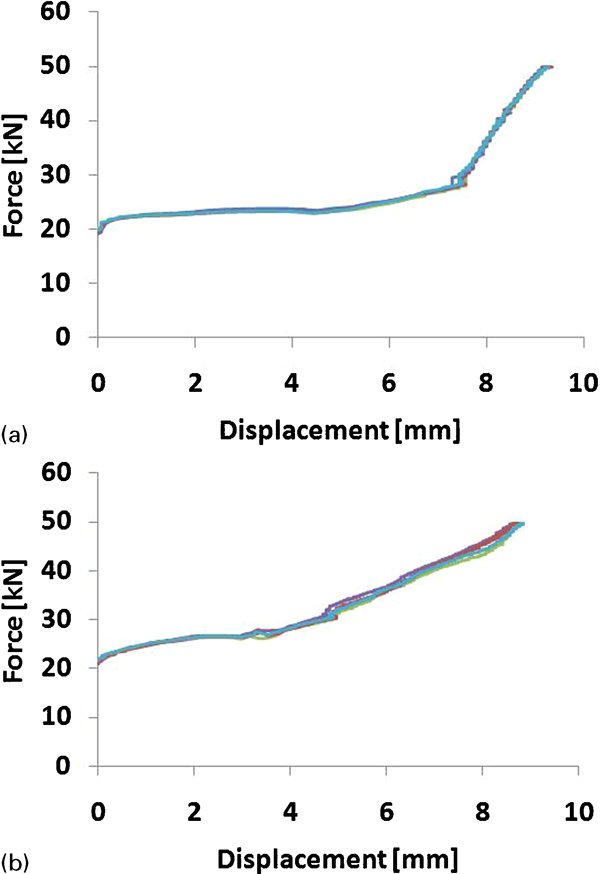
Reproducible behaviour of SPR process
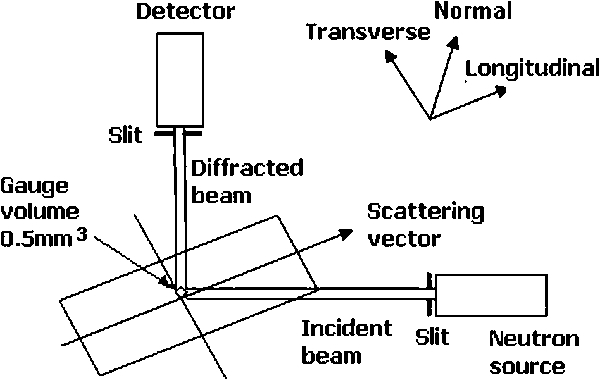
Schematic of set-up for diffraction experiment
Parameters of selected joints
Neutron diffraction measurements were performed on a strain scanner named ‘Kowari’ at the Australian Nuclear Science and Technology Organisation. A monochromatic beam of thermal neutrons of 1·66 Å wavelength was used, and the Fe (211) diffracting plane was chosen for the investigation. A two-dimensional position sensitive 3He detector was used to record the diffraction peak. The detector was positioned at an angle of 89·6° with respect to the incident beam to utilise the Fe (211) reflection. A schematic set-up of the diffraction experiment is shown in Fig. 5. As the investigated joint sample was small, a gauge volume of 0·5 mm3 was used, which was the smallest available gauge volume that gave the best compromise between spatial resolution and experimental counting time. The sample was accurately positioned on the instrument using the software SScanSS33, 34. In combination with a model of the sample, generated with the help of a laser scanning system available in Kowari, SScanSS was also used to define measurement points as well as estimate the required counting time, depending on the current direction of strain.
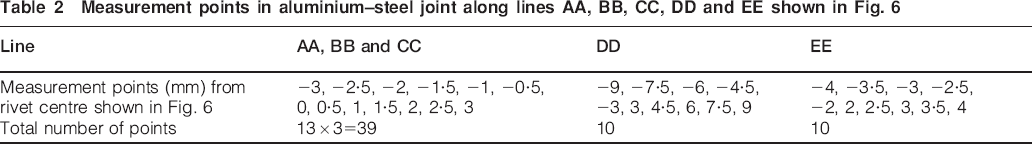
In the first experiment, strain measurements over the gauge volume were made along lines AA, BB and CC, which were at depths of 1, 1·5 and 2 mm respectively from the surface of the rivet head (Fig. 6). Strain was also measured along line DD, which was 1 mm up from the undeformed bottom sheet surface to obtain the behaviour of stress in steel sheet, and along line EE, which was 2 mm up from the tail (die side) of the joint to obtain the behaviour of material inside the die, as shown in Fig. 6. The positions of the measurement points taken along those lines and relative to the joint centreline are summarised in Table 2. It may be noted that all the measurement points along lines AA, BB and CC were within the rivet head, whereas points located at ±3 mm on line DD and at ±3·5 mm on line EE were within the rivet leg, while the rest were located in the steel sheet. A total of 59 points were chosen for strain measurement.
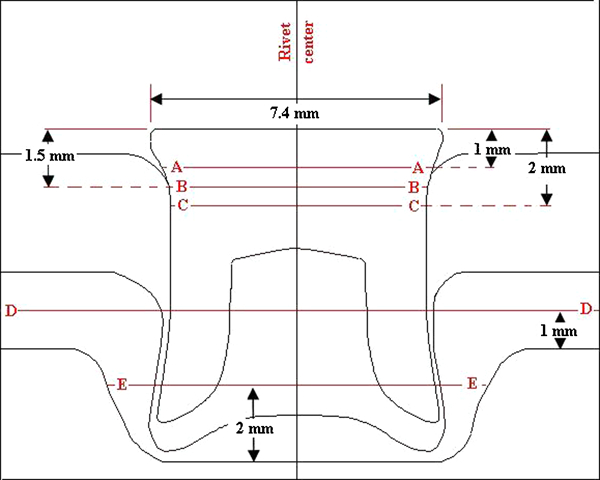
Measurement lines for residual stress in joint of 3·1 mm aluminium alloy +2·0 mm carbon steel
Measurement points in aluminium–steel joint along lines AA, BB, CC, DD and EE shown in Fig. 6
The rivets are produced by forging and heat treated to the required hardness level, so residual stress may exist in a new unused rivet. Therefore, a user reference lattice dr was used instead of the so called strain free d0 reference lattice for the calculation of microstrain. For the rivet material, dr was determined from the head of a new unused rivet, and for the steel sheet, the reference point was taken at 1 mm from the free corner of a new sheet.
Transverse, normal and longitudinal components of microstrain along the
line AA are shown in Fig. 7.
Measurements in six directions at a point are necessary to define the strain
tensor completely. Since the principle directions coincide with the coordinate
measurement directions, the stress then can be calculated using the following
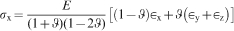
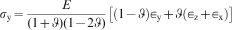
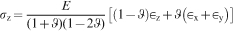
formulae with corresponding expressions for σx, σy
and σz in terms of
 ,
,
 and
and
 32, 33
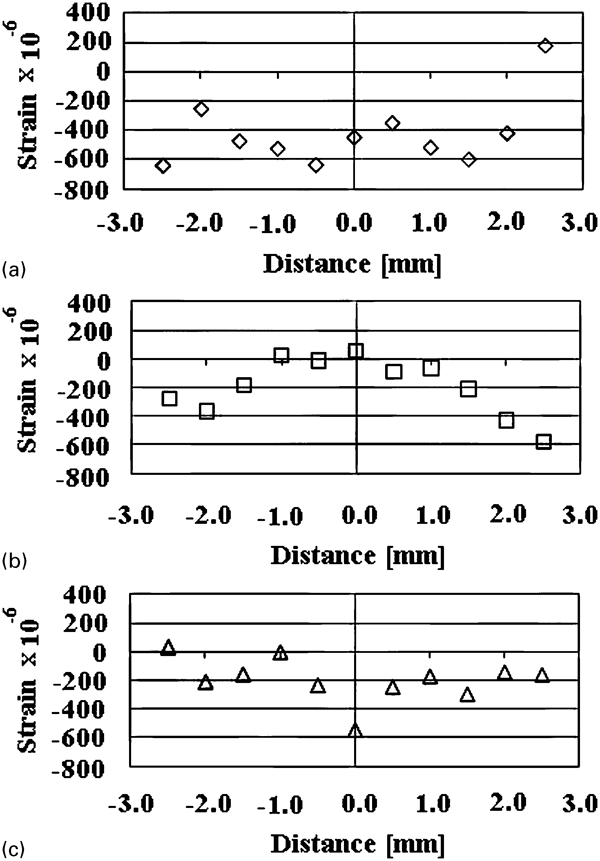
Strain profiles along line AA shown in Fig. 6
In the second experiment, strain measurements over the gauge volume were made along lines FF and GG, which were 1 and 1·5 mm below the surface of the rivet head (Fig. 8). Strain was also measured along line HH, which was 1 mm down from the undeformed top sheet surface, along lines II and JJ, which were 1·5 and 1·0 mm up from the undeformed bottom sheet surface respectively, and along line KK, which was 1·5 mm up from the tail (die side) of the joint, as shown in Fig. 8. The positions of the measurement points taken along those lines and relative to the joint centreline are summarised in Table 3. It may be noted that all the measurement points along lines FF and GG were within the rivet head, whereas points located at ±3·5 mm on lines II and KK were within the rivet leg. A total of 69 points were chosen for strain measurement. The same procedure was followed for the strain free lattice reference.
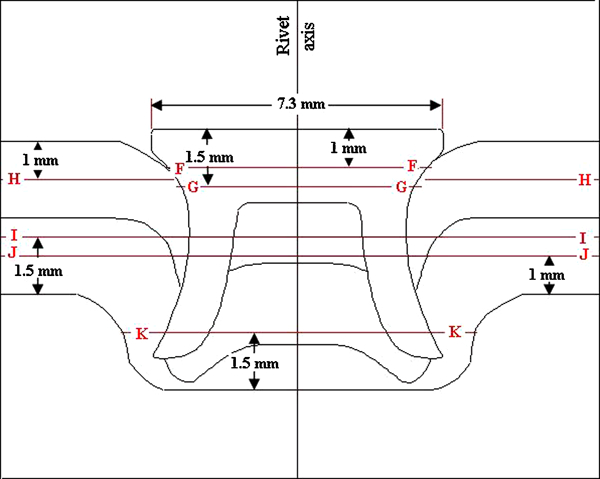
Measurement lines for residual stress in joint of 2·0 mm carbon steel +2·0 mm carbon steel
Measurement points in steel–steel joint along lines FF, GG, HH, II, JJ and KK shown in Fig. 8
Results and discussion
Aluminium–steel joint
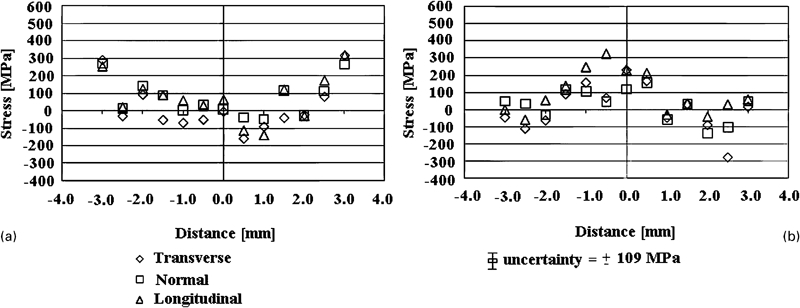
The stress components in the rivet head of the aluminium–steel joint are shown in Fig. 9. For the points situated at ±3 mm from the rivet axis on lines AA, BB and CC, no diffraction peak was observed, which means that those points were outside the rivet head and situated in the surrounding aluminium sheet. This indicates that a rivet inside a joint can be detected by neutron diffraction. Hence, 11 points were considered for stress calculation, excluding the two extreme points at ±3 mm on each of the lines AA, BB and CC (Fig. 6). It is believed with 95% confidence that the uncertainty on calculated stresses was ±109 MPa. Uncertainty increases as the gauge volume decreases, but the uncertainty could be minimised by increasing the detecting time or using high intensity neutrons. Despite the small dimensions involved here, meaningful results were obtained in this experiment.
Residual stress profiles in rivet head in aluminium–steel joint along lines a AA, b BB and c CC corresponding to lines shown in Fig. 6
It was evident from Fig. 9 that a compressive residual stress was developed in the rivet head of the aluminium–steel joint. Generally, a normal residual stress near the surface is close to zero. The compressive residual stress on line CC is lower in the normal direction as it is nearer to the inner surface (Fig. 9c). A tensile trend in the stress profile was found 2·5 mm from the rivet centre. Given that the elastic residual stresses must be balanced, this implies that there could potentially exist a large tensile stress close to the side wall of the rivet head. This pattern of residual tensile stress is in agreement with published modelling data.22 However, the magnitude of the residual stress depends on the joint parameters, such as rivet hardness and sheet material properties, and it would be beneficial to verify the magnitude of the stresses either by simulation or by an alternate test such as synchrotron or contour methods. The value of normal stress on line BB (average = −120±60 MPa) falls between that for line AA (average = −136±41 MPa) and line CC (average = −70±120 MPa). The maximum compressive stress in the rivet head was 300 MPa and found 1·5 mm from the rivet axis on line BB in the transverse direction (Fig. 9b).
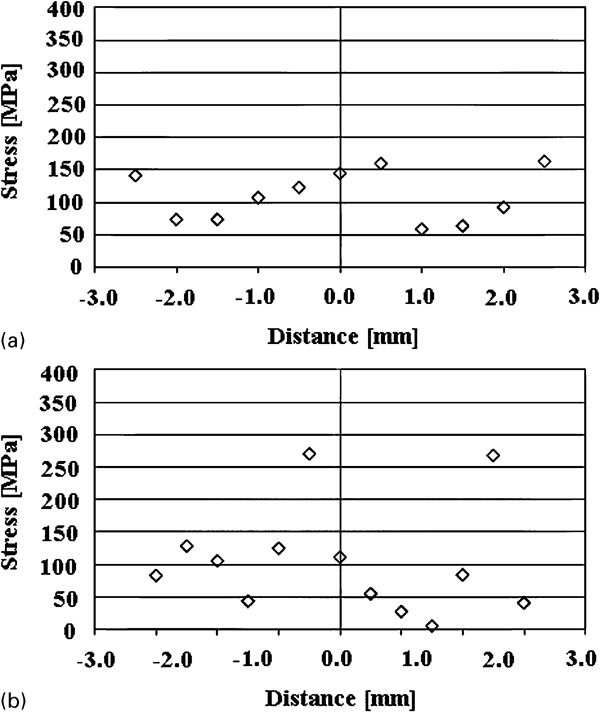
The stress components in the rivet leg and inside the steel sheet material are shown in Fig. 10. A big change in the magnitude of residual stress at ±3 mm from the rivet centre on line DD (Fig. 10a) confirms that these points fell within the rivet leg. The stress was compressive in nature and estimated to be 550 MPa. The stress that developed near the rivet wall was near zero, which is in agreement with the nature of stress balance. The residual stresses that developed 7·5 mm from the rivet centre, which is three times the rivet radius from the rivet axis, were not significant. The tensile stress found on line DD was related to the surrounding sheet material flowing towards the die. The residual stress measured along line EE provides information on the behaviour of the material inside the die (Fig. 10b). During the riveting operation, as soon as the rivet started flaring, it pushed the bottom sheet towards the die cavity, triggering plastic deformation of the bottom sheet, putting the material in tension during this operation. A tensile condition is observed in this part of the material. On the other hand, at ±3·5 mm away from the rivet axis along line EE, a compressive stress of 350 MPa was observed, confirming that these points fell within the rivet leg. The sheet material around this point could not move further due to the reaction from the die, and all the surrounding material enclosed the rivet leg compressively. This is the reason why a compressive stress developed in the rivet leg in this region. It may be noted that the transverse stress near the wall of the rivet leg was close to zero, as expected.
Residual stress profiles in rivet legs and surrounding sheet material in aluminium–steel joint along lines a DD and b EE corresponding to lines shown in Fig. 6
Steel–steel joint
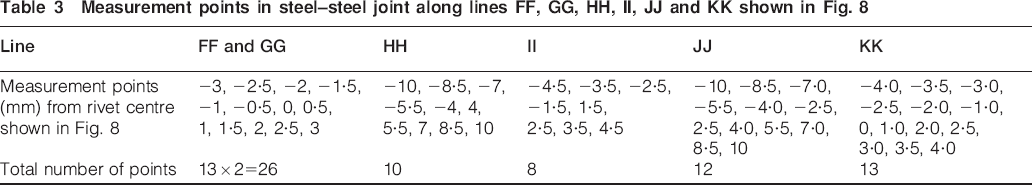
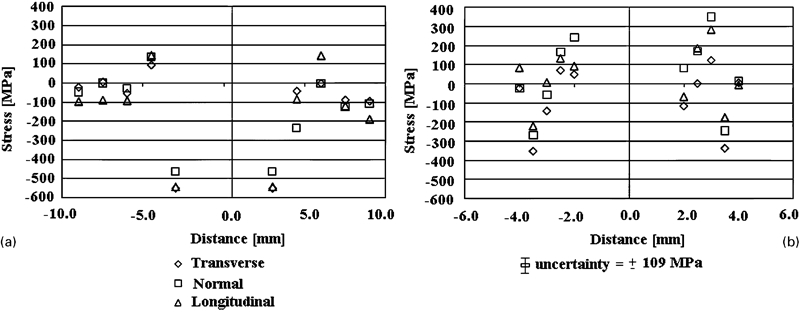
The stress components in the rivet head for the steel–steel joint are shown in Fig. 11, and the stress components in the steel sheet and rivet leg are shown in Fig. 12. A tensile trend of residual stress in the middle of the rivet head was observed for the steel–steel joint, whereas for the aluminium–steel joint, the trend was completely compressive. This was the indication of a gap under the rivet head (Fig. 3b). The tensile stress went up to 300 MPa in the middle of the rivet head, and the compressive stress went up to −300 MPa near the wall of the rivet head. It may be noted that, unlike the aluminium–steel sample, at ±3 mm apart from the rivet axis, a diffraction peak has been observed for the steel–steel sample. Therefore, it is evident that this diffraction peak comes from the steel sheet. However, the stress values appear to be too high on line FF (Figs. 8 and 11a): this high value of stress might be a result of a combined stress from both rivet head and sheet material. On line GG (Figs. 8 and 11b) at ±3 mm from the rivet axis, a tensile stress was observed as expected: this is an indication of elongation of sheet material and material flow towards the rivet bore. An equivalent stress comparison, shown in Fig. 13, revealed that the stress in the rivet head was higher for the steel–steel sample (270 MPa) than for the aluminium–steel sample (160 MPa). This means that as the hardness of the ply materials increases, the residual stress will increase. It is believed that as the hardness of the ply materials increases, residual stress will increase up to a certain limit for a given rivet. A further increase in hardness of the ply material for a given rivet may result in zero residual stress, which will indicate a crack in the rivet inside a joint. Residual stress components on line HH, which is situated 1 mm below the undeformed surface of the top sheet, are not significant within the limit of uncertainty and in comparison with the yield strength of the material: the values are on the order of 100 MPa.
Residual stress profiles in rivet head in steel–steel joint along lines a FF and b GG corresponding to lines shown in Fig. 8
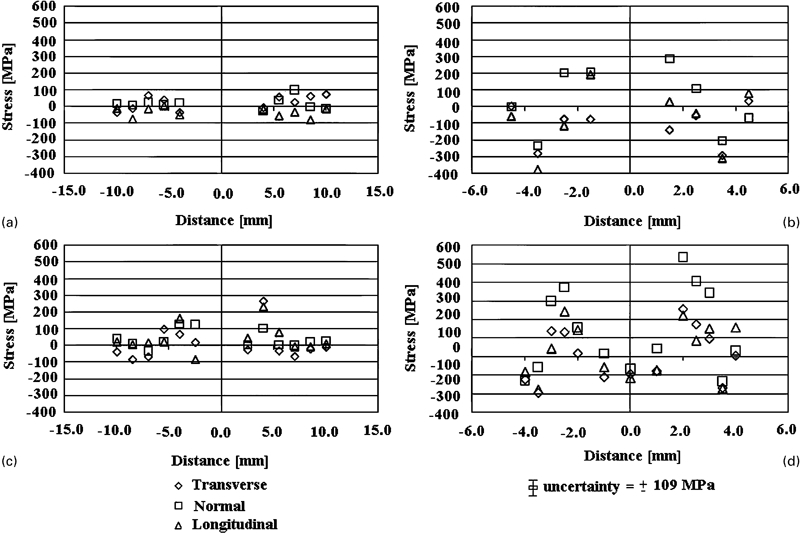
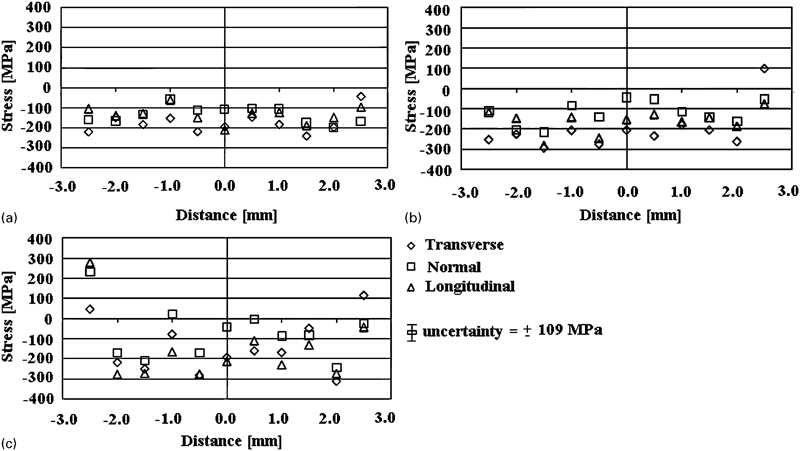
Residual stress profiles in steel–steel joint along lines a HH, b II, c JJ and d KK corresponding to lines shown in Fig. 8
Equivalent stress comparison 1·5 mm deep in rivet head
A big change in the magnitude of residual stress was observed at points ±3·5 mm from the rivet centre on line II, which confirms that these points were situated in the rivet leg (Fig. 12b). Other points on this line, such as ±1·5 and ±2·5 mm from the rivet centre, were situated inside the gap under the rivet head (Fig. 3b). The values corresponding to those points may come from the inside wall of the rivet. By examining the raw data, it was found that the intensity was low at those points. The residual stress at points ±4 mm from the rivet centre on II is a combined stress from different materials.
The information on the behaviour of residual stress in steel sheet on the die side was found from the measurements on line JJ. It can be seen from Fig. 12c that the stress developed near the rivet wall was near zero, which is in agreement with the nature of stress balance. The equivalent stress profile on line JJ followed the same trend as the stress profile found on line DD (Fig. 14) since both lines were situated 1 mm up from the undeformed tail surface and in the middle of the bottom sheet.
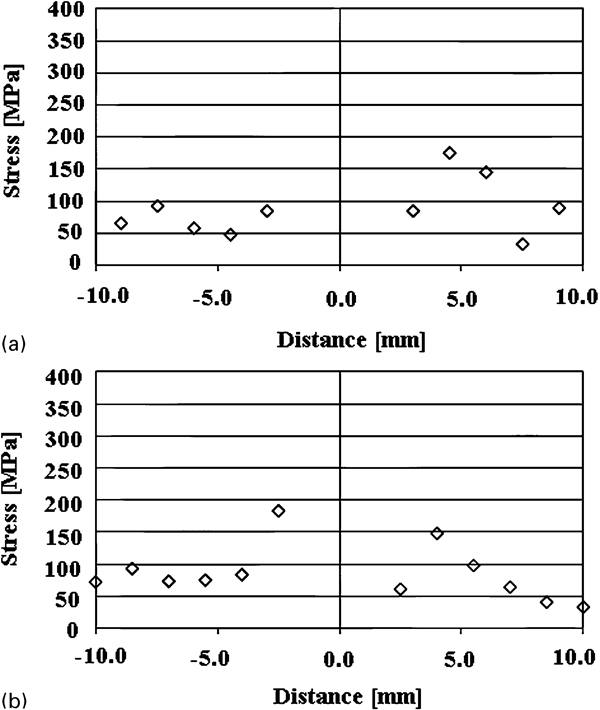
Equivalent stress comparison 1·0 mm up from undeformed surface of tail side
The residual stress measured along line KK at 1·5 mm up from the die wall provides information on the behaviour of the material inside the die (Fig. 12d). A tensile condition was also observed in this part of the material, as with the aluminium–steel sample. On the other hand, at ±3·5 mm away from the rivet axis along line KK, a compressive stress of 300 MPa was observed, confirming that these points fell within the rivet leg.
Conclusions
The feasibility of measuring residual stress in different riveted joints was examined in this study. The trend of residual stress found in this experiment was consistent with the simulated results reported by authors, albeit for other steel joints and thicknesses. It is evident from the residual stress profiles that neutron diffraction technique can successfully predict the position of the rivet leg after flaring in a joint without having to cross-section. This scenario ultimately validates the feasibility of residual stress measurement using the neutron diffraction technique. Stresses that developed in the rivet bore near the interface between the top and bottom sheets were the largest for both joints and were significant because of the high value of compressive stress. During service, loading of the joint may cause the stress in the rivet to reach the ultimate strength of the material, which will lead to premature failure of the joint. An investigation applying this methodology to the measurement of residual stress for a wider range of joints will be reported later with a view of providing guidance in the optimum design of SPR joining conditions.
Footnotes
Acknowledgements
The authors acknowledge AINSE for awarding grant no. 1416 to carry out neutron diffraction studies at ANSTO. The authors would also like to thank Henrob (UK) Pty Ltd for supplying the materials required to produce the joints. The support of CAST CRC is acknowledged. CAST was established under and is supported in part by the Australian Government's Cooperative Research Centre Program.