
Abstract
A quantitative analysis of the retained austenite (RA) fractions in gas tungsten arc welded silicon and aluminium containing transformation induced plasticity steels was carried out by synchrotron X-ray diffraction measurements. The variation in RA transverse to the weld line was measured to study the effect of weld thermal cycles on the stabilisation of austenite in the heat affected zone (HAZ) and the fusion zone (FZ). The results showed that the FZ of silicon based steels contained a higher amount of RA (∼7%) than aluminium based steels, which contained only ∼4%. During the solidification of the weld pool, aluminium was found to partition to solidifying δ-ferrite and to stabilise the soft δ-ferrite grains at the fusion boundaries. Owing to this partitioning, the HAZ was enriched in carbon and the RA content was found to increase with distance from the fusion boundaries. In contrast, this partitioning behaviour was not present in silicon based transformation induced plasticity steels and a lesser amount of RA was found in the coarse grained HAZ than in the FZ.
Introduction
Transformation induced plasticity (TRIP) steels are a class of advanced high strength steels which offer a combination of high strength, high formability (uniform elongation 20–40%) and high dynamic energy absorption during high strain rate crash deformation (350 MJ m−3 at 1000 s−1). The use of high strength thinner gauge TRIP steels in passenger cars leads to the reduction in car weight and thereby reduces fuel consumption and emission.1 Moreover, the higher dynamic energy absorption during crash improves the passenger safety and the crash worthiness of the vehicle. The combination of properties of TRIP steels is mainly achieved by the stress induced transformation of metastable retained austenite (RA) in the microstructure. The metastable austenite is stabilised due to the addition of alloying elements such as Si and Al, which suppress the formation of iron carbides during the bainitic transformation of austenite, thereby enriching the untransformed austenite with carbon. The enriched austenite is subsequently retained at room temperature. However, the higher alloying content of these steels limits their weldability, and the thermal cycle of a welding process destroys the carefully designed austenite containing microstructure which results in inferior mechanical properties of the weld. During a typical weld thermal cycle, steel in the heat affected zone (HAZ) near the fusion boundary is heated to peak temperatures close to the liquidus temperature. Peak temperatures reached during welding in the HAZ decrease with increasing distance from the fusion boundary. Owing to this thermal cycle, the austenite size, volume fraction and composition (especially carbon) vary in the HAZ and thus the stability of austenite in the HAZ is affected.2
Cretteur et al. attempted to improve the mechanical properties of TRIP steel welds by modifying the weld microstructure using pre- and post-weld heat treatments.3 Studies on the microstructural evolution during gas tungsten arc (GTA) welding of TRIP steels showed the formation of complex inclusions in the fusion zones (FZs) of silicon and aluminium containing TRIP steels, and stabilisation of ferrite only at the fusion boundaries of aluminium containing TRIP steels.4 Quantitative analysis of RA in the HAZ and FZ of the welded TRIP steels using a magnetic saturation method revealed that a significant amount of austenite was retained after welding.5 However, due to a relatively large sample size in the magnetic measurements (0·025 m3), correlation of weld thermal cycles to the volume fraction and carbon concentration of austenite retained in the welded samples was found to be difficult.
Synchrotron X-ray diffraction (XRD) is commonly used for quantitative volume fraction and carbon concentration measurements of RA in TRIP steels.6– 8 Owing to its high accuracy in measuring lattice parameters and phase fraction, synchrotron XRD measurement is preferred to study the behaviour of austenite transformation in steels.9– 12 It was also successfully used to study the phase transformations in steels while applying the weld thermal cycles.13– 16
In this work, we report a quantitative measurement of RA in GTA welded silicon and aluminium based TRIP steels using synchrotron XRD analysis. The quantitative diffraction analysis was carried out transverse to the weld centreline using a 240×200 μm2 synchrotron beam. Variations in RA content were measured across the width of the welded plates. The effect of weld thermal cycle on the partitioning of alloying elements such as carbon, silicon and aluminium and possible mechanism for the stabilisation of RA in weld zones were examined for both silicon and aluminium based TRIP steels. The partitioning behaviour of aluminium to the solidified δ-ferrite from the weld pool and subsequent enrichment of carbon to the HAZ due to the stabilisation of δ-ferrite in the fusion boundary was also analysed.
Experimental
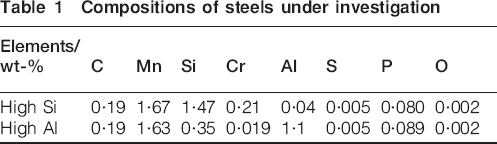
Commercial grade and industrially processed silicon bearing (high Si) and aluminium bearing (high Al) TRIP steels were examined in this study. The compositions of the steels are presented in Table 1. High Si steel with a thickness of 3 mm was received in a hot rolled and annealed condition and high Al steel was received in a cold rolled and galvanised condition with a thickness of 1·25 mm. The total content of alloying elements is ∼3·5 wt-%. The carbon and manganese contents in both steels are almost identical. In the high Si steel, the silicon content is 1·47 wt-% and in the high Al steel, the aluminium content is 1·1 wt-%. Apart from aluminium, high Al steel contains 0·089 wt-% phosphorous which is almost equal to the phosphorous content of the high Si steel. Both steels have dissolved oxygen contents of ∼0·002 wt-%.
Compositions of steels under investigation
Sample plates for GTA welding experiments with a length of 250 mm and a width of 100 mm were cut from the steel plates and subjected to a TRIP heat treatment cycle using salt baths. These heat treatments were performed to eliminate influences due to production conditions and generated the base microstructures for welding experiments. Samples were intercritically annealed at 800°C for 1800 s to obtain a ferrite–austenite microstructure, followed by an isothermal bainitic holding at 400°C for 60 s and subsequent water quenching to room temperature.
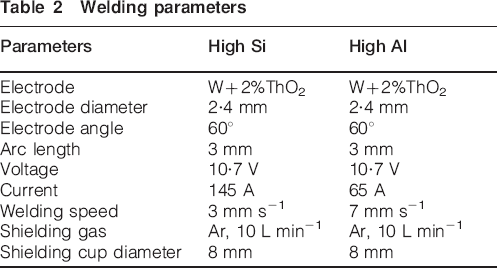
Bead on plate welding was performed on these heat treated plates using automated GTA welding equipment (Migatronic Commander 400 AC/DC); the welding parameters used are shown in Table 2. The welding current and speed were adjusted to generate similar sized weld pools during welding of the 3 mm thick high Si and 1·25 mm thick high Al steel samples. An automatic voltage control algorithm was used to keep the voltage constant during welding. The conditions resulted in full penetration welds of ∼5 mm top width along the centreline of the plates. During welding, the samples were clamped to a steel backing plate with a 20 mm wide central groove for purging backing gas (argon). At 125 mm from the starting edge of the samples, the backing plate has a 20 mm wide grove perpendicular to the welding direction, to allow thermocouple measurements to be made at the bottom side of the samples. In situ temperature measurements were performed during bead on plate welding using 0·25 mm diameter k type thermocouples, which were discharge welded to the bottom of the plates on a line perpendicular to the weld seam, starting 2·5 mm either side of the weld centerline with interdistances of ∼3 mm between measurement points. After welding, three-dimensional images of the welded plates were generated using a Konica Minolta VI-910 3D laser scanner in order to estimate the plate deformations with a measurement accuracy of ±0·1 mm. The results of the deformation measurements were then used to adjust the detector to sample distance during the diffraction measurements.17
Welding parameters
Synchrotron XRD measurements were carried out on the welded plates at beamline ID11 of the European Synchrotron Radiation Facility (ESRF) using a three-dimensional XRD microscope. A monochromatic X-ray beam with an energy of 71·64 keV (wavelength 0·1732 Å), a horizontal beam size of 0·24 mm and a vertical size of 0·20 mm was used to illuminate the steel plates. Measurements were carried out transverse to the welding direction, moving from the edge of the plate through the weld zone in a straight line of 75 mm in length with a step size of 0·2 mm. With an exposure time of 6 s, the two-dimensional (2D) diffraction rings from austenite and ferrite were recorded in transmission geometry using an FReLoN 2D area detector. The effective channel size of this detector is 48×49 μm2 with a dynamic range of 216. A minimum readout time of 125 ms can be achieved with the total number of pixels of 2048×2048. In both welded plates, the weld centreline was ∼50 mm from the plate edge. The diffraction measurements were carried out in transmission mode. Some microstructural gradients through the thickness will inevitably be present in the welded material. However, variation is expected to be small as the weld is fully penetrated and heat flow is essentially 2D in the plates under consideration.
In order to characterise the base metal, cylindrical samples with a diameter of 1 mm and a length of 3 mm were electrodischarge machined from the TRIP heat treated plates with the cylindrical axis oriented in the rolling direction of the plate. These cut samples were then mounted and illuminated with a synchrotron X-ray beam of the same energy as that used for the welded plates, but with different horizontal and vertical beam sizes (1·2 and 0·6 mm respectively). During the illumination of base metal samples, they were continuously rotated around the sample axis, starting from −90 to +90°. Measurements were integrated over successive angles of 10° using an exposure time of 6 s in each step.
The 2D diffraction patterns obtained from the welded plates and base metal samples were then corrected for detector background and spatial distortion. Using standard lanthanum hexaboride (LaB6) powder samples, the sample to detector distance was calculated. The distance between the weld centreline to the detector was 241·30 mm. The volume fraction of austenite was calculated from the integrated intensities of two austenite [γ(200) and γ(220)] and two ferrite [α(200) and α(211)] rings using the procedure described by van Dijk et al. 6 The lattice parameters of the base metal austenite and ferrite were estimated from the experimental mean scattering angle 2θ. The accuracy in the volume fraction of RA measured by this technique is ±0·2% and the lattice parameters of ferrite and austenite were measured with an accuracy of 0·002 Å.
The TCFE2 and MOB2 database of Thermocalc and Dictra software were used to calculate the pseudobinary phase diagrams, equilibrium elemental fractions and partitioning of alloying elements in phases. Microhardness measurements of welded TRIP steels were carried out using a Vickers microhardness testing machine with a load of 300 g. Measurements are carried out transverse to the weld centreline towards the base metal through the FZ and HAZ at spacings of 200 μm.
Results
Characteristics of high Si and high Al base metals
The phase transformation behaviour of the high Si and high Al steels used here differ significantly in terms of their transformation temperatures and the phase fields (Fig. 1). The Ae3 temperature of the high Si is ∼885°C, whereas high Al steel shows a higher temperature (1036°C). Optical microscopy examinations reveal the presence of RA (Fig. 2) after etching with LaPera's reagent. 18 18,19 The volume fraction of RA present in the high Al base metal sample was found to be higher (15·4%) than in the high Si steel sample which contained only 10·9%, although both steels underwent the same TRIP heat treatment (intercritical annealing at 800°C and isothermal bainitic holding at 400°C). It can be seen from the pseudobinary phase diagram of high Al steel (Fig. 1b) that the addition of aluminium in steels increases the equilibrium carbon content of austenite in the intercritical (α+γ) region and extends the region to higher temperature. The equilibrium carbon content of austenite at 800°C in high Al steel is 0·77 wt-% which is higher than that of the high Si steel (0·43 wt-%), as a result, the austenite is enriched in carbon to a greater extent during intercritical holding at 800°C in high Al steels, resulting in higher austenite stabilisation during isothermal holding at 400°C and subsequent cooling to room temperature.
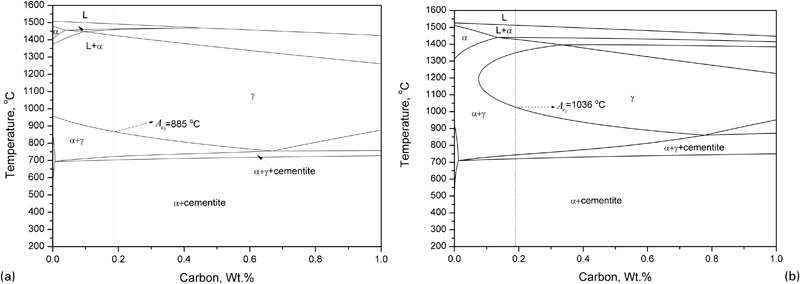
Pseudobinary phase diagrams of TRIP steels under investigation4
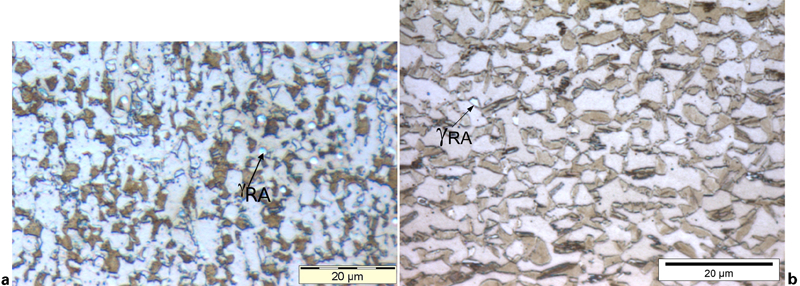
Microstructure of TRIP steel base metals after intercritical annealing at 800°C for 1800 s and followed by isothermal bainitic holding at 400°C for 60 s (etched with LaPera's reagent)
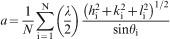
Figure 3 shows the diffraction patterns of high Si (Fig. 3a) and high Al (Fig. 3b) base metal samples after the average radial integration of (hkl) reflections over 180°. The mean lattice parameters of austenite and ferrite in the base metal samples were determined from the experimental mean scattering angle 2θi of the considered {hkl} reflections using the following relationship6
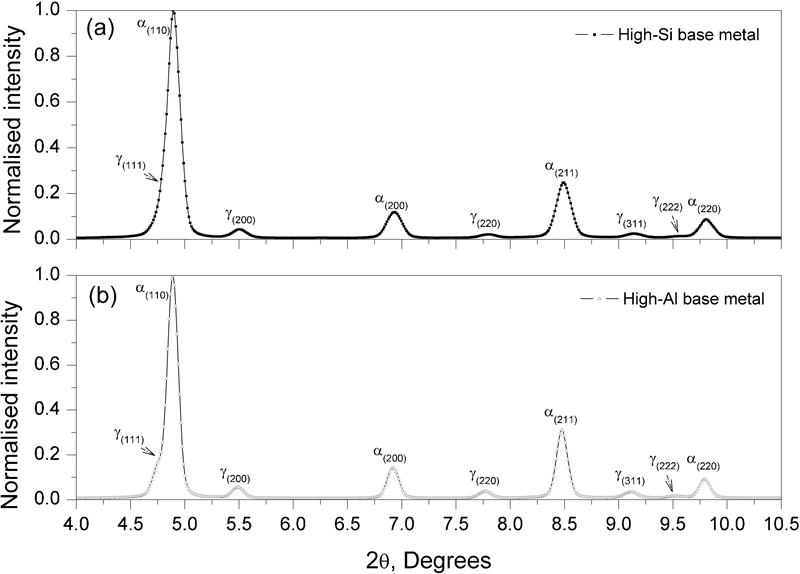
Integrated diffracted rings of TRIP steel base metal samples showing different austenite and ferrite (hkl) reflections
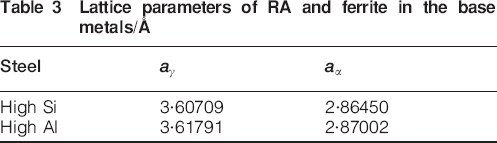
Lattice parameters of RA and ferrite in the base metals/Å
The carbon concentration of RA was then estimated from the calculated lattice parameter aγ using the relationship6

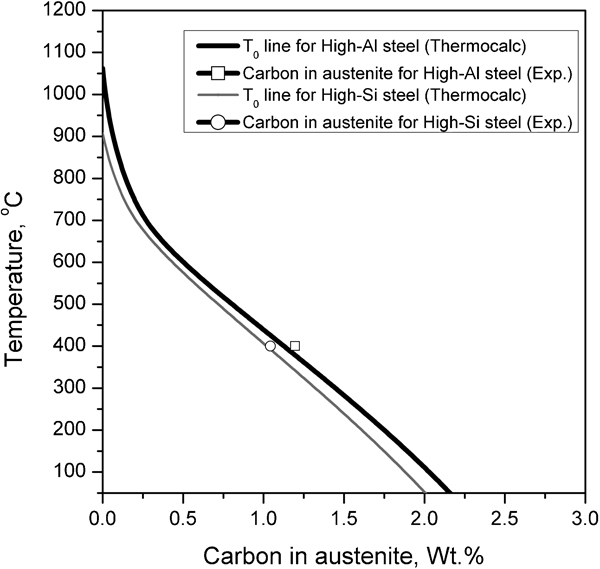
Experimentally measured RA carbon concentration of high Si and high Al base metal samples showing slightly higher values than calculated T0 allotropic phase boundaries
Thermal profiles of GTA welding
The thermal profile of a welding process dictates the microstructural evolution in the HAZ and FZ. Figure 5 shows the temperature variation across the width of the high Si and high Al steel plates during GTA welding. The maximum temperature measured at 3·5 mm from the high Si steel weld centreline was 1058°C. This measurement point had average heating and cooling rates of 520 and 200°C s−1 respectively from the peak temperatures to room temperature. A maximum temperature of 440°C was measured at 12 mm from the weld centreline with average heating and cooling rates of 80 and 40°C s−1. During GTA welding of high Al steel plate, a maximum temperature of 980°C was measured 2·6 mm from the weld centreline, where the maximum cooling and heating rates (550–200°C s−1) were also observed.
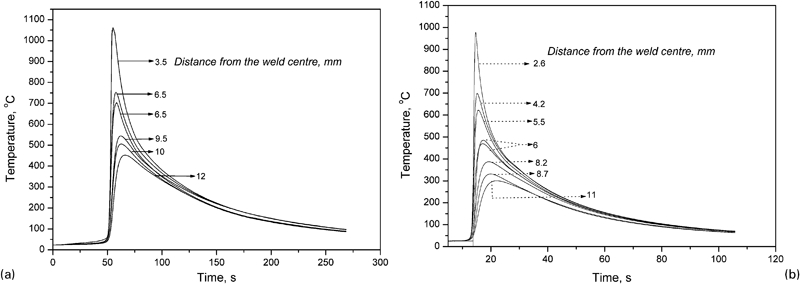
Thermal cycle during GTA welding of TRIP steel plates at different distances from weld centreline4
Microstructural characteristics of welded TRIP steel plates
The FZ and HAZ contain primarily a martensitic structure in welded TRIP steels and, occasional grain boundary Widmanstätten, bainite and intragranular acicular ferrite in GTA welded steels. The average grain size in the coarse grained HAZ in both steels is ∼120 μm (Fig. 6). The FZs of both steels show the presence of inclusions, mainly with a random distribution, in some places decorating the grain boundaries. The average size of the inclusions in the FZ of the high Si steel is found to be smaller than that in the high Al FZ. A distinctive zone of soft allotriomorphic ferritic grains was found across the fusion line of high Al steel welds which is not present in welded high Si steel samples (Fig. 6). In addition, the presence of grain boundary ferrite is also observed in the FZs of welded high Al steel samples. A previous work showed that the presence of strong oxidising elements such as aluminium and silicon promotes the formation of non-metallic oxide based complex inclusions in the FZ of welded TRIP steels and the partitioning of aluminium to the solidified δ-ferrite at the fusion boundaries formed a ferritic zone, as shown in Fig. 6b.4
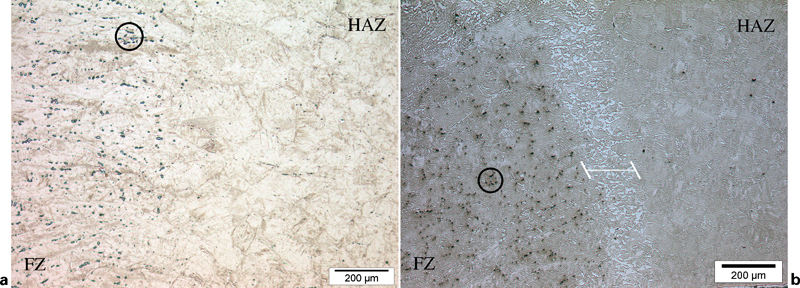
Optical microscopy images of welded TRIP steel samples4
Diffraction analysis of welded plates
The synchrotron diffraction measurement on the welded TRIP steel plates yielded 2D diffraction patterns in the transverse direction across the weld centreline. Figure 7a schematically shows the measurement profile used for the welded plates, where the transverse line running over the points A–B–C–D indicates the measurement line used. The distance from the plate edge (point A) to point D is 75 mm. In both steel welds, the width of the FZ is 5 mm and the point C shows the weld centreline. Figure 7 b-d shows that the 2D diffraction rings obtained correspond to the point A (base metal), point B (heat affected zone) and point C (weld centreline) of the high Al steel weld respectively. After detector background and spatial distortion correction, the 2D diffraction patterns obtained along the transverse line to the weld were radially integrated and intensity–2θ plots were obtained (Fig. 8). Figure 9 shows the variation in RA content and the linear interpolation of measured peak temperature reached during GTA welding of TRIP steel plates.
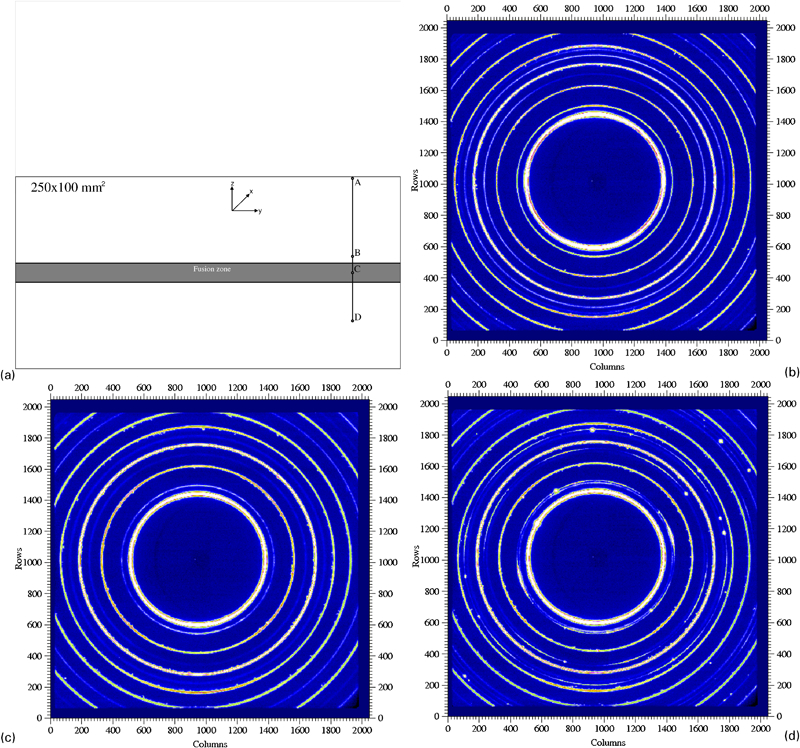
a schematic illustration of measurement profile used for synchrotron diffraction analysis of welded TRIP steel plates and b–d 2D diffraction patterns obtained in base metal (point A), in HAZ (point B, 4 mm from weld centreline) and at weld centreline (point C): from inside towards outside, patterns show diffraction rings of γ(111), α(110) [merged with γ(111)], γ(200), α(200), γ(220), α(211), γ(311), γ(222) and α(220) respectively
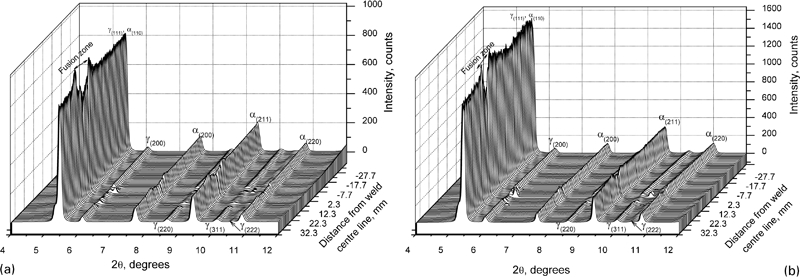
Intensity–2θ patterns along the transverse direction of welded a high Si and b high Al steel plates
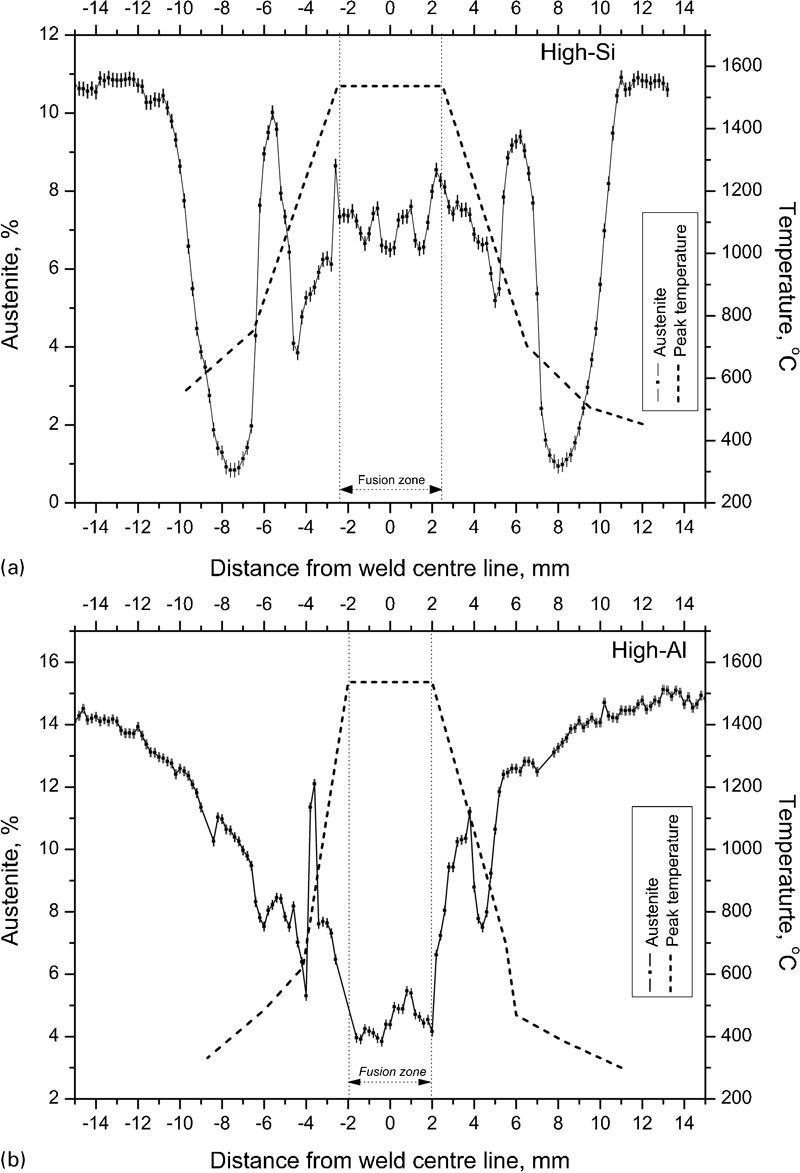
Variation in RA content in welded a high Si and b high Al steel plates: measurement error is ±0·2%
The austenite fraction increases from the fusion boundaries in welded high Al TRIP steel up to 4 mm from the weld centreline whereas in high Si steel, the austenite fraction decreases. It is confirmed from the previous work4 that, during welding of high Al steel, the partitioning of aluminium to the solidified ferrite leads to the stabilisation of polygonal ferrite grains in the fusion boundaries. This ferrite stabilisation leads to the diffusion of carbon into the adjoining austenite grains in the HAZ, enriching them. As a result, the austenite content is found to increase in high Al steel at these locations. This partitioning behaviour is not found in welded high Si steels. Thus, there is no increase in austenite content found in this region (Fig. 9).
The austenite fraction is further found to increase from 4 mm from the weld centreline and both steels showed a maximum amount of austenite in the HAZ (12% in high Al and 10% in high Si) in the location where the peak temperature during welding was ∼800°C. The austenite fraction increases mainly because the peak temperature reached is in the intercritical (α+γ) region. In this region, the austenite is enriched in carbon due to partitioning of carbon from coexisting ferrite; a higher amount of austenite is therefore stabilised compared with other locations in the HAZ.
Apart from this, in the case of welded high Si steel, at ∼8 mm from the weld centreline, there is a distinctive zone with very small austenite content (∼1%). The peak temperature reached during welding at this location is found to be 600°C, which is lower than the Ac1 temperature (temperature above which austenite nucleates during heating). In a previous work,5 it is shown that while studying the thermal stability of austenite during continuous heating, the RA decomposes into a ferrite and cementite mixture when the heating temperature reaches >290°C. Thus during welding, in the zones where the peak temperature is below Ac1 and >290°C, the RA present in the microstructure is decomposed into ferrite+cementite. However, this effect is not seen to any significant extent in the high Al steel, due to the increased stability of aluminium containing austenite and the use of thinner plates (1·25 mm) as compared with the high Si steel (3 mm).
Microhardness variation in welded TRIP steels
The hardness variation across the FZs of GTA welded high Si and high Al TRIP steel plates is shown in Fig. 10. The hardness plots show that the overall hardness of welded high Si steel is higher than that of the welded high Al steel. The hardness value decreases gradually in high Si steel while moving from ±10 to ±7 mm from the weld centreline. This is quite significant since in this zone, the quantitative microstructural analysis indicated that the RA content also decreases gradually and at about ±8 mm from the weld centreline, the welded plate had a minimum RA content of 1% (Fig. 9a). The peak temperature reached at this zone is <600°C; when the temperature does not exceed Ac1 (nucleation temperature of austenite during heating), the RA present in the steel decomposes. The hardness measurement in the welded high Si steel shows the effect of this RA decomposition as hardness drops significantly from 340 to 260 HV(300 gf). However, in the high Al steel, there is no steep decrease in hardness found in this zone (±10 to ±7 mm from the weld centreline). Quantitative microstructural analysis in high Al steel has also shown that there is no significant reduction in RA in this zone in contrast to the high Si steel (Fig. 9b). In a similar area of the HAZ in welded dual phase steels, a reduction in hardness was observed due to the tempering of martensite present in the base metal microstructure,20 whereas in TRIP steels, the reduction in the hardness in the HAZ is mainly due to the decomposition of RA.
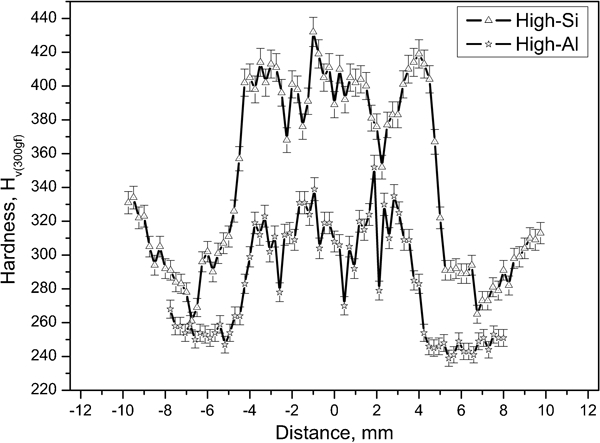
Hardness variation across weld zone of GTA welded TRIP steel plates
The hardness gradually increases while moving from ±7 mm towards the fusion boundaries. The peak temperatures reached in this zone are above Ar1 due to which the newly formed austenite transforms to martensite during cooling after welding, resulting in an increased hardness. The hardness drops again close to the fusion boundaries in both steels due to grain coarsening in the HAZ in high Si steel and grain coarsening combined with the effects of the formation of polygonal ferrite in the high Al steel. In the FZ, the heterogeneity in grain sizes and the presence of martensite and acicular products dictate the variation in hardness in the solidified microstructure.
Discussion
During a typical weld thermal cycle, the RA containing TRIP steel microstructure is heated to a peak temperature close to the melting point (∼1530°C) at the fusion boundaries. The peak temperature reached during welding gradually decreases with distance from the fusion boundary. Thermomagnetic measurements showed that the paramagnetic RA transforms into ferromagnetic ferrite after heating to 290°C.5 The decomposition of RA was also evident in the welded TRIP steel plates where the quantitative microstructural analysis from synchrotron diffraction measurements indicated that in the area where the peak temperature reached during welding was above ∼300°C, the RA content was reduced. In GTA welded TRIP steel plates, this peak temperature was reached at around 10–12 mm from the weld centreline. Thus, in welded TRIP steel plates, the HAZ extends to ∼12 mm from the weld centreline, to the point where the RA is not affected by the weld thermal cycle. This makes the HAZ of welded TRIP steels wider than reported for other advanced high strength steels such as dual phase steels. 20 20,21
In the HAZ, at positions where the peak temperature during the weld thermal cycle reached the intercritical (α+γ) region, the amount of RA was found to be higher than the area where the peak temperature reached the fully austenitic region. When the peak temperature remains in the intercritical region, the newly formed austenite grains were enriched in carbon from coexisiting ferrite, as given by the lever rule; this results in an increased RA content after welding. Conversely, when the peak temperature during welding remains below Ac1, the RA decomposes and a reduction in austenite content in the HAZ is found. Similarly, when the peak temperature rises above Ac3, all the austenite grains formed attain the bulk carbon concentration, which is always less than the carbon content of the austenite in the intercritical region, resulting in less RA in the higher temperature (>Ac3) positions.
In the FZs, where the peak temperature reached during a weld thermal cycle can be well above the melting point of the steel, the presence of highly oxidising alloying elements, such as aluminium and silicon, leads to the formation of non-metallic inclusions. A quantitative analysis using vibrating sample magnetometry showed that the average inclusion content in the FZs of welded TRIP steels under investigation was 2·6±0·2%. 4 4,5 Aluminium and silicon are added in TRIP steel to suppress the formation of iron carbides and thereby increase the carbon concentration of austenite, which results in an increased austenite stability. However, these elements in liquid metal combine with oxygen and form complex oxide inclusions during welding; as a result, dissolved aluminium and silicon in the FZ is depleted, which results in a reduced RA content in the FZ. The FZ in the high Al TRIP steel contains a higher volume fraction of non-metallic inclusions that are coarser than those in the high Si steel; the RA content in the FZ of high Al TRIP steel is lower than that of high Si steel.
During the solidification of the weld pool, the newly formed δ-ferrite in the fusion boundaries is enriched with aluminium due to partitioning from the solidifying liquid metal and also from the austenite in the HAZ in the high Al TRIP steel. This enrichment results in a stabilisation of δ-ferrite in the fusion boundaries. The width of the δ-ferrite zone found in the high Al steel FZ is ∼200 μm.4 The stabilisation of ferrite at the fusion boundaries during welding of aluminium containing TRIP steel was also reported recently by Kaputska et al. 22 for an aluminium rich plain carbon steel.23 The formation of a soft ferritic zone at the fusion boundary leads to a reduction in hardness and heterogeneity in the microstructure of the HAZ in welded high Al TRIP steel by affecting the stabilisation mechanism of RA in the HAZ.
Conclusions
After the TRIP heat treatment, the carbon concentration of RA in silicon and aluminium containing TRIP steels was found to be slightly higher than the T0 carbon concentration calculated from a thermodynamic database.
Despite the continuous heating and cooling thermal cycles involved in a welding process, a significant amount of RA (5–11%) is found in the HAZ and FZ.
The regions in the HAZ that attain peak temperatures below Ac1 but above ∼290°C contain <1% RA. Regions in the HAZ where the peak temperatures during welding reach the intercritical (α+γ) temperature region contain higher amounts of RA after welding (up to 11%) compared with other regions in the HAZ.
The hardness variation across the width of welded TRIP steels correlates to the RA variation in the weld zone. A reduction in hardness is found at the positions where the RA is decomposed due to the weld thermal cycle.
The formation of non-metallic inclusions in the FZ and the partitioning of aluminium and subsequent stabilisation of δ-ferrite in the fusion boundaries influence the stabilisation behaviour of the RA in the FZ and HAZ.