
Abstract
For ultrasonic spot welds between sheets of 0·8 mm thick hot dip galvanised mild steel and 1·6 mm thick AZ31B-H24, two Mg–Zn interface reaction layers, totalling around 22 μm in thickness, formed in 0·3 s, replacing the original 9 μm thick galvanised coating on the steel. The layer contacting AZ31 had composition near 25 at-%Zn. The second layer, contacting the steel, had composition near 66 at-%Zn. Mg–Zn alloying formed liquid phases during welding that were progressively squeezed from the joints until they were no longer evident at 1·0 s welding time. At that point a less than 500 nm thick layer of Al5Fe2 was identified by electron diffraction and microchemical analysis at the AZ31/steel interfaces. For welding times greater than about 0·5 s lap shear failures propagated through the AZ31 near the welded interfaces. This indicated that the strength of the AZ31–mild steel bonds was greater than that of the AZ31 near the welded interfaces.
Introduction
A natural candidate for making high strength Mg alloy–steel joints is welding, but both fusion and solid state welding of this combination of alloys is complicated by several factors. The first of these is related to the exceedingly small mutual solubilities of Mg and Fe,1 the dominant element in steels. Because the solubilities are so low, the uncertainties in exact solubility limits are relatively high, but below about 900°C, only about 0·02 wt-%Mg may dissolve in Fe, and this limit rapidly decreases at lower temperatures. The maximum solubility of Fe in Mg is only ∼0·001 wt-%. This occurs at 640°C and it also decreases with decreasing temperature. These low levels mean that for practical purposes Mg and Fe are insoluble, and that metallurgical bonds cannot be assisted by chemical processes such as mass transport by interdiffusion. Additionally, there are no intermediate phases in the Mg–Fe binary system1 that would permit chemical reactions to aid in bonding. Another factor especially important for fusion welding processes is that the boiling point of Mg is 1107°C.2 This is ∼400°C lower than the melting temperatures of typical automotive sheet steels which are in the vicinity of 1500°C. Melting Mg and steel together as might be done in resistance spot welding would vaporise Mg creating unacceptable porosity in weld nuggets. Lastly, the difference in melting temperatures, 650°C for Mg compared to 1532°C for Fe, is largely responsible for a wide difference in deformation behaviour that will complicate certain solid state processes. Moderately elevated temperatures of a few 100°C locate Mg alloys in their hot working range. Typically, 0·6 TMP (absolute) is where thermally activated processes in metals become important to how they deform, and where strengths decrease significantly and ductilities increase. 3 3,4 Magnesium alloys may deform very easily at temperatures of 200–500°C; 2 2,5 however, in the same range, the yield strengths of steels will be high relative to their room temperature levels.6 This will be an important factor in how well Mg alloys can be welded to steels by processes that depend on a degree of mechanical interlocking.
In a previous study, it was shown that ultrasonic welding was effective for spot welding the Mg alloy AZ31 to a hot dip galvanised (HDG) mild steel.7 Lap shear strengths up to 4·2 kN were obtained at welding times up to 1·2 s. The Zn coating was alloyed with the AZ31 forming liquid phases that were squeezed from the weld regions. Nevertheless, the Zn was essential to strong bonding. Some details related to reactions between the Zn coating and the AZ31, and the microstructure after liquids are expelled from weld joints are examined more closely in the work presented here.
Experimental details
The materials used for these experiments were sheets of 0·8 mm thick HDG mild steel and 1·6 mm thick AZ31B-H24. Analysed compositions were:
Mild steel: <0·01C–<0·01Si–0·07Mn–0·03Cr–0·050Al–0·062Ti, wt-% with Fe balance
Zinc coating: 0·32Al–0·45Fe, wt-% with Zn balance
AZ31B: 3·36Al–0·50Mn–1·02Zn, wt-% with Mg balance
The zinc coating on the steel was about 9 μm thick. Consistent with its H24 temper, the AZ31 consisted of a deformed structure including many twins.
Ultrasonic spot welds were made between these two alloys using a 7×7 mm sonotrode tip as previously described.7 Selected specimens were examined by optical and scanning electron microscopy using established preparation techniques. Also, one electron transparent specimen was made to examine by transmission electron microscopy the AZ31/steel interface of a spot weld made at welding time of 1·0 s. That specimen was made with an FEI Nova 600 Nanolab DualBeam focused ion beam/SEM.
Results
For reference purposes the results from previous lap shear tests7 are presented as Fig. 1. Lap shear maximum loads increased from around 0·5 kN to near 2·9 kN as the welding times increased from 0·2–0·4 s. Afterwards, maximum loads continued increasing to the range of 4·2 kN at welding time of 1·2 s. To highlight the excellent strength of the AZ31–steel ultrasonic spot welds, Fig. 1 also indicates the range of lap shear strengths measured for resistance spot welds between AZ318 where the nominal weld area was in the range of those for the ultrasonic spot welds.
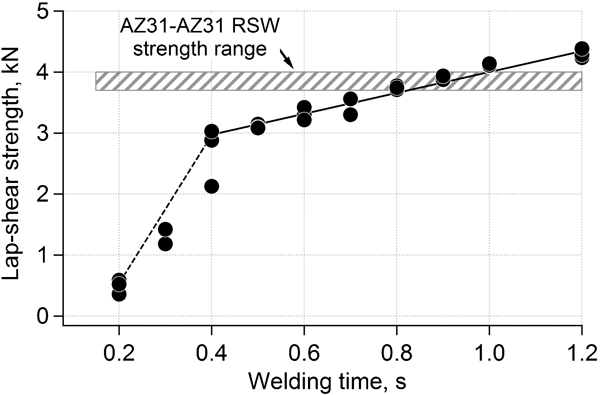
Variation of lap shear strength (maximum failure load) with welding time7
Fractography
Representative AZ31 sides of fractured lap shear specimens are shown in Fig. 2. Features at the top of the weld spot in Fig. 2a indicate that even at 0·5 s some liquid phases were forced out of the weld interface region. By 0·6 s of welding time, Fig. 2b, liquid expulsion was obvious, and near-surface fracturing of the AZ31 occurred indicating that relatively strong bonds were being formed between the AZ31 and the HDG mild steel. As welding time increased to 1·0 s the apparent bonded area increased (Fig. 2c). Evidence of liquid expulsion was also visible on the 1·0 s fracture surfaces, and a small complete pull-out of the AZ31 occurred.
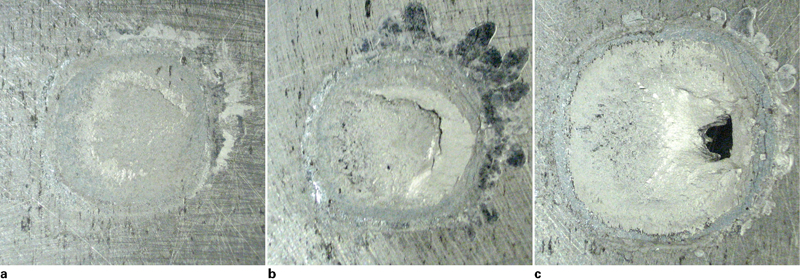
Photographs of AZ31 sides of broken lap shear specimens made at a 0·5 s, b 0·6 s and c 1·0 s
The fracture areas were measured for one set of welds and used to calculate failure stresses using maximum loads shown in Fig. 1. These results, plotted as Fig. 3, confirm the increase in planar bond area with welding time. In contrast to the maximum loads of Fig. 1, stress values decreased with welding time. This result suggested that the intrinsic bond strength decreased with welding time, presumably associated with microstructure evolution near the bonded interfaces.
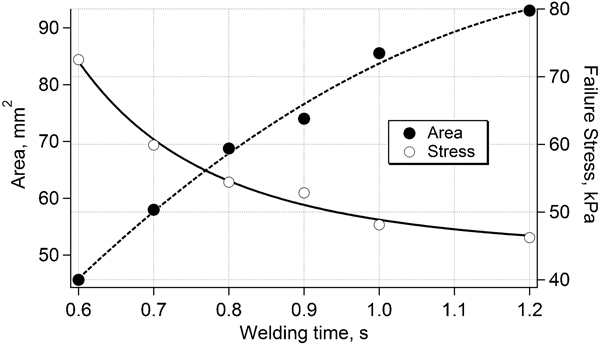
Variations of planar bonded area and failure stress with welding time
Fracture paths through the AZ31 near the interface were typical of the lap shear tests, raising the possibility that the decrease in intrinsic bond strength shown in Fig. 3 resulted from strength reduction due to recrystallisation and grain growth in the AZ31.7 Additional insight into the fracture behaviour came from hardness testing on the cross-sectioned specimen of the 1·0 s weld presented in Fig. 4. Beginning near the weld centre with an indenter load of 50 g, a 0·1 mm grid of indents was made extending for a total length of 9 mm and ending well outside of the weld zone. The associated plot shows the average hardness for each column of 10–12 measurements. Outside of the weld zone the hardness is in the range of 590 MPa, but in the weld zone where the AZ31 was recrystallised the hardness decreased about 11% to the range of 525 MPa. As the extent of recrystallisation and grain growth proceeded with welding time,7 it is reasonable to expect that hardness, and consequently strength, of the AZ31 in the weld zone continuously decreased. The weakened region of the weld zone would then be a preferred path for propagation of failure. This would contribute to, if not explain, the decrease in failure stress with welding time shown in Fig. 3.
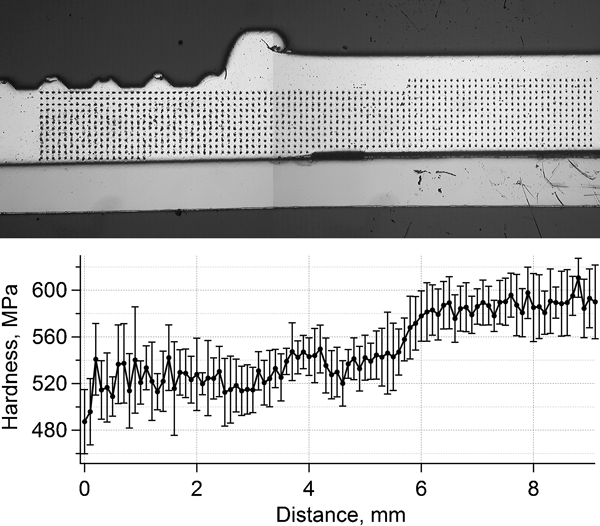
Cross-section view of 1·0 s weld (top) and average Vickers hardness with horizontal position starting at weld centre (bottom)
Weld microstructures
At short welding times two reaction layers formed at the interface between the AZ31 and the Zn coating on the steel.7 Details of the two interface layers in the 0·3 s weld are shown in Fig. 5, an SEM back scattered electron image. As previously shown the combined thickness of the layers was about 22 μm, more than twice the 9 μm thickness of the original Zn coating, and both appeared multiphased with relatively uniform microstructures. The thinner layer in contact with the AZ31, L1 in Fig. 5, was comprised of three constituents. The lightest material appeared as grains of a single phase implying its Zn concentration was elevated relative to the AZ31. The darker matrix had a very fine lamellar structure not resolved in Fig. 5. The large black oblong feature at the L1/L2 interface is a pore, but the smaller black features were associated with a phase having the same approximate contrast as the AZ31 implying they were Mg rich. Limits of spatial resolution prevented conclusive chemical analysis of individual features in layer L1, but the overall composition of the layer, as determined by energy dispersive spectroscopy, averaged 25·5 at-%Zn with a balance of mainly Mg. Ignoring the small amount of Al and other trace elements, this composition is in the vicinity of a Mg–Zn eutectic occurring at 28·1 at-%Zn and 341°C (Fig. 6).9 The thicker layer, L2, was also comprised of at least three constituents, a light skeletal constituent, the darker matrix, and very dark isolated features. The overall composition of layer L2 was 66·3 at-%Zn. This is essentially the composition of MgZn2, but the layer most likely was a mixture of Mg–Zn intermetallics and it could have been at least partially melted at a temperature as low as 347°C.1 These observations confirm that substantial interdiffusion between Mg and Zn occurred within 0·3 s with the diffusion zone extending from the AZ31 to the mild steel surface.
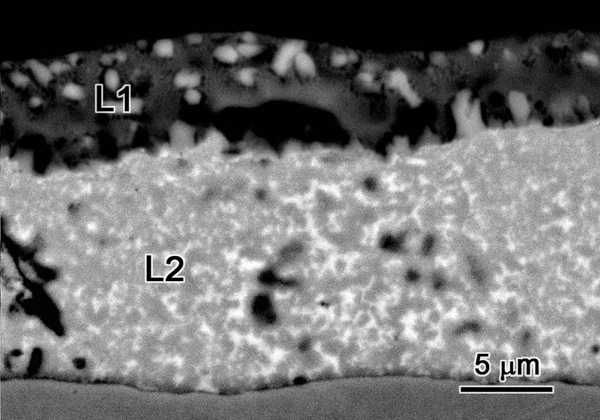
Backscattered electron image (SEM) showing interface layers, L1 and L2, of 0·3 s weld
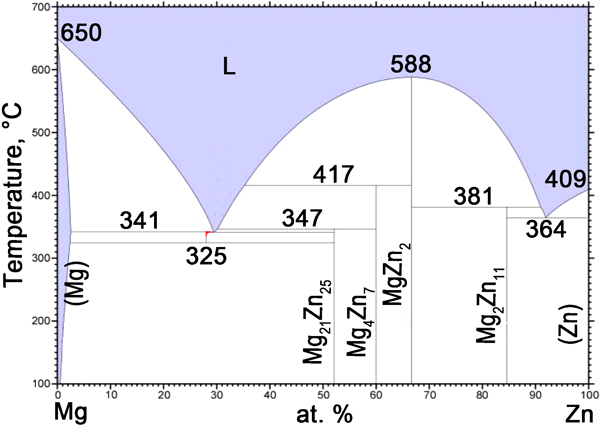
Mg–Zn binary phase diagram9 (ASM International, 2006, diagram no. 904724)
Diffusivity data are not available to fully analyse interdiffusion in an Mg–Zn system. However, using the data of Fujikawa10 and taking the diffusivity of Zn in solid Mg as 2·84×10−15 m2 s−1 at 340°C, results in a diffusion distance of Zn into Mg of (Dt)1/2 = 0·03 μm. It is also reasonable to expect characteristic diffusion distances on this order for Mg transport into Zn. The diffusivity of Zn in liquid Mg was estimated as 1·25×10−9, 11 11,12 which is in the range typical for diffusion in liquid metals. This estimates (Dt)1/2 = 19 μm. These results indicate that interdiffusion distances in an Mg–Zn couple would occur over micrometre-length distances in 0·3 s only if transport occurred in a liquid phase.
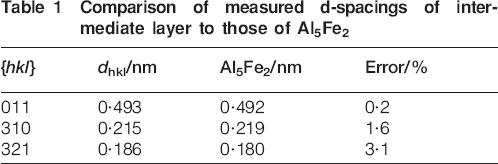
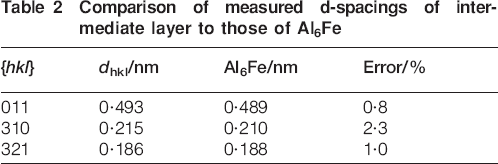
Details about microstructure characterisation of a 1·0 s spot weld are presented in Fig. 7. The SEM image, Fig. 7a, taken approximately in the centre of the cross-sectioned weld confirms there is an intermediate layer between the AZ31 and the steel after liquid phases are expelled from the joint. The layer thickness ranged up to a few 100 nm. Its identity could not be unambiguous determined in the SEM, although microchemical analysis suggested it was Al rich, with no indication of Zn being present. Figure 7b shows a region of the AZ31/steel interface that was masked in preparation for making an electron transparent specimen for TEM analysis. The same region at a later stage of specimen preparation is shown in Fig. 7c. The thinned specimen including the intermediate layer is shown as Fig. 7d. An image of the intermediate layer is shown as the bright field TEM micrograph in Fig. 7e where a line marks the approximate location of the intermediate layer/steel interface. At this stage of examination the AZ31 part of the foil had bent out of the field of view due to its extreme thinness. Numerous electron diffraction patterns were taken of the intermediate layer and one of the indexed patterns is shown in Fig. 7f. The results from Fig. 7f are summarised in Tables 1 and 2 where the d-spacings of the intermediate layer are compared to those of the body-centred-orthorhombic intermetallic phases Al5Fe2 and Al6Fe.13 The measured d-spacings are a close fit to those of both of the Al–Fe intermetallics. Microchemical analyses by energy dispersive spectroscopy in a scanning TEM confirmed that the intermediate layer consisted of Al and Fe. Only trace amounts of Zn could be detected.
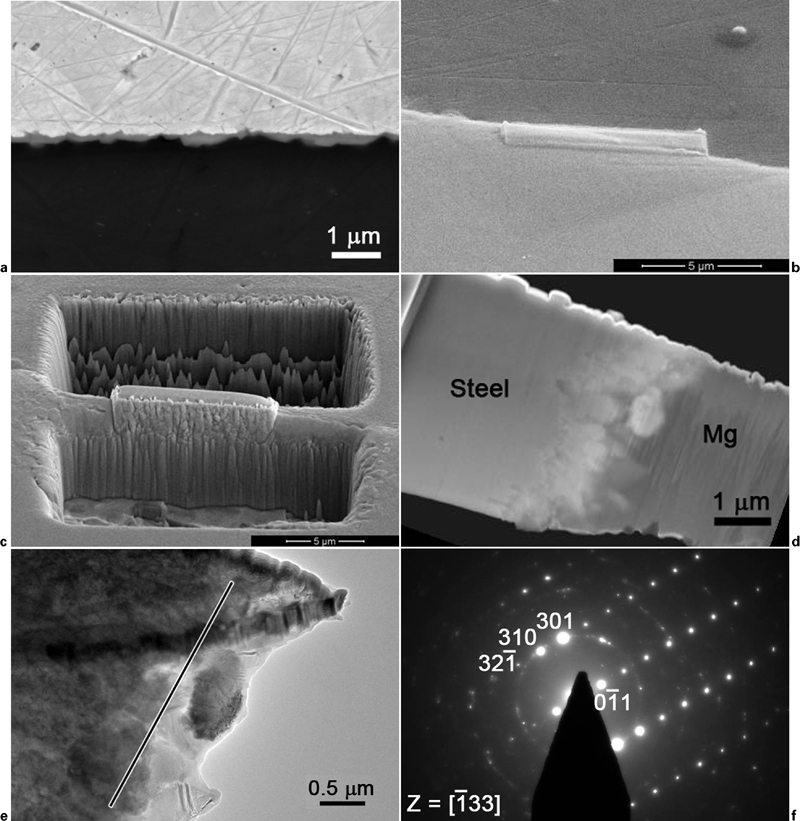
a SEM image showing reaction layer at AZ31/steel interface; b interface region masked for TEM specimen preparation; c TEM specimen preparation nearing completion; d specimen with electron transparent region at AZ31/steel interface; e microstructure at interface; and f example of selected area diffraction pattern from intermediate layer phase
Comparison of measured d-spacings of intermediate layer to those of Al5Fe2
Comparison of measured d-spacings of intermediate layer to those of Al6Fe
Discussion
The liquid metal expulsion from weld areas, found on the fracture surfaces of Fig. 2, is clear evidence that temperatures at AZ31/Zn interfaces were high enough to initiate localised melting in times of at least 0·5 s. A more detailed analysis of joint microstructure formed after welding time of 0·3 s highlighted that a multi-phased reaction layer in contact with the AZ31 had a composition near 25 at-%Zn. This confirmed that the temperature at the AZ31/Zn interface reached at least 340°C, the lowest eutectic temperature in the Mg–Zn binary system. A second reaction layer contacting the mild steel surface was identified with average composition near 66 at-%Zn further suggesting that interface temperatures reached the range of 340–347°C. The fact that two distinct reaction layers were observed for the 0·3 s welding time indicates they were likely only partially melted. The relatively uniform multi-phased microstructures of the two reaction layers indicate that substantial mass transport occurred between the AZ31 and the Zn coating on the steel. Consideration of diffusion distances also suggested that the Mg–Zn layers must have been liquid for Mg to be transported to the steel surface in such short time. Only diffusion in liquid phases could account for the apparent diffusion distances between AZ31 and Zn within the time frame of welding.
Although ultrasonic welding is commonly considered a no-to-low-heat welding process, this belief is not generally true. Localised heating clearly occurs. In the present case, the heat needed to initiate reactions between the AZ31 and the Zn must have been generated by friction associated with the rubbing action produced by the ultrasonic vibration process. Heating could also have been supplemented by the exothermic heat of reaction due to Mg–Zn compound formation.14 Evidence of heating at the interfaces of ultrasonic spot welds is consistent with the findings of other studies. 15 15,16
Measurements of planar fracture areas, Fig. 3, showed that fracture stresses decreased with increasing welding time, implying that the intrinsic strength of bonding between AZ31 and the steel was also decreasing. However, except for the very shortest welding times, less than about 0·4 s, the preferred paths for propagation of failures were through the AZ31 near the welded interfaces. Hardness measurements of a 1·0 s weld showed that the AZ31 was about 11% softer near the welded interfaces relative to base metal hardness levels. The softening was attributed to recrystallisation,7 making the softened regions relatively susceptible to failure. Regardless of exact details of fracture behaviour, the intrinsic strength of bonding between AZ31 and the mild steel was not actually measured. However, the intrinsic bond strength was higher than the AZ31 strength under the conditions tested.
The high strength of spot welds even after Mg–Zn phases were squeezed from the bonded areas led to examining the AZ31/steel interface of a 1·0 s weld in greater detail, Fig. 7. The very thin, up to a few 100 nm thick, layer remaining between the AZ31 and the mild steel was identified as an Al–Fe intermetallic, most likely a remnant of the galvanising process. Aluminium is an important addition to the Zn baths used for galvanising, and very thin intermetallic layers of Al5Fe2 and AlFe3 are commonly found at the Fe/Zn interfaces of galvanised sheet steels. 17 17,18 Those observations and the d-spacing measurement presented in Table 1 suggested that the intermetallic layer was most probably Al5Fe2. The presence of Al6Fe could not be completely ruled out; however, since rapid cooling after welding satisfies the conditions favouring its formation.19 Reactions associated with welding could also influence the relative stabilities of the intermetallic layers, but establishing those details will require further study. Nevertheless, it seems reasonable to conclude that the Al–Fe intermetallic layer is Al5Fe2, and that it is critical to bonding in this system because Al alloys with both Fe and Mg while those elements will not alloy with each other.
The characteristics of the necessity of Zn for strong bonding, reactions of Zn with the AZ31 to form liquid phase, and the occurrence of an Al–Fe intermetallic phase at the AZ31/steel interface are in agreement with the observations of Chen and Nakata on linear friction stir lap welds of AZ31 to zinc coated steel.20
Conclusion
During ultrasonic spot welding, two Mg–Zn layers, totalling 22 μm in thickness, formed in 0·3 s between AZ31 and a hot-dip-galvanised mild steel replacing the original 9 μm thick Zn coating on the steel. The layer in contact with the AZ31 had composition near 25 at-%Zn. The second layer, in contact with the steel, had a composition near 66 at-% Zn. Both layers were multiphased with relatively uniform microstructures. Estimation of diffusion distances supported concluding that both layers must have been at least partially melted since only diffusion in liquid phases could account for the observed extent of mass transport between Mg and Zn in 0·3 s. Liquid expulsion from welds was clearly apparent on fracture surfaces.
For welding times greater than about 0·5 s lap shear failures propagated through the AZ31 near the welded interfaces. This was taken as an indication that the strength of the AZ31/mild steel interfaces was greater than the strength of the AZ31 near the welded interfaces.
For welding time of 1·0 s, Mg–Zn phases were completely squeezed from the spot weld regions. An intermediate layer remained at the AZ31/steel interface and it was identified as Al5Fe2 by electron diffraction and microchemical analysis. Because the strength of the AZ31–steel bonding was high enough to cause lap shear failure to propagate through the AZ31 near the welded interface, strong bonding between the AZ31 and the mild steel was attributed to the presence of the Al5Fe2 intermediate layer.
Footnotes
Acknowledgements
The authors are grateful to W. Zhang for a technical review and helpful comments. This research was sponsored by the US Department of Energy, Office of Energy Efficiency and Renewable Energy, Vehicle Technologies Program, under contract DE-AC05-00OR22725 with UT-Battelle, LLC.