
Abstract
Preoxidised and glass to metal (GtM) sealed austenitic stainless steels displayed a ferritic (bcc) layer near the metal/oxide interface, as determined by electron backscatter diffraction and X-ray diffraction. Through electron probe microanalysis, it was determined that this layer was depleted of alloying elements due to the oxidation and sealing processes. Characterisation of the layer morphology suggested that it formed through the martensite transformation mechanism. Thermochemical modelling with ThermoCalc also supported a martensitic transformation as opposed to diffusional ferrite formation. The composition gradient through the layer was correlated to the Eichelman and Hull empirical relationship for martensite start (Ms) temperatures. Because of Cr, Mn and Si depletion during preoxidation and glass sealing, Ms temperatures near ambient are possible in this surface region. The martensite layer was non-uniform, however, with laths extending deeper into the alloy due to stabilised growth in the material above its Ms temperature. This behaviour was characterised by image analysis techniques and discussed in terms of martensite stability and microstructural effects. Possible negative aspects of bcc phase formation on GtM seal properties are discussed, and analyses of alternative alloys 21-6-9 (tradename Nitronic 40; Armco Holding Corp., West Chester, OH, USA) and 22-13-5 (Nitronic 50) showed reduction or elimination of martensite after GtM joining.
Introduction
An oxidation treatment, also called preoxidation, is often performed before glass/metal joining to provide a transition layer, i.e. a chromium rich oxide in the case of stainless steel, which bonds to both the metal and the glass. In some applications, the necessary oxidation can be achieved during heating to the sealing temperature, thereby eliminating a separate preoxidation step. During preoxidation of austenitic stainless steel, a thin (∼1 μm) layer of oxide containing Cr, Mn and Si is grown on the alloy surface. 1 1,2 The preoxidation treatment is performed in a low pO2 atmosphere to avoid iron oxide formation, which has been found to be detrimental to glass bonding. Detailed discussions of glass/metal sealing and preoxidation can be found elsewhere.3– 6
Depending on the duration and temperature of the preoxidation treatment, the alloy surface may become depleted in the elements that undergo oxidation reaction. This composition change can lead to phase transformations near the alloy surface during high temperature processing or upon cooling.7– 10 The objectives of the present work were to characterise the surface depletion layer in 304L stainless steel and its effects on alloy phase transformations. In particular, a layer with body centred cubic (bcc) crystal structure at the stainless steel surface was investigated. A preliminary analysis of alternative austenitic stainless steels is also presented to reduce or avoid the formation of a surface bcc layer.
Experimental
Several heats of 304L, as well as 21-6-9 (Nitronic 40) and 22-13-5 (Nitronic 50) stainless steels, were characterised after preoxidation at 1000, 1050 and 1095°C for 30–90 min in a low pO2 atmosphere. The samples were also analysed after subsequent glass sealing at 920–970°C in an N2/H2 atmosphere, holding long enough for glass flow and seal formation. Detailed descriptions of the preoxidation and glass joining processes are contained elsewhere. 1 1,2
X-ray diffraction (XRD) was performed to study oxide phase formation and alloy crystal structure before and after high temperature exposure. Sequential high temperature XRD experiments were also conducted to investigate the formation of oxide and alloy phases in situ. In these experiments, the heating rate between test temperatures was 200°C min−1, and the XRD scans at each temperature took ∼2 min. The experiments were performed with the 304L samples attached to a heated XRD stage in a helium atmosphere. The oxygen partial pressure pO2 of the gas was sufficient to oxidise the active elements (Cr, Mn and Si) while avoiding iron oxide formation. In this respect, although the XRD atmosphere was different from usual preoxidation runs, the observed oxide phases demonstrated that sufficient similarity exists between the two oxidation conditions to draw conclusions about the usual preoxidation treatments based on the XRD results.
To prepare for microstructural characterisation and microanalysis, the stainless steel samples were cross-sectioned and polished using standard metallographic techniques. Electron probe microanalysis (EPMA) with wavelength dispersive spectroscopy was performed on a JEOL 8600 EPMA to quantitatively characterise the local alloy composition. The EPMA traces ran from the bulk alloy to the metal surface using 0·5 μm steps. Electron backscatter diffraction (EBSD) was used to analyse the crystal structure in the alloy near the surface after preoxidation and glass sealing treatments. EBSD was performed on a Zeiss Supra 55VP SEM equipped with an Oxford/HKL EBSD system with Channel 5 software. Thermochemical modelling, using ThermoCalc and JMatPro, was employed to determine the likelihood of diffusional versus martensitic phase transformations in the depletion zone. With combined characterisation and modelling, the relationship between chemistry and crystal structure was established. These results were correlated to published empirical equations for martensite start (Ms) temperatures.
Results and discussion
Surface alloy depletion and phase transformation during glass to metal (GtM) seal processing
After preoxidation, a layer of bcc material (ferrite) was observed near the 304L surface, just below the oxide layers. Figure 1 shows the EBSD results after oxidation at 1095°C for 90 min: a non-uniform layer of ferrite is shown, about 3–5 μm thick. Three possible mechanisms were considered for the formation of this layer:
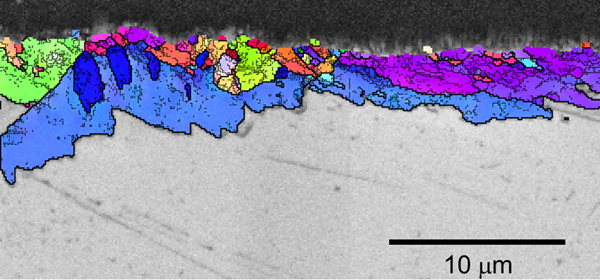
Orientation image (EBSD) of bcc layer near surface of 304L after preoxidation at 1095°C, 90 min
diffusional transformation at high temperature due to alloy depletion of Mn or other elements; depletion of manganese, a γ-austenite stabiliser, is caused by Mn,Cr-oxide spinel formation
diffusional formation of δ-ferrite during cooling
martensitic (γ-austenite to martensite) transformation during cooling.
In mechanism ii, the near surface composition may be such that the alloy passes through a bcc phase field during cooling, rather than movement into the phase field isothermally, as in mechanism i. All three scenarios are influenced by the alloy depletion layer, defined by changes in Cr, Mn and/or Si concentration.
With regard to mechanism i, studies have shown diffusional formation of ferrite layers during oxidation of low Ni stainless steels, Fe–Cr–Mn–Al alloys and other austenitic alloys.7– 10 These surface layers usually display planar interfaces parallel to the alloy surface, typical of a layer formed by bulk diffusion. Ferrite formation at high temperature might be expected in 304L with slight changes in composition, since the nominal composition is close to the austenite/(ferrite+austenite) phase boundary at 1000–1100°C. 11 11,12 The formation of ferrite at high temperature has been shown to influence alloy oxidation since the diffusion rates of elements such as Cr and Si are higher in δ-ferrite than in γ-austenite. 9 9,10 Therefore, it was initially thought that the presence of a bcc layer could be an explanation for the observed differences in oxide morphology among various heats of 304L studied previously. 1 1,2 However, the jagged morphology of the bcc layer (Fig. 1) suggested that it was a product of martensitic reaction on cooling, although this morphological evidence is far from conclusive. Moreover, it seems unlikely that these microstructural features are diffusional Widmanstatten, as Widmanstatten plates typically form as side branches from allotriomorphs that form along prior austenite grain boundaries, none of which was observed here (Fig. 1). As shown below, several other factors were found that ruled out high temperature diffusional transformation as the mechanism for ferrite formation during short term preoxidation.
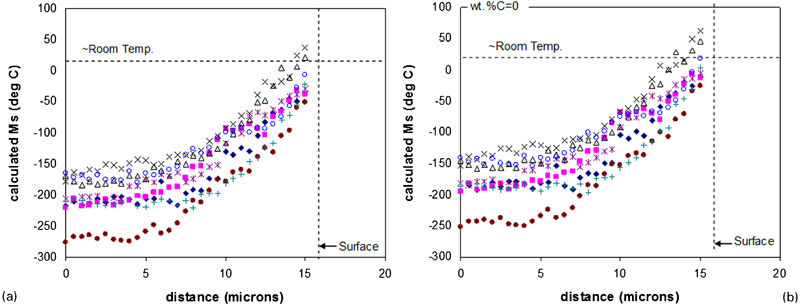
Figure 2 shows other EBSD photomicrographs highlighting the bcc phase (Fig. 2a), the fcc phase (Fig. 2b) and the bcc/fcc orientation relationships (Fig. 2c). Almost the entire bcc/fcc interface corresponds to either the Kurdjumov–Sachs (K-S) or the Nishiyama–Wasserman (N-W) orientation relationships, denoted by either red or blue segments of the interface (Fig. 2c). These relationships between the bcc phase and the parent fcc grains are typically found in martensitic transformations. Like the morphological evidence discussed above, the EBSD analysis in Fig. 2 is not conclusive by itself because these orientation relationships can also be found for diffusional phase transformations as well. Nevertheless, the results are consistent with a martensitic transformation mechanism.
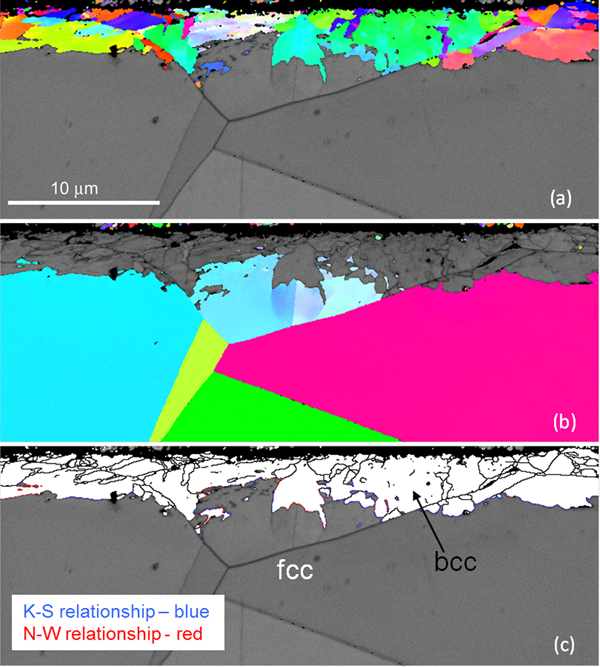
Photomicrographs (EBSD) highlighting a bcc phase, b fcc phase and c bcc/fcc orientation relationships determined by EBSD
XRD was also performed to investigate alloy phase formation related to preoxidation and GtM sealing. Figure 3a shows the XRD spectra from as received 304L samples machined from barstock from several heats. Only γ-austenite peaks are observed, as expected. No evidence for deformation induced ϵ-martensite, a distinct possibility for 304L, was found in any of the as machined samples. Therefore, the surface bcc layers shown in Figure 1 Figs. 1 and 2 were not caused by machining deformation. Figure 3b displays the XRD spectra from two 304L heats after oxidation at 1000, 1050 and 1095°C. Peaks from several oxide phases are identified, including Cr2O3, MnCr2O4 spinel and SiO2 quartz. The oxide phase identifications are consistent with previous results obtained by SEM, TEM and spectrum imaging. 1 1,2 The relatively weak quartz peak in some spectra and its absence in other spectra suggest that SiO2 may be present in crystalline quartz form and/or as amorphous silica.13– 15 The presence of ferrite/martensite peaks in some samples after oxidation confirms the EBSD results shown above. However, there are difficulties in using the XRD data in Fig. 3 to distinguish between ferrite and martensite in this alloy due to the low amount of carbon present, i.e. low degree of tetragonal distortion of the bcc lattice.
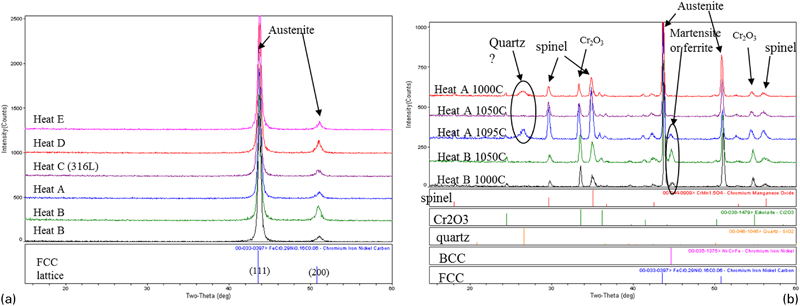
X-ray diffraction patterns a from as machined 304L samples before oxidation experiments and b obtained after preoxidation at 1000, 1050 and 1095°C for two heats
Determining the processing stage at which ferrite appears can be helpful in attempting to distinguish between diffusional ferrite and a martensite transformation. The results from high temperature sequential XRD scans (Fig. 4) show that bcc layer formation does not occur at the preoxidation or sealing temperatures, but rather at some point during cooling (mechanism ii or iii above). Figure 4a shows the results from one heat of 304L for in situ XRD experiments from room temperature to 1000°C, with a 30 min hold at 1000°C. Cr2O3 formation is detected at 700°C, and MnCr2O4 spinel is detected at ∼900°C. Note that the shift in the fcc peak is due to thermal expansion effects, and the Pt peak is an artefact from the XRD system. No bcc peaks were found during high temperature exposure. Similar results were obtained for a 2nd heat as well, not shown here. Another set of XRD experiments was performed with an isothermal hold for 30 min at 1000°C followed by rapid cooling to room temperature (Fig. 4b). The XRD peaks at high temperature were similar to those shown in Fig. 4a, i.e. oxide phases and fcc austenite. Upon cooling to room temperature, a large bcc/martensite peak was observed. The XRD results in Figure 3 Figs. 3 and 4 clearly show that when bcc formation occurs, it does so during cooling and not at elevated temperature. However, based on the present XRD results, it is not possible to definitively determine the mechanism (either ii or iii, discussed above) of bcc formation because the temperature of onset is not known.
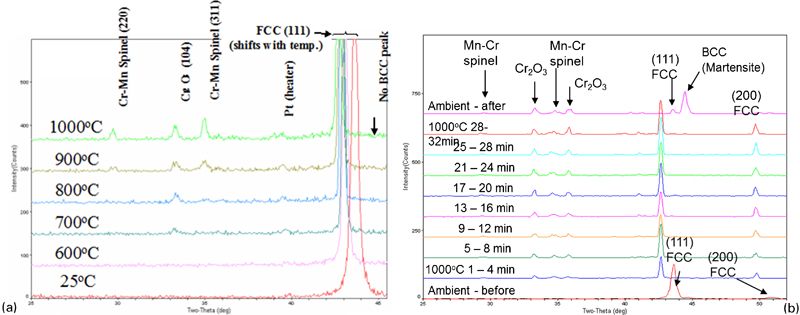
Sequential XRD results a from heating experiment and isothermal hold at 1000°C and b for 30 min at 1000°C followed by rapid cool to room temperature
It is important to distinguish between the two transformation mechanisms because a martensitic reaction is likely to be more detrimental to glass/metal adhesion. A martensitic reaction produces more transformation stresses than diffusional ferrite formation due to its rapid growth rate and its low onset temperature, i.e. below the glass transition temperature Tg, where the glass is rigid and susceptible to cracking. The volume expansion accompanying the fcc to bcc transformation and the associated high stresses were studied by Knorovsky and co-workers.16 The formation of a bcc surface layer also reduces the local coefficient of thermal expansion (CTE) of the stainless steel and may decrease the magnitude of compression imparted in a ‘compression type’ GtM seal.16
Thermochemical modelling with ThermoCalc17 suggests that a martensitic transformation is a more likely scenario than diffusional ferrite formation on cooling. Figure 5a shows the calculated phase fields for 304L as a function of Cr concentration. As Cr changes along the x axis, the Ni concentration changes in the opposite direction, with the combined weight percentages of Cr plus Ni equal to 28%, this is approximately the nominal Ni+Cr level of 304L. The other elements were held constant at their nominal values for 304L. This type of diagram is often used for studying high temperature phase transformations, such as solidification during welding, in austenitic stainless steels. 11 11,12 To determine if alloy depletion might cause differences in phase transformation behaviour, the diagram was first constructed with nominal Mn and Si levels. Figure 5b shows the calculated changes in the γ/γ+δ phase boundary due to minor changes in Mn and Si, commensurate with the alloy depletion observed during preoxidation (Fig. 6). For the various combinations of Mn and Si, the phase boundary does not shift appreciably. This suggests that changes in Mn and Si would not likely cause ferrite formation at high temperature. The effects of Cr depletion can be taken directly from the diagram. Chromium depletion from 18 to 12 wt-% near the alloy surface would move the nominal composition away from the bcc phase field, suggesting that bcc formation is less likely in the depletion region at 1000–1100°C.
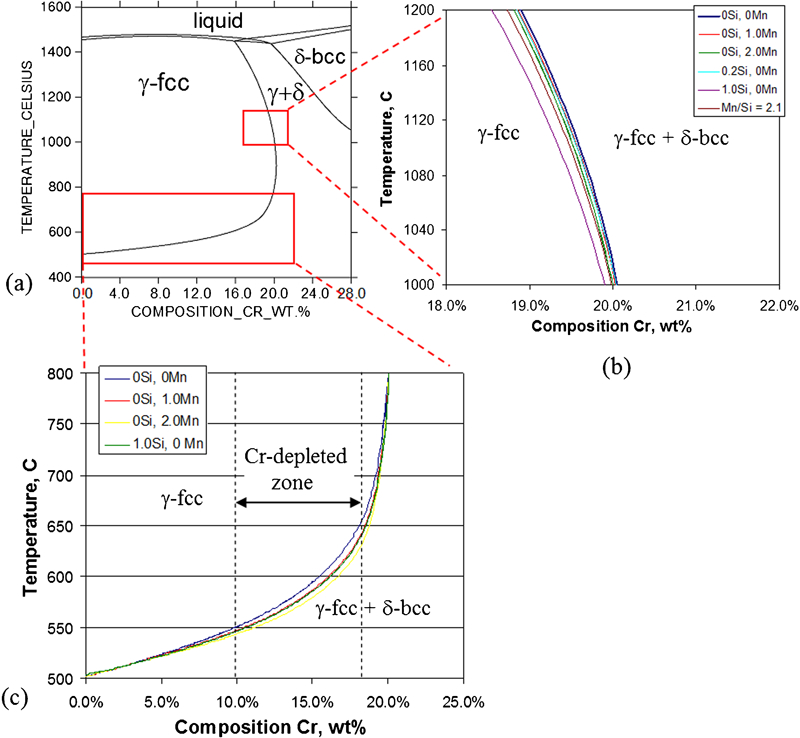
a ThermoCalc phase stability diagram for 304L stainless steel, b locations of fcc/fcc+bcc phase boundary at 1000–1200°C for different levels of Mn and Si, and c locations of fcc/fcc+ bcc phase boundary at low temperatures (500–800°C)
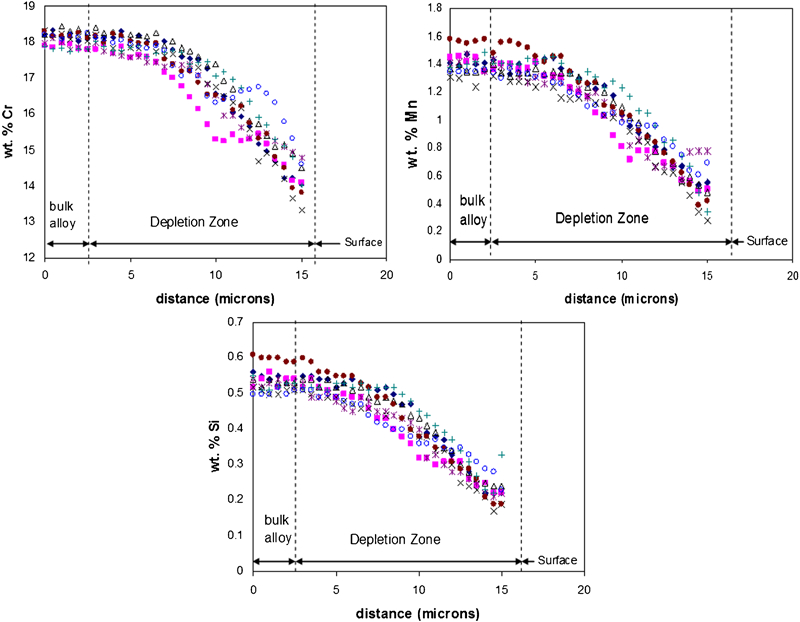
Results (EPMA) showing depletion of Cr, Mn and Si near oxidised 304L surface after preoxidation at 1050°C, 90 min: eight EPMA traces were performed at different locations along oxidised sample surface
Similarly, Fig. 5c shows the location of the γ/γ+δ phase boundary at lower temperatures. In this temperature range, all compositions, including the bulk 304L interior, pass through the fcc/bcc transition. This fcc ‘gamma loop’ is typical for equilibrium type diagrams of austenitic stainless steels. However, 304L does not form bcc ferrite on cooling. This is because, although it is thermodynamically stable, the temperature at which bcc becomes stable (about 500–600°C) does not provide sufficiently fast kinetics for the long range diffusion needed for diffusional ferrite formation. The shape of the phase boundary shows that, if diffusional bcc ferrite does not form in bulk 304L with about 18–19%Cr and fcc/bcc transition temperature of about 625–650°C, its formation in a Cr depleted layer at lower temperatures will be even less likely.
EPMA results and correlations to calculated martensite start (Ms) temperatures
Based on the preceding analyses, the bcc layer formation was determined to be a martensitic reaction during cooling, similar to the reactions found by some other researchers. 9 16 9,16,18 A martensitic reaction, often characterised as ‘diffusionless’, can occur at much lower temperatures than diffusional ferrite formation. In general, the martensite start (Ms) temperature and the effects of composition on Ms can be viewed as indicators of the likelihood of martensite formation. During preoxidation and GtM seal processing, high Ms temperatures (above room temperature) suggest that martensite formation can occur if the cooling rates are fast enough to suppress competing diffusional mechanisms. These effects were investigated by EPMA in the depletion zone and correlations of chemistry to empirical Ms equations.
Figure 6 presents examples of EPMA traces from the interior to the surface of 304L after preoxidation at 1050°C. For ease of interpretation, only data from the elements Cr, Mn and Si are shown. Several replicate EPMA traces were performed on each sample to confirm the microanalysis trends. It is clear that significant depletion of these elements occurs due to diffusion and surface oxide formation. For example, the Cr concentration drops from 18 wt-% in the bulk to ∼14 wt-% near the surface. Slightly more severe alloy depletion was found for oxidation at 1095°C (not shown) owing to the thicker oxide layer that forms at that temperature. The accuracy of the EPMA results is supported by comparison of the bulk concentrations in Fig. 6 with the bulk chemistry of this heat, found by wet chemical analysis to be 18·5 wt-%Cr, 1·32 wt-%Mn and 0·53 wt-%Si.
The depletion profiles indicate that the presence of ferrite is related to the local chemistry variation near the surface. The onset of alloy depletion occurs at a depth of about 8–10 μm, and the depth of ferrite formation is only about 3–5 μm ( Figure 1 Figs. 1 and 2), so decreases on the order of 4% in Cr, 1% in Mn and 0·3% in Si are required to form the bcc phase. In addition, the EPMA traces in Figure 6 Figs. 6 and 7 support a martensite transformation mechanism since there is no ‘step’ in composition between austenite and ferrite. Surface bcc layers formed by diffusional transformation typically show a discontinuity in composition across the interface, corresponding to the different phase diagram compositions of α and γ.7– 10 It should be noted that martensite was unexpected since the usual Ms temperature for 304L stainless steel is in the order of −250°C. Referring to Fig. 6, the chemistry near the surface is analogous to an alloy such as PH13-8 Mo stainless steel (albeit with lower Mo content), which exhibits an Ms near room temperature.
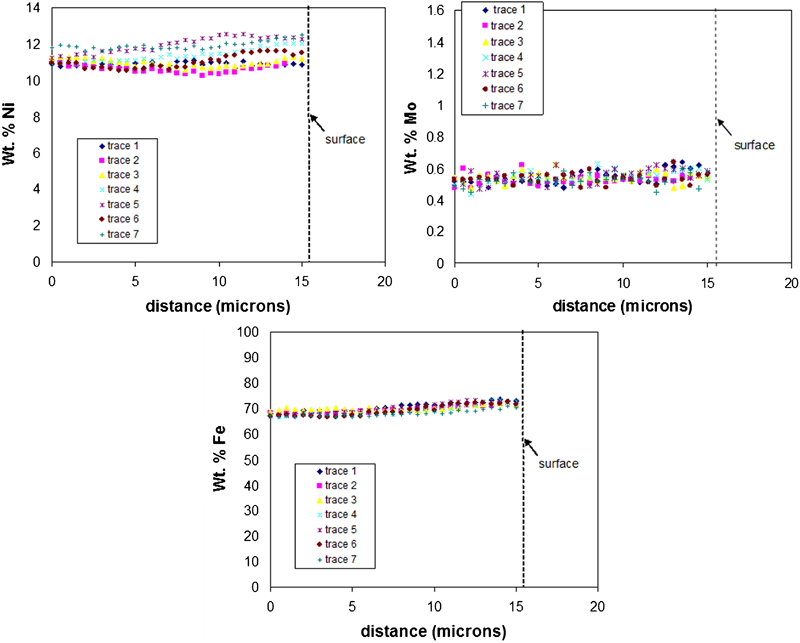
Results (EPMA) for Ni, Mo and Fe (elements not undergoing oxidation reaction at surface): sample was oxidised at 1095°C for 30 min
It is important to discuss a unique aspect of this type of oxidation. Since the low pO2 atmosphere does not allow Fe oxide formation, no depletion of Fe occurs in the metal near the surface (Fig. 7). The EPMA analyses confirmed that the Fe, as well as Ni and Mo, concentrations are locally flat or slightly increasing. The slight increase is due to the offsetting effect of the depletion of other elements. Under more typical oxidation conditions, e.g. in air, oxidation and surface depletion of Fe would occur, resulting in a different metal surface chemistry than that shown here. Therefore, for applications in air or other atmospheres, the surface alloy chemistry may not favour the formation of ferrite/martensite. As such, martensite formation is not usually encountered in high temperature 304L oxidation.
The EPMA results were used as inputs to empirical Ms temperature calculations found in the literature. Figure 8 shows several attempts at correlating the local composition near the surface to various Ms equations for stainless steel and low alloy steels. For the empirical formulae developed for low alloy steels, none of the calculated Ms temperature plots gave satisfactory results. For several of the Ms equations, the bulk alloy Ms temperature was not representative of 304L. The equations of Self et al. and Payson and Savage did show reasonable Ms values for bulk 304L, but the depletion layer Ms temperatures did not sensibly correlate with the observations in the present work. The wide discrepancies observed here are likely due to the alloy specific nature of the empirical equations for Ms. Each equation is only valid for a specific composition range, leading to significant variations in calculated Ms temperatures for other alloys.19
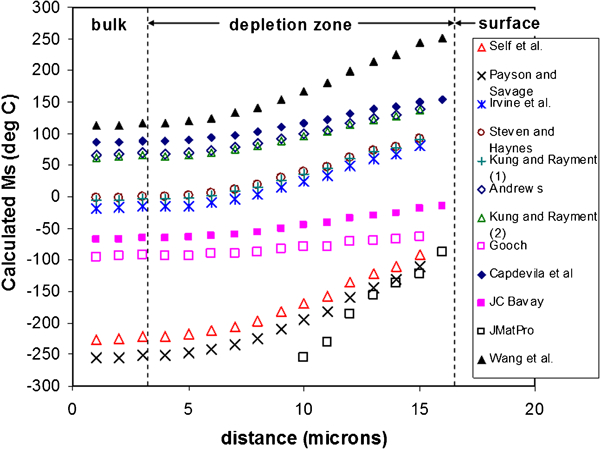
Martensite start calculations were also performed using commercial JMatPro software,23 as shown in Fig. 8. JMatPro includes kinetics as well as thermodynamics in its calculations and can be used to study phase transformations not shown on an equilibrium diagram, such as the martensitic reaction. For compositions near that of bulk 304L, JMatPro does not produce an answer, indicating calculated Ms temperatures below −273°C. Within the depletion zone, JMatPro calculations exhibit a steep gradient in Ms temperature, but the values were still well below room temperature. Unlike other empirical equations, the JMatPro results suggest that more non-linearity is present in its underlying Ms calculations and in the resultant relationship between Ms and the depletion zone chemistry.
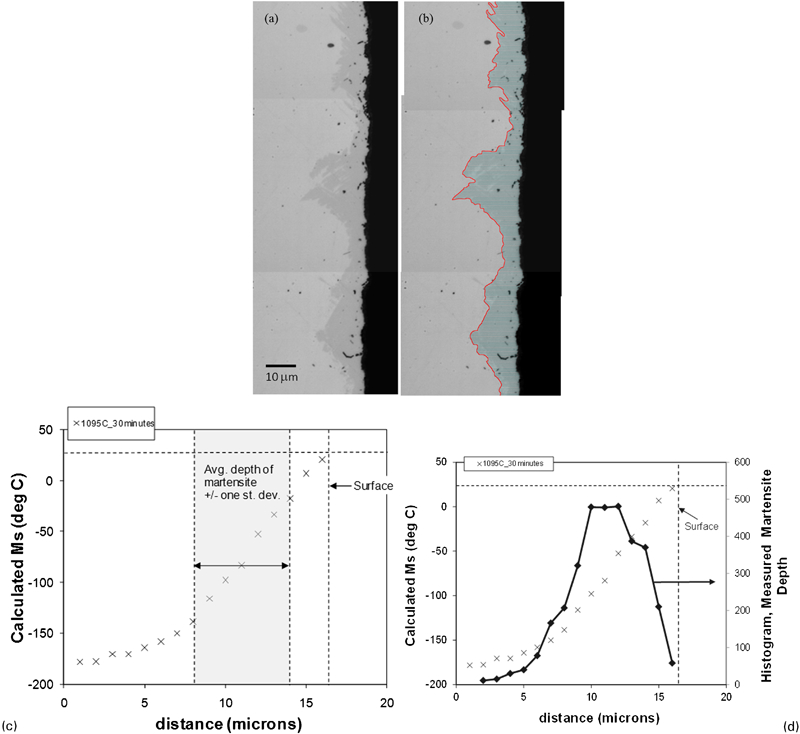
In contrast to low alloy steels, fewer Ms equations are available for high Cr austenitic stainless steels. The best approximation for Ms was from the work by Eichelman and Hull,24 in which higher Cr alloys were investigated (up to ∼18 wt-%Cr). The Eichelman and Hull equation for Ms (in °F) is given as follows
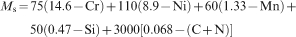
a Ms temperatures calculated from several EPMA traces using Eichelman and Hull equation (1) (EPMA input data from heat B, 1050°C, 90 min, Fig. 6) and b calculated Ms temperatures assuming wt-% carbon = 0
It is important to consider the very strong effect of carbon (and nitrogen) on the Ms temperature in equation (1) as well as the other Ms equations. Even though the overall effect is minor in these alloys due to their low carbon content, the influence of carbon was also investigated for completeness in Fig. 9b (the bulk carbon concentration was used in Fig. 9a). Local carbon concentration is difficult to measure with EPMA, especially when the overall carbon concentration is low. Significant decarburisation likely occurs during high temperature oxidation. Simple diffusion calculations suggest that carbon depletion would occur to a depth of several hundred micrometres after 30 min at 1000–1100°C.25 Thus, it is likely that the carbon concentration in the alloy depletion zone, only the outer 15 μm, essentially approaches zero. The equation (1) Ms calculation was repeated assuming a carbon concentration of zero, and the results (Fig. 9b) show a slight increase in the effective Ms temperatures attained near the alloy surface.
Note also that the EBSD and EPMA analyses were performed after preoxidation treatments (1000–1095°C, 30–90 min). Other EBSD work confirmed that the ferrite layer remains after glass sealing as well. It is assumed that the lower temperature exposure about 920–970°C for shorter time does not appreciably alter the depletion layer or the development of the ferrite layer on subsequent cooling. For the ThermoCalc modelling and Ms correlations, it was also assumed that the depletion layer chemistry would not be altered significantly because of glass sealing treatment.
Non-uniform martensite morphology (stabilised growth)
The martensite layer has a jagged morphology and non-uniform thickness, as shown in Figure 1 Figs. 1 and 2. This is shown more distinctly in the photomicrographs in Fig. 10. The martensite nucleates at or near the surface, and then some laths are able to grow deeper into the alloy depletion zone. While martensite formation near the surface is consistent with the calculated Ms values, microstructural features can also affect the details of martensite growth. Some martensite laths penetrate deeper along austenite grain boundaries, twin boundaries and grain boundary oxidation regions ( Figure 1 Figure 2 Figs. 1, 2 and 10). The preferred growth also depends on the crystallographic orientation of the martensite with respect to the parent austenite grain. This is the case in Fig. 10a, where martensite has grown deeper in one austenite grain (left side of the grain boundary) compared to the adjacent austenite grain (right side of the grain boundary). Alternatively, microstructural features such as grain boundaries can also act as barriers to further martensite growth, as in Fig. 10b for example, where a martensite lath has stopped growing at an austenite grain boundary. Regardless, in all of these instances, it appears that stabilised growth of martensite has occurred with respect to the local chemistry. That is, the martensite once nucleated near the surface is able to grow into regions where the composition remained above its Ms temperature. This must be true if one considers that the depletion zone chemistry is more or less uniform everywhere in the sample; consistent EPMA profiles were obtained at many sample locations (Fig. 6). Stabilised growth is possible only if the temperature is below T0, the temperature at which both fcc and bcc are equally stable (equal thermodynamic free energies).26 Typical T0 temperatures for steels are ∼200° above the Ms temperature.
Maps (SEM/EBSD) with non-uniform bcc surface layers
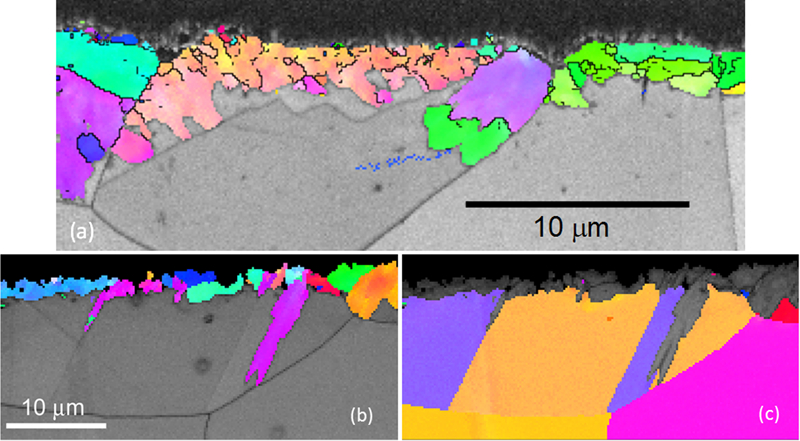
The observation of stabilised growth in athermal as well as isothermal martensite has led to the concept of the Mg temperature, i.e. the temperature at which martensite growth is possible if it has already nucleated. 27 27,28 In the present work, Mg is assumed to be room temperature (∼25°C). The difference between Mg and MS can be determined more quantitatively using image analysis. Two approaches were taken: (1) measurement of the depth of martensite into the alloy at several locations and (2) determination of the percentage of martensite as a function of depth. Both of these methods help quantify the extent to which martensite was able to grow into compositions with calculated MS values well below room temperature. The results from method i are given in Fig. 11. Figure 11a shows an optical microscopy photomicrograph obtained with Nomarski differential interference contrast (DIC) to highlight the martensite layer (other techniques were attempted, such as chemical etchants, but none were able to delineate the martensite layer as well as DIC imaging of an as polished sample). The same jagged morphology is exhibited as that found with SEM/EBSD. Figure 11b displays the same photomicrograph after image processing to threshold the layer and apply a set of measurement lines. The procedure was performed on a montage of 25 photomicrographs along the surface of the sample. It should be noted that the maximum depth of martensite is not necessarily observed in all areas due to cross-sectioning effects. However, in lieu of serial sectioning, analysing a long length of the surface should tend to minimise the errors associated with sectioning, i.e. some cross-sectioned laths will inevitably be close to their maximum depth. The examination of many photomicrographs also allows for statistically significant thickness measurements; ∼3000 individual measurements were taken using the gridline method. The results are exhibited in Fig. 11c and d. In Fig. 11c, the average depth of martensite is superimposed on the average calculated Ms temperatures from the Eichelman and Hull equation for the compositions from several EPMA traces. While there is uncertainty in the Ms equation, the results confirm that the overall depth of martensite extends well into the material with Ms temperatures below room temperature. Alternatively, a histogram of martensite depth can also be displayed as in Fig. 11d. Again, the measured depths of martensite correspond to Ms values well below the experimental condition (room temperature).
a, b Nomarski DIC optical photomicrographs before and after image processing to highlight martensite near surface, and c, d measured depths of martensite compiled from 25 photomicrographs, superimposed on calculated Ms temperatures
The second image analysis method employs a set of lines parallel to the surface, as shown in Fig. 12. With this technique, the linear percentage of martensite can be determined as a function of depth. Figure 1 Figure 2 Figures 1, 2 and 10 show that only the outer few micrometres near the surface are 100% martensite. Deeper below the surface, the fraction martensite can be determined by image analysis. Figure 12a displays a photomicrograph after thresholding the bcc phase and adding a set of measurement lines. Along each line, the linear percentage of martensite was determined. This procedure was applied to four different photomicrographs, and Fig. 12b displays an example of the % martensite results superimposed on the average calculated Ms temperatures for a set of EPMA traces. Again, only the outer few micrometres near the surface contain 100% martensite, consistent with the calculated Ms temperatures near room temperature. Note that this technique is more difficult than method i because the surface is not perfectly flat. A gridline must be chosen as ‘the surface’, and then the first few micrometres are assigned 100% martensite even if they are broken up due to the irregular surface profile.
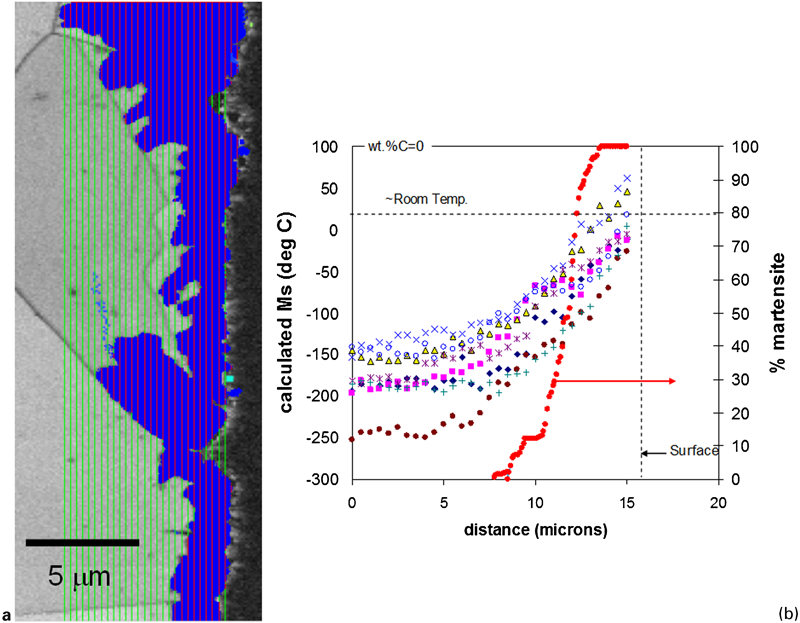
a bcc phase threshold of EBSD image with measurement lines used to determine % martensite as function of depth from surface and b quantitative image analysis results for % martensite superimposed on calculated Ms temperatures for set of EPMA profiles
It is tempting to discuss these results in terms of both martensite start (Ms) and martensite finish (Mf) temperatures. This is common practice in samples of uniform composition, where the martensite transformation is studied by techniques such as dilatometry. In Fig. 12b, it appears that the outer few micrometres of material has reached both Ms and Mf. The material just below that appears to have only reached its Ms. However, the calculated Ms temperatures from the Eichelman and Hull equation show that the compositions at those depths actually exhibit Ms temperatures well below room temperature. This is direct evidence that the deeper martensite intrusions represent stabilised martensite that continued to grow, not simply a transition from Ms through Mf. In effect, it is difficult to discuss Ms and Mf temperatures in quantitative detail within a concentration gradient, especially a steep gradient like the one found here. Each specific location in the concentration gradient will have its own Ms and Mf, and the stabilised growth of martensite must be considered.
Based on the image analysis results in Figure 11 Figs. 11 and 12, the average depth of martensite was 6±3 μm. This corresponds to martensite growth stabilised at an average of 108° above Ms (range of 43–164° above Ms for ±1 standard deviation). For sure, there are many uncertainties associated with this determination; the Ms equation uncertainty, experimental scatter in the EPMA data, etc. However, the results do suggest a relatively large Mg–Ms on the order of 100°C. This value falls within the range found by other researchers for Fe–Ni26 as well as Fe–Ni–Mn alloys.29 Knorovsky26 found Mg–Ms of ∼76 K, and Cech and Hollomon29 determined Mg–Ms in the range of 120 K. Those studies, as well as the present work, involved martensite formed at relatively low temperatures. In other research, Borgenstam et al. 27 27,28 analysed plate martensite in Fe–C alloys, and a relatively small Mg–Ms was found, in the range of only about 3–15 K. This result indicated that the thermodynamic driving forces for martensite nucleation and martensite growth may be of similar magnitudes. This may still be the case in the Fe–Ni–Cr alloys, under consideration here, because as one moves closer to absolute zero, a large difference in temperature does not necessarily imply a large difference in driving force.
More work is needed to fully understand the phenomenon of stabilised martensite growth in austenitic stainless steel. For example, it may be possible to expose 304L to other preoxidation temperatures for longer times to stimulate martensite growth even deeper into the alloy. A deeper alloy depletion zone would make it easier to perform microchemical analysis as well as accurate measurements of martensite depths.
Analyses of 21-6-9 and 22-13-5 stainless steels
A martensitic reaction and ferrite formation may be detrimental for GtM seal performance for the reasons cited previously. Based on the results of this work, other stainless steels were explored that might reduce or eliminate martensite layer formation. Alloys 21-6-9 (Nitronic 40) and 22-13-5 (Nitronic 50) were studied as candidates for GtM seal applications.28 These higher strength alloys have elevated Mn concentration which allows higher solubility of nitrogen for strengthening. The nominal compositions in wt-% are as follows
21-6-9 (Nitronic 40): 0·08C max, 8·0–10·0Mn, 1·0Si max, 19·0–21·5Cr, 5·5–7·5Ni, 0·06P max, 0·03S max and 0·15–0·40N
22-13-15 (Nitronic 50): 0·06C max, 4·0–6·0Mn, 1·0Si max, 20·5–23·5Cr, 11·5–13·5Ni, 0·04P max, 0·03S max, 1·5–3·0Mo, 0·2–0·4N, 0·1–0·3Nb and 0·1–0·3V.
Several samples of Nitronic 40 and Nitronic 50 were subjected to preoxidation and GtM seal treatments, similar to those used for 304L.30
Instead of actual EPMA traces on these alloys, simulated depletion profiles were constructed. The decreases in concentration of each element were based on the depletion profiles measured in 304L ( Figure 6 Figs. 6 and 7). This was performed by determining the decrease in each element as a function of distance in the depletion zone of 304L. The same decreases for each element, as a function of depth from the surface, were used in the Nitronic alloys (at the surface, ∼4 wt-% depletion in Cr, ∼1 wt-% in Mn and ∼0·3 wt-% in Si). This approach assumes that the amount of each element lost due to diffusion and oxide formation does not depend significantly upon the level of that element in the bulk alloy. From the simulated depletion profiles, plots of Ms versus distance were calculated from the Eichelman and Hull equation. Figure 13 displays the calculated Ms profiles near the alloy surface for the Nitronic and Nitronic 50 heats in this study. The results are compared to a nominal (average) profile from the 304L data presented in Fig. 9. The effect of decarburisation is also shown by ∼40°C shift to higher Ms temperatures. Regardless, the estimated Ms temperatures in Fig. 13 indicate that the martensite transformation is suppressed in the Nitronic alloys. If the nitrogen remains in the alloy during oxidation, even lower Ms values would be obtained than those in Fig. 13. The actual change in nitrogen concentration due to preoxidation, if any, is uncertain, and it was not measured experimentally. In addition, the nitrogen levels in Nitronic alloys are outside the range of those studied by Eichelman and Hull, so nitrogen calculations were not included in Fig. 13. Note that four data points near the bulk composition of Nitronic 40 and all of the calculated Ms temperatures for bulk Nitronic 50 are below −27°C. That is, the calculations indicate that an Ms temperature does not exist for those alloy compositions.
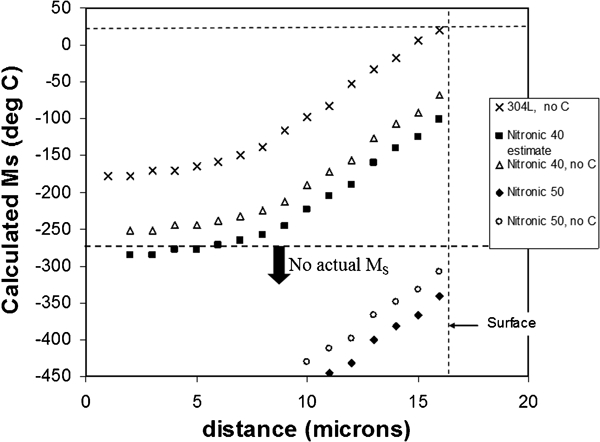
Estimated Ms temperatures for Nitronic alloys based on simulated depletion profiles with and without carbon: calculations did not include nitrogen effects
The SEM and EBSD analyses were performed on Nitronic 40 and 50 samples after preoxidation exposures. Figure 14 shows the SEM/EBSD images of the bcc and fcc regions near the oxidised surfaces. The Nitronic 40 material shows a very thin bcc layer, i.e. on the order of ∼1 μm in thickness. The Nitronic 50 alloy showed no evidence of a bcc layer after preoxidation. The results are consistent with a suppression of the martensite reaction due to lowering of the Ms below room temperature. Further testing of other Nitronic heats will be necessary to confirm this effect. The preliminary results suggest that Nitronic alloys are good candidates for stainless steel GtM seal applications if the formation of martensite is a concern.
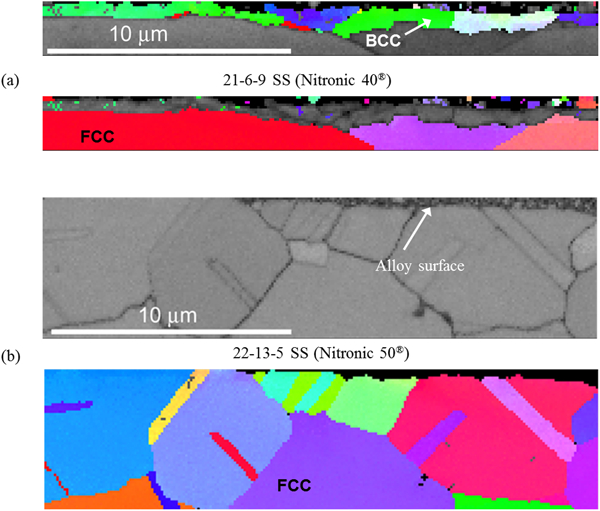
a bcc and fcc EBSD phase maps from 21-6-9 stainless steel and b band contrast image and fcc phase map from EBSD analysis of 22-13-5 stainless steel
Conclusions
Phase transformations in austenitic stainless steels were characterised after preoxidation and GtM sealing experiments. Based on microstructural characterisation, microchemical analysis and correlations to martensite start equations, the following conclusions were drawn:
A layer depleted in Cr, Mn and Si was found at the surface of 304L stainless steel after preoxidation at 1000–1100°C in a low pO2 environment. The depth of the depletion zone is about 10–15 μm for preoxidation at 1050°C for 30–90 min. A layer of bcc material is found within the depletion zone at the alloy surface. The bcc layer is present after both preoxidation and subsequent glass sealing at 920–970°C in a N2/H2 atmosphere.
Significant evidence was found to show that a martensitic phase transformation was responsible for the bcc surface layer. The XRD experiments showed that the bcc layer was only present after cooling to room temperature. The jagged layer morphology, the orientation relationship between the bcc layer and parent fcc grains and the smooth chemistry gradient in the depletion zone were all consistent with a martensitic transformation mechanism. Analyses with commercial thermochemical modelling software also supported a martensitic reaction as opposed to diffusional ferrite formation.
Electron probe microanalysis in the depletion zone was correlated to empirical martensite start Ms equations. For high Cr stainless steels, the Ms equation of Eichelman and Hull produced the best correlation with the observed behaviour. With this correlation, Ms temperatures in the vicinity of room temperature were determined for compositions near the alloy surface.
The martensite layer morphology is non-uniform with laths penetrating deeper into the alloy, especially along grain boundaries and twins in the fcc matrix. The percentage martensite versus depth through the concentration gradient was measured using quantitative image analysis. Correlation to the calculated Ms temperatures showed that the growth of some laths is stabilised into material that remained above its Ms temperature. These deeper lath penetrations show the influence of microstructural features, i.e. grain boundaries, twins and grain boundary oxide, on growth in addition to the compositional effect which is required for martensite nucleation.
A similar Ms analysis for alternative Nitronic stainless steels showed much lower Ms temperatures in the simulated depletion zones. Preliminary characterisation of these alloys after preoxidation and glass sealing showed only a very thin bcc layer for Nitronic 40 and elimination of the bcc layer in the case of Nitronic 50.
Footnotes
Acknowledgements
The authors would like to thank B. B. McKenzie for expert SEM work, A. C. Kilgo for metallography for EBSD and C. Walker for preoxidation and glass sealing experiments. Special thanks also to P. F. Hlava for the EPMA work.