
Abstract
This paper presents a study to evaluate the effect of the tool profile on friction stir welding (FSW) process in the aluminium AA 1050, using vibroacoustic signals. The vibroacoustic signals in Z and Y directions have been acquired by the AE instrument NI USB-9234. The characterisation in time and frequency domains and the statistical analysis of vibroacoustical signal have been carried out in order to correlate them with the design of two different tools. Statistical and temporal parameters of discomposed vibroacoustical signals using wavelet transform have been used for filtering vibration signal to eliminate the noise of the FSW machine and the extraction features of them. The analysis has confirmed that the vibroacoustical signals were significantly affected by changes in the tool profiles. Finally, it has been demonstrated that signals generated by this process can be effectively used to characterise the changes on tool design.
Introduction
The friction stir welding (FSW) is a recent process which has been developed by The Welding Institute (TWI) in the beginning of the 1990s. This process is considered to be the most significant development in metal joining in the last two decades. It is widely used in automotive and aerospace industrial applications.1 The FSW process can produce superior mechanical properties in the weld zone and is widely used in automotive and aerospace industrial applications. In the case of FSW of aluminium alloys, different studies are available.
Many studies have dealt with the influence of welding parameters and tool profile on microstructure and joint properties of aluminium weld. Tool geometry is considered to be one of the main parameters in the control of the material flow, heat input and quality of the weld. Hattingh et al. 2 developed a characterisation of the influences of FSW tool profiles on welding forces and weld tensile strength. The authors confirmed the influence of geometric factors, as well as visual information of the interaction between tool profile and the plastic stir zone.
Lorrain et al. 3 realised experiments using two different probe profiles (straight cylindrical probe and tapered cylindrical probe with three flats). The authors demonstrated that the three flat faces probe change the material flow generated by the shoulder and create more variation of the material velocity than the straight cylindrical probe.
In other investigation, Padmanaban and Balasubramanian4 evaluated five tool probe profiles, five tool materials and three tool shoulder diameters to select the proper geometry of tool to friction stir weld AZ31B magnesium alloy. The joint realised using tool with threaded probe profile and 18 mm shoulder diameter produced defect free welds with best mechanically and metallurgical properties compared with others profiles evaluated.
De Giorgi et al. 5 researched the effect of shoulder geometry on residual stress and fatigue properties of AA 6082 FSW joints, and analysed the influence of three shoulder geometries on the FSW joint performance. The three tool geometries are characterised by three different shoulders. The authors realised the transverse and longitudinal tensile tests at room temperature in order to evaluate the mechanical properties respectively of the joints and of the stirred zone, while the fatigue tests were performed transversally to the joint line.
The increasing acceptance of FSW process demands non-destructive testing methods for monitoring the process continuously and automatically in order to expand the field of the industrial applications of this technique. Szkodo et al. 6 evaluated the process parameters of aluminium alloy AW7075-T651 FSW. A non-destructive test was utilised in order to analyse and demonstrate the relationship between the deformation texture in the nugget and the thermomechanical affected zone with process parameters.
Santos et al. 7 presented a method for hardness evaluation based in the electrical conductivity in transversal sections of FSW joints. They support their results on that the electrical conductivity and hardness are controlled by electronic mobility and crystal defects.
The characterisation of manufacturing processes based on the processing of signals obtained from them is a powerful tool currently under investigation. The application of acoustic emission (AE) to characterise welding process was investigated in previous works. Roca and co-workers8, 9 demonstrated the advantage of application AE as non-destructive method for characterisation of stability in gas metal arc welding (GMAW) process. The new index for the stability analysis of GMAW processes taking as a base the AE generated by the arc during the short circuit metal transfer was obtained in this investigation. The authors confirmed the effectiveness of the method proposed as a new way for the analysis of stability in welding process.
Pal et al. 10 show similar result applied to pulsed GMAW process. The authors analyse the acquired welding arc sound signal in time and frequency domain to correlate them with the process parameters and metal transfer modes. As results of the investigation it was demonstrated that the root mean square (RMS) value and kurtosis of arc sound can be used to indicate the metal transfer modes. The welding sound signal was demonstrated to be a good indicator of weld defects.
However, in particular, there are not many studies available dealing with the application of analysis of vibroacoustic emission generated by the FSW for monitoring and characterisation.
Soundararajan et al. 11 evaluated the possibility of applying the AE technique for monitoring the FSW process. The author, based on the AE generated signals, showed and determined the correlation between the loss of contact of the tool with the workpiece and the welding state. The informative features of the signal related to the tool interaction with the workpiece and the welding state were studied using the fast Fourier transform (FFT), the short time Fourier transform, and the discrete wavelet transform (DWT). By identifying the frequencies during the process and analysing the wavelet decomposed signals in various levels or frequency bands, it is possible to monitor effectively the transient welding state and to identify quickly the process changes.
Another work reported by Chen et al.12 showed the application of AE signals on the FSW process. The authors explained that the FFT method is not appropriate for the present case, as the signal is time variant. Their research focused on the AE signals processing using wavelet transforms by having abrupt changes in the workpiece geometry. Finally, they concluded that the different types of defect yield different features in a specific range of frequencies and the band energy variation can provide an indication of gap induced defects.
All the literature reviewed for this work is focused on FSW, their parameters and influence, microstructures change and mechanical properties of joints. However, there is no available information on the role of tool profiles analysed by the AE technique.
The main objective of this work was the evaluation of the incidence of tool profile changes on vibroacoustical signals generated on FSW process of the aluminium AA 1050 H24, in order to demonstrate the feasibility of the application of this technique to evaluate the behaviour of FSW process.
Materials and methods
The plates used in the present work are aluminium AA 1050 H24 with dimensions: 200 mm (L), 100 mm (W) and 3 mm (T). This alloy is known for its electrical conductivity and is commonly used in automotive trim, chemical and food industry equipment, light reflectors, and strips for heat exchangers.
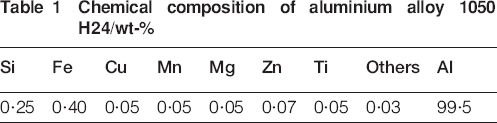
The chemical composition of AA 1050 H24 is given in Table 1.
Chemical composition of aluminium alloy 1050 H24/wt-%
The FSW process was carried out using a CNC machine with displacement control. The plates were butt joined by FSW and locked in position using mechanical clamps. The travel angle used was 0° and the direction of welding was normal to the rolling direction. The experiments were performed accordingly to the experimental set-up shown in Fig. 1.
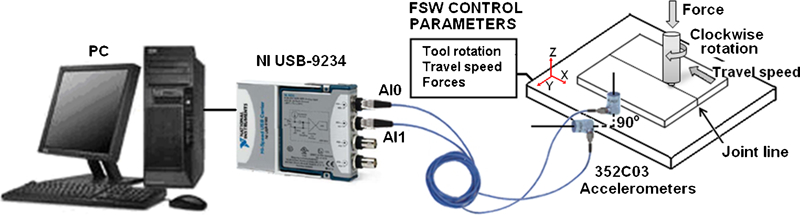
Schematic diagram of experimental set-up
An online monitoring system was used to detect the effect of changes in tool profile on vibroacoustical signal (Fig. 1). Two AE sensors (piezoelectric based) were arranged perpendicularly on the top and lateral surface of the backing plate. The sensors were placed on the backing plate and coupling was used in order to provide a good acoustic path between the backing plate and the sensor.
The vibroacoustical signals of acceleration in Z and Y directions (Fig. 1) were acquired by using the AE instrument NI USB-9234 connected to PC. All signals were sampled at 51·2 kHz and processed using MATLAB. From the preliminary studies, the vibroacoustical signal of the machine in the running mode was acquired to characterise the contained noises, in order to filter them out.
The material used in the design of tools was the AISI D2 tool steel. The diameters of the tool probe and tool shoulder were 3 and 10 mm respectively. The tool plunges in the plate 2·95 mm. Two different probe profiles are considered: a conventional cylindrical probe with grooves (tool 1) and a cylindrical probe with two horizontal flutes (tool 2). The shoulder profile for these tools was concave. The tool geometries are illustrated in Fig. 2.
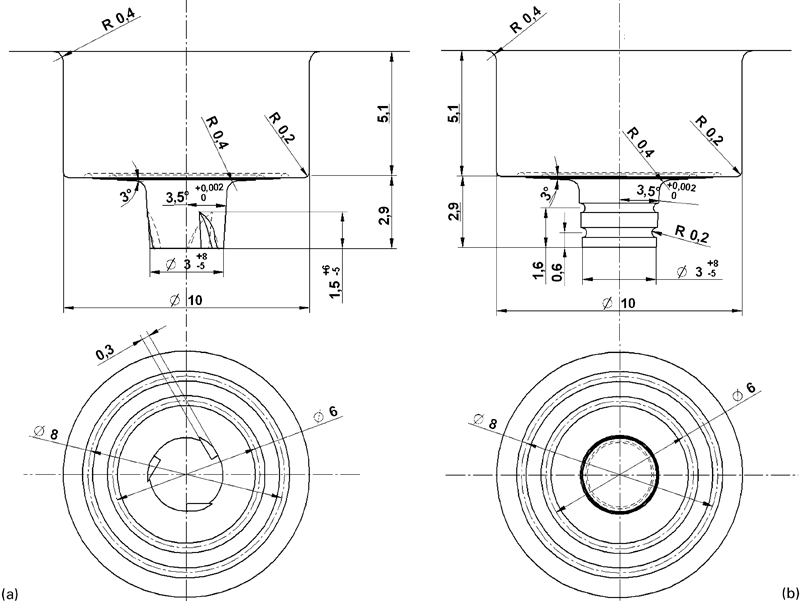
Diagram of tool profiles
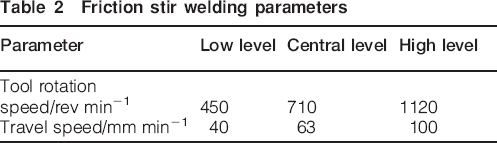
Preliminary tests were realised for selection of the parameters levels, in order to obtain a good appearance weld without apparitions of defects, for the two probe profile evaluated. During the test, three levels (two limits and a central level) of the travel speed and tool rotation speed (clockwise rotation) were used. Experimental designs of factorial type were also used. To reduce the experimental error, welding was performed three times under the same conditions. The FSW process parameters used to join the material are listed in Table 2.
Friction stir welding parameters
Methodology to evaluate tool profile incidence on vibroacoustical signals
The time domain of the vibroacoustical signals obtained for each tool profile was compared. The frequency range of background noise was characterised in order to extract it off the vibroacoustical signals.
Macias et al. 13 demonstrated that the time–frequency analysis is known to be a powerful method for studying many signals found in engineering, including AE signals. The spectrogram is computed as a sequence of FFT of windowed data segments. Also, the FFT method has the capability to decompose, in the original signal, the different frequencies that are related to different sources.
The time–frequency diagram permits to observe the distribution of energy of the acoustic signal and to determine which bands provide useful information and which ones do not contribute to the study. In order to evaluate the process, the time–frequency diagram corresponding to the two tool profiles was obtained.
The wavelet transform has emerged as an efficient tool to deal with non-stationary signals such as vibrational signal waveforms.12 Wavelet transform allows the use of long time intervals where more precise low frequency information is required, and shorter regions where high frequency information is needed. In this paper, Daubechies wavelets of order eight were used to decompose the signals at different scales to obtain the specific frequency bands that are useless for the analysis.
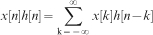
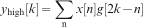
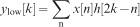
The decomposition algorithm starts with passing the vibroacoustical signal x(n) through a half band digital low pass filter with impulse response h[n]. Filtering a signal corresponds to the mathematical operation of convolution of the signal with the impulse response of the filter. The convolution operation in discrete time is defined as follows
The features extracted of all decomposed vibroacoustical signals were processed to obtain the relationship with the tool profiles evaluated.
Finally a statistical analysis for the validation of the obtained experimental results was carried out. The result of statistical significance testing was utilised to establish the relationship between the tool profile and selected features of vibroacoustical signals generated by FSW process.
Results and discussion
In this section, it was verified that the tool profile can influence in the vibroacoustical signals in FSW. During welding, the tool profile is the primary cause of the mixing and recombining of the plasticized material. This factor includes probe and shoulder design, and relative dimensions of the probe and the shoulder geometry. The results for welding test are shown in this section.
Noise characterisation
Figure 3a and b shows the time and frequency domain diagrams for acquired vibroacoustical signals of noise for tool with grooves in the axis Z, without contact between the tools and the workpiece. Figure 3c and d shows the vibroacoustical signal in Z axis during the test realisation
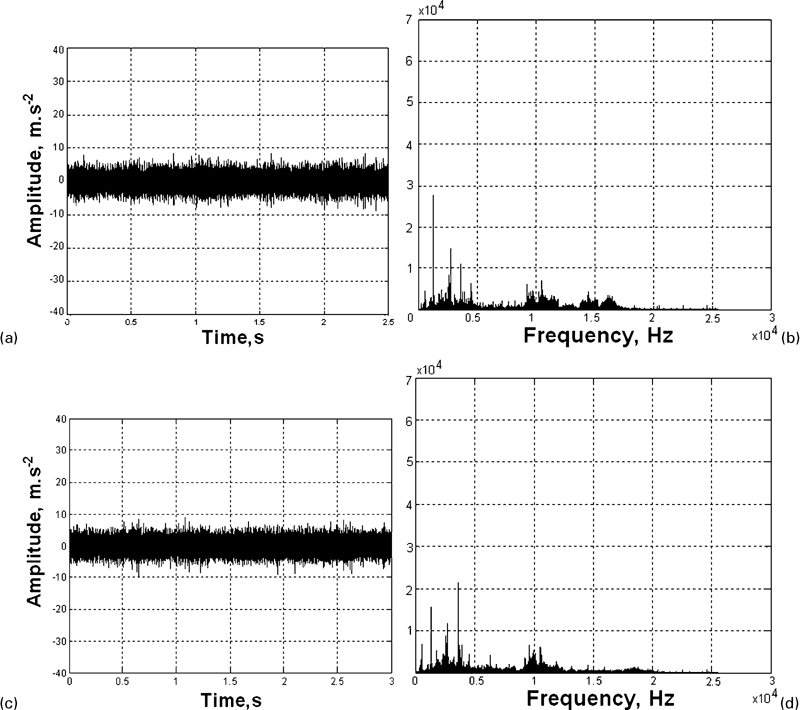
Time and frequency domain diagrams
In this case, Fig. 3a and b shows the vertical vibroacoustical signal (Z axis) and power spectrum for: tool rotation speed is 450 rev min−1 and travel speed is 100 mm min−1. As it can be observed, the levels of the temporary signals of noise (Fig. 3a) in the Z axis and the vibroacoustical signals acquired for that welding condition (Fig. 3c), do not show significant difference.
The power spectrum of noise and vibroacoustical signal (Z axis) presented in Fig. 3b and d has a similar behaviour. In this case it is not possible to find significant difference in any band of frequency of the spectrum.
The low level of signals for Z axis (Fig. 3a and c) can be associated to constant force applied to the workpiece. The variation in Z signals is observed only at the instant when the tools have contact with the workpiece.
For the rest of the experiments the behaviour of the signals in the Z axis was similar, for all tool profiles studied. Taking into account this result, only the vibroacoustical signals in the axis Y were analysed.
Time domain of vibroacoustical signals
Figure 4 shows the graphics of vibroacoustical signals corresponding to the tool rotation speed of 450 rev min−1 and the travel speed of 100 mm min−1 for both tool probe profile. The figure is based on the two tool profiles evaluated, for the same welding parameters.
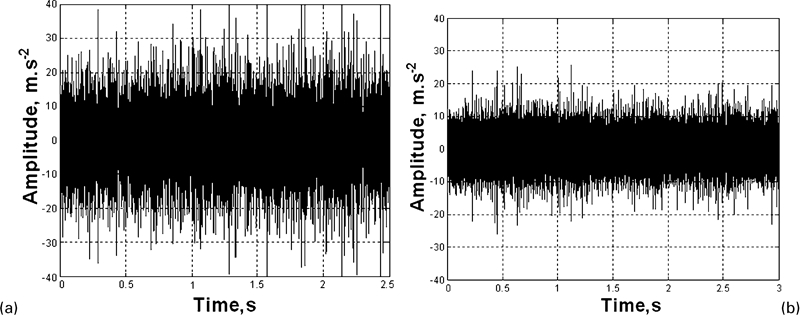
Vibroacoustical signals in Y direction
As it is appreciated in Fig. 4, the level of the vibration signal is higher for the condition based in tool with cylindrical probe with grooves. The vibroacoustical signals are derived mainly from the friction between the tool and the material deformations in the weld zones. This increase in the levels of the vibration shown in Fig. 4 can be associated to a bigger surface contact between the tool and the material. It is also associated to the probe form that creates disturbance in the flow field and generates transverse accelerations.
Table 3 shows the values of the statistical parameters of the analysed signals and demonstrate the incidence of the tool profile changes in the parameters of vibroacoustical signals obtained during the process.
Features of vibroacoustical signals
As can be seen in Table 3, the higher levels of vibroacoustical signals features were obtained for conditions with cylindrical probe with grooves. The presences of grooves on the probe (Fig. 2a) enhance the flow of material, and increase the vibroacoustical signals, as shown in Fig. 4a. In the case of tool with cylindrical probe with horizontal flutes, much of the material flow takes place by simple extrusion, and it is generated a lowest level of vibroacoustical signal caused by an inferior contact surface between probe and material. Similar results were obtained for all conditions evaluated in the experimental region.
Time–frequency analysis for process regularity evaluation
Considering the complex nature of vibroacoustical signals generated by this welding process, Macias et al. 13 demonstrated that the use of only temporal and amplitude vibroacoustical signals parameters could be sometimes insufficient to evaluate the behaviour of welding process. The present study considers the addition of the time–frequency diagram in order to obtain the supplementary information in the frequency domain.
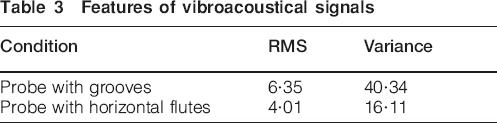
Figure 5 shows the time–frequency diagram obtained for two conditions evaluated with the tool rotation speed of 450 rev min−1 and the travel speed of 100 mm min−1 and different tool profiles.
Time–frequency diagram
As shown in Fig. 5, the signals generated presents a steady power spectrum during the welding process. The red regions in the figure indicate the high intensity on the power spectrum. A band of red region that exists around the frequency range 9–15 kHz indicates the higher intensity of the vibroacoustical signals in this region. The horizontal lines in time–frequency diagrams demonstrate the regularity during the experimental process. A similar result was obtained for all test realised.
The diagram shown in Fig. 5 is also valid to evaluate the stability of the process in situations when irregularities and discontinuities appear. In those cases, periodicities in power spectrum and similar spectral peaks for the experimental condition are appreciated in Fig. 5, which indicates the regularity during the experimental tests.
Macroimage analysis
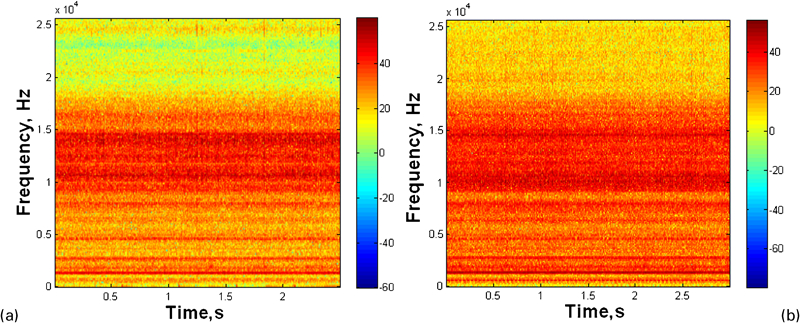
Figure 6 shows the cross-section perpendicular to the welding direction for the conditions with the tool rotation speed of 450 rev min−1, the travel speed of 100 mm min−1, and different tool profiles.
Cross-sectional weld zone
In Fig. 6 different zones in the weld can be appreciated, such as nugget zone, thermomechanically affected zone and heat affected zone. As observed in Fig. 6, the tool profile plays an important role and decides the quality of the joints. The macroimage of the weld zone presented in Fig. 6a shows no weld defects and macrostructural continuity.
Figure 6b shows a singular result only obtained for condition with the tool rotation speed of 450 rev min−1, the travel speed of 100 mm min−1 and the cylindrical probe with two horizontal flutes. The joint developed using this parameters contains a tunnel defect along the joint (Fig. 6b), caused by inadequate flow of metal and essentially for insufficient heat generation; this reduces the volume of metal that the tool may remove during the rotation and travelling cycle, used to fill the weld cavity behind the weld tool, deteriorating the weld quality and joint properties.
For the tools utilised, the flow of metal mixture around the probe was accomplished by the extrusion of plasticized mixture grabbed from the front of the probe, and moved through the space between the surface of the probe and the parent metal to the rear of the tool.
Frequency analysis
Figure 7 shows the frequency diagram corresponding to the vibroacoustical signals obtained for conditions with the tool rotation speed of 450 rev min−1 and the travel speed of 100 mm min−1 for both tool probe profile.
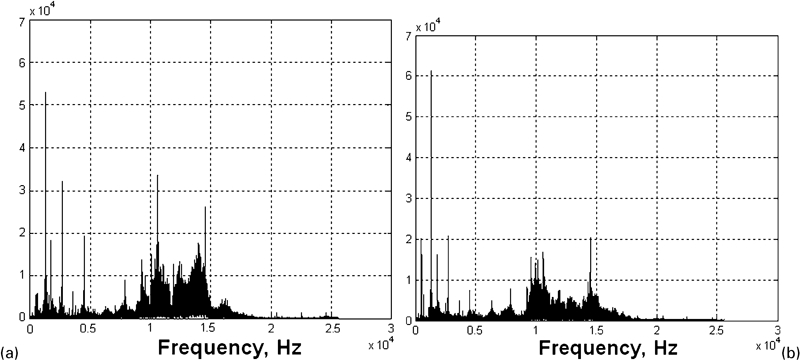
Frequency diagram
Figure 7 shows the frequency diagram for the two tool profiles evaluated. The frequency range of the spectrums between 12 and 16 kHz (Fig. 7) offers information, which cannot be obtained from the signals in time domain.
The amplitude in this frequency band (Fig. 7a), for probe with grooves, is bigger than that for the condition with cylindrical probe with two horizontal flutes (Fig. 7b). This result can be associated to an increase in the contact surface between the tool and the material, causing high friction force between the cold material and the probe. This physical phenomenon causes an increase in vibroacoustical signals intensity, as shown in Fig. 7a. Similar results were obtained for all experimental tests.
In this research, the effect of tool rotation speed and the harmonics are located at low frequencies (0–100 Hz). For experimental region the tool rotation frequency operates in a range of 7·50–18·66 Hz. Suresha et al. 14 affirm that typically these AE systems offer information in the range of 1–2 MHz or greater frequency. The authors establish that a lower frequency limit is imposed by background noises such as friction, outside impacts, or process generated signals that tend to mask AE.
In other works developed by Vijay and Murugan,15 a low pass filter is applied to the AE signal in order to eliminate the frequencies lower than 80 KHz. In that case, the information of process is obtained mainly in the frequency range of 100–170 KHz. The lowest frequencies associated to tool rotation are not analysed in that work.
In this paper the feasibility of extracting information from the low frequencies is demonstrated in order to obtain the correlation between the vibroacoustical signal in this frequency range and the changes in the tool profile.
The FFT cannot adequately describe the characteristics of the AE signal at low frequencies.11 Therefore, other signal processing techniques are utilised to characterise the AE signal over these frequency ranges. The wavelet transformation has been utilised in this work to obtain a series of decomposed vibroacoustical signals.
Wavelet transform
The result of the DWT is a series of decomposed signals belonging to different frequency bands. In this study, the DWT decomposition is applied using eight levels and mother wavelet Daubechies (Db5).
The graphics in Fig. 8 represent the wavelet transform of the vibroacoustical signal for experimental condition with the tool rotation speed of 450 rev min−1, the travel speed of 100 mm min−1, and different tool profiles.
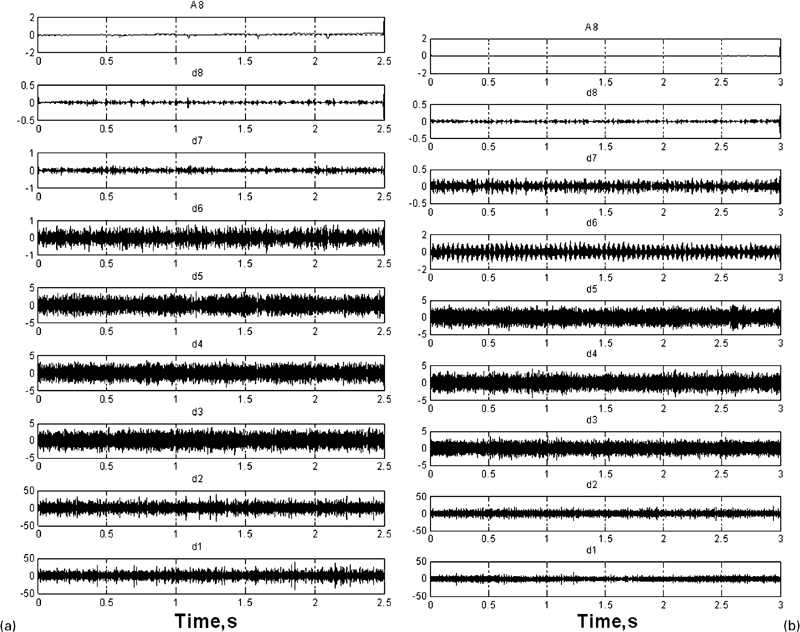
Wavelet transform
The A8 signal can be considered as the result of passing the vibroacoustical signals through a low pass filter, with a resulting frequency bandwidth [0, 100 Hz]. D1–D8 correspond to the frequency bandwidths [12·8, 25·6 kHz], [6·4, 12·8 kHz], [3·2, 6·4 kHz], [1·6, 3·2 kHz], [800 Hz, 1·6 kHz], [400, 800 Hz], [200, 400 Hz] and [100, 200 Hz] respectively.
The similar behaviour was obtained for D2, D3, D4 and D5. Comparing the decompositions D1 for all evaluated conditions, a difference in the frequency bandwidths [12·8, 25·6 kHz] can be appreciated. This result coincides with the analysis obtained from the power spectrum, shown in Fig. 7.
Figure 9 shows the approximation A8, in time and frequency domain, for two different tool profiles and similar tool rotation speed of 450 rev min−1 and the travel speed of 100 mm min−1.
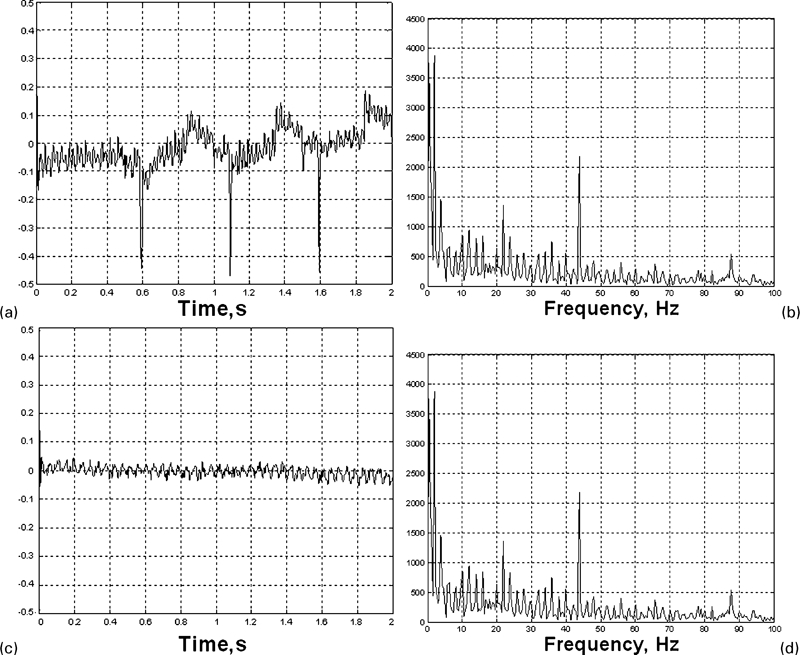
Approximation signal A8
The analysis of the approximations A8 presented in Fig. 9 (with a bandwidth [0, 100 Hz]) shows visible difference at low frequencies between the signals for evaluated tool profiles. A comparative analysis for all tested conditions with similar parameters (the tool rotation speed and the travel speed) and different tool probe profiles, showed a similar result to the shown in the Fig. 9.
In order to compare the performance of the two types of tool probe profile at low frequency, some features have been extracted, as shown in Table 4. The RMS, variance and median are found to be the best features extracted from the DWT.
Discrete wavelet transform A8 features of vibroacoustical signals
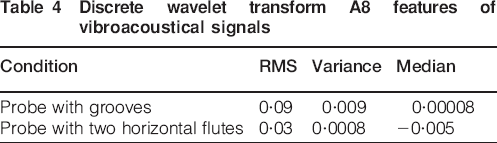
The spectrum of approximation A8 in Fig. 9b shows more components of frequency than the obtained from Fig. 9d associated with the tool with probe with two horizontal flutes. This result can be associated to the presence of three grooves in the probe. This tool profile increases the resistance offered for the tool movement through the workpiece in contrast with cylindrical probe with two horizontal flutes. When RMS (RMS_A8), variance (var_A8) and median (median_A8) were applied for the tool changes evaluation, a good classification was obtained.
Statistical analysis
The F test has been used to determine which vibroacoustical features were affected by changes on the tool profile. For the analyses, it was not taken into account that the bands of frequency associated to the noise demonstrated unnecessary in the previous epigraph.
The results of F test for evaluating the effect of tool probe profile on vibroacoustical signals at low frequency based in two features extracted of the DWT decomposition for tool profiles evaluated are shown in Fig. 10.
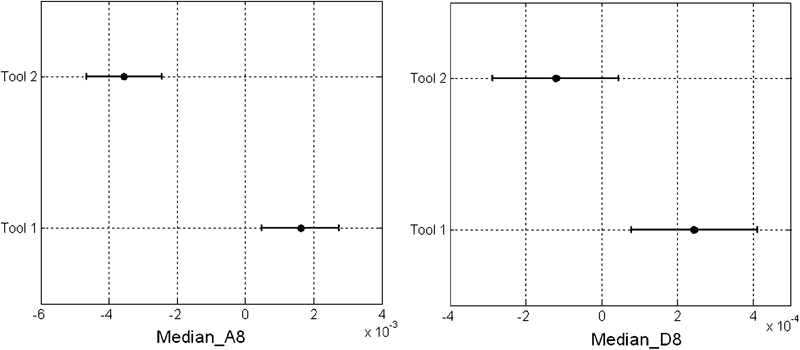
Influence of tool profile on DWT decomposed signals at low frequency
The showed features of the decomposed signals exhibit means of groups significantly different due to changes on the tool profile for a 95% of confidence interval. Based on statistical analysis, it was demonstrated that the tool profile affects significantly the studied signals at low frequency (A8 [0–100 Hz] and D8 [100–200 Hz]), as shown in Fig. 10.
Figure 11 shows the three-dimensional surface behaviour of median_A8 feature extracted of the vibroacoustical signals at low frequency (0–100 Hz) using wavelet transform.
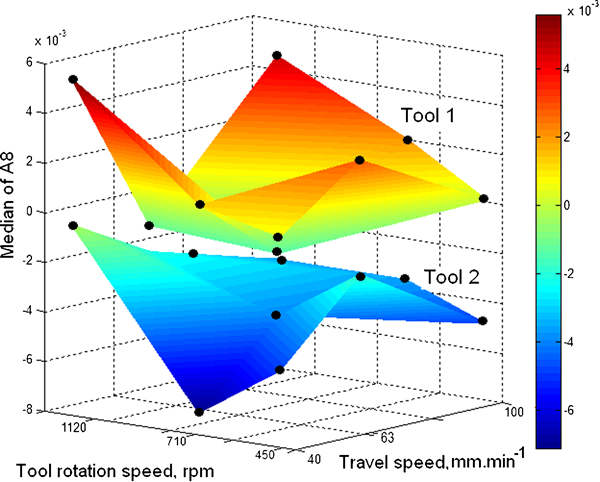
Median of approximation A8 for two different tool profiles
The surfaces shown in Fig. 11 confirmed the feature differences based on wavelet decomposed signal at low frequency (0–100 Hz). In this case the values of median_A8, for experimental region, were superior for tool 1 (cylindrical probe with grooves). This result can be associated to the higher contact surface presence for this tool.
Other features of vibroacoustical signal and extracted of the wavelet decomposition showed significant variation for experimental region investigated, such as mean of A8 (mean_A8), mean of D7 (mean_D7), mean of D6 (mean_D6) and median of D1 (median_D1).
Conclusions
The following conclusions can be drawn.
Vibroacoustical signal features at low frequency (0–100 Hz) provide an indication of change in tool profile during friction stir welding.
Wavelet based analysis techniques can be used as an effective technique in tool profile evaluation for their relatively good frequency resolution at low frequency.
The vibroacoustical signals can be successfully applied as an effective method for the online monitoring of tool profile change, according to the results obtained.
Footnotes
Acknowledgements
This paper has been partially supported by the project of the Spanish Government DPI2011-25007, ‘Friction stir welding of dissimilar materials. Characterization by acoustic emission techniques and artificial intelligence’.