
Abstract
This paper presents a process–structure–property relationship study of laser welds as a continuous consolidation method for joining thin monophased steel foils, thereby providing a more effective, less costly method to construct automotive catalytic converters. A body centred cubic (bcc) iron–chromium–aluminium alloy doped with Mischmetal was utilised in this study. Both pulsed and continuous wave modes were used to establish the limit welding diagrams for lap joint configuration. Actual laser welding parameters were selected using several testing conditions. The laser welds behaved substantially different from the base material under creep and high temperature oxidation. The difference was mainly attributed to the changes in grain morphology, precipitation of aluminium nitrides and carbides, and relocalisation of the reactive elements during liquid metal flow upon keyhole formation, solidification and cooling.
Introduction
Automotive catalytic converters are used to convert and remove toxic components of exhaust gas byproducts from vehicle engines.1– 4 The metallic catalytic converters are manufactured as a honeycomb structure inserted in a thick metallic tube, usually made from an austenitic steel material. The honeycomb structure is obtained by coiling a flat foil (FF) and a corrugated foil (CF) around the same axis. The foils are usually an FeCrAl alloy,5– 8 an alumina forming alloy9– 11 which has proven to be resistant to high temperature oxidation, vibration and creep imposed by the hot exhaust gas produced in automobiles. Notably, the honeycomb structure of the converter must be consolidated; otherwise, the growth stresses, which are induced by oxidation and in the range of 1 GPa, would cause immediate failure.
Conventionally, FeCrAl structures are joined by brazing,12, 13 although many other techniques are available.14– 18 Brazing, however, requires substantial interruption in the production line to accommodate heat treatment at 1200°C for several hours. Moreover, brazing must be performed in a hard vacuum.19– 21 Both requirements induce a high manufacturing cost not compatible with the pronounced market growth of metallic catalytic converters following current green house emission reduction standards.22– 27 As such, a continuous consolidation joining process, achieved, while the honeycomb monolith is structured during the coiling process, is needed to improve the fabrication of catalytic converters.
In addition to the shortcomings of the brazing process in toto, the regions near the brazing joints are highly susceptible to transformations when a filler material is used.28– 30 For instance, embrittlement problems were reported31 in catalytic converters due to the formation of intermetallic phases when the braze solidifies.32– 34 Furthermore, the high Ni content results in the formation of austenite not suitable for resisting high temperature oxidation. The nickel-based powders used in brazing decrease the effective Al content by γ′-Ni3Al precipitation35, 36 and thereby lower the oxidation resistance. All these phenomena impair the oxidation and mechanical properties of the structure. In fact, a large number of premature in service failures have been reported for the brazed regions that occupy the vertices between FF and CF.37 The autogenous nature of laser welding, however, precludes these transformation concerns.38 Therefore, laser welded catalytic converters are expected to perform better than those consolidated by brazing.
In this paper, we investigate the feasibility of utilising laser beam welding to consolidate the honeycomb shaped monolith under the flying optics principal. In addition to weldability and limit welding diagrams, this feasibility study required that we investigate the properties of the weld. Since creep and oxidation are the predominant in service loads, creep and oxidation tests were carried out on welded foils in a fashion that permitted isolating the properties of the weld from those of the base material (BM). Several characterisation techniques, such as scanning electron microscopy (SEM) and electron probe microanalysis (EPMA), were used to reveal the microstructure induced by welding.
Experimental Procedure
Materials
The material of study was a Mischmetal containing Fe20Cr5Al foil with 95 and 45 μm thickness, cold rolled and annealed. The Mischmetal contained 75% Ce and 25% La.39
Table 1 shows the results of quantitative chemical analyses (in wt-%) obtained with wavelength dispersive spectrometer EPMA (EPMA). The values represent the averages of inspections from several areas that were 2500 μm2. Table 1 also reports the chemical composition provided by the steel maker (Sandvik).
Chemical composition of studied FeCrAl alloy (wt-%)
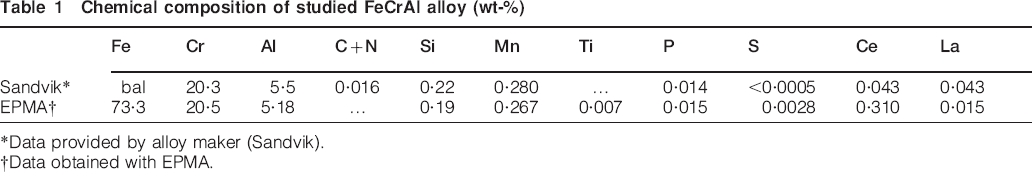
*Data provided by alloy maker (Sandvik).
†Data obtained with EPMA.
Welding technologies and modes
Two modes of laser welding were used: impulse mode and continuous mode. For both methods, welding was achieved in lap joint configuration under an argon protective atmosphere. Brazing was also used to qualitatively compare the laser welds to the brazed joints.
The lap joint configuration consisted of joining two FFs or an FF and a CF for the determination of the limit welding diagrams. To determine the mechanical resistance of the joint under real geometrical conditions, several samples for shear in tension tests were welded: FF on FF, CF on FF, FF on CF, FF on CF on FF and CF on FF on CF. These samples represent welding configurations that are necessary if the catalytic converter monolith was to be consolidated by laser welding during the coiling process. For the laser welding process, on one hand, the lasers must move upward to control the focal distance; on the other hand, two types of welding configurations are needed: (1) three-piece lap joint welding, where the beam strikes the CF first (CF/FF/CF); and (2) two-piece lap joint welding, where the beam strikes the FF first (FF/CF). For the CF/FF/CF case, the pulse mode seems more appropriate since the laser beam can accurately strike solely the contact area. This solution, unlike the continuous mode, also offers the benefit of avoiding drilling at the top of the corrugated channels of the foils. However, real time image acquisition cameras must be used to synchronise the succession of the corrugated channels and the laser strike cadences. Furthermore, this method does not accommodate welds in the FF/CF configuration because the contact between FF and CF occurs below the FF, which also then needs lateral cameras. Consequently, this solution is cumbersome and may not be feasible. In sum, continuous wave welding was found to be more cost-effective and less cumbersome, and it was our choice for welding the monolithic prototypes.
For single spot welding, two Nd:YAG solid state laser sources were used.39 The first laser source was a 4 kW Haas HD4006L laser, delivering an output beam size of 600 μm at the focal point with a multimode energy distribution. The focal distance was 150 mm, while the peak power Pw varied over a range of 240–700 W, and the total pulse duration τ ranged between 30 and 90 ms. The second laser source was a 1 kW Cheval laser, which delivered a 200 μm beam diameter but with a more Gaussian energy distribution; i.e. the focal distance was fixed at 60 mm, while the pulse duration varied between 0·1 and 15 ms.
For the continuous mode, a fast 400 W Feha SM 400P CO2 gas transport laser was selected for its ability to reach 100 m.min−1[w/clover] in scanning speed, which is suitable for welding thin foils. This laser delivered a beam size of 70 μm with a Gaussian energy distribution.
Welding of honeycomb structured prototypes
The laser-welded honeycomb structures were built by subsequent welding of FF and CF, with the CF having a sinusoidal shape. The first layer was obtained by welding FF over CF over a 10 cm width with six beads, two at each edge and two at the middle. The six-bead configuration was selected for its consistency with the possible three laser heads that would consolidate the monolith during the coiling process, each one delivering two beams. A new CF was clamped over the FF through pressurised air in a welding cell, and the same number of seams was achieved perpendicularly to the corrugation axis (Fig. 1a). These six seams were, however, slightly shifted away from the preceding seams to prevent drilling from rewelding. The subsequent layer was added by welding a new FF over the previous CF (Fig. 1b). The process was repeated several times.
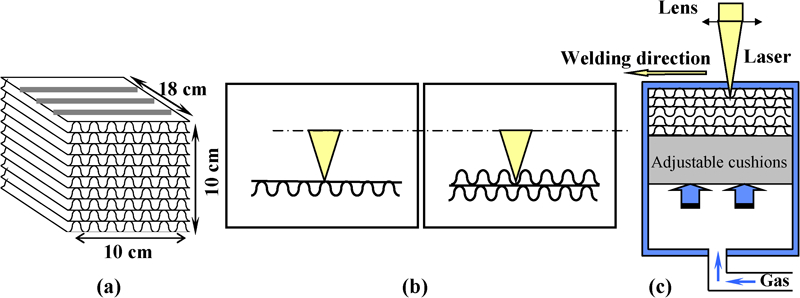
Schematic illustrations of (a) flat honeycomb prototype geometry consolidated by (b) successive laser seams in continuous mode joining pile-ups of FF and CF, and (c) clumped together by air pressure with adjustable cushions exerted from bottom
The welding cell employed clamping by compressed air with pneumatic cushions (Fig. 1c). The clamping force was progressively applied to limit damage of the welds. Upon building the honeycomb, the working distance in the laser machine was properly adjusted.
Creep and tension tests
For both creep and tension tests, two types of specimens containing a large number of weld seams (WS) were constructed to isolate the properties of the weld from those of the BM. Both types of specimens were in bead on plate configuration to avoid stress singularities that can induce a multiaxial loading situation. The first type of specimen contained WS parallel to the loading axis (WPA) in an effort to start with the same strain between the metal BM and the weld.40 The second specimen, with WS perpendicular to the loading axis (WPE), contained seams normal to the loading direction in an effort to maintain the same level of stress between the BM and the weld. All the specimens for creep and tensile tests contained welds in the selected condition falling within the best region in the weldability diagrams. The creep tests were performed at 900°C and in the stress range between 1 and 40 MPa. Tensile tests were performed at 25 and 500°C.
Oxidation at high temperature
Isothermal oxidation tests in a Setaram thermobalance of WS samples containing a large fraction of laser seams in a bead on plate configuration were carried out over the temperature range of 900–1200°C. These samples were bent in a polyhedral geometry and ultrasonically cleaned in acetone and ethanol. The Setaram thermogravimetric analysis (TGA) system provided 0·1 μg sensitivity. Microstructural measurements were carried out using optical microscopy, SEM and EPMA, as previously described.41
Results and discussion
Single spot laser welding
For this welding mode, two different Nd:YAG lasers were used.
Haas HD4006L Nd:YAG laser
Although highly energetic, this laser can deliver a large beam diameter in the range of 600 μm, which has the benefit of increasing the welded area and, thereby, the mechanical resistance of the joint. The limit welding diagram of two 95 μm thick FFs is shown in Fig. 2 with the plot of the peak laser power Pw as a function of the pulse duration τ. The optical micrographs obtained on each weld cross-section allowed us to distinguish four domains in this diagram (Fig. 2). With decreasing beam energy, the four domains are (i) a domain where the weld exhibited a crater at both faces with a tendency for drilling (Pw>500 W for τ = 50 ms), (ii) a domain where the weld exhibited only a crater at the upper face, (iii) a domain where substantial cracking and pore formation occurred at the weld centreline (CL) and edges (Pw<200 for τ = 50 ms), and (iv) a domain for no welding.
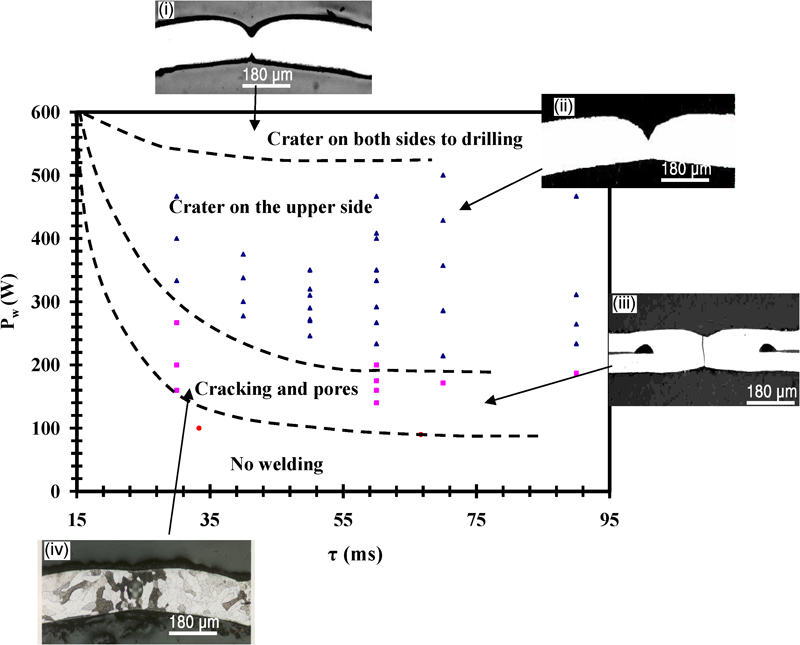
Limit laser welding diagram of two 95 μm thick foils joined with Haas HD4006L Nd:YAG laser: optical micrographs are polished cross-sectional microstructures showing four different energy input levels, from top left clockwise, (i) craters on both weld sides; (ii) crater on only upper weld face; (iii) cracking and lateral pores; and (iv) pores in fusion CL
The craters corresponded to the local sagging of the weld with a thickness reduction at the weld centre. The sharp edge of each crater indicates a restriction phenomenon of Marangoni flow:42– 44 as the material rapidly started to evaporate at the pool centre, the equilibrium of surface tension imposed at the plasma/liquid metal interface motivated the fluid to flow away from the weld CL. The excessive beam size compared to the welded sheet facilitated the transport of the liquid toward the weld edges. The rapid cooling and solidification quenched the liquid before the crater could be compensated by a return of the liquid mass toward the CL. The rapid solidification shrinkage intensified the crater as the laser power increased. When the energy was reduced to mitigate the intensity of this Marangoni flow, the metal cracked or entrapped large pores at the weld CL and edges. Further beam energy reduction abruptly led to a domain with insufficient penetration power for welding.
The essential information from the limit welding diagram in Fig. 2 is that craters were formed as soon as full penetration was achieved for an acceptable welded surface area. Otherwise, the metal was either drilled at higher energy or formed large cracks and pores when lower energies were achieved by long pulse durations. The cracks were radial (Fig. 2), which denotes the inability of the semisolid material to accommodate strains upon cooling at the rates associated with the pulse mode of this laser. This hot cracking was also promoted by the particular wide solidification temperature range typical of body centred cubic (bcc) FeCrAl alloys.45 In addition to these metallurgical defects, quantitative EPMA analyses revealed a substantial Al depletion, which increased upon an increase in pulse duration.39 For instance, >1·5 wt-% of the original aluminium content was lost for τ = 50 ms as a result of the oxidation of the liquid metal.
1 kW cheval Nd:YAG laser
The limit welding diagram of two FFs of 95 μm thickness is shown in Fig. 3. Compared to the Haas Nd:YAG laser, the Cheval Nd:YAG laser has the advantage that it provides a finer spot. Accordingly, the Cheval laser provided processing parameters with good morphological weldability. The best weld shape quality was obtained at Pw = 200 W applied for 2 ms. However, the relatively small size of the weld (250 μm for Pw = 200 W and τ = 2 ms) seemed to significantly increase the cooling rates of the semisolid, thereby inducing a systematic orthoradial cracking (Fig. 3).
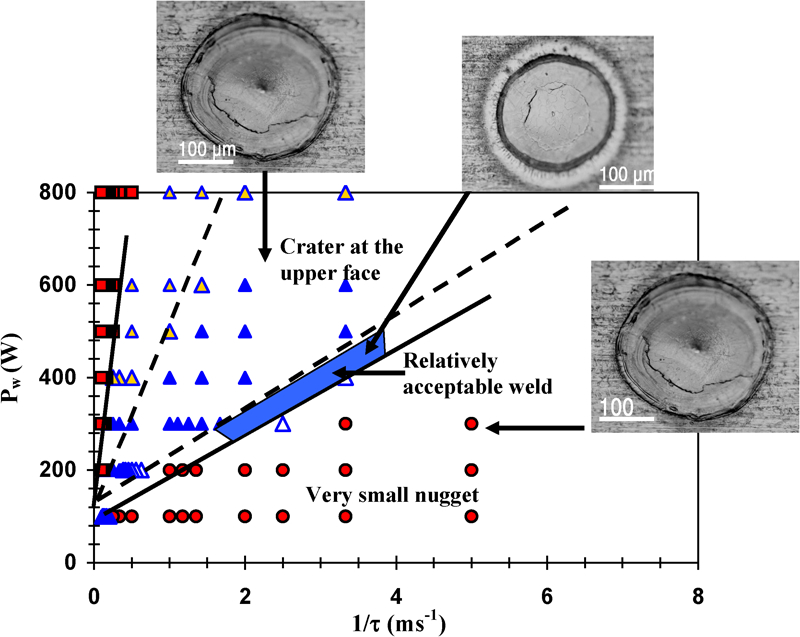
Limit laser welding diagram of two 95 μm thick foils joined with 1 kW Cheval laser: optical micrographs correspond to upper view of spot welds, revealing crater formation and systematic hot cracking for all energy input levels
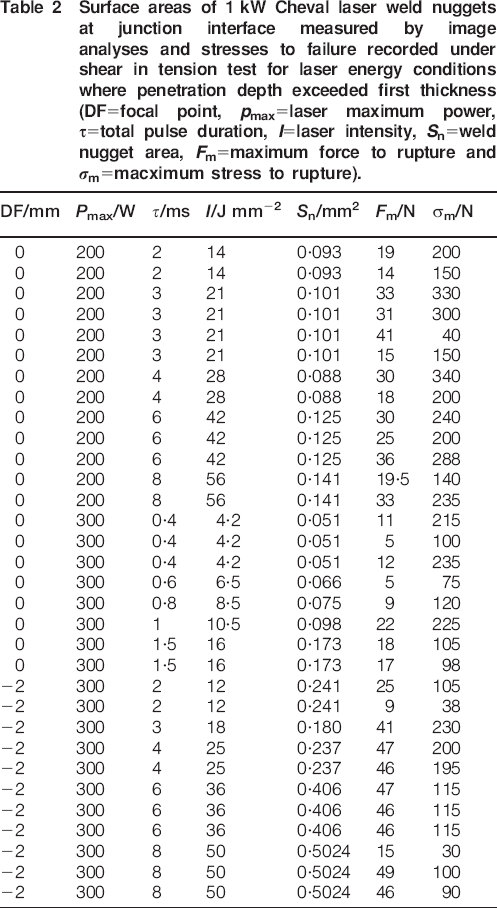
The surface areas of the welds at the junction between the foils were measured for most conditions and are reported in Table 2 along with measurements of the maximum shear force and the corresponding stresses are required to break the weld. The data show that at low laser energies, the metallurgy of the weld was better, but the effective welded area was small. When the energy was further increased, although the effective welded area increased, radial and orthoradial cracks were systematic. Both phenomena led to a substantial scatter in the mechanical resistance of the welds.
Surface areas of 1 kW Cheval laser weld nuggets at junction interface measured by image analyses and stresses to failure recorded under shear in tension test for laser energy conditions where penetration depth exceeded first thickness (DF = focal point, pmax = laser maximum power, τ = total pulse duration, I = laser intensity, Sn = weld nugget area, Fm = maximum force to rupture and σm = macximum stress to rupture).
Microhardness was determined by using a microindentation hardness testing system (LECO LM300AT), and test results along a polished central cross-section of the weld are reported in Fig. 4. The fusion zone (FZ) was harder than the BM by at least 100 HV. The heat affected zone (HAZ) had a fluctuating hardness, probably due to the inflecting values of residual stresses.
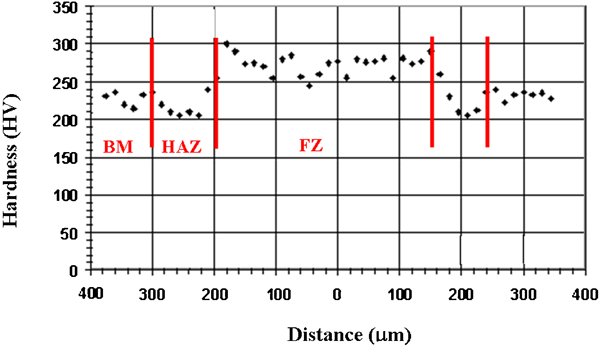
Stresses to failure recorded under shear in tension tests for each welding condition made by 1 kW cheval and represented by laser beam intensity: compared to BM, higher hardness is attributed to fine AlN precipitation; heat affected zone has fluctuating hardness which may be due to fluctuation in residual stresses, grain size or precipitations
Continuous wave laser welding (400 W Feha SM 400 P CO2 laser)
Weld morphology
The laser beam intensity delivered with the Feha SM 400 P CO2 laser created consistent bead morphology and enabled accurate control of the penetration depth (Fig. 5). The limit welding diagram exhibited a wide range of power and welding speed values, which offered full penetration with no crater formation. The foils were successfully welded even with intensities extremely close to the drilling domain (Fig. 5). Figure 6 shows that for P = 400 W, the weld widths at the upper face (Dn), bottom face (Db), and junction (DJ) between the welded sheets remained nearly insensitive to the beam intensity over a broad welding speed range, i.e. of 25–45 m.min−1. The same could be observed when the velocity was kept constant with varying power. This flexibility, together with a good bead shape, suggested a deep penetration welding mode with ultrafine keyhole mode. The small size and high quality of the beam enabled a very small filament of vapourised material, and the laser photons were efficiently delivered into the material without excessive lateral conduction and melting. The melted pool volume must have remained sufficiently narrow and small to be properly supported by the low capillary surface tensions associated with the very thin FZ walls.
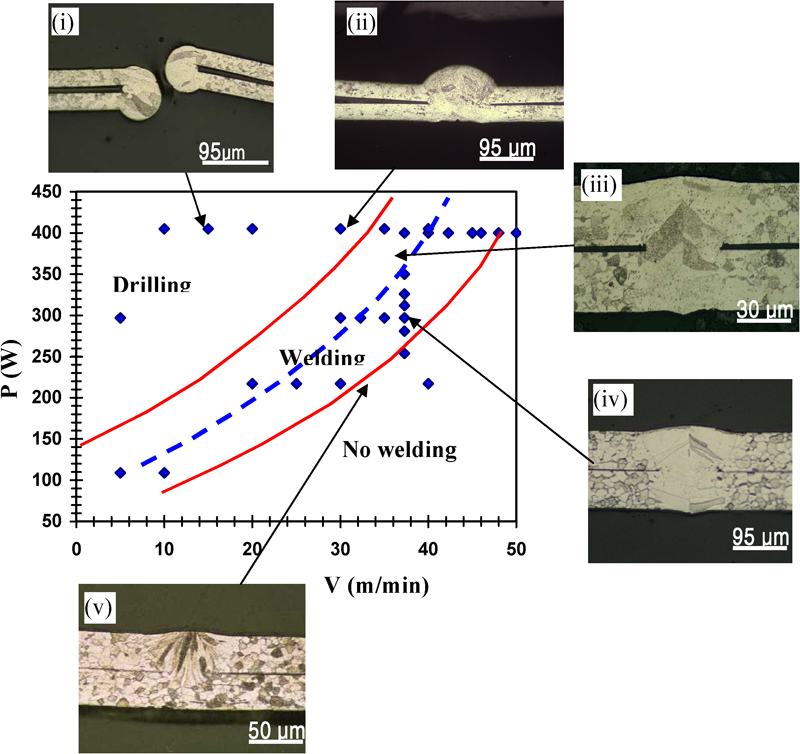
Limit laser welding diagram of two 45 μm thick foils joined with 400 W Feha SM 400 P continuous CO2 laser: optical micrographs are polished cross-sectional microstructures showing for different energy input levels, from top left to bottom right, (i) drilling, (ii) welding even in proximity of drilling conditions, (iii) full penetration welding with slight weld hump, (iv) good full penetration welding, and (v) sticking mode (no welding) and partial penetration welding
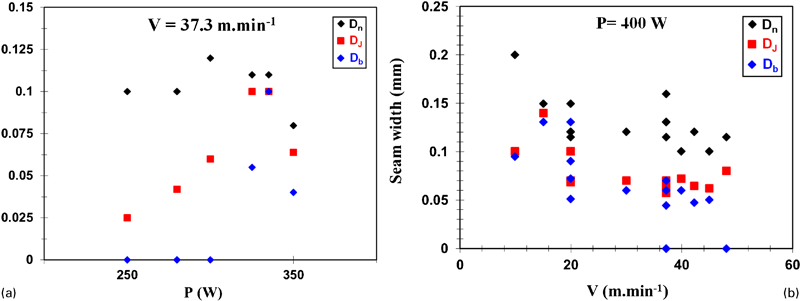
Effect of power and welding speed on bead width at upper face (Dn), junction (DJ) and bottom side (Db): best welding parameter corresponded to welding speed of 35 m min−1 and power 350 W
Weld microstructure
Figure 7 reveals that the weld microstructure realised in the best conditions was fine grained in the vicinity of the fusion line (FL) but mostly dendritic toward the CL. The high temperatures and fast cooling rates associated with keyhole mode welding led to the total dissolution of secondary phases, causing carbon and nitrogen to return in solid solution.38 The dissolution of N is evidenced by the fine and general precipitation of aluminium nitride with a size smaller than 300 nm (Fig. 8).39 The AlN particles were identified through chemical mapping using the EMPA analysis. Although not reported here, substantial precipitation of chromium carbides Cr23C6 occurred near the surface of the weld.39 Moreover, quantitative profile analyses of trace elements using EPMA revealed a noticeable enrichment in Mischmetal near the FZ free surface.39 The chemical state of (Ce+La) in the FZ has not been formally identified, but it may correspond to a solid solution state. However, the EPMA analysis revealed that the oxide formed over the metal liquid during welding did indeed contain a high amount of Mischmetal, which was preferentially located at the boundaries of the columnar grains. This substantiated the enrichment of the FZ free surface in Mischmetal. The presence of the solid aluminium oxide over the liquid may have promoted the diffusion of Mischmetal within the aluminium oxide. The liquid was animated by hydrodynamic flow pulsations associated with the keyhole mode and thereby was located at the edges of the bead after the weld had solidified.46
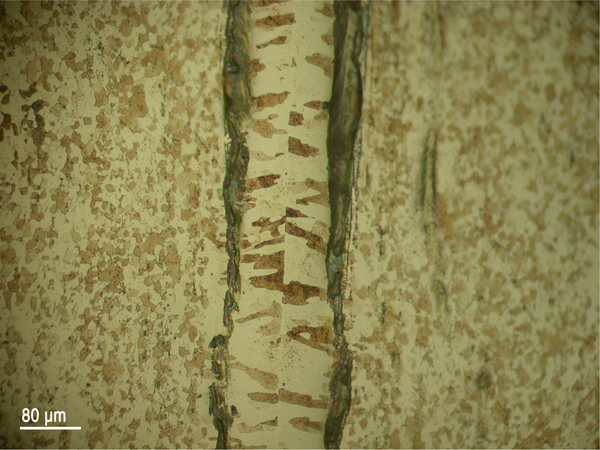
Optical micrograph of etched longitudinal section of laser weld achieved under power of 340 W and at speed of 35 m.min−1: polishing plan is almost parallel to rolling direction of sheet; black lines at edges of weld correspond to oxide layers formed when weld was in liquid stage
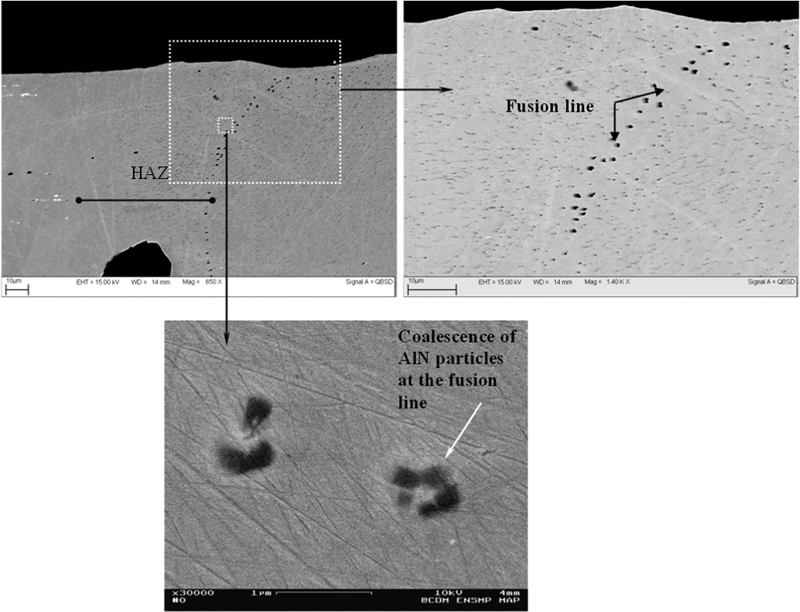
Scanning electron micrographs centred in fusion line in backscattered mode showing substantial precipitation of fine AlN particles the FZ with preferential coalescence at fusion line (HAZ = heat affected zone)
Oxidation behavior
Typical mass gain results obtained in the TGA furnace for the BM and a sample with WS in bead on plate configuration containing ∼45% of FZs (fFZ = 0·45) are shown in Fig. 9. At 900°C, the abnormality in oxidation, which is characteristically observed for all alumina forming alloys and correlated to metastable alumina,41, 47 was eliminated for the FZ.41, 48 The kinetics associated with the transient oxidation at 950 and 1000°C for the FZ was, however, considerably faster than that of the BM. However, as the temperature exceeded ∼1150°C, BM and FZ oxidised at nearly the same rates. These behaviours were reproduced by three independent runs in the TGA system. OM and SEM analyses further substantiated this behaviour, confirming that at 900°C thinner scales form over the FZ than that over the BM zone (Fig. 10). The important reduction in the kinetics on the FZ at 900°C was attributed to the high free C in the FZ matrix, which led to substantial Cr23C6 and TiC precipitation on the FZ39 (Fig. 11). The carbide interface played a role as a secondary diffusion barrier intervening between the metal and the oxide (Fig. 11).
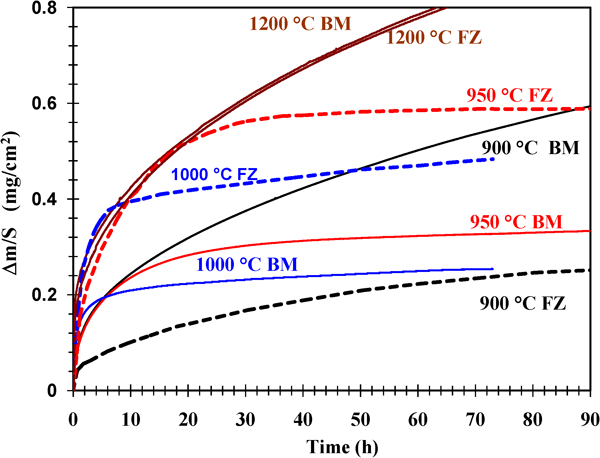
Thermogravimetric analysis results comparing mass gain over FZ calculated per mixture law on samples containing ∼45% of seams with respect to total material exchanged surface area: oxidation kinetics at 900°C over FZ are much lower than those over BM; situation reverses at 950 and 1000°C, at which point FZ and BM showed same kinetics of oxidation
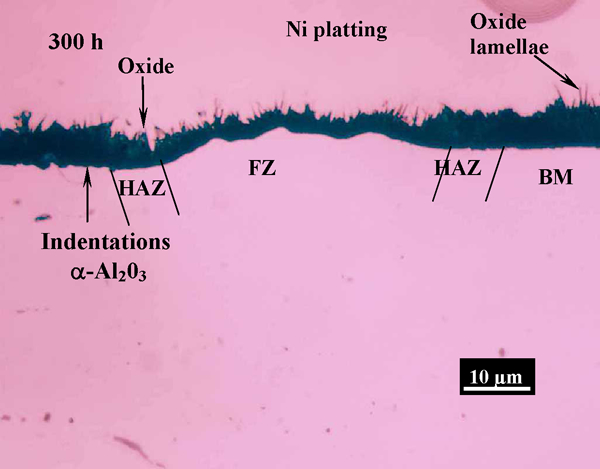
Optical micrograph of polished cross-section of WPE sample oxidised at 900°C for 300 h; oxide thickness over FZ is much thinner than that over BM; interface at FZ is smooth but with much undulation, while interface at BM remains flat but with indentations typical of α-Al2O3 nucleation, thereby marking advanced stage of oxidation. Oxidation kinetics data over FZ were slower than those over BM (WPE: sample with WS perpendicular to loading axis; HAZ: heat affected zone; FZ: fusion zone; BM: base material)
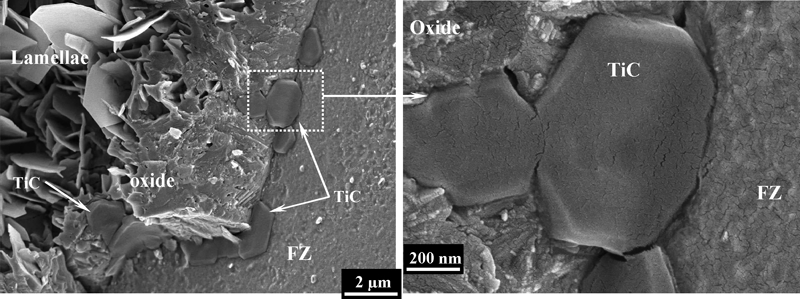
Flat and wide titanium carbide (TiC) particles that precipitated and spread under oxide layer after 300 h of exposure at 900°C, which would contribute to slowing down oxidation kinetics
However, that the FZ demonstrated higher kinetics at 950 and 1000°C than did the BM could be attributed to the high enrichment of rare earth elements at the FZ surface. In fact, Mischmetal could cause significant mitigation of the phase transformation of metastable alumina in platelet-like morphology to the stable alpha phase.49 This in turn could lead to an important increase in the mass gain over the FZ compared to that in the BM, but only during the transient stage of oxidation. After the transient stages, when alpha formation was completed, the kinetics over the BM and FZ were nearly the same.
At higher temperatures, the thickness of the metastable alumina layer formed at the initial stages of oxidation was substantially smaller than that formed at lower temperatures. Hence, the effect of the Mischmetal in slowing down the phase transformation of metastable alumina would be seen in the range of very high temperatures; the BM and FZ oxidised at nearly the same kinetics.
Thermomechanical behaviour
In tensile strength, the WPE containing 45% of bead on plate exhibited substantially superior yield stresses and hardening rates at 25 and 500°C (Fig. 12). If the stress–strain curves of the FZ were to be calculated by the inverse method, the differences would be much higher. The difference in tensile strength peaked at 500°C, since the BM softened while the FZ still showed hardening. The fine precipitation improved the mechanical properties by precipitation hardening. The WPE and WPA samples exhibited the same behaviour for all temperatures, and the yield point effect that systematically occurred in the BM stress–strain curves was eliminated for the WPE and WPA samples.
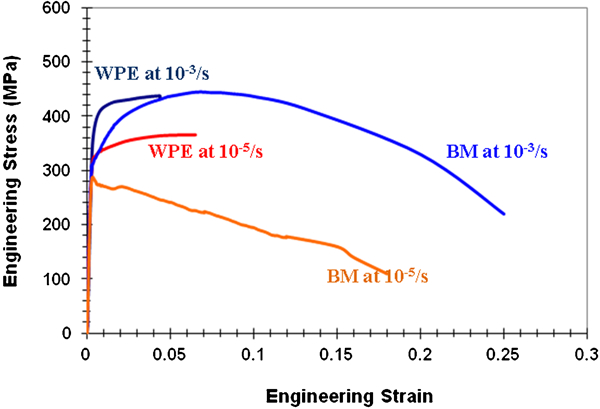
Engineering stress–strain curves at temperature of 500°C and two strain rates of 1×10⁻³ s−1 and 1×10⁻⁵ s−1 for BM and WPE sample containing 20% of WS
However, the ductility was much lower with the WPE than the BM. This may be connected to the creation of high internal stresses at the FZ/BM interface due to the strain incompatibility between the hard FZ and the soft BM. This incompatibility should be augmented by the residual stresses in the HAZ.
In contrast, creep tests at 900°C revealed that the FZ crept at much higher rates than the BM. This difference was more pronounced for the WPA sample than for the WPE one, which could be attributed to the solidification texture and grain morphology oriented perpendicularly to the loading axis for the WPA sample. The AlN induced strengthening effect observed in tensile strength did not have much effect in creep loading, probably because of coalescence of those particles. The lower creep properties in the FZ could be attributed mainly to the absence of secondary recrystallisation (grain growth) in the FZ as compared to that in the BM.39 Full details on the treatment and quantification of the creep behaviours of the weld and base metal are given elsewhere.50 The grain boundaries were pinned at the straight FL, inhibiting them from shifting under a gradient of local curvature. The difference between the results reported here and those reported by Germidis51 could be explained by the finer microstructure of the BM in the current study.
Durability engine bench results
To test the performance of the alveolar structure consolidated by laser welding, laser welded honeycomb structures were analysed under simulated road conditions reproduced in the ArvinMeritor-Rosi laboratories through the durability engine bench. These tests consist of accelerated aging in a hot thermal cell which vibrates at high temperature. The aging cycles follow thermal cycling setpoints collected from real road conditions. Post-aging exterior cross-sections of two prototypes consolidated by capacity discharge welding and six-line laser welding are shown in Fig. 13. Visual observation of the structure strain field of both prototypes reveals that the laser welds presented higher performance. In fact, the foils in the honeycomb monolith consolidated by capacity discharge welding peeled off along the planes of contact without perceptible deformation of the cells. In contrast, the laser welded structure remained cohesive along the laser line, and it is only the BM that deformed with significant sagging of the corrugated channels.40
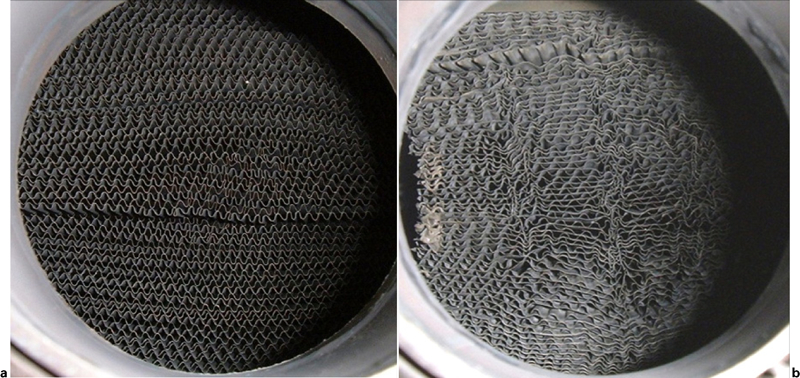
Exterior cross-sections, after engine bench durability test simulating road conditions, of a capacity discharge welded honeycomb prototype and b laser welded honeycomb prototype with six alternating beads
Conclusions
Laser welding on thin ferritic foils of FeCrAl alloys was performed using several laser techniques, including pulse and continuous wave modes, to assess the feasibility of the welding processes during the conformation of the corrugated structure for automotive catalytic converters. The laser welds were mechanically tested under shear in tension to determine the limit welding diagrams for all laser welding techniques. The results showed that spot welding in conduction mode with large beam diameters was compatible with two/three foils lap joint welding from the CF, but systematically induced detrimental sinking, cracking, porosity and Al depletion. With smaller beam spots, hot cracking phenomena were systematic. An ultrafine keyhole in continuous mode welding was obtained with a CO2 laser delivering a beam diameter of 80 μm. Creep and oxidation tests were performed on the FZ and BM to compare the performance of the welds with that of the BM. Because it offers excellent weldability, this laser was used to consolidate simplistic honeycomb structured prototypes. The prototypes were then subjected to various tests to analyse weld strengths and the effectiveness of the laser welding processes. Substantial alteration of the oxidation kinetics on the FeCrAl foil was observed in the FZ in a TGA furnace. High free carbon in the FZ matrix led to extensive carbide precipitation on the oxide/FZ interface at 900°C, which slowed oxygen diffusion and improved the oxidation kinetics with respect to those for the BM. However, Mischmetal enrichments at the FZ free surfaces mitigated the transformation kinetics of the fast growing metastable alumina, causing an acceleration of the oxidation kinetics at 950 and 1000°C. At all temperatures, the FZ exhibited better tensile properties than the BM, but crept significantly faster at 900°C. Simple honeycombed structured prototypes, consolidated with the laser due to its excellent weldability, demonstrated higher performances under durability engine bench tests than those fixed by capacity discharge welding techniques.
Footnotes
Acknowledgements
The authors are grateful to the financial support provided by Marc Dubus and Jean Favennec at ArvinMeritorRosi. The authors are also thankful to Jean-Bartout Dominique and Jean-Pierre Trottier for their technical support throughout the period of the project.