
Abstract
Alloy 690 is a Ni–Cr–Fe type alloy with a widespread application in nuclear power plants. However, the companion filler metal 52M (FM-52M) is susceptible to ductility dip cracking (DDC), which seriously affects safety and life extension in nuclear application. To provide a better understanding of DDC formation in the varestraint test, local strain is adopted to assess materials resistance of DDC instead of average bending strain. In this work, spot varestraint tests of FM-52M were performed with an average strain (0·25–7%). Then, a thermomechanical simulation of the spot varestraint tests was modelled based on the experiment. The simulation obtained preferential propagation orientation of DDC and accumulated strain increment during a susceptible temperature range. Simulated local strain caused at an elevated temperature is much larger than the average strain. Besides, prediction of DDC distribution agrees well with experimental results. The finite element model presents a clear local strain distribution and provides an extra understanding of DDC formation.
Introduction
Weldments of Ni based alloys are prone to hot cracking, such as solidification cracking, liquation cracking and ductility dip cracking (DDC). Ductility dip cracking is a solid state intergranular cracking mainly generated in reheated weld.1 Most DDC susceptible materials have a face centred cubic and/or austenitic microstructure, such as austenitic stainless steel and Ni based alloy.2– 6 Alloy 690 is a Ni–Cr–Fe type alloy with excellent high temperature performances and is widely used in nuclear power application. However, the filler metal 52M (FM-52M) used in alloy 690 weldments is susceptible to DDC, which seriously affects the safety and life extension in nuclear application.7– 8 According to this problem, some evaluation tests have been developed to assess the DDC susceptibility of materials, such as the Gleeble based strain to fracture (STF) test9– 10 and the spot varestraint test. Among these tests, the spot varestraint test is a commonly used method to evaluate DDC susceptibility in welding condition.
Researchers originated the varestraint test in the 1960s.11, 12 Afterwards, the spot varestraint test was modified in hot cracking assessment, especially in hot cracking classification.13– 17 With a controlled bending strain applied, critical strain when crack began to propagate was defined as materials resistance of hot cracking. The hot cracks generated at the gas tungsten arc welding arc spot were classified into solidification cracks, liquation cracks and ductility dip cracks. Among them, ductility dip cracks were generated away from the fusion line. The assessment was accomplished by measuring the ductility dip temperature range, total crack length and crack quantity. Nishimoto et al. 18, 19 have studied the hot cracking susceptibility of improved filler metal of alloy 690. In his research, the ductility dip temperature range was about 1350–1600 K. It was reported that sulphur and phosphorus had an embrittlement effect on grain boundaries, while a recovery happened with lanthanum additions.20, 21 Kikel and Parker16 have reported that orientation of grain boundaries and the applied strain affected cracking propagation in Ni based alloys. Chung et al. 22 have reported that lower contents of sulphur and phosphorus reduced solidification cracking susceptibility of FM-52 and FM-52M weld overlay on 316L stainless steel. In addition, FM-52M weld had a better cracking resistance compared with FM-52. According to the researches above, it is believed that spot varestraint test is well capable of evaluating DDC susceptibility under simulated welding conditions.
However, the average bending strain adopted to assess DDC resistance in the spot varestraint test has a limit when presents local strain distribution. The measurement of critical strain is based on the assumption of pure bending. During the test, thermal expansion and softening of material result in a non-uniform distribution of strain attributed to welding heat. It is difficult to describe precisely the local strain concentration where DDC is generated. Meanwhile, assessment of DDC susceptibility, such as crack quantity and total crack length, changes with welding parameters. The assessment has a limited application on various welding condition. Therefore, average bending strain in the spot varestraint test has to be modified to local strain distribution.
Currently, a large amount of research has been performed on investigation of DDC mechanisms. Several hypotheses have been proposed to describe DDC mechanisms, including grain boundary sliding, intergranular impurity element and intergranular precipitation.12,18,19,22– 32 Ramirez and Lippold28, 29, 32 reported that DDC in Ni–Cr–Fe type alloy was caused by a creep-like mechanism associated with grain boundary sliding. With increasing the grain boundary sliding, void accumulation induced crack initiation. Some researchers have found that ductility dip cracks were commonly generated with an angle of 45–90° to the load direction. According to the experimental result, grain boundary vertical to loading was most preferential for crack propagation.16, 23, 24, 32
In this paper, a three-dimensional (3D) thermomechanical spot varestraint model is developed based on finite element method (FEM). The local strain distribution instead of average strain in the reheated weld metal is adopted to describe DDC susceptibility. Ductility dip temperature range is obtained by simulated temperature distribution. In addition, the critical strain of DDC susceptibility prediction is compared with test results.
Material and spot varestraint test
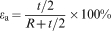
The material used in the present work is a commercial FM-52M; the chemical composition is 59·54Ni–0·02C–0·8Mn–30·06Cr–8·22Fe–0·001S–0·003P–0·224Ti–0·11Al–0·09Si–0·02Cu–0·84(Mo+Nb) (wt-%). Overlay welding with FM-52M strip (width is 60 mm) was performed on a low carbon plate, and a 12 mm thick overlay was fabricated, as shown in Fig. 1a. Once the welding was complete, specimens were cut from overlay material by wire cutting machine. The upper surface of overlay material was performed using the spot varestraint test. The final dimension of specimens is 120×40×6 mm. Figure 1b shows the spot varestraint test procedure. The specimen was fixed by clamps during the test, and thermocouples were fixed on the specimen in advance. Then, a gas tungsten arc welding was performed under the welding condition: arc current, 80 A; arc voltage, 15 V; holding time, 10 s. Once the welding was finished, the specimen was bent against the arc shape die at a speed of 0·1 m s−1. The average strain loaded on the upper surface of the specimen is calculated according to equation (1)
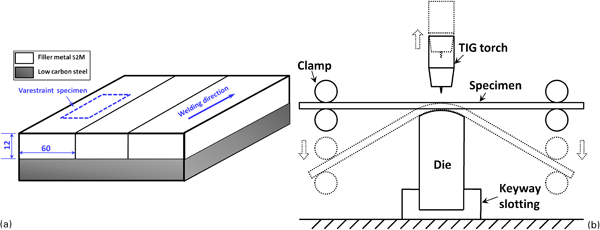
Schematic illustrations of material preparation and spot varestraint
Applied average strain and curvature radius of die

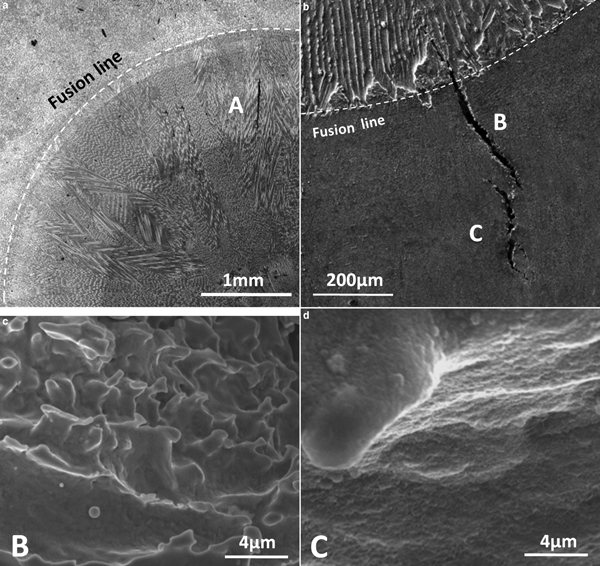
In the procedure, thermocouples were set to record temperature history. Later, optical microscope and scanning electron microscope (SEM) were used to observe crack morphology. The FM-52M microstructure was corroded by 10 wt-% chromic acid. Figure 2a and b shows the microstructure of overlay material and reheated weld metal. In the centre of steady strip weld, dendrite grows up from the bottom surface to the top. In that case, the upper surface of the specimen has a similar equiaxed grain appearance with dispersive orientation of grain boundaries (Fig. 2c).
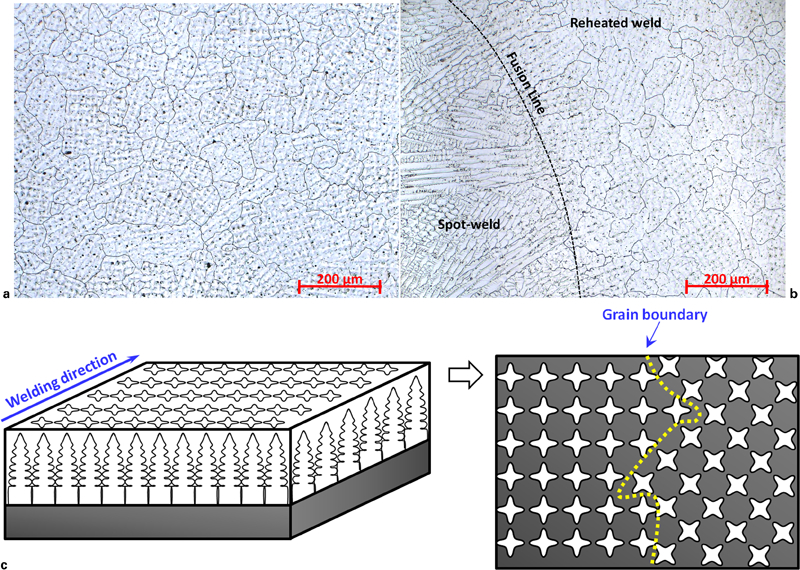
Microstructures of FM-52M
Finite element modelling of spot varestraint test
Based on the experimental conditions, a three-dimensional model of the spot varestraint test was built up with ABAQUS software. The model contains two parts: specimen and arc shaped die, as shown in Fig. 3a. The curvature radius of die ranges from 39·9 to 1197 mm, corresponding to nine different average strains (0·25–7%, as shown in Table 1). The element model of specimen is shown in Fig. 3b. To simulate local strain distribution during DDC susceptible temperature range, element size in region around the fusion line is controlled within 60 μm. Sequential coupling calculation was used in the three-dimensional thermal elastic–plastic model. The simulation is divided into three steps:
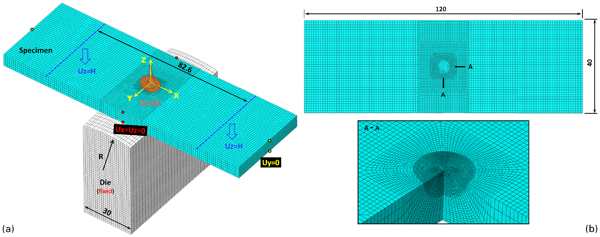
Schematic illustrations of spot varestraint model
11 s spot welding (1 s for arc starting, 10 s for arc holding)
bending specimen at a speed of 0·1 m s−1
cooling for 500 s.
The boundary condition is shown in Fig. 3a.
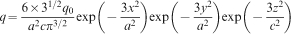
Ambient temperature used in thermal calculation is 298 K (convection and radiation heat transfer is taken into account). A modified heat source was used based on double ellipsoid heat source model,33 according to equation (2)
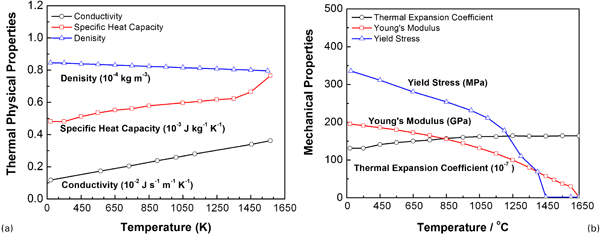
Material constants used in thermal elastic–plastic modelling
Welding heat resource fitting
In this paper, pattern search method was used to fit spot weld heat source. 34 34,35 As the welding condition is confirmed, parameters to be adjusted are as follows: heat power q0, heat radius a, heat depth c and height of heat source centre h, where q0 = ηUI.
The principle of pattern search method is to calculate a series of values Ro, R1, R2, …, which gradually approach the optimal value. When tolerance of objective function is met or increment is beneath the set minimum increment, the last search value Rn is taken as the final solution. A proper increment of each search step contributes to calculation convergence speed.
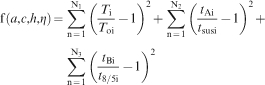
To simulate the susceptible temperature of DDC, the Tmax and tsus (cooling time of susceptible temperature range, until 1273 K) from the spot varestraint test were used to fit temperature calculation. For regions away from the fusion line, t8/5 (cooling time from 1073 to 773 K) instead of tsus was taken for temperature history fitting. The objective function is shown in equation (3)
The liquidus temperature of FM-52M is 1611 K.12 As shown in Fig. 5a, the shape of weld pool agrees with microstructure. Besides, temperature history measured by thermocouples is consistent with simulated result. The simulated and measured results are compared in the Fig. 5b.
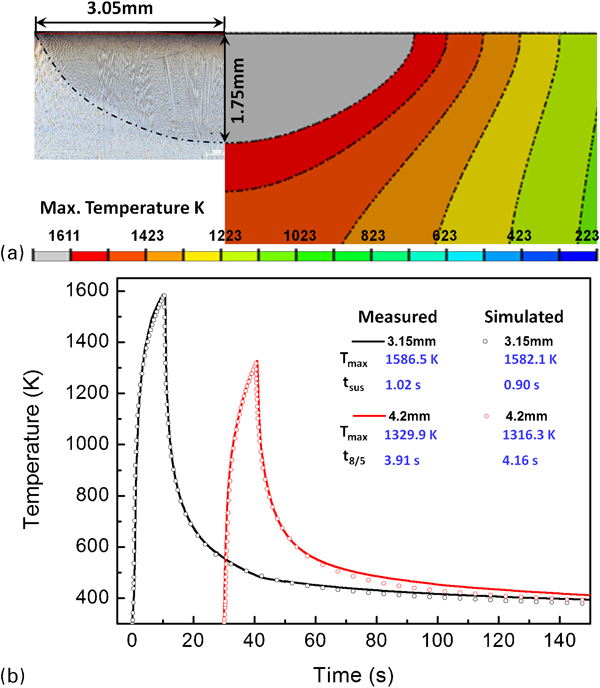
Comparison of simulated and measured temperature
Evaluation of DDC susceptibility of FM-52M
In the spot varestraint test, cracks on specimen surface are classified into solidification cracks, liquation cracks and ductility dip cracks, as shown in Fig. 6. Solidification cracks are much larger and appear within the arc spot (A type cracks in Fig. 6). Both ductility dip cracks and liquation cracks (C and B type cracks) occur in reheated weld metal. Ductility dip cracks appear away from the fusion line, while liquation cracks occur beside the fusion line. To identify the two kinds of cracking, SEM was used to observe the fracture of cracks. The high temperature side of liquation cracking fracture has a trace of melting.3, 18, 20 In this paper, only DDC is concerned. The crack length ranges from 100 to 500 μm. Most of these cracks are 45–90° to bending direction. Based on experimental results, it is assumed that the DDC appears where local strain is beyond the bearing capacity of material.
Classification of cracking in spot varestraint test
Ductility dip temperature range
As observed by SEM, ductility dip cracks are generated within 786 μm away from the fusion line. By fitting the temperature distribution, temperature where 786 μm away from the fusion line is 1302·2 K at the end of bending. As DDC only appears in grain boundary without trace of melting, it is assumed that the ductility dip temperature range of FM-52M is 1302·2–1598 K (1598 K is the solidus temperature) in the spot varestraint test.12
Local strain distribution during spot varestraint test
In the test, plastic deformation consists of two components: plastic strain caused by welding heat and loading strain caused by bending procedure. With non-uniform temperature distribution on the specimen during welding, a thermal strain gradient will be generated by temperature dependent expansion, which results in concentrated plastic strain. The plastic strain distribution resulting from a 4% average bending strain is shown in Fig. 7. Coupled strain along the radius of arc spot has an identical distribution with welding strain in transverse direction, as shown in Fig. 7a. Along this direction, concentrated plastic strain overlays with bending deformation beside the fusion line. The coupled strain of welding and bending increases. However, along longitudinal direction, welding strain surrounding the fusion line overlays with bending deformation inversely, as shown in Fig. 7b. The coupled strain of two procedures decreases in the reheated weld metal. By overlaying welding and bending deformation, strain distribution on the specimen surface is non-uniform, as shown in Fig. 8a. Concentrated coupled strain is much more than nominal average strain.
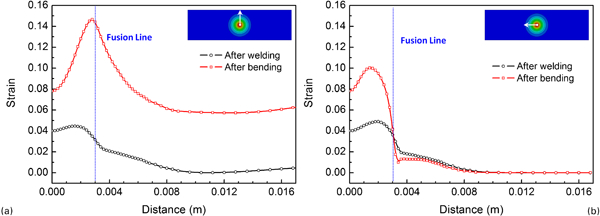
Plastic strain along radius of arc spot at end of welding and bending process (average bending strain is 4%)
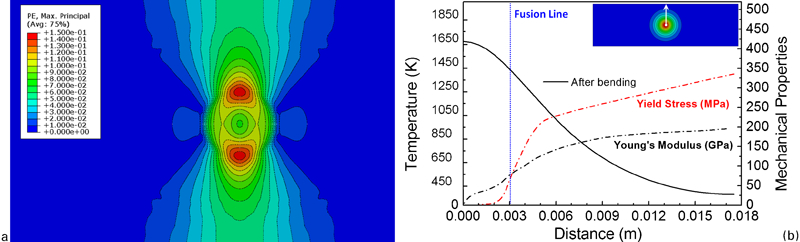
Local strain distribution on upper surface of specimen (average bending strain is 4%)
After welding, high temperature concentrates on the specimen surface (Fig. 8b). However, the temperature dependent mechanical properties of FM-52M show a reverse tendency compared with temperature distribution. The closer to the arc spot centre, the softer the material exhibits. During bending, the softer part has a larger deformation. The simulation result gives a clear strain distribution of coupled welding and bending condition.
Critical strain of DDC in spot varestraint test
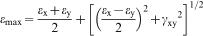
By the test result, DDC is assumed to appear where local strain exceeds the material bearing capacity at ductility dip temperature range. According to the spot varestraint test, strain distribution on the upper surface of specimen dominates DDC formation, which is simplified as plane strain. Maximum principal strain (MPS) on the upper specimen surface is calculated according to equation (4)
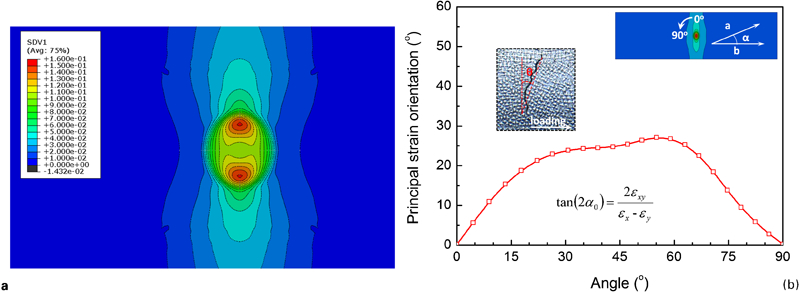
Maximum principal strain distribution and orientation at end of bending (average bending strain is 4%)
The simulation obtains the orientation of MPS. Figure 9b shows the distribution of MPS orientation along the fusion line at the end of bending (average bending strain is 4%). The angle α between the MPS orientation (a direction in Fig. 9b) and extension orientation of pure bending (b direction) ranges from 0 to 27·1°. The MPS presents the coupled effect of welding strain and mechanical strain. The orientation of plastic strain caused by welding heat is always along the radius of arc spot, while that of loading strain is consistent with extension of pure bending. At ∼60° along the arc spot, the inclined orientation of MPS reaches a peak value, 27·1°, based on the coupled effect of welding and joining.
According to some researches, grain boundary vertical to loading was the most preferential for crack propagation.16, 23, 24, 32 The orientation vertical to the loading strain was propitious for void accumulation.28, 29, 32 With a similar equiaxed grain structure of FM-52M, grain boundaries have a dispersive distribution from 0 to 90° to loading strain. According to test results, DDC is almost vertical to extension of bending at 0 and 90° of arc spot. However, from 0 to 90°, the DDC has a tendency to be inclined. The angle θ between cracking orientation and transverse direction is similar with distribution of MPS orientation. Propagation direction of DDC could present the orientation of loading strain in the spot varestraint test.
As DDC is generated within the specific temperature range, MPS increment is accumulated from the start of the ductility dip temperature range by the method shown in Fig. 10a. The sum of local MPS increment is not recorded within arc spot or beside the fusion line, where Tmax exceeds 1598 K. Solidification cracking and liquation cracking are not taken into account in this paper.
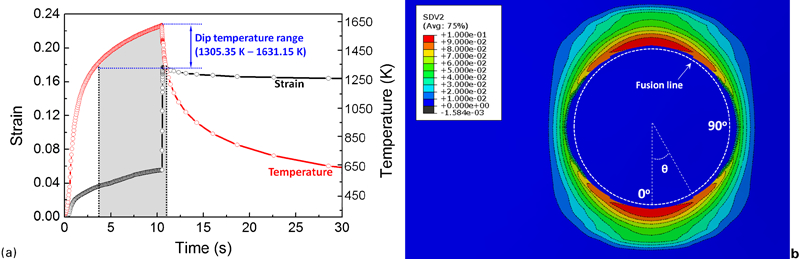
Accumulated MPS increment
Figure 10b shows the distribution of accumulated MPS on specimen surface (the average bending strain is 4%). Only accumulation of local MPS increment in the reheated weld metal was calculated. From the figure, vicinity of fusion line has strain concentration attributed to material softness within ductility dip temperature range. Besides, the accumulated MPS increment decreases along the fusion line of arc spot (from 0 to 90°, as shown in Fig. 10b). As mentioned above, the coupled effect of welding strain and loading strain increases at 0° and decreases at 90° along the reheated weld metal. The distribution of accumulated MPS is non-uniform, ranging from 9·28 to 2·77% with a 4% average bending strain. Based on simulation, the local MPS accumulation within ductility dip temperature range is related to temperature distribution. It indicates that the actual local strain distribution changes with welding parameters adopted. The modified local MPS accumulation gives a better description of DDC susceptibility in various welding conditions.
Ductility dip cracks have a distribution along the fusion line (from 0 to 90°). With a 1% average bending strain, specimen surface is free to DDC. In excess of a certain local strain, critical crack with a beginning to propagate will be observed along the fusion line. In particular, DDC generates at 360° in heat affected zone with a 7% average bending strain. The angles of regions along the fusion line, where critical cracks were observed, vary with the increase in applied average bending strain. As accumulation of local MPS increment enlarges, more ductility dip cracks arise in the heat affected zone. Meanwhile, DDC has a wider distribution along the fusion line with a larger bending strain.
Distribution of accumulated MPS is shown in Fig. 11a. With a 1% average bending strain, accumulated MPS ranges from 1·39 to 0·79% within the material capacity. However, with a 2% average bending strain, accumulated MPS ranges from 4·12 to 1·51% and DDC arises. As critical cracks are observed with an average bending strain from 2 to 6%, the cracking critical strain of DDC in the spot varestraint test is in the range of 3·56–4·12% (Fig. 11a). Figure 11b shows the angle of critical crack observed along the arc spot. To fit critical strain in the range of 3·56–4·12%, 3·64% has the minimum unbiased variance and agrees with experimental results. Therefore, the critical strain in the spot varestraint test is ∼3·64%. Based on the assumption, critical crack at 0° along the arc spot is generated with a 1·48% average bending strain. With a 6·42% average bending strain, local strain exceeds material capacity at 90° along the arc spot.
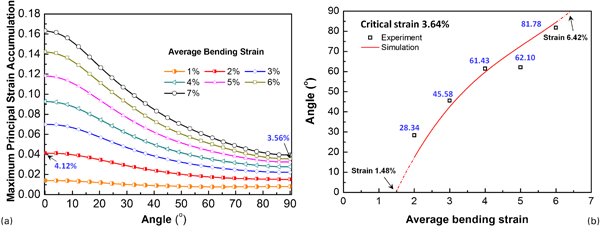
Maximum principal strain increment and critical crack distribution
Conclusions
The coupled thermomechanical model of the spot varestraint test of FM-52M is developed to study the DDC susceptibility in the viewpoint of local strain concentration. At first, a temperature distribution agreeing with experiment is fabricated by pattern search method. Then, local strain distribution of the spot varestraint test is presented by coupled thermomechanical modelling. With concentrated heat input, local strain concentration attributed to softening of material stiffness is much greater than the nominal average bending strain. Combined with the spot varestraint test, the ductility dip temperature range of FM-52M is confirmed as 1302·25–1598 K. Then, MPS on the specimen surface is adopted to evaluate DDC susceptibility. The orientation of MPS ranges from 0 to 27·1°, which is vertical to preferential orientation of DDC propagation. In addition, accumulation of MPS increment within ductility dip temperature range is compared with experimental results. When assuming 3·64% as critical strain of DDC, the prediction of critical DDC appearing takes on an identical tendency agreeing with experiment. By the FEM modelling, DDC orientation and DDC distribution in the spot varestraint test are predictable in the viewpoint of MPS accumulation with FEM.
Footnotes
Acknowledgements
The present work is supported by the National Natural Science Foundation of China (grant no. 51204107 and no. 50975176).