
Abstract
Three API 5L X70 steels with different Ti and N contents and otherwise identical chemistry were selected to investigate the effect of Ti/N ratio on the toughness in coarse grained heat affected zone (CGHAZ). A Gleeble 3500 thermomechanical simulator was used to simulate the thermal profile of CGHAZ of double submerged arc welding process. The microstructure was examined by optical microscopy. Statistics of CGHAZ grain coarsening were compiled by measuring the prior austenite grain size. Toughness of the simulated CGHAZ regions was evaluated by Charpy V-notch testing at −20 and −40°C. Morphology of the impact fracture surface was investigated using SEM. Steel B with Ti/N ratio of 3·22 (slightly below stoichiometric) showed slightly higher toughness in the simulated CGHAZ due to higher volume fraction of austenite grains less than 80 μm in diameter.
Keywords
Introduction
High strength pipelines are used for long distance cross-country pipelines transporting crude oil and natural gas hence excellent toughness is a priority.1 High toughness can be achieved in plates and pipe body by employing clean steelmaking practices, modern thermomechanical controlled processing technology and carefully designed alloy composition. However, during welding the toughness in heat affected zone (HAZ), especially coarse grained heat affected zone (CGHAZ), is sharply deteriorated due to the microstructural changes (such as grain coarsening and precipitates dissolution/coarsening) resulting from weld thermal cycle. Therefore, it is desirable to develop an effective strategy to improve the HAZ toughness and this has been objective of many research studies.2– 7
It is widely accepted that a small addition of Ti can markedly improve HAZ toughness by the formation of stable finely dispersed TiN precipitates that restrict austenite grain coarsening at high temperatures.8– 10 However, the optimal additions of Ti, N and their ratio to achieve improved HAZ toughness have not been identified. The proposed maximum level of Ti and Ti/N ratios are sometimes inconsistent and even controversial. For example, for the purpose of controlling HAZ toughness API 2W and API 2H limit Ti to 0·02 wt-% (with Ti/N = 2). API 5L allows maximum 0·06 wt-%Ti without particular control of Ti/N ratio. Moreover, some supplementary specifications impose an upper limit of Ti content to 0·025 and even 0·020 wt-%. Some suppliers however resist the specification limit of Ti/N ratio. Different published researches carried out previously in attempt to identify optimum Ti and Ti/N is summarised below. From these results it is obvious that the optimal proposed Ti/N ratios to improve CGHAZ toughness are not in agreement and are a subject of debate. Kejian and Baker11 claimed that in microalloyed steel plates excellent toughness can be obtained with a hypostoichiometric Ti addition (Ti/N = 2), and did not report any advantage of hyperstoichiometric ratio. Penniston et al. 12 also found that the lowest 50% fracture appearance transition temperature was achieved at a Ti/N ratio close to 2 in HAZ of gas metal arc welded X70 grade steel. On the other hand, Smaill et al. 13 and Mukae et al. 14 indicated that in low C–Mn steels improved toughness was obtained at stoichiometric ratio.
The literature on this subject is vast and complex, and many different Ti/N ratios have been claimed to deliver optimum HAZ toughness. Due to the various discrepancies (for example, the alloy design, thermal history, experimental conditions, etc.), it is very difficult to directly compare the results published in different literature sources. Therefore, the role the different Ti, N contents and their ratios play in evolution of HAZ toughness of pipeline steels is not clear. Hence, the objective of this work was to systematically evaluate the microstructure and mechanical properties of simulated CGHAZ of three steels with identical chemistry varying only in Ti, N content and Ti/N ratio. This paper presents preliminary results of the extensive investigation carried out under the auspices of Energy Pipelines Cooperative Research Centre in Australia.
Experimental
The materials used in this study were API X70 microalloyed pipeline steels. The chemical composition of the three studied steels is shown in Table 1. The materials were sectioned from 1067 mm double submerged arc welding (DSAW) UOE pipe with wall thickness of 14·1 mm. The welding parameters of the DSAW process are shown in Table 2. It should be noted that the heat input mentioned here is an average value. Thermal cycles calculated from this heat input were used for HAZ simulation. A comparison of microstructure and properties of real weld HAZ with simulated HAZ reveals that consideration of average heat input is sufficient. More discussions are in the latter part of the paper.
Chemical composition of X70 steels*/wt-%
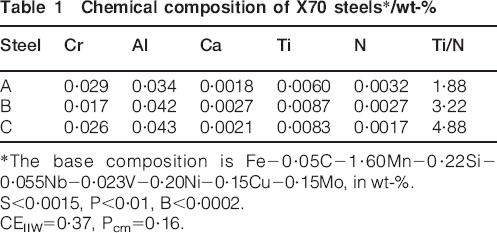
*The base composition is Fe−0·05C−1·60Mn−0·22Si−0·055Nb−0·023V−0·20Ni−0·15Cu−0·15Mo, in wt-%.
S<0·0015, P<0·01, B<0·0002.
CEIIW = 0·37, Pcm = 0·16.
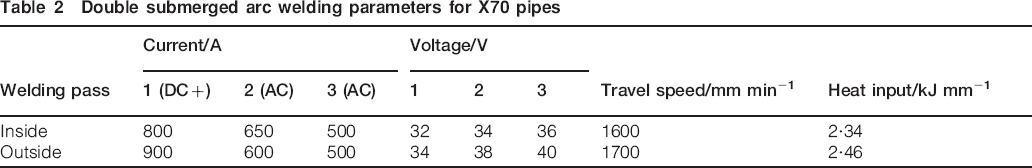
Double submerged arc welding parameters for X70 pipes
In case of real weldments the CGHAZ region that exhibits deteriorated toughness is very narrow. Thus it would be extremely difficult to subject this specific region to mechanical testing without encountering interference from adjacent areas. Gleeble thermomechanical simulation is an excellent tool to reproduce a large volume of material which has experienced the same thermal cycle as real weld CGHAZ. The specimens subjected to thermal simulation possessed dimension of 10×10×90 mm and were machined from pipe body. To achieve good temperature control during simulation, K-type thermocouple was spot welded to the middle (Fig. 1b) of the sample. The appropriate thermal cycles were designed using the Rykalin-2D model and the parameters were adjusted to produce microstructure identical with CGHAZ of real DSAW joints subjected to 2·5 kJ mm−1 heat input. The parameters of the thermal cycles were selected on the basis of the actual DSAW process. Figure 1a shows the thermal cycle that the samples were subjected to during simulation. Cooling time from 800 to 500°C (Δt8/5) of 38·5 s was employed.
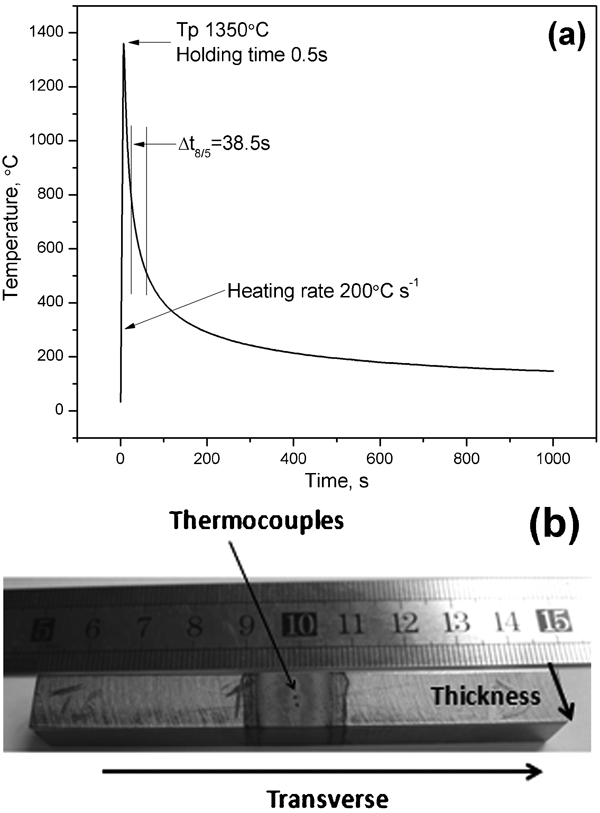
a thermal cycle for simulated CGHAZ and b samples after Gleeble simulation
One sample from each Ti/N ratio was prepared according to standard preparation procedures for microstructure observation using an optical microscope. Hardness was tested at the centreline of specimens using Vickers diamond and 1 kg load. The presented hardness value is an average value of five measurements. To evaluate the prior austenite grain size, the specimens were repolished and then etched using picric acid containing several drops of detergent at 68°C for about 3 min. Grain size was measured by computer program using planimetric method.
The simulated samples were machined to Charpy V-notch bars with dimension of 10×10×55 mm with T−L notch orientation (refer to ASTM E23). Charpy impact toughness tests were conducted at −20 and −40°C according to ASTM E23. The fracture surfaces were analysed by using SEM.
Results
The optical micrographs of the simulated and real weld CGHAZ of the three steels with different Ti/N ratios are shown in Fig. 2. It can be observed that the microstructure of simulated HAZ is close to that of as deposited CGHAZ. The micrographs of simulated CGHAZ displayed in Fig. 2 revealed the prior austenite grain boundaries. Bainitic ferrite with parallel laths was observed to be the main constituent. A small amount of fine M−A islands were observed to be aligned in between the ferritic laths of bainite. These M−A islands are a mixture of martensite and retained austenite formed during the cooling process and are commonly reported to form in CGHAZ of this type of steels.6 It is worth to note that from the micrographs presented in Fig. 2, no significant influence of Ti/N ratio on the type and morphology of phase constituents was found.
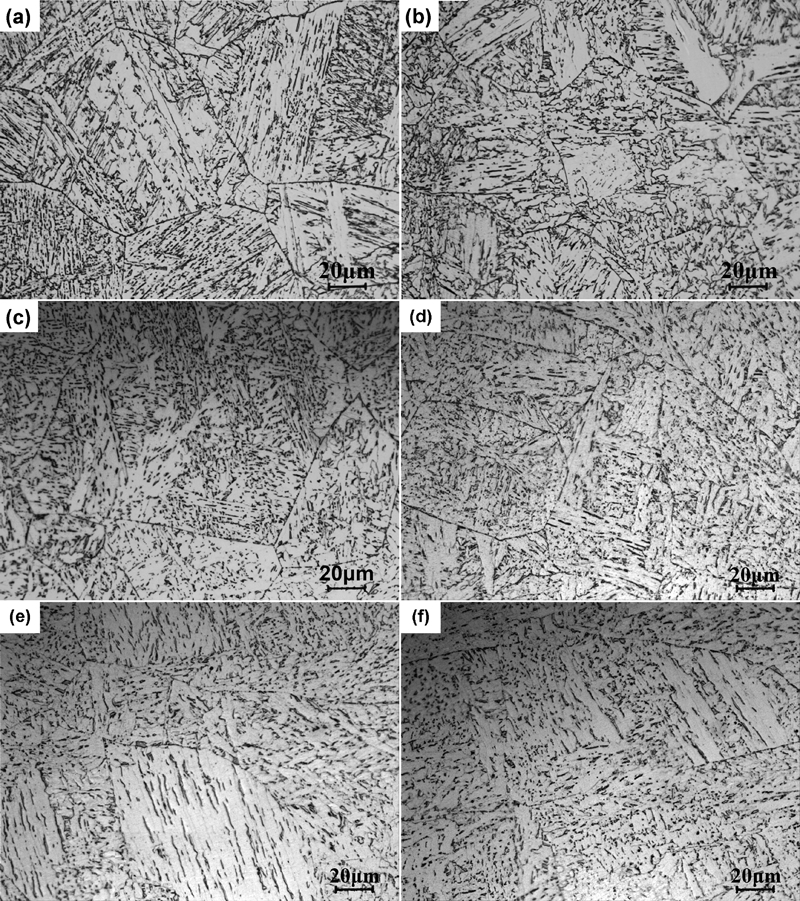
Comparison of optical micrographs of simulated CGHAZ and real weld CGHAZ containing different Ti/N ratios: simulated CGHAZ of a Steel A (Ti/N 1·88); b Steel B (Ti/N 3·22); c Steel C (Ti/N 4·88); CGHAZ in real welds of d Steel A (Ti/N 1·88); e Steel B (Ti/N 3·22); f Steel C (Ti/N 4·88). Micrographs of real welds are taken at position adjacent to inflection of fusion line in outer pass
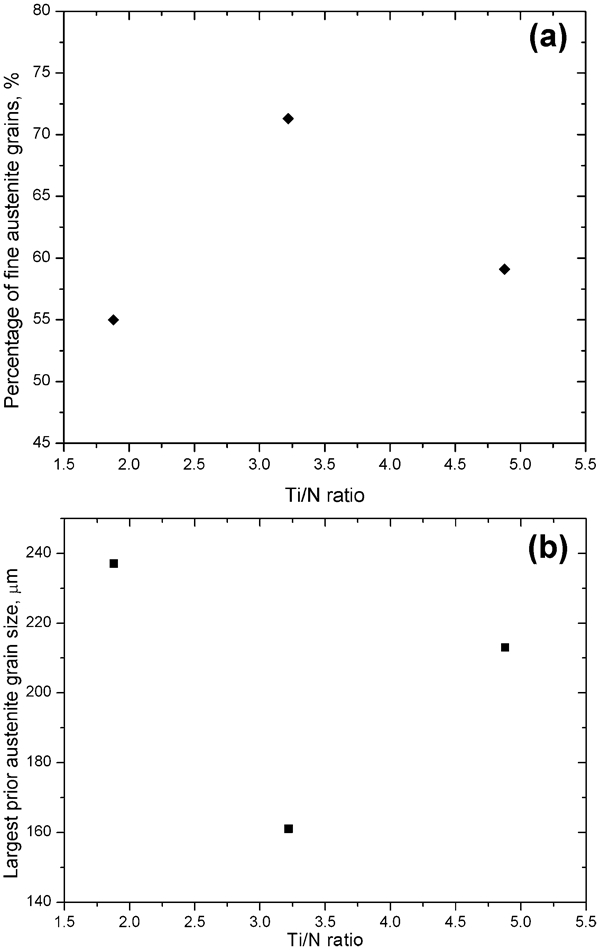
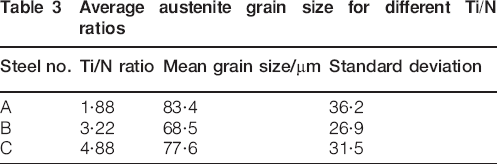
To investigate the effect of Ti/N ratio on the simulated CGHAZ further, prior austenite grain size was measured. The obtained results are presented in Fig. 3. Compared to Steel A and Steel C, Steel B exhibited a more concentrated grain size distribution. The mean grain size as well as standard deviation is tabulated in Table 3. Steel B with Ti/N ratio of 3·22, slightly below the stoichiometric (3·42), exhibited the smallest austenite grain size followed by Steel C (Ti/N ratio 4·88) and Steel A (Ti/N ratio 1·88). While assessing the mean grain size of the three steels, which is approximating to 75 μm, one could infer that Ti/N ratio has no effect whatsoever. However, given the relatively large standard deviation it may not be correct to compare just the mean grain size. Hence the fraction of fine and coarse grains was evaluated. The percentage of fine grains (i.e. smaller than 80 μm) and the coarsest grain in simulated CGHAZ as well as the largest prior austenite grain size are shown in Fig. 4a and b respectively. It is interesting to note that Steel B had the highest fraction of fine grains (0·71), while Steel A and Steel C had 0·55 and 0·59 fractions respectively. Also, the coarsest grain diameter in Steel B was 161 μm which is smaller than that observed in Steel A (237 μm) and Steel C (213 μm). Steel B hence has the largest percentage of fine grains and smallest coarse grain diameter among the three steels.
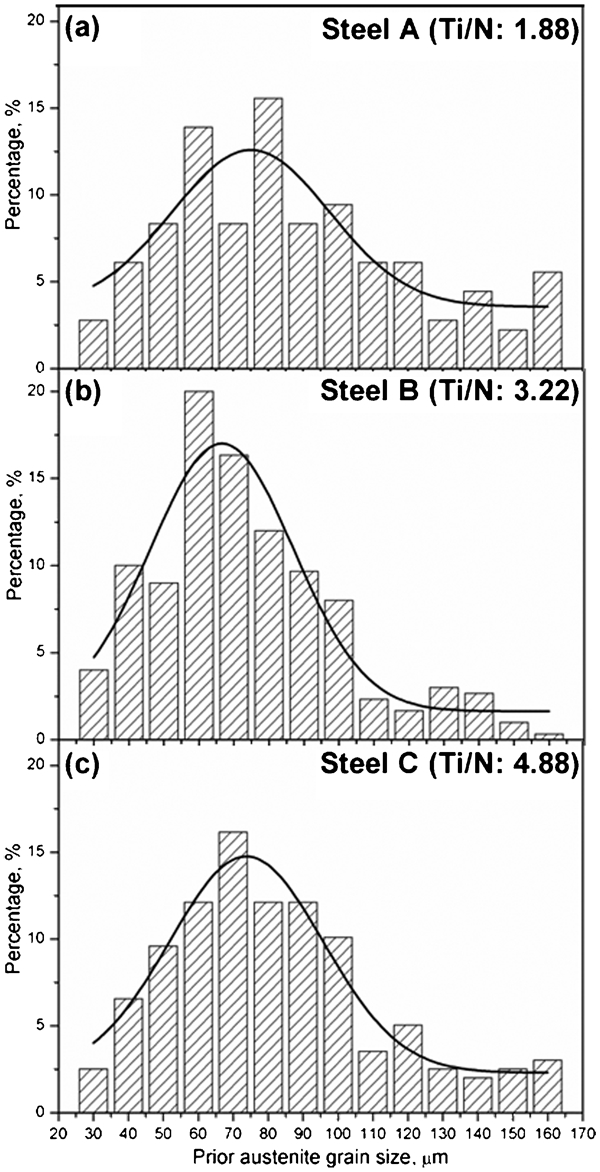
Distribution of prior austenite grain size in simulated CGHAZ for different Ti/N ratios
Results of statistical analysis of prior austenite grains size in steels with different Ti/N ratios
Average austenite grain size for different Ti/N ratios
The hardness testing data of simulated CGHAZ and real weld CGHAZ for different Ti/N ratios are shown in Fig. 5. It can be seen that the hardness of simulated CGHAZ is almost identical with the real weld CGHAZ, affirming excellent accuracy of CGHAZ simulation. Additionally, no significant fluctuation of the hardness values was observed and the average hardness of all three steels was ∼210 HV. These results indicate that Ti/N ratio in the studied range does not influence the hardness of CGHAZ.
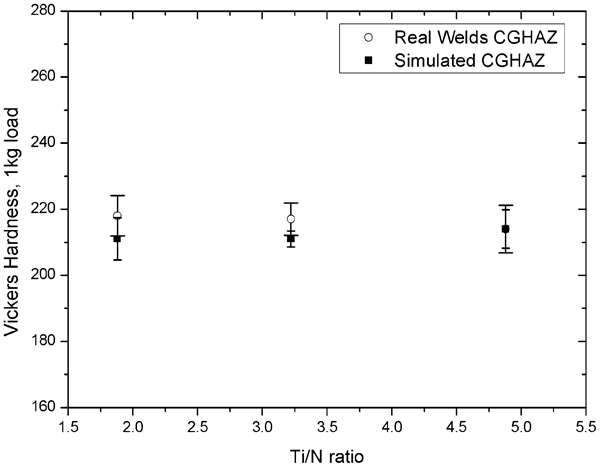
Vickers hardness of simulated and real weld CGHAZ
Figure 6 displays the variation of Charpy V-notch impact energy measured at −20 and −40°C. At both testing temperatures Steel B exhibited higher absorbed energy. As expected the absorbed energy at −40°C was lower than that of −20°C for all specimens. However, the impact energy values at −20°C were much more scattered than that at −40°C. Possible explanation is that −20°C is in the ductile−brittle transition temperature range for this material, but further testing is required to confirm this. The SEM fractographs of the Charpy impact specimens are presented in Fig. 7. It can be seen that the predominant fracture mode in all the samples at the testing temperatures −20 and −40°C was cleavage. From the river patterns in the field of view, the radial river lines can be identified.
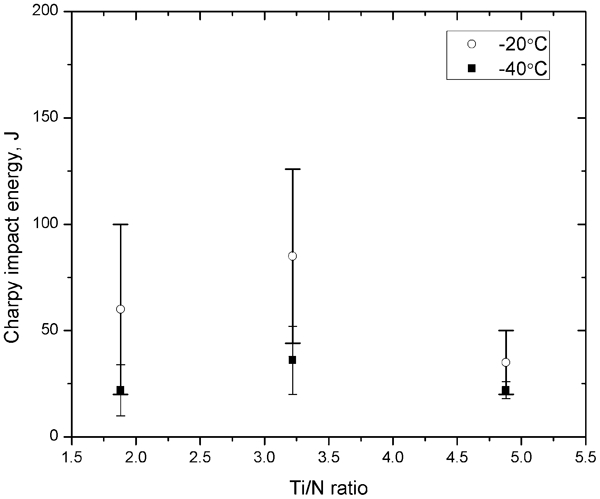
Mean Charpy impact energy of simulated CGHAZ of samples having different Ti/N ratios. Each point is an average of three measurements
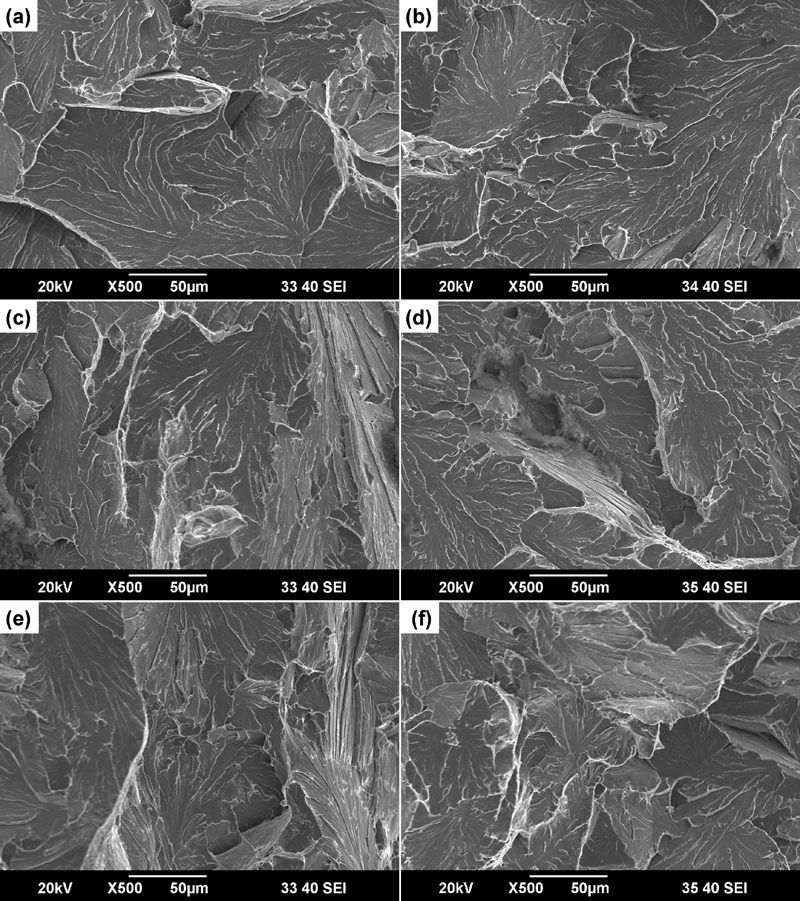
Fractographs (SEM) of Charpy impact simulated CGHAZ
Discussion
The CGHAZ microstructure of all simulated X70 steels over the studied range of Ti/N ratios was very similar and contained bainitic ferrite with a small amount of M−A constituent. In addition, the transformation start temperature of the investigated steels was calculated from thermodynamics based on chemical composition and process parameters.15, 16 The experimental cooling curve used for CGHAZ simulation was superimposed on the calculated diagram (Fig. 8). From this diagram it can be seen that bainite is the predominant phase produced from the CGHAZ welding simulation. This is in good agreement with the findings of the microstructural observation. The microstructural investigation also revealed the presence of M−A constituent. This constituent is formed during cooling when carbon diffuses from the bainitic ferrite into austenite stabilising the latter. Upon further cooling to below the martensite start temperature (Ms) austenite partially transforms to martensite. This mixture of transformed martensite and untransformed retained austenite (M−A constituent) presents a potential crack initiation site and thus has a significantly adverse effect on HAZ toughness.6
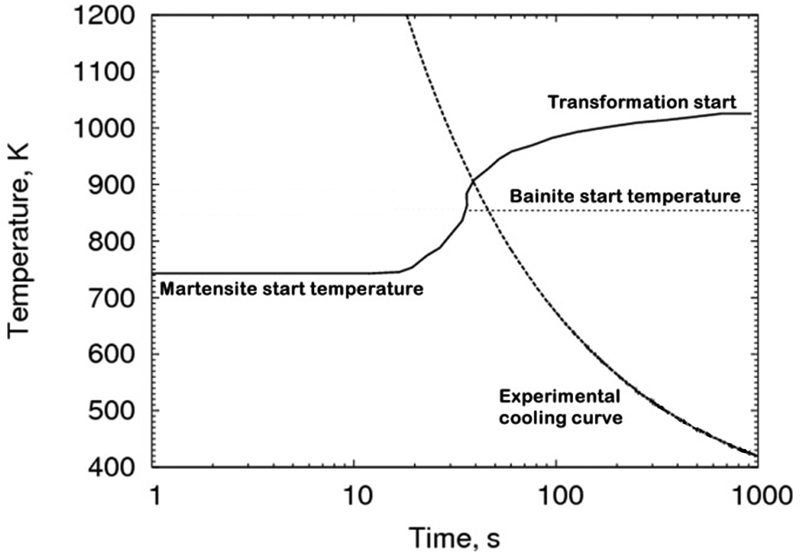
Experimental cooling curve used for CGHAZ simulation superimposed on calculated transformation diagram (part of curve above bainite start temperature marked as transformation start represents ferrite start temperature)
Hardness is a good indicator of the type of microstructure and its susceptibility to brittle fracture. From results of the present study the following can be concluded:
good agreement was achieved between the real and simulated samples
the average hardness of all three simulated CGHAZ is very similar
the standard deviation of the simulated CGHAZ hardness measurements is small (ranging from 3 to 6) in case of all studied steels.
However, Steel B with Ti/N ratio of 3·22, close to stoichiometric (3·42), exhibited slightly smaller standard deviation reflecting the slightly more uniform grain size distribution compared to remaining two.
The austenite grain size distribution for the three steels was uniquely different. Steel B exhibited a higher volume fraction of prior austenite grains smaller than 80 μm in diameter. This steel showed slightly smaller mean grain size and also smaller large grain compared to Steel A and Steel C (refer to Figs. 3 and 4). It is well known that the coarsest grain in the steel is more detrimental to toughness. It is quite logical to assume that this increased control of austenite grain size at the peak temperature in the CGHAZ is related to the optimum Ti/N ratio of steel B.
It is well established that the Ti/N ratio is an important factor in determining toughness of high strength low alloyed steels mainly due to its influence on the austenite grain size.17 It is also well accepted that the presence of a few extremely large grain size could deteriorate HAZ toughness, as observed in Fig. 6. This is because the austenite grain boundaries play an important role in the cleavage fracture propagation.18 The increased number of grain boundaries in a fine grained steels acts to obstruct crack propagation, thus increases the energy required for fracture to propagate. In addition, the low tendency of M−A island formation in fine grained microstructure can reduce the potential fracture initiation sites, thus providing good toughness. These factors contributed to the better toughness performance of Steel B during Charpy impact testing.
Conclusions
The microstructure of simulated CGHAZ with different Ti/N ratios was very similar and consisted predominantly of bainitic ferrite with a small amount of M−A constituent. No differences associated with different Ti/N ratios in the investigated range were observed.
The hardness of simulated CGHAZ of all three steels was very similar (∼210 HV), indicating that Ti/N ratio in the studied range does not have a significant effect on CGHAZ hardness values.
The mean prior austenite grain size of studied samples was controlled in the close range 68–83 μm.
Steel B with Ti/N ratio of 3·22 (close to stoichiometric ratio) showed better toughness properties than the remaining two. This is thought to be due to high volume fraction of fine austenite grains.
The current work has identified a subtle difference in austenite grain coarsening in fundamentally identical steels with different Ti/N ratios. The implications of this work are significant in terms of optimum alloy design of steels for critical applications such as high pressure pipelines. Further research will be undertaken to confirm the mechanism for the difference in toughness.
Footnotes
Acknowledgements
This work was funded by the Energy Pipelines CRC, supported through the Australian Government's Cooperative Research Centres Program. The cash and in-kind support from the APIA RSC is gratefully acknowledged. BaoSteel, China is thanked for the materials to conduct this research. Special thanks are extended to Liang Chen and Bob De Jong for their great assistance on Gleeble simulation. One of the authors (Zhixiong Zhu) is also grateful for the financial support from China Scholarship Council (CSC).