
Abstract
Hot cracking in welding is a complex phenomenon due to coupling between process, metallurgy and mechanical loading. A methodology based on process simulation, simple microstructural prediction and a pressure model along columnar grains is developed in order to integrate all factors that influence hot cracking. The model is based on some developments of Rappaz, Drezet and Gremaud and takes into account the influences of grain morphology, mechanical and welding thermal loading, on hot cracking. The model based on the microstructure behaviour is able to predict crack onset location in columnar grains on 6061 aluminium alloy.
Introduction
To improve productivity in welding, the welding speed could be increased. Unfortunately, increasing welding speed can lead to defects such as hot cracking. Numerous works investigated hot cracking phenomena, and workshops are dedicated to this topic.1– 3 However, the occurrence of hot cracking is not yet well predicted due to the complexity of the phenomenon.
Hot cracking phenomenon appears during solidification of alloys in the high solid fraction region, during a specific temperature interval called the brittle temperature range (BTR). In the BTR, the microstructure reaches a critical configuration. Liquid and solid phases co-exist at microscopic scale. The fluid must accommodate plastic strain and solidification shrinkage of the solid phase. Hot cracking sensitivity in the BTR depends on grain morphology. High thermal gradient generates columnar grains that are more sensitive to cracking than equiaxed grains.
Solidification cracking is especially difficult to predict because of the heterogeneity of fields due to localised heat input induced by the welding process. Microstructure generation and behaviour during solidification is directly related to the thermal transfer in the weld pool. Stresses, strains and strain rate fields are complex around the weld pool.4 To understand hot cracking, all these phenomena have to be included in the analysis.
Many models based on a limited value of strain rate or stresses were developed to predict solidification cracking. The most remarkable was developed by Rappaz, Drezet and Gremaud.5 The criterion, often noted as RDG, in the literature is based on the principle that cracks occur when liquid feeding in a columnar grain structure cannot compensate the solidification shrinkage and plastic strains of the solid phase. It takes into account microstructural characteristics as well as macroscopic plastic strain rate and thermal field. In this model, the microstructure has to be known either by observation or by prediction. Some papers applied this model to welding.6
Two welding tests are mostly used to characterise hot cracking. The Japan Welding Research Institute tests7 play on geometrical singularity to create or stop a hot crack. Varestrain test8 promotes cracks thanks to non-homogeneous loading on the solidification zone. However, because these tests lead to complex and even singular strain state, it is difficult to define local criterion for crack initiation.
Simulation and modelling efforts are necessary to better understand the effects of the coupling between metallurgy, thermal and mechanical fields on solidification cracking. In this paper, a method that couples solidification microstructure prediction and welding process simulation is proposed. This approach is based on the adaptation of the RDG model considering the grain morphology in the solidification zone.
The paper starts with the process simulation. Then, the microstructural prediction is detailed in order to obtain grain morphology. Finally, the adapted RDG model is presented and used with predicted microstructure as well as thermal and mechanical fields computed from the process simulation. The stated model was able to describe some hot cracking tests results.
Numerical simulation of welding test
In this part, a finite element simulation of an original hot cracking test8 rather similar to the programmable deformation cracking9 test was carried out. It consists in the application of a constant tensile loading or constant displacement in the direction of welding before welding (Fig. 1). This test prevents any time effects induced by the evolution of the boundary conditions. It allows discriminating hot cracking conditions with change of welding parameters and mechanical loading. Unfortunately, the disadvantage is that this test requires one experiment for each external loading.
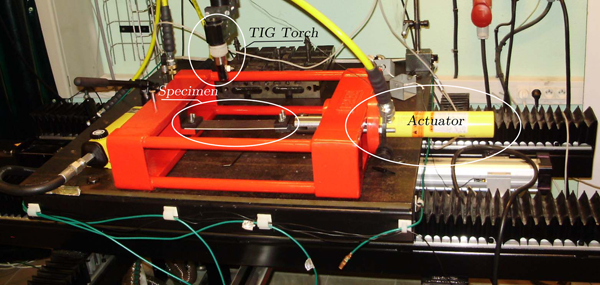
Hot cracking test: welding direction and tensile direction are given by direction of actuator
Geometry, material and test description
The tested specimen is a 3 mm thick 6061 Al alloy plate with 400 mm length and 50 mm width. During the test, an autogeneous weld bead is done with gas tungsten arc process in the centre of the sample width for 300 mm length. Welding parameters are chosen to have full penetration. Many tests were performed with and without tensile loading with different welding parameters.
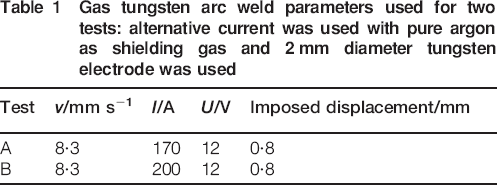
For all tests, the welding zone is composed of columnar grains at the periphery, and equiaxed grains at the centre of the weld. The widths of these zones vary for each welding conditions. The cracks are always initiated in the quasi-steady thermal state in the columnar grains (Fig. 2). Two different tests are selected in order to appreciate the ability of the modelling to describe the crack onset (Table 1). The welding parameters of test A do not produce cracks on the sample, whereas welding parameters of test B promote cracks. The current was only modified between the two tests. This parameter plays an important role in the thermal transfer and on the weld microstructure. The imposed displacement creates an initial tensile stress in the direction of welding within the specimen. The high welding speed (500 mm s−1) is necessary for cracks onset.
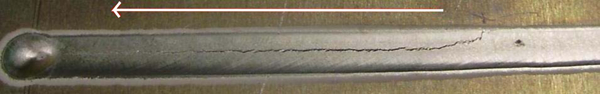
Autogenous weld bead and crack location: welding starts on right; crack initiates in columnar grains near border of weld bead and propagates at centre of equiaxed zone
Gas tungsten arc weld parameters used for two tests: alternative current was used with pure argon as shielding gas and 2 mm diameter tungsten electrode was used
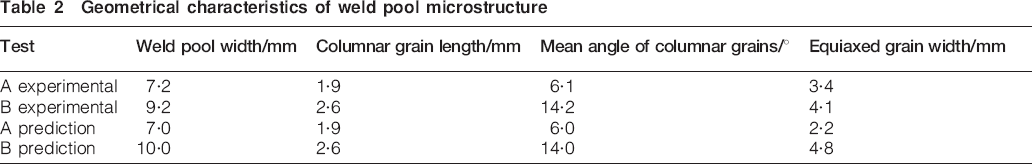
For the two tests, the microstructures in the weld pool are almost the same (Fig. 3). Owing to the fast cooling rate, grain substructure is dendritic with small secondary arm.10, 11 Owing to the fast moving of heat source, the columnar grains are almost rectilinear. Some geometrical characteristics of the microstructure for the two tests are reported in Table 2. The size of the weld pool increases with the current. The widths of columnar and equiaxed zones are also modified. Microstructure characteristics, especially the grain morphology, depend on different mechanisms taking place at the weld pool periphery and are driven by thermal loading. At the beginning of the weld pool solidification, the columnar grains start to grow from the base material by epitaxy. While these grains grow, new equiaxed grains nucleate at the centre of the weld pool due to a high undercooling.12 It produces a competition between growth of columnar grains and nucleation and growth of equiaxed grains. Experimentally, it is difficult to observe microstructure generated during welding. Some high speed images were obtained and will be used to appreciate crack onset in the section on ‘Results and discussion’.
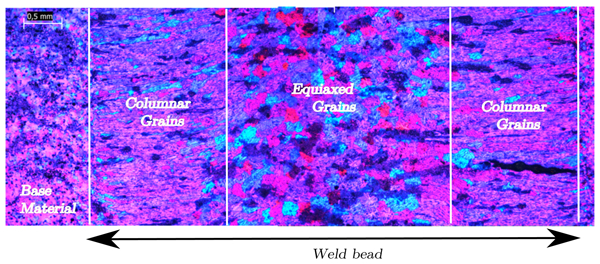
Microstructure morphology for test A: equiaxed grains are at centre of weld bead, and columnar grains are located at border; owing to high speed welding, columnar grains are almost rectilinear demonstrating no reorientation
Geometrical characteristics of weld pool microstructure
Thermal simulation of welding process
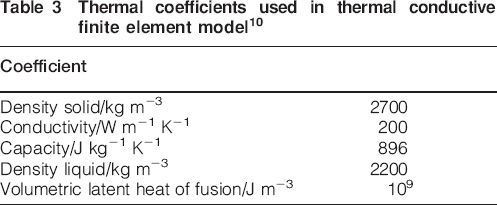
A two-dimensional mesh model was chosen because fully penetrated welds want to be modelled. The heat input was modelled by a Gaussian distribution with a 3 mm radius and 60% arc efficiency. These parameters were calibrated with thermocouple measurement and post-mortem micrographs. The mean thermal coefficients used are given in Table 3. The thermal fields (temperature and gradient) are computed using an enthalpy model without considering the weld pool convection. More details can be found in Ref. 13. The thermal field histories are stored in order to be used for microstructural prediction and for loading in the mechanical simulation of the test.
Thermal coefficients used in thermal conductive finite element model10
Mechanical simulation of welding process
The key points for mechanical simulation are the material mechanical behaviour, the deformation in the molten weld pool and solidification shrinkage.
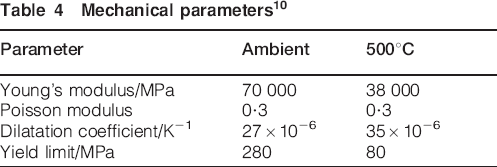
The 6061 mechanical behaviour was identified by Maisonnette14 for a wide range of temperature up to 560°C. An elastoplastic model was retained mixing both kinematic and isotropic behaviour in this temperature range. It was extrapolated to the solidification range. The time dependence effect in this temperature interval was neglected. The main coefficients used in the mechanical simulation are shown in Table 4. Weld pool cannot sustain mechanical loading; therefore, it was modelled as a stress free region. A procedure is used to set stresses and plastic strain to zero for temperature above the liquidus. Solidification shrinkage is taken into account by the increase of the dilatation coefficient in the solidification range.14
Mechanical parameters10
The localised heat input loads the plate and generates plasticity in the vicinity of the weld pool. Some plastic strains are shown in Fig. 4. Plastic strain rate is one of the variables affecting solidification cracking in the RDG model (see the section on ‘Criterion for hot cracking in columnar grains’). The strains are shown at different points within and near the weld pool. As explained by Chihoski,4 some structural effects load the material in the last stage of solidification. The columnar grains (22 border point) are loaded by a positive strain rate upon cooling in the solidification range. When the columnar grains start to be loaded upon cooling, the plastic strain must accommodate compressive plastic strain already present at the weld pool border (22 heat affected zones). The strain rate tends to open interdendritric spacing and can promote cracks.
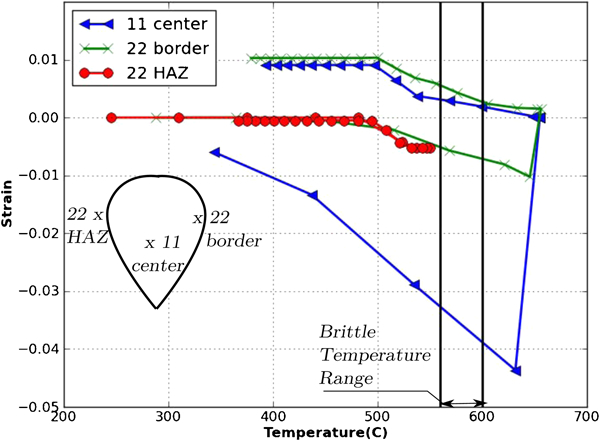
Plastic strain histories at different points near and in weld bead: number 2 is direction of welding; upon cooling, plastic strain rate is positive for different locations
Plastic strains are stored for each time steps. Then, plastic strain rate tensor is computed and is used for the mechanical loading of the microstructure.
Microstructure prediction
Microstructure prediction is needed to know the grain morphology. Especially size and orientation of the columnar grains are required for integrating microstructural effects in the RDG model. For the prediction of grain structures during solidification, the most successful techniques developed so far have employed the cellular automata approach.15 In the present paper, a simple approach based on an analytical model developed by Hunt16 for the columnar to equiaxed transition (CET) is chosen to determine the width of the columnar zones. The CET is a complex phenomenon that is related to cooling rate and to the competition between columnar growth and nucleation of equiaxed grains at the centre of the weld pool.
A new dedicated numerical procedure is developed. First, a ‘layer’ (a fine structured grid) is defined to keep all microstructural evolutions. The layer is defined as a quadrangle domain superimposed to the finite element mesh used for process simulation and located in the region where the crack initiations were observed. In this layer, the thermal fields (temperature and gradient) are interpolated on the grid of the ‘layer’ to localise the liquidus isotherm. In this work, it is assumed that the liquidus isotherm is the weld pool boundary. This boundary is represented by the set of points noted Pweld. The weld line border is determined with the envelope of the weld pool and is represented by the set of points Pborder.
According to the general solidification theory, CET appears when rapid growth of equiaxed grains in the undercooling zone located just before the moving solidification front stops the columnar grain growth. The nucleation and growth kinetics of equiaxed grains mainly depend on the thermal gradient G and the solidification rate R.12 Based on Hunt's work, Kurz et al.
17 proposed an analytical model to predict the CET for fast cooling rate. According to this criterion, the microstructure will be predominantly columnar when

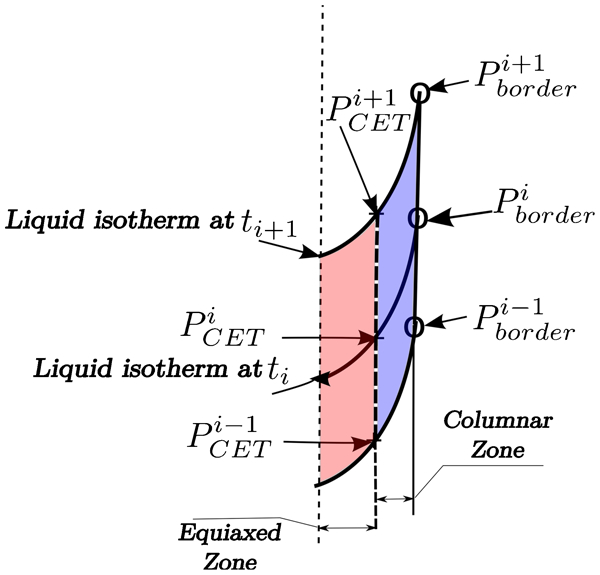
Sets of geometrical points for delimiting different microstructural domains: upper script is for time increment
Columnar grains are modelled as segments, which represent the skeleton of the grains, and equiaxed grains are modelled as polygons. In the equiaxed zone, the grains are generated by putting sites inside the domain and then by performing a constrained Voronoi of the domain in order to obtain polygons.10 In this geometrical model, the base material is not taken into account. A characteristic length lcar was introduced, which corresponds to the final width of columnar grain growing from the base material. Once the columnar grains are initiated at the weld pool border on the set Pborder, the growth of the columnar grain is modelled. After each time step, the linear growth of a grain is performed until it reaches the new location of the weld pool border Pweld or the transition points PCET or the middle of the weld pool in the case of symmetrical modelling. The growth direction for the grain growth is given by a simple law where the growth direction tends to align with the heat flux:

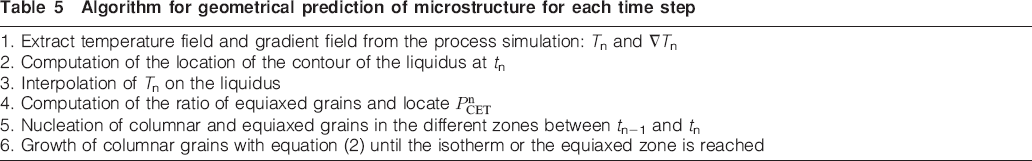
This algorithm for geometrical prediction of the microstructure is summarised in Table 5. Once initiated, each columnar grain is stored with an index to know if it is stopped or still in growth. Each columnar grain skeleton is composed of several segments, and each segment has an index to know if the segment is partially molten or solid. In the quasi-steady thermal region, the microstructure is almost identical, and only minor differences can be noticed. The main purpose of this simple prediction is to obtain geometrical objects representing grains and intergranular liquid in order to project field to compute pressure around the solid skeleton. This simple model is questionable regarding physical background because no physical laws of solidification are introduced, but it allows introducing microstructural characteristics to adapt the model developed by Rappaz et al. 5 on columnar grains during welding.
Algorithm for geometrical prediction of microstructure for each time step
Criterion for hot cracking in columnar grains
Rappaz et al. 5 developed a hot tearing model based upon mass balance over the liquid and solid phases. This model takes into account tensile strain and solidification shrinkage. It was initially written in an isotherm frame. In this paper, the model is rewritten in frame of columnar grains. A weak formulation is proposed that allows taking into account the variation of plastic strain and thermal fields along a columnar grain.
Rappaz, Drezet and Gremaud proposed to consider mass conservation on a small volume element (SVE) where the principal direction is oriented in the primary dendrite arm direction (Fig. 6). The frame attached to the microstructure is also depicted in Fig. 6. The SVE is characterised by different quantities: the velocity of the liquid in the solid skeleton vl and vs and the velocity of the solid phase and the solid fraction fs. The mass conservation is written in the frame of the semisolid SVE; it is
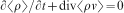

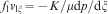
 , where the plastic strain rate is perpendicular to the primary dendrite direction, and the gradient of the fluid flow is given by the Darcy's law

 and T fields are non-uniform. The second and third term of equation (4) are computed from the results of welding simulation at each gauss point of the columnar grain by a natural neighbour interpolation. Each segment of the skeleton is the support for linear interpolation, and then two gauss points are used to integrate the weak formulation. The linear interpolation shape function is chosen as a test function. Equation (4) is multiplied by the test function and then integrated by parts to lead to the elementary formulation
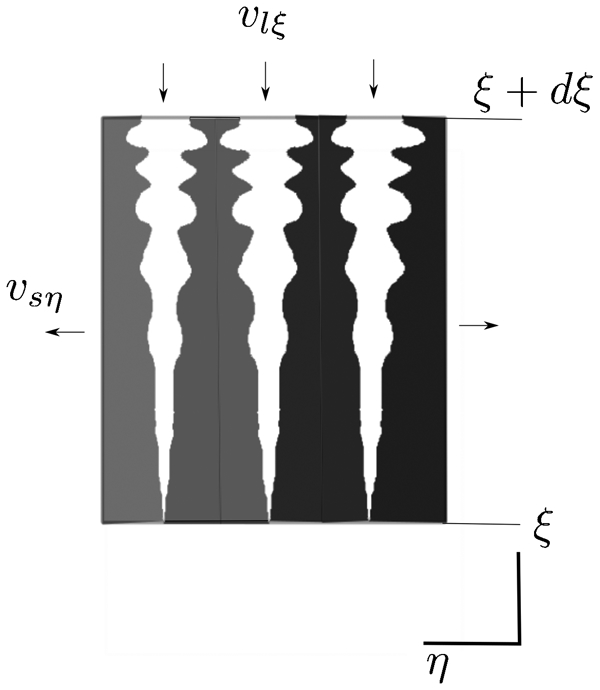
Small volume element along primary dendrite arm
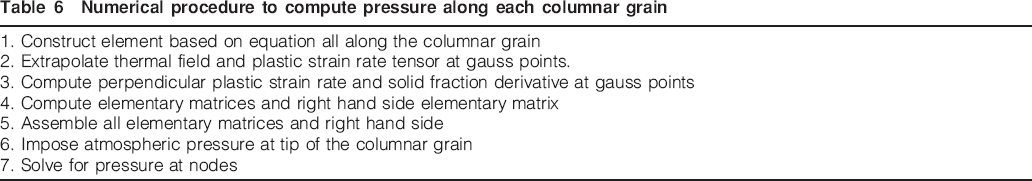
The procedure to solve the equation is shown in Table 6. Pressures are computed. The critical grain where crack occurs is the one where there is a lack of liquid feeding due to solidification shrinkage or plastic strain rate. Lack of feeding creates a pressure drop in the interdendritic network of columnar grain. Once the pressure is known in all columnar grains, grains with highest depression can be determined.
Numerical procedure to compute pressure along each columnar grain
Results and discussion
Results of microstructural predictions are shown in Fig. 7. In this figure, the part of columnar grains in red is in a semisolid state. In Fig. 7, the shape of the columnar grains can also be appreciated. The two microstructures for the two tests are shown on Fig. 8. As observed experimentally, the weld pool is larger for test B due to higher current value. The prediction on the second test is in good agreement with experimental observations (Table 2). The equiaxed and columnar grain widths are of the same order of magnitude as those observed experimentally.
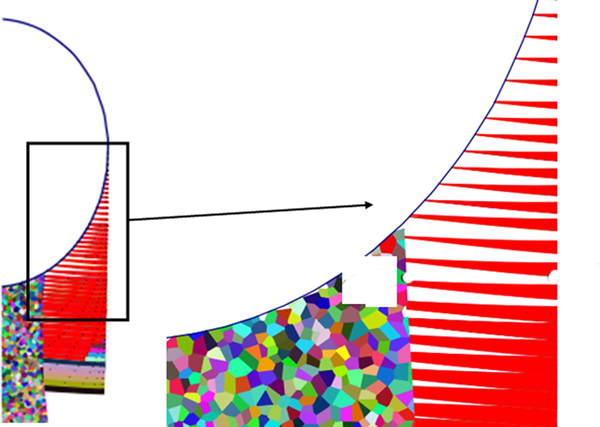
Columnar grain prediction based on geometrical procedure: red spikes represent columnar grains; due to high speed welding, columnar grains do not follow weld pool interface
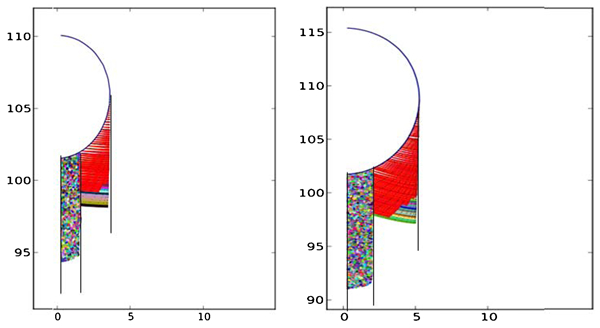
Comparison of microstructures for two tests: left (A) and right (B)
The skeleton of each columnar grain is extracted from the metallurgical prediction and transformed into the one-dimensional multiphase element defined in the precedent section. The pressure is determined along the skeleton in the different part of the columnar grain in molten state. One of the interesting points of RDG model is that it takes into account the microstructure with the solid fraction, the change of state with the solidification shrinkage coefficient β and the plastic strain rate in direction perpendicular to the columnar grain. Some morphological aspects can be introduced via the dependence of the permeability to the microstructural factor as the secondary arm spacing in the Carman–Kozeny relationship. The model can then determine depression in the interdendritic liquid network. The morphology of the columnar grain is taken into account by the crystallographic orientation and the length of the columnar grain.
The strain rate distribution in the semisolid zone is complex as the loading of the columnar grain. In Fig. 9, perpendicular plastic strain rates are shown with respect to time for a critical columnar grain in test B. The plastic strain rate varies along the columnar grains and is low at the end of solidification just at crack onset. An analysis of the source terms (right hand side of equation (4)) for this test and this columnar grain shows that the dominant term is the one due to solidification shrinkage upon cooling, whereas the contribution of plastic strain rate source term is low.
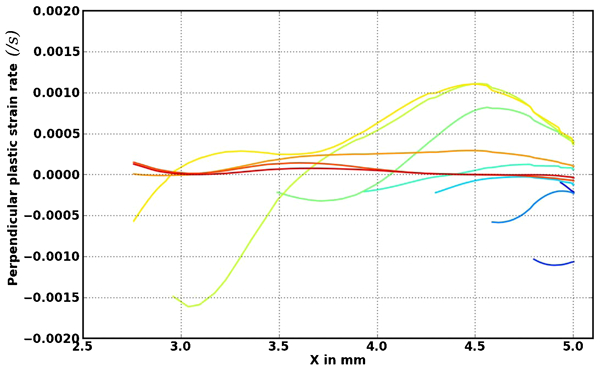
Plastic strain rate perpendicular to critical grain with time: X is coordinate in plate frame; blue (black) colours are columnar grain initiation, whereas red colour is for same columnar grain just before crack onset; right of graph corresponds to border of weld pool where columnar grain starts to grow from base material; longest line represents columnar grain at end of solidification; higher positive strain rate is for columnar grain in part at high solid fraction
A simple criterion of the maximal depression can be used to detect hot cracking

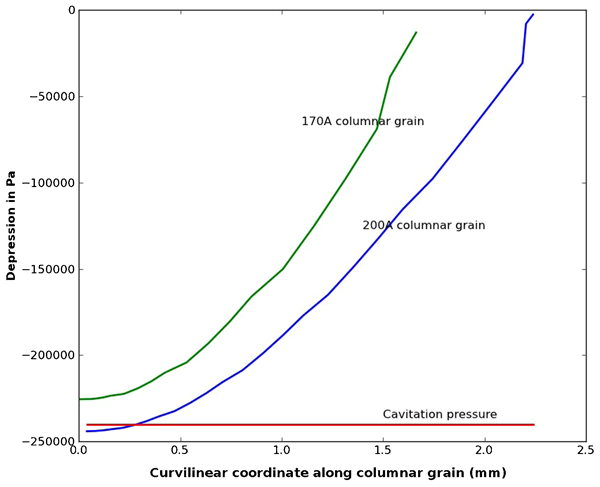
Depression distribution in columnar grain: left is at root of columnar grain, and right is part of grain closer to weld pool
In situ observations10 showed that crack onset occurs in the last stage of the solidification of the weld pool. High speed video (Fig. 11) showed that crack onset at the surface is far from the weld pool. In this zone, the solid fraction is close to one, so the solid skeleton is coherent and can sustain mechanical strain. The fluid constitutes a continuous network in three dimensions, but the liquid cannot flow easily due to low permeability around the solid skeleton. On Fig. 11, the location of the critical columnar grain given by the computation is compared with some high speed images acquired during welding. The critical grain is coloured in white. On simulation and on high speed images, the initiation is seen far from the weld pool. The hot crack onset is attributed to the lack of liquid feeding in region with high solid fraction. High speed video also indicates that liquid remains at the end of the solidification range.
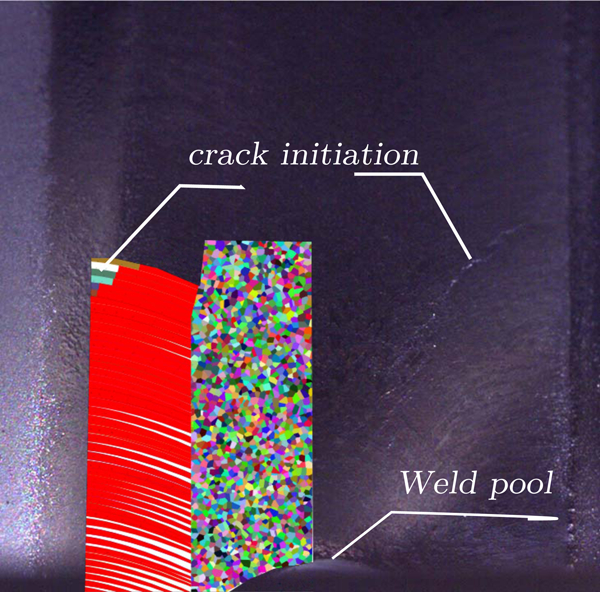
Crack initiation with high speed imaging in 6061 aluminium alloy compare with crack onset prediction with simulation and criteria developed in this paper
Conclusions
In the present paper, an original model to predict hot cracking in welds was developed. The model extended the development of Rappaz, Drezet and Gremaud5 by introducing microstructural prediction computed according to the results of finite element model of the welding process. The model seems to well describe hot cracking in 6061 aluminium alloy in the last stage of solidification. It takes into account the different interactions between microstructural, thermal and mechanical phenomena. Despite the two-dimensional numerical modelling, crack onset location is well predicted. To be more complete, some microstructural parameters determined from experimental tests such as the secondary arm spacing could be integrated in the microstructural modelling.
In order to appreciate the availability of such model, the microstructural prediction was mainly based on an analytical model and on geometrical consideration. The metallurgical prediction can be improved and can be based on cellular automata as proposed by Rappaz et al., 21 which is also able to take into account grain orientation and disorientation.
Although the model gave good prediction for the crack onset, it must be kept in mind that the material has three-dimensional behaviour.
Footnotes
Acknowledgements
The authors want to thank ANR (grant no. ANR-JC-03838) for supporting this research.