
Abstract
Linear and weaving laser welding were performed on a self-restraint tapered specimen of an Al 5J32 alloy. Linear welding produced columnar grains along the fusion line and equiaxed grains along the centreline. Solidification crack developed along the centreline having equiaxed grains. For laser weave weld, the solidification crack disappeared at a weaving frequency of 5 Hz. However, as the weaving frequency increased further, the length of the columnar grains inside the weaving trajectory curve became smaller than that outside the curve, and the equiaxed grains did not necessarily grow along the centreline of the weld. Therefore, the wide equiaxed grains deviated from the transverse weaving profile and a near linear solidification crack developed. The simulated morphology using solidification rate and temperature gradient correlated well with the solidification morphology obtained from the experiments. The limiting boundary condition for differentiating between the columnar and the equiaxed microstructures in the alloy was G = 3·5R.
Introduction
Laser welding of aluminium alloys is limited by weld defects such as solidification crack.1 Optimisation of the weld composition using a filler metal is the conventional method used to prevent solidification cracking.2– 5 Common filler metals used to reduce the solidification crack sensitivity of Al alloys include Mg, Si and Cu. Recently, a study on welding crack propagation and susceptibility was carried out using a new filler metal containing up to 18%Si.6 However, these filler metals are difficult to use in laser overlap welding owing to the autogenous nature of the welding. Therefore, attempts were made to suppress the formation of solidification cracks during welding, by weaving the laser source and controlling the laser pulse waveform.7, 8 The effect of weaving a heat source such as arc, laser or an electron beam on the microstructural evolution, solidification crack susceptibility and welding strength has been investigated.8– 12 Notably, weaving of the heat source changed the solidification morphology obtained through columnar and equiaxed dendritic growth. The solidification morphology during welding can be precisely determined by the grain growth rate R and temperature gradient G at the solidification front.13– 15 However, to the best of the authors’ knowledge, there has been no theoretical study on the solidification morphology for laser weaving.
The authors had previously reported on the improvement of weld strength and optimisation of weaving parameters for laser weave welding of Al 5J32 alloy.8 Improving on these findings, the authors calculated solidification parameters such as R and G by thermal analysis in the present study, used these values to simulate the solidification morphology and compared the simulated morphology with the experimentally observed solidification morphology. Finally, the authors studied the feasibility of using mathematical models to predict the solidification morphology during the laser weaving process.
Experimental
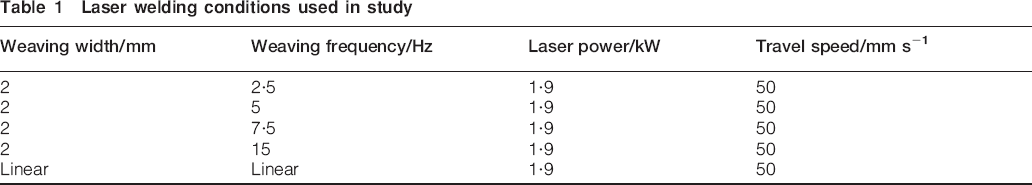
Laser weaving was performed using an Yb∶YAG disc laser and a two-axis scanner system. The laser scanning head was controlled by a six-axis articulated robot, and the focal distance of the optic system was maintained at 450 mm. An Al 5J32 plate [with chemical composition of Al–0·03Si–0·08Fe–0·33Cu–0·01Mn–5·6Mg–0·01Zn–0·02Ti (wt-%)] with a thickness of 1 mm was used as the base material. A self-restraint tapered specimen was used to test the solidification cracking, as depicted in Fig. 1.8 The travel speed of the laser scanning head and laser power were maintained at 50 mm s−1 and 1·9 kW respectively. The weaving of the laser beam was implemented by the laser scanner with various weaving frequencies, as shown in Table 1. After bead on plate welding, the grain structure on the bead surface was examined using optical microscopy. For this, the specimen was etched in a solution of 75 mL HCl, 25 mL HNO3 and 5 mL HF.
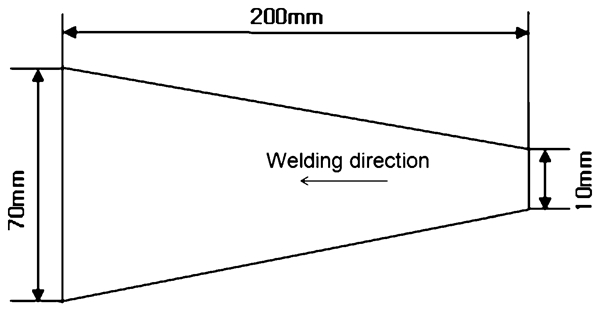
Schematic diagram of welding specimen for solidification cracking test8
Laser welding conditions used in study
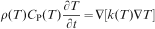
To simulate the solidification morphology during laser weaving, R and G at the solidification front were calculated by thermal analysis. The thermal analysis was conducted by the finite element method using ABAQUS. In laser welding of Al alloy, the Peclet number Pe, which denotes the ratio of heat transfer by convection to conduction, is significantly small as compared with that for laser welding of steel.16 Therefore, for simplicity of calculation, only heat conduction is considered in the energy equation. The equation is as follows
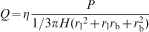
As keyhole mode laser welding was conducted in the experiments, the laser heat source was assumed to be a volumetric source of conical shape. Figure 2 shows the heat source model along with the specimen dimensions used for the simulation. The heat generated by the laser source Q is calculated as follows17
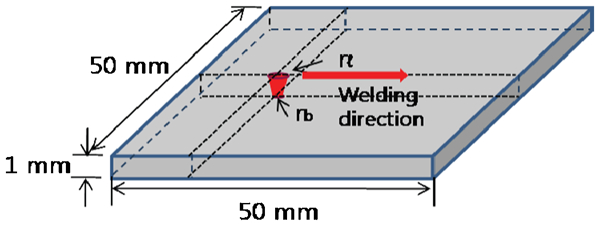
Heat source model and specimen dimensions used for thermal analysis
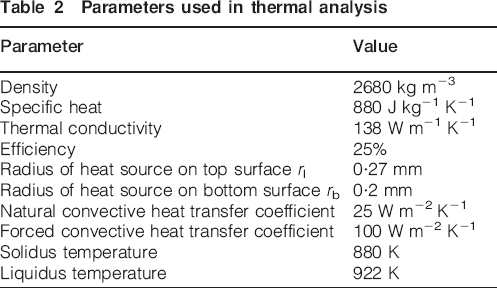
For the boundary conditions, forced convection by shielding gas flow was assumed over the top surface and natural convection was assumed over the other surfaces. Other parameters used in the thermal simulation are summarised in Table 2. The temperature profile at a specific point in the specimen and in time was converted to R and G using the following equations


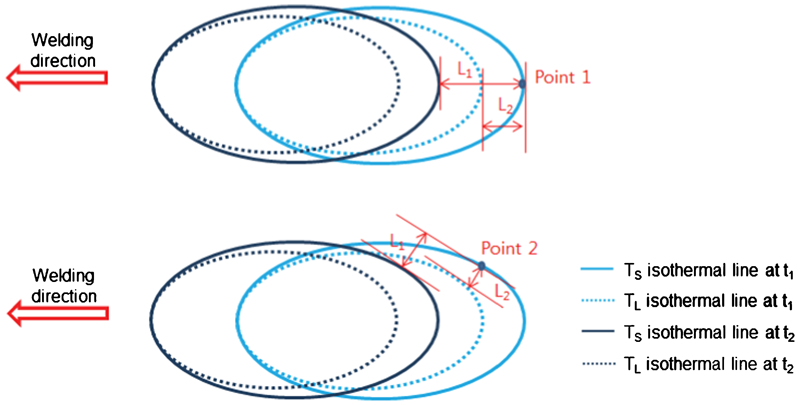
Schematic diagram of weld puddle formation used to calculate solidification rate and temperature gradient
Parameters used in thermal analysis
Results and discussion
Figure 4 shows the solidification morphology at various weaving frequencies. Linear welds on Al 5J32 plates produced a columnar microstructure along the fusion line and an equiaxed microstructure along the centreline running parallel to the welding direction. Solidification crack developed along the zone having an equiaxed microstructure. For a weaving frequency of 2·5 Hz, equiaxed grains always appeared along the centreline of the weld, and the liquid film and the solidification crack were curved in alignment with the transverse weaving profile. The crack disappeared when the weaving frequency was increased to 5 Hz. As the weaving frequency was further increased to 7·5 Hz, the crack developed along the zone with equiaxed grains. However, in this case, the equiaxed grains were not always found along the centreline of the weld. For the largest weaving frequency (15 Hz) employed in the study, both the crack and equiaxed grains developed almost parallel to the welding direction. As the frequency increased, the width of the equiaxed grains increased, and the length of the columnar grains inside the weaving trajectory curve was smaller than that outside the curve. Both sides (inside and outside) of the weaving curve were defined in Fig. 5. The crack length behaviour as a function of the weaving frequency has been discussed in detail by the authors in an earlier study.8
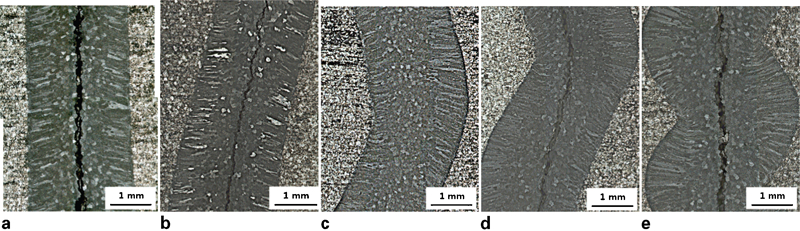
Solidification morphology of weldments at various weaving frequencies
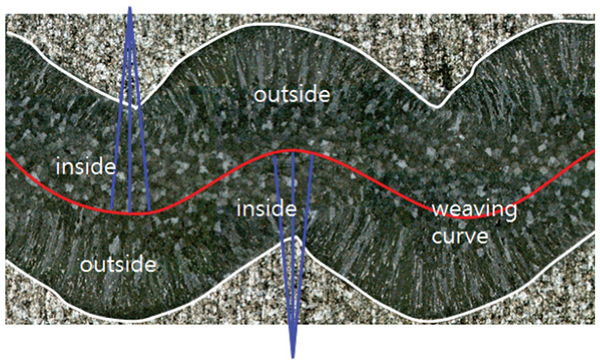
Definition of inside and outside of weaving curve
Molten metal along the centreline of the linear weld solidifies last. Therefore, a continuous and linear liquid film may be formed along the centreline, which then becomes more susceptible to solidification crack than the nearby fusion line. Hence, in the linear weld specimen, solidification crack developed along the centreline with equiaxed grains, even though these grains can withstand a greater degree of compressive strain during solidification than would the columnar grains. As the weaving frequency increased to 5 Hz, the equiaxed grains grew along the transverse weaving profile while maintaining the centreline location. The continuous liquid film was curved in alignment with the transverse weaving profile. Therefore, solidification crack formation was significantly suppressed. As the weaving frequency was increased further to 7·5 and 15 Hz, weld puddles formed by the weaving heat source overlapped, producing a continuous liquid film oriented away from the weld centre, being close to the linear welding direction, and increasing the weld width. Kou and Le demonstrated that the wavy crack path could suppress solidification cracking effectively.9 The Al alloy and the welding conditions adopted in the present study resulted in a relatively wide equiaxed zone. Hence, in studies on laser weaving, alignment of the continuous liquid film and wide equiaxed zone become the chief parameters controlling the crack sensitivity.
The solidification morphology observed for linear laser welding was correlated with the morphology obtained from the thermal simulation using R and G, as depicted in Fig. 6. Points 1–3 had a large R and a small G, suggesting an equiaxed grain structure. However, points 4–6 had a small R and a large G, characteristic of a columnar grain structure. Therefore, the limiting values used to differentiate between the columnar and the equiaxed microstructures were approximately R = 35 mm s−1 and G = 120°C mm−1.
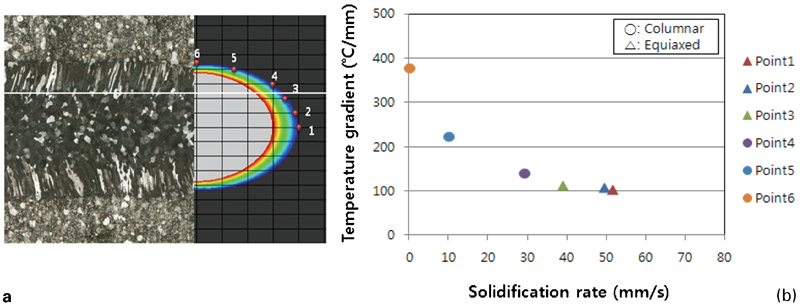
Simulation of solidification morphology for linear weldment
Figure 7 shows that the solidification morphology for the laser weaving at 5 Hz correlated with the results of the thermal simulation using R and G. Points 3 and 4 had a large R and a small G, implying an equiaxed grain structure. However, points 1, 2 and 5 had a small R and a large G, suggesting a columnar grain structure. Owing to the transverse weaving, points along the solidus and liquidus isothermal lines had an asymmetrical structure. L2 was larger inside the weaving curve than outside. Therefore, G at point 4 was smaller than that at point 2. In addition, G at point 9 was smaller than that at point 7. L1 was larger outside the weaving curve than inside because the linear velocity in the tangential direction at outside was always larger than that at inside. Hence, R at point 7 was larger than that at point 9. The limiting values used to differentiate between the columnar and the equiaxed microstructures were the same as the limiting values of linear laser welding, i.e. R = 35 mm s−1 and G = 120°C mm−1.
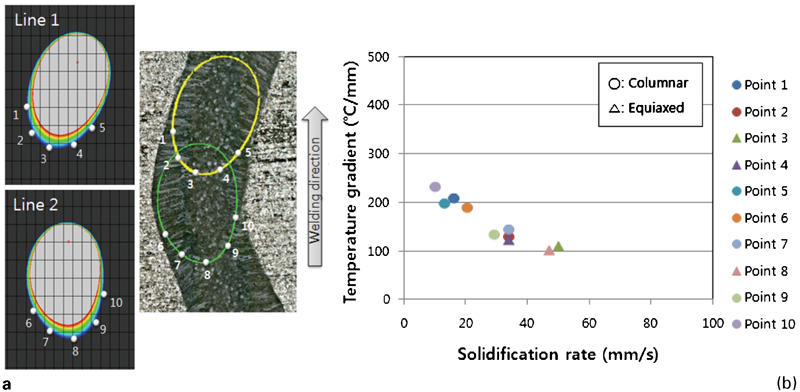
Simulation of solidification morphology for laser weaving at frequency of 5 Hz
Figure 8 shows that the solidification morphology for laser weaving at 15 Hz correlated with results of the thermal simulation using R and G. Points 2 and 3 had a large R and a small G, implying an equiaxed grain structure. Points 1 and 5 had a small R and a large G, suggesting a columnar grain structure. Owing to the transverse weaving and the asymmetrical isothermal lines, L1 was smaller inside the weaving curve than outside. Therefore, R at point 10 was smaller than that at point 6, although it was approximately in a symmetrical position. L2 was larger inside the weaving curve than outside. Hence, G at point 4 was smaller than that at point 2. The limits to determine the solidification morphology for the laser weaving (15 Hz) were approximately R at 35 mm s−1 and G at 120°C mm−1.
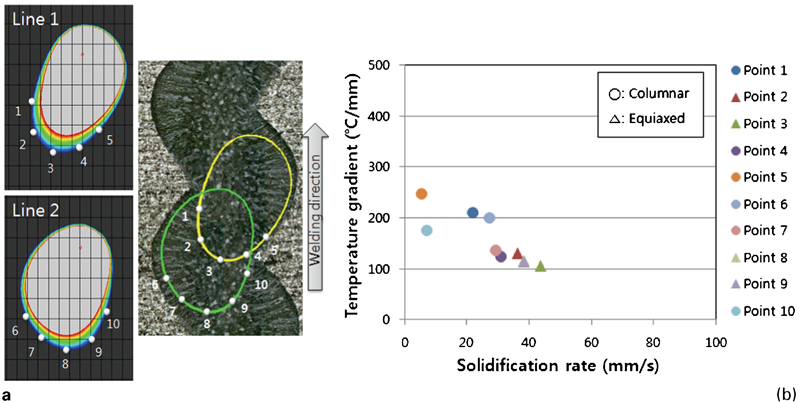
Simulation of solidification morphology for laser weaving at frequency of 15 Hz
All calculated values of G and R are plotted in Fig. 9. The solidification morphology determined in the linear and weaving (2·5–15 Hz) laser welding experiments is included in the figure. Theoretically, R should be zero when G is zero. Therefore, the boundary dividing the columnar and the equiaxed grain structures was a function of G and R, i.e. G = 3·5R (denoted by the blue line in Fig. 7). The region above the boundary includes columnar grains, and the region below includes equiaxed grains. The result of thermal analysis conducted with the calculated values of R and G was successfully correlated with the solidification morphology obtained from the linear and weaving laser welding experiments on the Al 5J32 alloy.
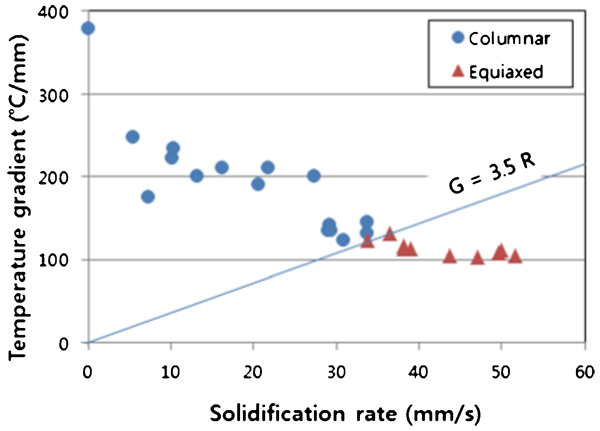
Comprehensive plot of microstructural evolution for laser weaving process
Conclusions
Linear laser welding produced solidification cracks on a self-restraint tapered specimen of an Al 5J32 alloy. Linear weld produced columnar grains along the fusion line and equiaxed grains along the centreline. Even though fine equiaxed grains are known to decrease the solidification crack sensitivity, linear laser welding produced a solidification crack along regions having equiaxed grains. In the case of laser weave welding, a weaving frequency of 5 Hz produced equiaxed grains along the centreline and a curved liquid film in alignment with the transverse weaving profile. The curved liquid film served to suppress the formation of solidification cracks to a significant extent. However, as the weaving frequency increased further, the welding puddles overlapped, causing the weld centreline to move away from the transverse weaving direction. Consequently, these welds produced a near linear solidification crack. Using thermal analysis, solidification rate R and temperature gradient G were calculated, and these values were used to simulate the solidification morphology. The simulated morphology correlated well with the solidification morphology obtained from the linear and weaving laser welding experiments on the Al 5J32 alloy. For the study, the boundary dividing the columnar and the equiaxed grains was G = 3·5R.