
Abstract
This paper describes the characterisation of residual stress in electron beam welded P91 ferritic–martensitic steel plates (9 mm thick) by neutron diffraction and contour measurement methods. The novelty of the work lies in revealing the residual stress profile at a fine length scale associated with a ∼1 mm wide fusion zone. A characteristic ‘M’ shaped distribution of stresses across the weld line is observed with high tensile peaks situated just beyond the heat affected zone/parent material boundary. Measured stresses close to the weld centreline are significantly less tensile than the adjacent peaks owing to martensitic phase transformation during cool down of the weld region. The effect of applying a second smoothing weld pass is shown to be undesirable from a residual stress standpoint because it increases the tensile magnitude and spread of residual stress. The results are suitable for validating finite element predictions of residual stress in electron beam welds made from ferritic–martensitic steels.
Introduction
Ferritic–martensitic steels containing 9–12Cr are seen as offering the most promise for components such as headers and the main steam pipe in ultrasupercritical fossil fired power plants,1 as well as for primary components in some of the design concepts for generation IV nuclear reactors. This is because 9–12Cr steels offer superior creep strength to grades containing less chromium such as, for example, 2·25Cr–1Mo steels. Steels containing 9–12Cr are also less expensive than austenitic stainless steels, and the fact that they have a higher thermal conductivity than austenitic steels means that they are less prone to the generation of thermal stresses.
While the advantages of 9–12Cr steels are well recognised, the performance benefits often have not been realised in service operation due to premature failures in the heat affected zone (HAZ) of welded joints. The failure mechanism is type IV cracking,1 which refers to an enhanced rate of creep void formation in the fine grained and intercritically annealed HAZ of a weld. In recent years, significant efforts have been dedicated to understanding the influence that HAZ microstructures have in influencing the propensity for type IV failures in 9–12Cr steels.2– 5 In perhaps one of the most significant developments, Abe and co-workers have recently developed steels containing between 90 and 160 ppm of boron, which seem to be immune to type IV cracking,6 but unfortunately, these steels will not be commercially available for some time.
In this work, we are focusing on modified P91 steel7 as it is commercially available and currently in service. We wish to explore the influence that the choice of welding process might have on the tendency for type IV failure. In particular, we have noted that there is some evidence to suggest that welds made with high energy beam processes, such as laser or electron beam (EB) welding, may be more resistant to type IV cracking than those made with conventional arc welding processes because they generate a narrower HAZ.5, 8 Recent measurement work has shown that when a P91 pipe girth weld was made with gas–tungsten arc and submerged arc welding, substantial tensile residual stresses were generated in the type IV region.9 Moreover, these stresses were not entirely relieved by a conventional post-weld heat treatment (PWHT). It is possible, therefore, that residual stresses may also be contributing to type IV cracking in some way. Computational weld mechanics has been applied in order to quantify the distribution of residual stresses in P91 weldments and understand how they relax during PWHT.10 The analysis suggested that PWHT almost eliminated the weld residual stress field for the condition examined. However, predictions from such models depend on a multitude of input variables and have to be validated by detailed measurements.
This article reports on the measurement of residual stresses in EB welds in a 9 mm thick P91 steel plate in the as welded state. The purposes are to provide detailed characterisation of the residual stress field for validation of weld numerical models and to contribute to work investigating how the EB welding process influences the tendency for type IV cracking. Results for two plates are presented, with one containing a single-pass weld and the other being made in two passes, that is, a welding pass and a (cosmetic) smoothing pass. In this work, the residual stresses have been measured by both neutron diffraction and the contour method.
Test samples
The base material studied in the present investigation is P91 steel having the chemical composition of Fe–0·106C–0·443Mn–0·005Zr–0·221Si–0·018P–0·0008S–8·965Cr–0·901Mo–0·212Ni–0·045Cu–0·010Al–0·0464N–0·073Nb–0·004Ti–0·194V (wt-%). As received hot rolled plate material was first normalised at 1050°C for 1 min mm−1 thickness and then tempered at 770°C for 3 min mm−1, which was followed by cooling in air. Plates of dimensions 250×75 mm were machined from the tempered material, which was nominally 10 mm thick. The samples were then surface ground on both sides in order to remove a slight waviness originating from the hot rolling fabrication process. The final thickness of the plate material ranged from 9·2 to 9·8 mm.
Several pairs of prepared plates were butt welded (along the 250 mm edge) by an EB process with a voltage of 60 kV, a current of 70 mA, a welding speed of 1 m min−1 and no preheat. Before welding, the plates were clamped to a heavy base plate with a blind square groove beneath the weld line. An additional weld smoothing pass was applied to some of the plates with a voltage of 60 kV and defocused beam current of 30 mA at a welding speed of 1 m min−1. The as welded residual stresses in single- and two-pass welded plates were measured with neutron diffraction and the contour method supported by metallographic characterisation.
Experimental
Cross-sectional samples were removed from the ends of both types of EB welded plates by electrodischarge machining. The samples were first ground using 400 grade emery paper and then metallographically polished to a 1 μm finish. The macrostructure of the weld fusion zone was revealed by etching with Villela's agent before a hardness survey was undertaken using a measurement pitch of 0·5 mm and a Vickers indenter with a load of 0·3 kg.
The contour method is capable of providing a cross-sectional map of residual stresses on a cut surface intersecting a body.11 The method involves cutting a component of interest into two pieces along the plane of interest. The newly created cut surfaces deform owing to the relaxation of any residual stresses that were present in the component before cutting. These deformations can then be measured and used to calculate the residual stresses that were acting in a direction normal to the plane of the cut. In the present work, single- and two-pass EB welded plates were each cut into two halves for contour measurements. The cuts were made by wire electrodischarge machining using a 0·25 mm wire diameter; for the single-pass case, ‘sacrificial’ strips were attached to both the top and bottom of the welded plate in order to prevent wire entry and exit cutting artefacts affecting the accuracy of the results. The profiles of the cut surfaces (the contours) were measured using a coordinate measurement machine equipped with a 4 mm diameter touch trigger probe at a point spacing of 0·5×0·5 mm. The measured profiles were then processed using Matlab analysis routines, and a finite element analysis was undertaken, using the deformed surface contour as an applied boundary condition, to calculate the residual stresses.
Neutron diffraction residual stress measurements were carried out on the ENGIN-X beamline12 at the ISIS facility of the Rutherford Appleton Laboratory in the UK. At this facility, a spallation source is used to produce a ‘white’ beam of variable wavelength neutrons. Time of flight is used to determine the lattice spacing in a gauge volume defined by sets of incoming slits and the capture angle of the detectors. Because of the very narrow width of the EB weld fusion zone, 1 mm detectors were mounted and used for all the measurements. The incoming beam was controlled by slits to give a 1×1×1 mm gauge volume for strains measured in the longitudinal direction and an extended gauge volume of 1×1×10 mm for measurements in the transverse and normal directions. In each welded plate, measurements were made through the thickness at the weld centreline and also along a line transverse to the welding direction, which was positioned 1·5 mm below the top surface of the plate. In the case of the plate that received an additional smoothing pass, this line coincided with the interface between the two passes. Particular care was taken to position the plate with theodolites before undertaking measurements as steep stress gradients were expected. The variation of the lattice parameter for each measurement or run was defined from a least squares refinement of the diffraction spectra using the computer code GSAS.13 It was ensured that the range of each spectrum selected for analysis contained at least five identifiable peaks from sets of crystallographic planes.
The lattice strain in a given direction is determined from the lattice parameter a, measured at the location of interest, and the lattice parameter measured in representative (or ideally the same) material that is free from macroscopic stress; the latter quantity, the stress free lattice parameter, is denoted as a0. Strains in three orthogonal directions in the plates were measured, and direct stresses were determined using a bulk Young's modulus of 218 GPa and a Poisson's ratio of 0·3 for both the P91 base metal and the fusion zone.14
A 2 mm thick strip was electrodischarge machined from the end of each plate, and position dependent values15 for the stress free lattice parameter a0 were measured, relative to the weld centreline and top surface, in order to take account of gradients in both the microstructure and strain history within the welded plates.16 At each measurement position, lattice parameter measurements were made in the longitudinal, transverse and the normal directions, and the stress free lattice parameter was determined assuming plane stress conditions.
Results
Figure 1a shows the macrostructure of a single-pass EB welded plate, with the line along which the cross-weld hardness profile at 1·5 mm was determined superimposed. The width of the fused zone tapers from 1·2 mm at the top of the plate to ∼0·8 mm at the bottom. The width of the HAZ appears to extend ∼0·8 mm beyond the fusion boundaries on both sides. The hardness profile (Fig. 1c) matches the visible extent of the HAZ boundaries, rising rapidly from the parent material level of 230 HV (at ±1·3 mm) to a plateau of ∼480 HV magnitude that spans the fusion zone. The plateau hardness level is indicative of a full martensitic microstructure, which is seen to extend to a width of 1·4 mm (slightly wider than the fused width of 1·1 mm). The effect of applying a second smoothing EB weld pass is evident in Fig. 1b. Here, the fusion boundary associated with the second pass extends to a depth of ∼1·5 mm below the top surface. The maximum width of the second pass at the top surface is ∼2·5 mm. The hardness profile at 1·5 mm depth is almost identical to the single-EB welded case apart from being 0·2 mm wider owing to the influence of the smoothing pass.
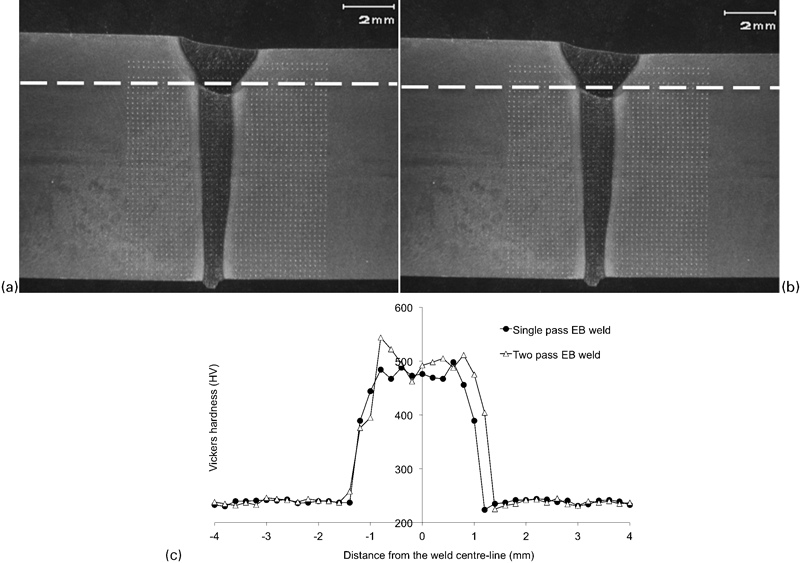
Photographs showing the macrostructures with measurement lines marked at 1·5 mm below the top surface of the plate for a the single-pass EB welded plate and b the two-pass (smoothed) EB welded plate with c showing the hardness measurement profiles
Figure 2 shows the variation in stress free lattice parameter across both types of EB welded plate derived from neutron diffraction measurements on the 2 mm thick strips (described earlier). No distinction was made between stress free lattice parameter measurements from the two-instrument detector banks or with measurement orientation as no systematic variation was observed. Despite a large degree of scatter in the results (Fig. 2), a correlation with the martensitic zone and HAZ boundaries (±0·8 and ±1·35 mm respectively) is evident. The greater values of lattice parameter in the martensitic zone, and to a lesser extent in the HAZ, may be attributed to the lattice being supersaturated with carbon. The stress free lattice spacing measurements at 1·5 mm from the weld centreline and beyond show little scatter; these data represent parent material unaffected by the welding process. The idealised line in this region (see Fig. 2) is based on the mean of all ‘stress free’ measurements made in parent material, that is, in the 2 mm strips, at the remote ends of the plates and in small parent cuboids. Stress free lattice parameter measurements through the thickness in the fusion zones of the 2 mm thick strips show a large scatter that appears to be random. For this reason, all the lattice spacing measurements made with gauge volumes either fully immersed or partially within the martensitic transformed zone, that is, within ±0·75 mm of the weld centreline, have been averaged to give a single martensitic weld metal value for use in the strain and stress calculations. A linear variation in stress free lattice parameter from the average weld to average parent values is assumed in the HAZ. This idealised variation in reference lattice parameter across the welds is marked in Fig. 2.
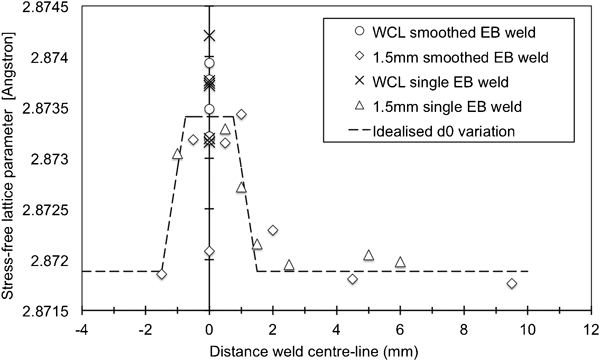
Stress free lattice parameter variation along a line 1.5 mm below the top surface of the plates measured by neutron diffraction in both the single-pass and two-pass smoothed EB welded plates (WCL = weld centreline)
Figure 3a shows the distributions of residual stress acting in the longitudinal, transverse and normal directions as measured by neutron diffraction across the single-pass plate EB weld centreline at 1·5 mm below the top surface. The longitudinal stress profile exhibits an ‘M’ shape having tensile peaks of ∼475 MPa magnitude that are almost symmetric about the weld centreline and roughly coincide with the maximum extent of the HAZ. Interestingly, the stresses are much lower in a central zone 1·5 mm wide that spans the weld centreline. The width of this zone correlates exactly with the weld martensitically transformed region (plateau) revealed by the hardness profile of Fig. 1c. The normal component of residual stress has a lower magnitude but follows the same profile as the longitudinal component, whereas the transverse stress varies smoothly across the weld apart from one point (at −1·0 mm), which may be an experimental anomaly.
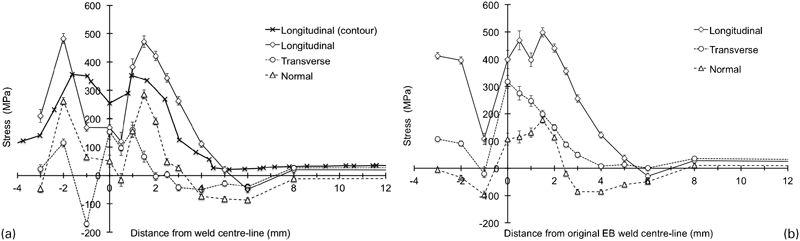
Residual stress distributions in the welded plates at 1·5 mm below the top surface measured by neutron diffraction and the contour method
The corresponding measured distributions of residual stress in the EB welded plate with the smoothing pass are shown in Fig. 3b. Again, the longitudinal stress profile exhibits an ‘M’ shape with a tensile peak stress approaching 500 MPa. However, in this test specimen, the minimum stress appears to be displaced 1 mm from the notional centreline of the first EB weld pass. This shift could be associated with a lateral offset in the position of the smoothing pass relative to the first pass or measurement positioning error or a combination of the two effects. Like the single-pass EB weld, the longitudinal stresses rise rapidly through the HAZ, but here, the high tensile region is significantly (1·5 mm) wider. Both the normal and transverse components of residual stress have lower magnitude than the longitudinal component but follow the same shape.
Cross-sectional maps of residual stress in the longitudinal direction measured by the contour method are shown in Fig. 4a and b for the single- and two-pass EB welds respectively. The single-pass map clearly identifies tensile peaks beside a narrow less tensile zone at the weld centreline. Moreover, it is seen that this pattern is almost uniform through the thickness of the plate. In contrast, the second smoothing weld pass has concentrated tensile zones closer to the top of the plate and increased their lateral spread (Fig. 4b). The distributions of longitudinal stress measured by neutron diffraction and the contour method across the single-pass weld at 1·5 mm below the top surface are compared in Fig. 3a. There is an excellent correlation between the shapes of the stress profile from the two methods. However, the peaks and trough of the ‘M’ profile from the contour method are less pronounced. This can be attributed to limitations in the spatial resolution capability of the contour method procedure used.
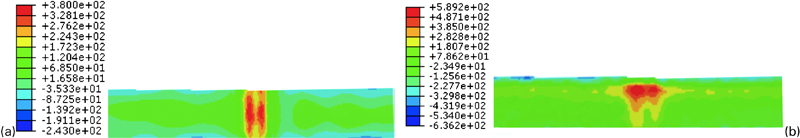
Distributions of longitudinal residual stress measured using the contour method
As expected, the highest tensile stresses across the EB welded joints are in the longitudinal orientation, since this is the direction that is exposed to the highest contraction strain as a consequence of the welding thermal cycle. The second highest tensile stresses are in the normal direction. This is unusual because the magnitude of the normal stress component is usually low in conventional fusion weldments. The normal stresses are greater than the transverse for an EB weld because the weld fusion width to depth aspect ratio is very small (∼0·1), whereas for a conventional weld bead this ratio is usually greater than unity.
The most striking feature of both M shaped cross-weld stress profiles is that stresses close to the weld centreline are significantly less tensile than at the HAZ boundary and in the parent plate material beyond. This feature can arise in steels that undergo a solid state phase transformation from austenite upon cooling to bainite or martensite.16 It is notable that the low stresses coincide exactly with the extent of the high hardness plateau shown in Fig. 1c for each weld, which characterises the extent of the martensitic zone created during cool down. Reduced levels of residual stress in martensitically transformed regions of multipass P91 weldments have been predicted10 and also measured using X-ray diffraction.17 More recently, a zone of compression associated with the final weld bead deposits of a multipass weld in a P91 pipe has been measured using the contour method18 and also by neutron diffraction,9 with the latter study specifically linking the compressive region to a martensitic transformation. The current results are also broadly consistent with those of Francis et al. 16 for a single-weld bead deposited on a 20 mm thick plate made of SA508 steel and Dai et al. 19 who investigated low transformation temperature groove welds in 12 mm thick plates. In both of these cases, the low stress region extended throughout the fused region into the HAZ and this appeared ‘to push’ highest tensile stresses laterally outwards towards and beyond the HAZ/parent material boundary.
In P91 steel, the creep strength of the fine grained HAZ during elevated temperature service is of particular concern because welds are susceptible to type IV cracking.1 The present measurements show that high tensile triaxial residual stresses are generated by the EB welding process in the type IV region, and it is possible that these stresses might exacerbate type IV creep degradation during plant operation. Of course, P91 weldments always receive a PWHT before engineering use for metallurgical reasons, and this treatment can be effective in relieving high levels of residual stress introduced by welding. However, Paddea et al. 9 have reported hydrostatic stresses of ∼50 MPa remaining in the type IV zone of a conventional multipass pipe butt weld after PWHT.
Residual stress fields that vary rapidly over fine length scales are difficult to measure with high reliability. Here, special care was taken in the neutron measurements to use a small gauge volume (1 mm3), at the expense of longer acquisition times, to position the sample and reference strips to within tens of micrometres using theodolites and to select appropriately spaced measurement locations. The neutron diffraction measurements are closely supported by contour method stress maps (a measurement technique based on strain relief) and are therefore judged to be suitable for use in validating finite element predictions of residual stress in EB welded plates.
Conclusions
Residual stresses in ∼9 mm thick EB welded plates have been measured using neutron diffraction and the contour method. A characteristic ‘M shape’ distribution of stresses across the weld line has been observed with high tensile peaks situated just beyond the HAZ/parent material boundary in both the single- and two-pass EB welded plates, that is, immediately outside those regions that have either fully or partially austenitised during welding. The length scale of this stress distribution is very short, with the tensile peaks ∼3 mm apart spanning a 1 mm wide fusion zone. Measured stresses close to the weld centreline are significantly less tensile than the adjacent peaks owing to a martensitic solid state phase transformation during cool down of the fused weld metal and adjacent austenitised material within the HAZ. Residual stresses in the EB welded plate with a second smoothing pass have higher tensile magnitude and greater spread than the single-pass case. Therefore, from a residual stress and structural integrity point of view, the application of a smoothing (second) EB weld pass is undesirable. The neutron diffraction measurements are judged to be suitable for use in validating finite element predictions of residual stress in EB welded plates.
Footnotes
Acknowledgements
The research was supported by the Indian Department of Atomic Energy and by grant EP/101215X/1 from the UK Engineering and Physical Research Council. The authors gratefully acknowledge the award of neutron beamtime by the UK STFC, the contributions of Mr Majid Ali and Mr S. N. Nagchi who carried out the electron beam welding and Dr Foroogh Hosseinzadeh who supported the contour residual stress measurements.