
Abstract
The microtexture features of Nd:YAG laser welded joints in 5A90 aluminium–lithium (Al–Li) alloys were examined using electron back scattered diffraction (EBSD). Microtexture was determined by means of the grain orientation image maps (OIM), pole figures (PF), misorientation angles and orientation distribution function (ODF) of the weld metal (WM), heat affected zone (HAZ) and unaffected base metal (BM) of the welded joint. The results show that there is a change of microtexture in the WM and HAZ of the welded joint in terms of the component and intensity of the texture. The HAZ of the welded joint inherits the texture characteristics of the BM, whereas the welding heat input has an important influence on the component C {112}<111>. The WM of the welded joint is composed of predominantly equiaxed grains with a random microtexture.
Introduction
Aluminium–lithium (Al–Li) based alloys are desirable alternatives for aircraft and aerospace structural materials, due to lithium additions cause substantial reduction in density accompanied by large increase in elastic modulus, which results in appreciable improvement of specific strength and specific stiffness of the alloys.1, 2 However, some significant challenges remain in the large scale implementation of Al–Li alloys in the aerospace industry. One of these pertains is the selection of joining methods and how these methods impact the mechanical properties of Al–Li joints.3 Much work focused on arc welding of Al–Li based alloys has been completed.4– 8 However, results from these studies suggest that some disadvantages such as a large HAZ, porosity, high residual stresses and low tensile strength existed using the conventional fusion welding.4– 6 The additional problem is the elimination of the effects of age hardening of the materials located in HAZ and WM.7, 8 In these respects, the laser welding is very attractive because lasers are very localised heat sources which allow fast welding with high quality and minimum residual stress and produce a narrow HAZ.9– 12 Specially, due to ease of automation and flexibility, Nd:YAG laser welding has gained its popularity in metal joining industry and has prompted the manufacturers to use it for both ferrous and nonferrous alloys.3, 9, 13
The selected alloy was 5A90 Al–Li shin sheet, provided by Southwest Aluminum Co., Ltd, China. In order to understand it further and enable expansion of its usage in the aerospace structures, researchers are trying to develop laser welding of 5A90 thin sheets to meet the needs of the medium strength applications. Although the possibility of laser welding is very attractive for 5A90 Al–Li alloys, the studies to understand comprehensively the technique and use of laser welding are still limited.13– 17 The vapour and plasmas characteristics, welding parameters, welding defects prevention, mechanical properties of the welded joints during Nd:YAG laser welding 5A90 Al–Li alloys have been reported.13– 16 Concerning with the microstructural features, our previous investigation shows that Nd:YAG Laser welding leads to a change of the microhardness, grain shape, grain orientations, and a disappearance of the microtexture and precipitates.17 It is well known that the crystallographic texture is an inseparable component of microstructure. Although some information on the texture features in terms of pole figures in 5A90 Al–Li alloys and in the fusion zone is available in the previous study, the texture characteristics associated with misorientation angles and ODF, especially the investigations of the texture presence in the HAZ, are not presented.
Electron back scattered diffraction (EBSD) is a scanning electron microscopy (SEM) based technique and it has been more and more widely used for texture measurement since its first application in 1988.18, 19 While there have been a lot of efforts to evaluate the texture variations in different types of aluminium alloys, it has only recently been used to investigate texture in the welds. To date, these studies are primarily focused on friction stir welds20– 23 and limited studies appear to examine texture in laser welds. Especially, little systematic characterisation work has been performed to evaluate the texture variation within each zone of the laser welded joint. The present research examines the microtexture variations of 5A90 Al–Li alloys during Nd:YAG laser welding. The EBSD, OIM, PF, misorientation angles and ODF were used for the investigation and comparison in the different weld zone regions and BM.
Experimental
The materials used in the study were 3·0 mm thick 5A90–T8 Al–Li thin sheets with nominal composition in wt pct Al, 4·9–5·4Mg, 1·8–2·2Li, 0·08–0·13Zr, ≤0·12Fe, ≤0·09Si, ≤0·05Cu, ≤0·05Ti. Before welding, the specimens were chemically cleaned so as to minimise the presence of porosity. The welding was performed by using an Nd:YAG laser with maximum laser power 4·5 kW. A 150 mm focal length lens was employed with the laser power of 1·8 kW and the weld speed of 45 mm s−1. The shielding gas supplied by high purity argon gas was at flowrates of 20 L min−1.
After welding, the welded joints were prepared for metallographic inspections. Samples for EBSD analysis were taken from the selected zone of the BM, HAZ and WM in the horizontal welded joint, as shown in Fig. 1, signed as region 1, region 2 and region 3 respectively. The directions of RD and TD correspond with X-direction representing the rolling direction and Y-direction representing the welding direction. The EBSD samples were first mechanically polished and subsequently, electropolished. The EBSD observations were carried out in a thermal field emission scanning electron microscope (SEM) JOEL 6500F with an EDAX Genesis 2000 system operating at an accelerating voltage of 15 kV. Orientation image map (OIM) was measured in a rectangular map using a step size of 0·5 μm steps between two measurements and EBSD data was analysed using EDAX-TSL 5·1 software. Figure 2
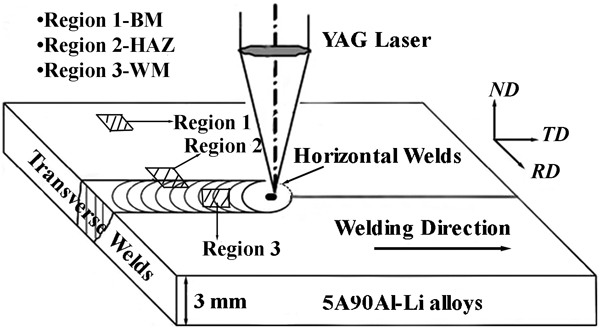
Schematic of Nd:YAG laser welding of 5A90Al–Li alloys and locations chosen for EBSD samples
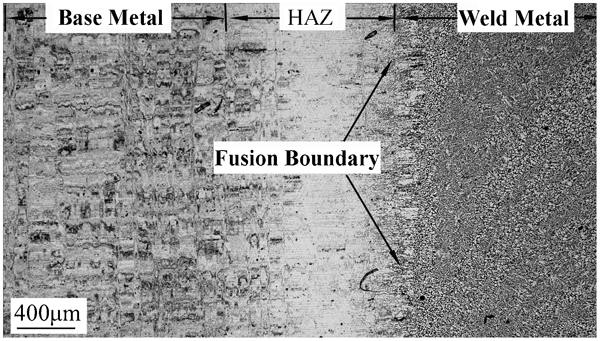
Micrograph of horizontal welded joints in 5A90 Al–Li alloys by Nd:YAG laser welding
Results and discussion
Optical microstructure
Optical metallography was performed to identify the BM, HAZ, fusion boundary and WM of a horizontal welded joint, as shown in Fig. 2. The microstructure in the BM shows typical cold rolled grain morphology. The grain structure in HAZ region is not observed clearly due to the low magnification of optical microscope. However, it clearly shows a narrow HAZ due to the low heat input and high cooling rates experienced in Nd:YAG laser welding pool.9 The fusion boundary, located between the HAZ and the WM, is characterised by a narrow band of non-dendritic equiaxed grain zone (EQZ). Additionally, the epitaxial growth from the fusion boundary and coarse columnar grain structure are not observed. The reasons for the phenomenon have been explained in a previous article.17 The microstructure in the WM shows much finer structure. The narrow HAZ and fine WM microstructures are beneficial to improve the tensile strength and hardness of the welded joint in 5A90 Al–Li alloys.
Orientation image map (OIM)
OIMs of the welded joint including BM, HAZ and WM were measured over substantial regions to obtain statistically significant orientation information. In general, the confidence index (CI) value was used to measure the reliability of the determined orientation solution. A rigorous approach should be required only if those measurements with CI values greater than 0·1 were considered.19, 24 In the present study, the average CI value of the orientation map was 0·69, indicating high reliability of EBSD data. The colour in the orientation map is based on a colour coded inverse pole figure, where points on the sample with a <111> axis parallel to the surface normal are blue, <101> green, <100> red (see legend) and intermediate orientations have intermediate colours. The grain size and grain shapes can also be easily detected and statistically investigated by grouping together adjacent pixel measurements with similar crystallographic orientations because the grain boundaries with large angle misorientations (>5°) are displayed.
The EBSD OIM of the microstructural features of the BM, HAZ and WM is presented in Fig. 3a–c. In the BM, the OIM shown in Fig. 3a is predominately green corresponding to the associated <101> oriented grains. Also, a small fraction of grains coloured in pink and yellow are observed corresponding to an intermediate orientation respectively. As a result, the BM microstructure is characterised by some preferred orientations. Additionally, the BM reveals a pancake shape with a width of 77·3 μm, as estimated by the EBSD software.
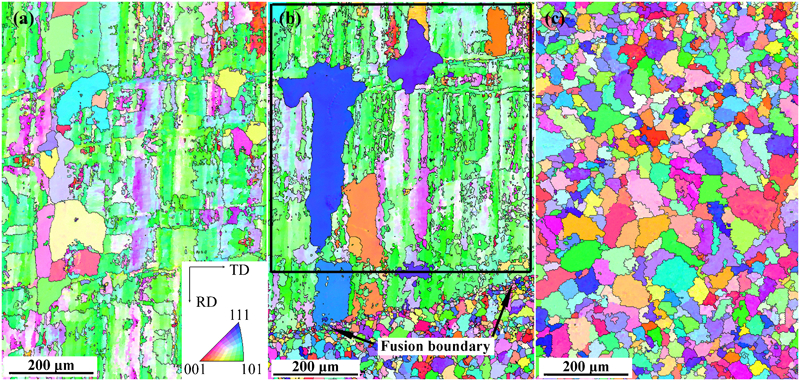
OIM of a BM, b HAZ and c WM of laser welded joint in 5A90 Al–Li alloys
OIM of the HAZ was measured in a rectangular map signed in Fig. 3b near the fusion boundary. The grain colours and grain shapes in the HAZ region shows a similarity to that of the BM. However, the width of pancake shape grains is ∼108·3 μm. The grain growth occurred in the HAZ is primarily due to the influence of heat input from the welding pool.
OIM of the WM is presented in Fig. 3c. A well developed equiaxed grain structure with a wide variety of colours corresponding to varied crystallographic orientations is observed. It clearly shows a random grain orientation for the WM. The average grain size of the WM is ∼31·0 μm, which is lower than that of the BM and HAZ. Consequently, the EBSD quantified analysis proves the above optical discussion that the fine microstructure is formed in the WM.
Misorientation angles
Figure 4 shows the distribution of the misorientation angles between 2–65° of the BM, HAZ and WM. The average misorientation angles deduced from the histograms are 19, 23 and 31° for the BM, HAZ and WM respectively. The fractions of low angle misorientation boundaries (2°<misorientation angle<15°) for the BM, HAZ and WM samples are 63, 53 and 31% respectively. As a result, an increase in frequency of high angle boundaries is evident from the BM to the WM. Consequently, Nd:YAG laser welding has an important influence on the misorientation angles of the HAZ and the WM microstructure. It is well known that low angle boundaries are converted to high angle boundaries in some alloys when they deformed at high temperatures.25 However, in the present study, Nd:YAG laser welding leads to an increase in grain boundary misorientation angles of the HAZ and WM microstructure. As shown in Fig. 3a, microstructure of the BM contains a mixture of elongated grains and a few ultrafine grains. The ultrafine grains are surrounded by high angle grain boundaries while low angle grain boundaries are noticed within the elongated grains. In the case of the HAZ, much more fine grains with very high angle boundaries as shown in Fig. 3b are associated with the increase in the high angle grain boundaries, as a result of the recrystallisation occurred in the HAZ. The increase in high angle misorientation boundary in the WM is primarily due to the formation of predominantly equiaxed grains in the WM. The formation of the predominately equiaxed dendritic grains is due to a heterogeneous nucleation mechanism aided by equilibrium A13Zr phases as well as the growth of pre-existing nuclei created by dendrite fragmentation, or by grain detachment resulted from Nd:YAG laser welding processes.17
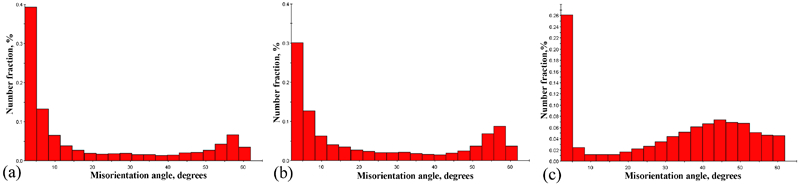
Misorientation angles of a BM, b HAZ and c WM of laser welded joint in 5A90 Al–Li alloys
Pole figure (PF)
To study the microtexture variations in the BM, HAZ and WM region of the welded joint, PFs were plotted in Fig. 5. The interpretation of these pole figures can be made with the aid of (111) pole figures with the locations of the orientations annotated on it and given by Wang.26 The coloured scale code bar indicates the orientation intensities in units of times random. Figure 6
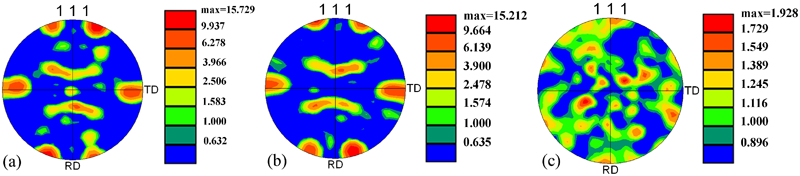
(111) pole figures of a BM, b HAZ and c WM of laser welded joint in 5A90 Al–Li alloys
ODFs of a BM, b HAZ and c WM of laser welded joint in 5A90 Al–Li alloys
By examining the intensity values, the microtexture of the BM and HAZ region can be characterised by concentrated and strong reflections. PFs of the BM and HAZ region exhibit a typical rolling texture for face-centred-cubic (FCC) materials, dominated by the S {123}<634> component, as shown in Fig. 5a and b. The red colour indicates intensity of approximately 15·7 and 15·2 times above the random background respectively. As a result, there is no change in the components and the maximum intensity in the WM region. Based on the PF data, it is obvious that only subtle change of the microtexture occurred in the HAZ and it can be deduced that the HAZ inherits the texture characteristic of the BM. This is thought to be attributed to the low heat input resulted from the YAG laser welding.
In the case of WM region, as shown in Fig. 5c, there is no particular regions of microtexture and the red regions in the PF only indicate an intensity of 1·9 times above the random background. Therefore, a random microtexture is developed in the WM region. The above behaviour in the WM is in agreement with many other studies on solidification microstructure in aluminium alloys that reported that random texture is formed in the equiaxed grains region of the WM.3, 27 Further, Hector et al. 3 suggested that the columnar grains that form on either side of the weld centrelines are highly textured, with a <001> direction parallel to the growth direction. However, <001> cube texture is not found in the WM region in this investigation. This is primarily due to the formation of the predominately equiaxed grains in the WM for 5A90 Al–Li alloys.
Orientation distribution function (ODF)
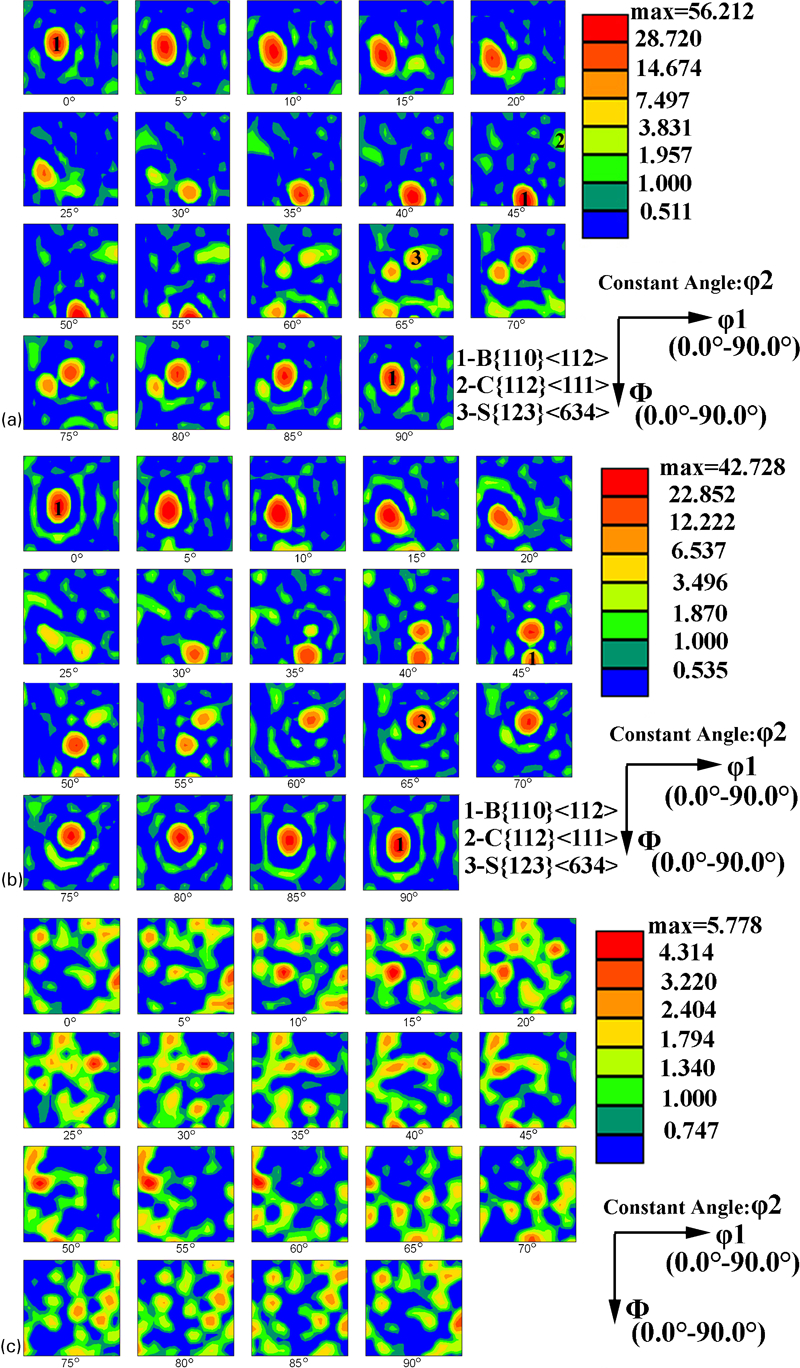
To track texture evolution of the materials, ODFs were plotted at different φ2 angles between 0 and 90°. It is well known that the microtexture of FCC materials produced by the cold rolling is generally dominated by components that belong to the so called β-fibre.28 This texture is represented by a continuous tube of orientations that connects the Copper orientation (C-{112}<111>) through the S orientation ({123} <634>) to the Brass orientation (B-{011}<211>).29 The locations of the ideal microtexture components that generally evolve during cold rolling processing of FCC materials are presented in the key ODF.30 In the present study, the ideal components are identified based on the key ODF.
Figure 6 shows the microtexture in the BM, HAZ and WM region of the welded joint for 5A90 Al–Li alloys. It can be noted that ODFs of the BM exhibit significant B{110}<112> and S{123}<634> component along with the β-fibre, plus a weak C{112}<111>component. The corresponding maximum intensity is ∼56·2 times above the random background.
In the case of the HAZ, the B{110}<112> and the S{123}<634> component are clearly observed along with the β fibre, whereas the C{112}<111> component is completely disappeared in the HAZ, as shown in Fig. 6b. Therefore, the HAZ exhibits the same microtexture types, but accompanied by the disappearance of the C{112}<111> component. Consequently, it can be suggested that the welding heat input has an important influence on the component C{112}<111>. In addition, the corresponding maximum intensity of components is 42·7 times above the random background. As a result, it is evident that the weaker texture is formed in the HAZ, which is attributed to the grain coarsening of the HAZ.27
The ODF of the WM is obviously different from those of the BM and HAZ, as shown in Fig. 6c. It is found that the microtexture of the WM is essentially random and the intensity of the components is only 5·8 times above the random background, indicating much weakened texture components. Therefore, it is immediately evident that the typical, strong rolling texture of the BM is completely eliminated and replaced by weak, random texture in the WM.
Given that mechanical properties are strongly dependent on microstructure, one would expect the texture could have a strong effect on the local mechanical response of the welds. Gustafsson et al. 31 has reported that there was clearly a relation between crystallographic texture and mechanical properties. Our previous investigation has shown that a drop in the hardness in the WM in 5A90 Al–Li alloys was primarily due to an absence of δ’ precipitates.17 However, it can be suggested that not only the absence of δ’ precipitates, but also the microtextural variations is probably associated with the decrease in hardness of the WM. Now, it is a pity that the relationships between crystallographic texture and mechanical properties are not very clear. This observation and other aspects of the underlying relationships will be investigated further.
Conclusions
Based on the above results and discussion, the following conclusions can be made from this work.
5A90 Al–Li alloys shows a typical cold rolling microtexture for FCC metals with strong intensity.
Microtexture in the HAZ region of the welded joint in 5A90 Al–Li alloys inherits the texture characteristics of the BM, but with the lower intensity. The welding heat input has an important influence on the component C {112}<111>.
The WM microstructure of the welded joint in 5A90 Al–Li alloys is characterised by a random texture. An increase in the high angle boundaries (misorientation angle ≥15°) of the grains is found in the WM.
Footnotes
Acknowledgements
This work was supported by a grant from the Aeronautical Science Foundation of China, under grant number 20125475002. A portion of this work was performed under the support of the Scientific Research Project of Beijing Municipal Commission of Education, under grant number 00900054R5004.
This paper is part of a special issue on computed-aided welding engineering