
Abstract
The novel shear compression specimen was used to simulate the microstructural evolution in linear friction welding joints of Ti–6Al–4V alloy. Similar formation mechanisms of microstructures and microtextures were found in the linear friction welding joints and shear compression specimen. Accordingly, the shear compression test was proved to simulate the microstructural evolution and the thermomechanical conditions that occurred in linear friction welding joint. Furthermore, the strain rate in linear friction welding was estimated to exceed the value of 70 s− 1.
Introduction
Linear friction welding (LFW) is an advanced solid state joining process to join titanium alloys. 1 As is well known, the microstructures and microtextures have significant influence on mechanical properties of weld joints, so it is important to understand the formation mechanisms and the thermomechanical conditions for the microstructures and microtextures of LFW joints. 2
The physical simulation tests, such as uniaxial compression, plane strain compression and torsion, have been proven to be a simple and effective method to investigate the factual hot deformation process.3–7 Particularly, factual thermomechanical conditions can be inferred by comparing the similar microstructures between simulated and factual specimens. For example, Masaki et al. used a plane strain compression test to simulate the recrystallised microstructures in friction stir welded (FSW) Al alloys. Moreover, they estimated the equivalent strain rate during FSW between 1.7 and 2.7 s− 1. 7 However, the accuracy of the thermomechanical conditions obtained by these tests is also worthy to discuss because of the difference in the deformation mode between simulated specimens and real joints. A similar case might be found in the microstructural simulation of LFW because the shear compression deformation might be primary in the welded zone of LFW joints.
Recently, a new geometry of specimen, the shear compression specimen (SCS), had been developed by Rittel et al. for the cold deformation of metals with high strain and strain rate. 8 It consisted of a short cylinder into which two slots had been machined at 45° to the longitudinal axis. As the specimen was loaded along the axial direction, the material in the gage section between the two slots experienced a combined deformation of shear and compression.9, 10 Benefitting from the specific deformation mode of the SCS, Moemeni et al. attempted to investigate the hot deformation behaviours of AZ31 magnesium alloy. 11 Accordingly, based on the similar deformation modes, we tried to seek the feasibility to investigate the thermomechanical behaviours and microstructural evolution in the LFW joint using the SCS. Furthermore, the strain rate during LFW was discussed.
Experimental
The as received material was typical Ti–6Al–4V titanium alloy with equiaxed α phase and a few of intergranular β phases. The size of the Ti–6Al–4V block used for LFW was 50 mm × 12 mm × 12 mm.
A schematic illustration of the LFW process is illustrated in Fig. 1a. The oscillation frequency and amplitude were set as 30 Hz and 3 mm respectively. The friction pressures and weld time were set as 0.74 kN and 3 s respectively. The temperature in the weld region was estimated to be ∼950°C by the methods of submerged thermal couple, which agreed with the results of Chang et al. 12 Specimens used for microstructural analysis were cut from the central position of the welded joints with the cutting plane perpendicular to the Y axis.
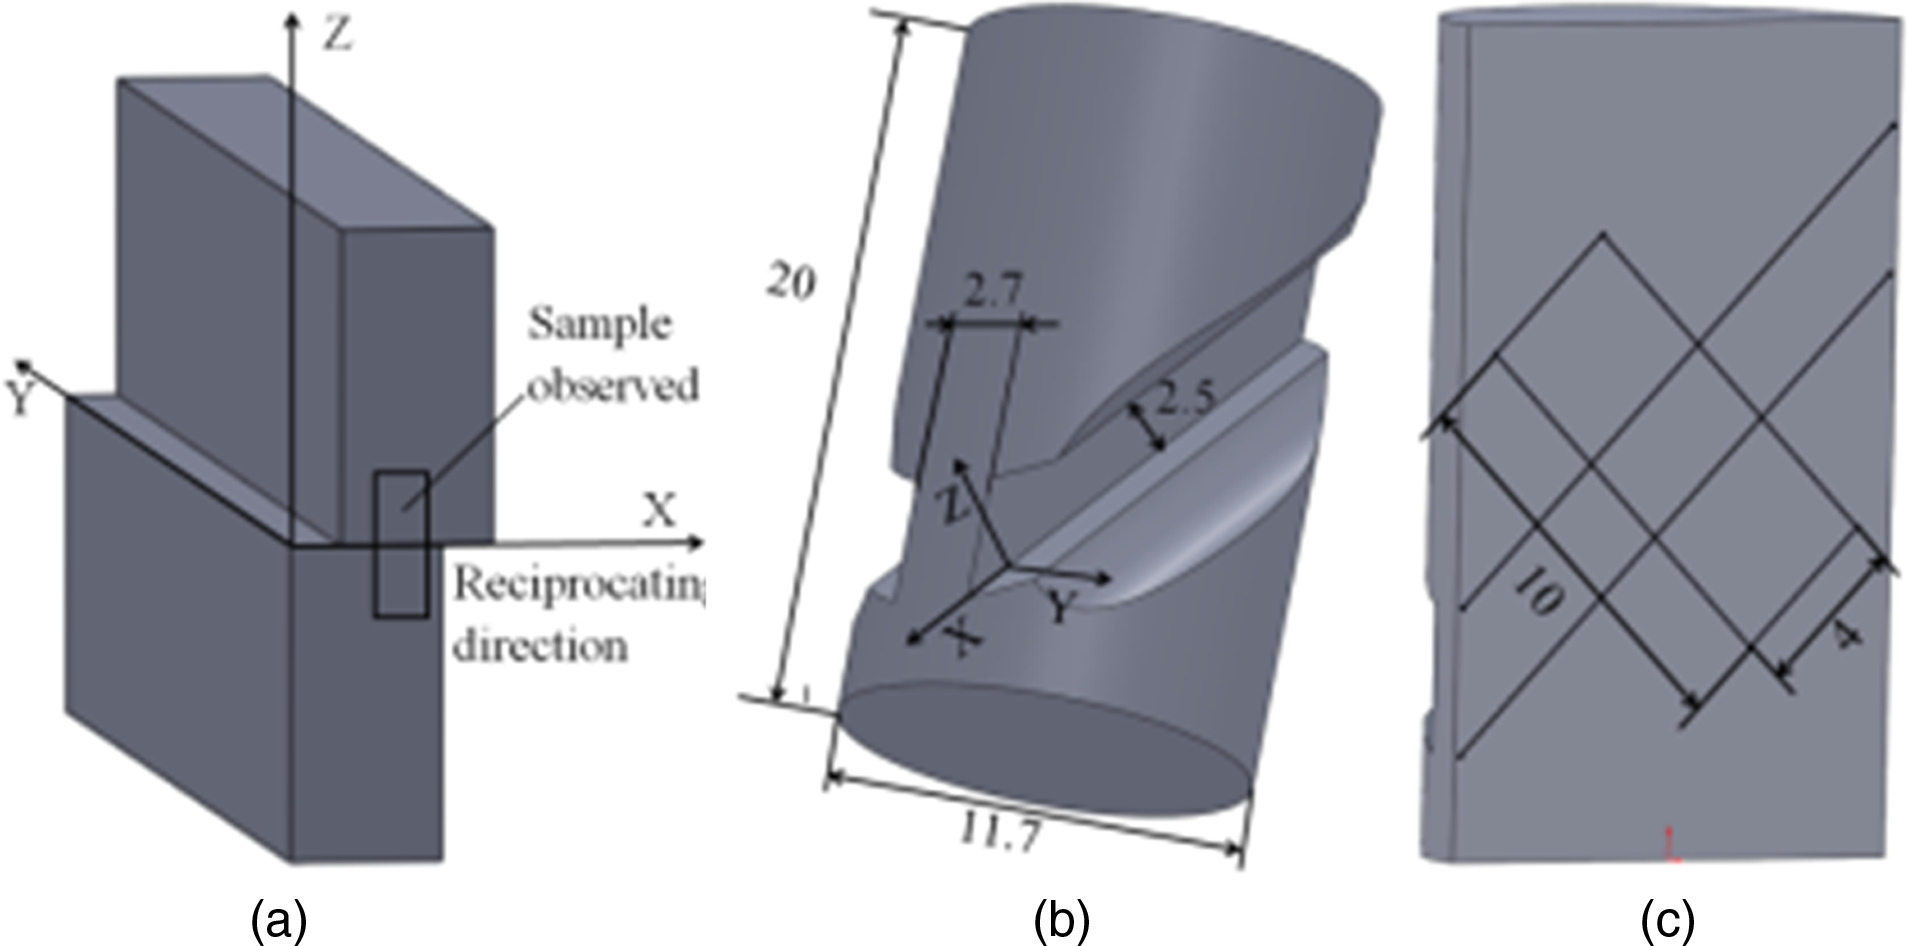
Schematic configuration: a LFW; b, c SCS
The profile of the SCS is schematically indicated in Fig. 1b. The SCS tests were executed on Gleeble-3500 thermal physical simulator. Referring to the process of the LFW, the SCS was first heated at 950°C for 30 s and then were loaded along the axial direction at the equivalent strain rate of 70 s− 1. The water cooling was used to retain the deformation microstructures once the hot deformation was finished. As shown in Fig. 1c, the specimens used for microstructural analysis were sectioned perpendicularly to the gage section with a size of 10 mm × 4 mm × 2 mm.
Specimens for electron backscatter diffraction (EBSD) analysis were prepared by a final electrochemical polish with the electrolyte composed of 280 mL ethanol+80 mL perchloric acid+40 mL glycerinum. EBSD mapping was obtained on a Hitachi S-3400N scanning electron microscope equipped with an EDAX-TSL EBSD acquisition system. The step size used for EBSD scanning was 0.3 μm. The pole figures were represented in the XY plane. Moreover, the X direction and Y direction represented the rolling direction (RD) and transversal direction (TD) respectively. Therein, the X direction was parallel to the direction of reciprocation during the LFW and the direction along slots in the SCS test.
Results and discussion
Microstructural evolution
The orientation imaging microscopy (OIM) maps of the microstructures in the LFW joint and SCS are presented in Fig. 2a and b respectively. In the maps, dark lines correspond to the high angle boundaries with misorientation angles higher than 15°, while grey lines correspond to the low angle boundaries with misorientation angles between 2° and 15°. From Fig. 2a and b, the similar microstructure features can be observed in LFW joint and SCS. The microstructures typically consisted of diverse morphological characteristics of α grains, such as α lath, fine equiaxed α grains (as marked with black arrows) and middle size α grains (as marked with grey arrows).
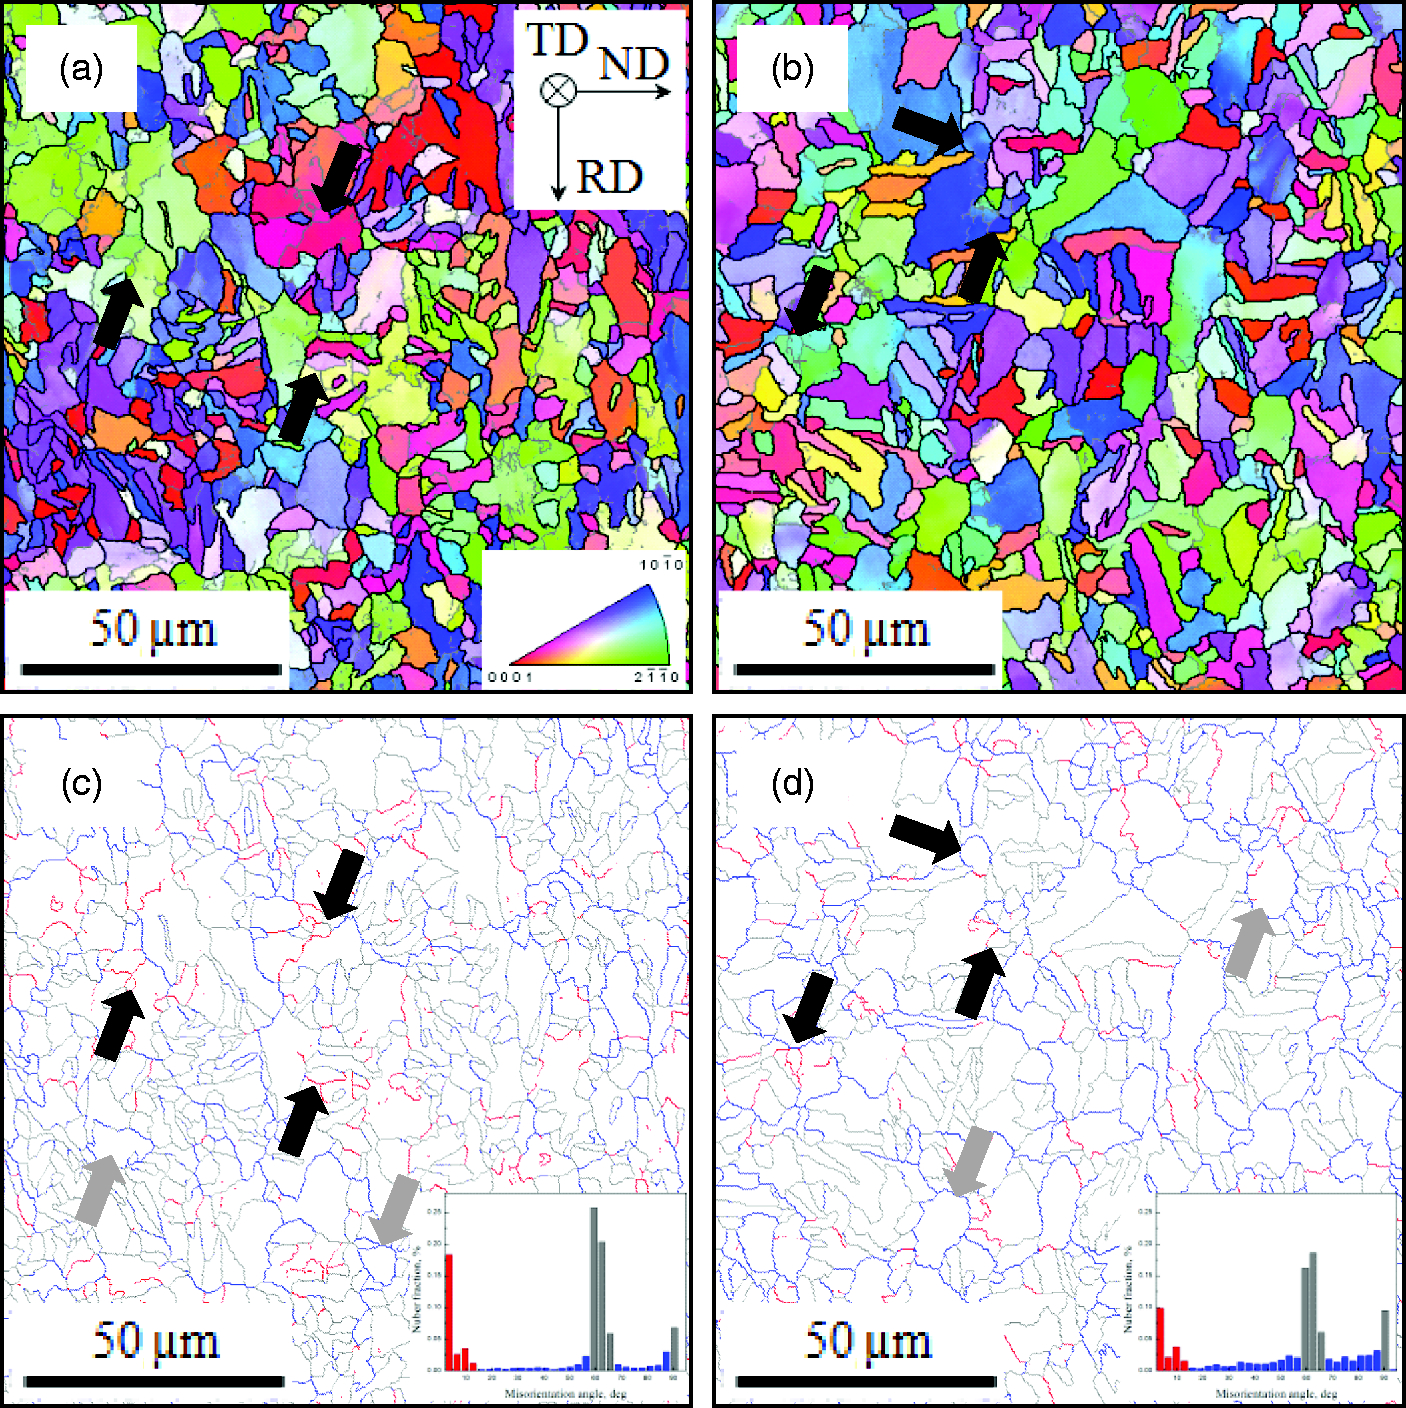
OIM: a LFW joint and b SCS; grain boundary maps of reconstructed β grain structures: c LFW joint and d SCS
To discuss the microstructure evolution in the LFW joint and SCS, the high temperature β grain structures should be clarified. However, the direct observation of the high temperature β grain structures looks like impossible for the interferences of the β → α transformation during the cooling stage of the LFW and SCS tests. Thus, high temperature β grain structures were reconstructed using the method proposed by Gey. 13 This method is based on the Burgers relationship: special α variants inherited from the same β grain can only produce specific misorientations, which are < 0001> 10.53°, < 11–20> 60°, < 1.377, -1, 2.377, 0.359> 60.83°, < 10, 5, 5, -3> 63.26°, < 1, -2.38, 1.38, 0> 90°. Grain boundaries, except these variants, can be used to reconstruct the high temperature β grain boundaries. 14
The grain boundary maps of the reconstructed β grain structures on the LFW joint and SCS are given in Fig. 2c and d respectively. In the maps, blue lines correspond to the high temperature β grain boundaries, while grey lines correspond to the grain boundaries between special α variants and red lines correspond to the low angle boundaries. It can be seen that the retained α grains (as marked by grey arrows and without submicrostructures) are surrounded by high temperature β grain boundaries in both the LFW joint and SCS. In comparison, the hot deformations prefer to occur in high temperature β grains and result in the emergence of submicrostructures (as marked by black arrows). These submicrostructures finally transformed into the recrystallised microstructures, which consisted of both high and low angle boundaries. In addition, similar misorientation distribution between recrystallised grains (as marked by black arrows) and adjacent high temperature β grains could be found in Fig. 2a and b. It was considered as the evidence of continuous dynamic recrystallisation (CDRX) that occurred in high temperature β grains during hot deformation.15–17
In addition, the similar misorientation angle distribution in specific misorientation (∼10°, 60–63°, 90°) can be seen in LFW joint and SCS (see the insert maps in Fig. 2c and d ). It revealed the similar α variant selection that occurred in the β → α transformation and the similar deformation mode that occurred in high temperature β grains in LFW joint and SCS. Moreover, the similar α variant selection can also reveal the similar thermomechanical conditions that occurred in LFW and SCS test.
It is noted that the microstructures in LFW joint (Fig. 2a) look like more refined than that in the SCS (Fig. 2b). This can be attributed to the greater deformation in < 0.1 s during the deceleration stage of LFW 18 , i.e. the more complete DRX consequences in more refined microstructure in the LFW joint. On the contrary, the SCS experienced a relatively stable deformation process. Despite the difference in deformation extent, the similar microstructure evolutions imply the feasibility to simulate the microstructures in LFW joint using the SCS with moderated deformation condition.
Microtextural evolution
As is well known, the microtextures could also, in turn, reflect the deformation mode of metals during the hot deformation process. For example, the {112} < 111> microtexture is one of the main ideal orientations in simple shear deformation of body centred cubic metals. 19 Accordingly, the deformation mode can also be revealed by comparing of the microtexture component. Orientation maps presented by (0001) and (11–20) pole figures in the weld line of LFW joint and the gage section of SCS are shown in Fig. 3a and d respectively. Therein, the texture components of TD, RD and basal direction (BD) and texture strengths (times random) are indicated.
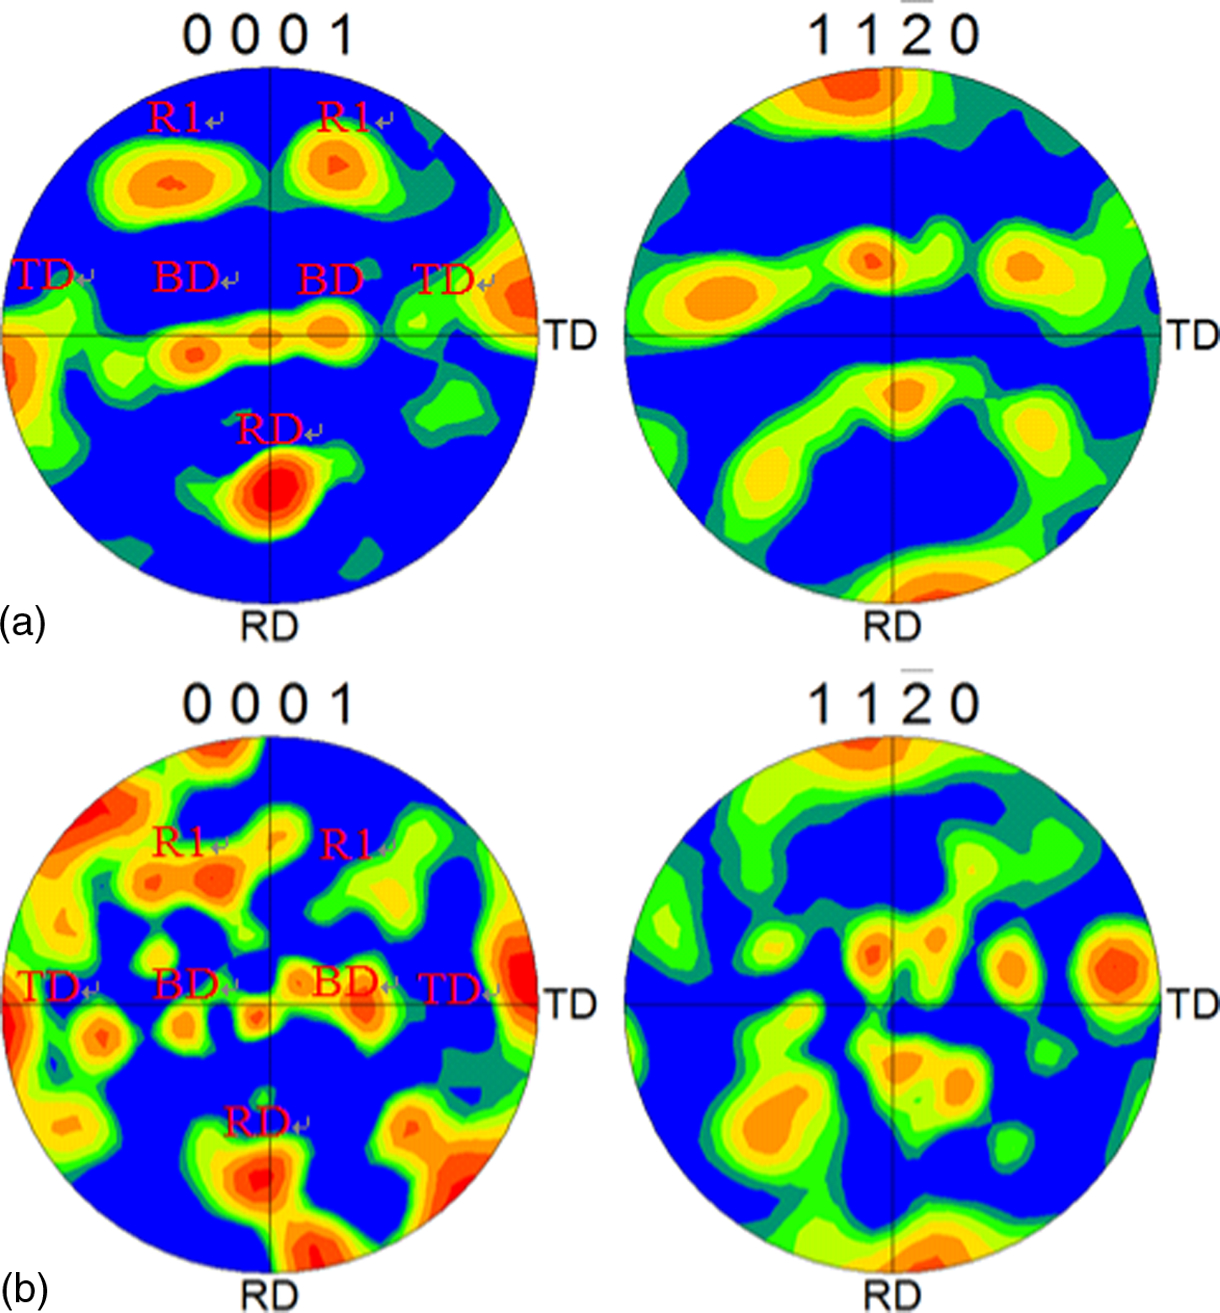
(0001), (11–20) pole figures: a obtained at weld line in LFW joint (TD: 6X random, RD: 11·6X, BD: 5·5X, R1: 5·3X); b obtained at gage section in SCS (TD: 3·9X, RD: 3·5X, BD: 2·9X, R1: 3·1X)
From Fig. 3, similar microtexture components can be found in the LFW joint and SCS. The final microtexture components are mainly derived from a {112} < 111> β deformation microtexture generated during the hot deformation stage. At the subsequent cooling stage, the β → α transformation produces the inheritance of β deformation microtexture. It was found that the recrystallisation in LFW joint and SCS had lesser effects on the deformation microtextures. It might be due to that the recrystallised grains in CDRX show similar orientation with high temperature β grains, and different from the case in discontinuous recrystallisation, of which the recrystallised grains show significant orientation change with high temperature β grains. 15
Although β deformation microtexture plays a major role, the retained α deformation microtexture cannot be ignored. It can be reflected by the enhanced RD texture because the pyramidal slip system ({11–22} < 11–23>) prefers to occur in the deformed retained α phase. In addition, different from the strong TD texture (∼10 times greater than RD) obtained after the hot deformation in β field, 20 the approximately equal strength of the TD and RD texture can be obtained when the hot deformation occurs in the present case of α+β field. It can also be noted that the microtexture evolution in the LFW joint looks like more complete than that in the SCS. The greater deformation in LFW promotes the formation of β deformation microtexture.
Based on the results shown above, it can be deduced that the deformation mode in the LFW joint and SCS is not only the pure simple shear or compression but also a combined deformation mode with shear and compression. Moreover, it also further establishes the feasibility to simulate the shear compression deformation in the LFW joint using the SCS.
Strain rate occurred in LFW
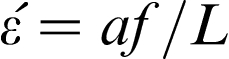
As mentioned above, the microstructural evolution of LFW joint is closely related to the thermomechanical conditions, such as the welding temperature, deformation mode and strain rate.21, 22 Therefore, it is essential to achieve the thermomechanical conditions that occurred during LFW. The welding temperature can be measured directly using thermocouples. The deformation mode of two parts in the joint can be controlled by the LFW machine. However, the strain rate that occurred in the LFW joint is really difficult to study directly by the experimental methods. Vairis and Frost developed a simple calculation method to obtain the strain rate based on the welding parameters of LFW.21, 23 The strain rate was initially calculated using the following equation:
In addition, Turner et al. developed a numerical model to calculate the strain rate during LFW of Ti–6Al–4V alloy. The constitutive laws used in their numerical simulation were formulated based on a set of hot isothermal compression tests at a constant strain rate (strain rate ≤ 1000 s− 1) using JMatPro software. 25 However, the calculated maximum value of the strain rate (2500 s− 1) has exceeded the given range of the maximum strain rate in the constitutive laws, and far beyond the value of that calculated by the method of Vairis (1 s− 1). Obviously, this method had a limitation to directly calculate the strain rate in LFW.
Considering the similar microstructural evolution and the greater deformation in LFW joint, it can be easily understood that the strain rate that occurred in LFW joint must exceed the equivalent strain rate of 70 s− 1 in the SCS. However, the more accurate value of the strain rate may be achieved only by increasing the equivalent strain rate of SCS test in the future. In addition, it must be pointed out that the all strain rates derived from either the calculation or simulation only represent average value of the strain rate during the whole process of LFW.
Conclusions
In summary, both the microstructures and microtextures of the welded zone in LFW joints are successfully simulated using the novel SCS. In addition, the strain rate during the LFW process has been estimated to exceed the value of 70 s− 1. At the same time, the SCS provide not only a new way to simulate the combined deformation mode with shear and compression but also a more accurate constituted model for the numerical simulation of some factual hot deformation process with complex deformation mode. The basic research studies of the thermomechanical behaviours in SCS need more attention in the future.
Acknowledgements
We thank the China Friction Welding Center, Beijing Friction Stir Welding Technology Limited Company for financial support.