
Abstract
A solid state joining process, called friction bit joining, was used to spot weld aluminium alloy 7075-T6 to dual phase 980 steel. Lap shear failure loads for specimens without adhesive averaged ∼10 kN, while cross-tension specimens averaged 2·8 kN. Addition of adhesive with a thickness up to 500 μm provided a gain of ∼50% to lap shear failure loads, while a much thinner layer of adhesive increased cross-tension failure loads by 20%. Microstructures of the welds were martensitic, but the hardness of the joining bit portion was greater than that of the DP 980, owing to its higher alloy content. Softening in the heat affected zone of a welded joint appeared to be relatively small, though it was enough to cause nugget pullout failures in some lap shear tension specimens. Other failures in lap shear tension were interfacial, while all of the failures in cross-tension were interfacial.
Keywords
Introduction
One of the current challenges in autobody manufacturing is the joining of dissimilar materials, as advanced high strength steel (AHSS) and light metals are designed into structures. Resistance spot welding (RSW) cannot be used for most cases of dissimilar metals joining, and self-piercing riveting (SPR) has limitations when material strength is very high and ductility is low. Previous works demonstrated joining of dissimilar metals by various processes, including laser welding, RSW, SPR, friction stir welding (FSW) and adhesive bonding.1–10 A new approach to spot joining of dissimilar materials, called friction bit joining (FBJ), was developed in order to overcome some of the challenges associated with the use of RSW or SPR when an AHSS must be joined to a light metal, for example. Prior work has shown that FBJ is a viable method for spot joining of various combinations of AHSS and light metals.11–14
One class of AHSS alloy that has seen increasing use in autobody structures is dual phase (DP) steel. These alloys have good mechanical strength, high workhardening rate, and high uniform and total elongation. 15 Their microstructures have various fractions of ferrite and martensite, depending on the alloy. DP 980 typically has about equal fractions of ferrite and martensite, with tensile elongation in the range of 15–18%. The joining of DP 980 steel to an aluminium alloy (AA) is a technical challenge. RSW cannot be used because the melting and mixing of steel and aluminium in the weld results in poor mechanical properties, while the use of SPR is difficult with a high strength, relatively low ductility alloy like DP 980.
Among the AAs being considered for autobody structures is AA 7075-T6, whose primary use has been for aircraft structure applications. 16 For this reason, the present work focused on the joining of DP 980 steel and AA 7075-T6 in order to study the static joint strength that is possible with this combination of materials. In particular, the joint strength of dissimilar combinations of AA 7075-T6 and DP 980 sheets welded by FBJ was investigated for spot joints produced with and without adhesive.
Experimental
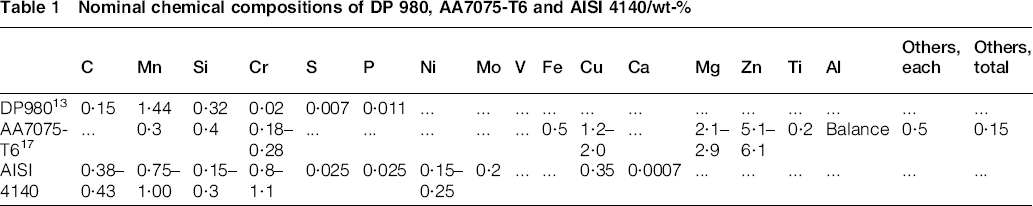
The sheet materials used for the present work were 1·2 mm thick DP 980 steel and 1·6 mm thick AA 7075-T6. Joining bits were made from AISI 4140 alloy steel with 28–30 Rockwell C ( = 280–300 HV) hardness. Nominal chemical compositions of each material are given in Table 1.13, 17
Nominal chemical compositions of DP 980, AA7075-T6 and AISI 4140/wt-%
In order to produce hybrid specimens (adhesive+FBJ), an epoxy based structural adhesive (Betamate 4601) was used.
Description of joining processes
Initial experimentation on FBJ was conducted to find the optimum weld process parameters, leading to the highest lap shear strength. This experimentation resulted in a two-stage joining process. During the first stage, the joining bit cut through the top sheet (aluminium) using a spindle speed of 2000 rev min− 1 and a plunge rate in the z direction of 152·4 mm min− 1. During the second stage, when the joining bit was bonded to the bottom sheet (steel), the plunge rate remained the same, but the spindle speed was increased to 2750 rev min− 1. The total distance plunged by the bit was 4·3 mm, which was accomplished in 1·7 s, but the physical penetration into the joint was smaller. Penetration was approximately equal to 2 mm, which is slightly greater than the thickness of the aluminium top sheet. The rest of the travel distance was accommodated by the compression and spreading of the bit tip during friction bonding to the steel sheet, for a total travel distance of 4·3 mm.
In addition to specimens welded by FBJ alone, there were also specimens that employed FBJ and adhesive, which is similar to the weldbonding approach that has been used with RSW. 18 In order to prepare specimens, a masking tape was put on both the DP 980 and the AA 7075-T6 surface, except in the overlapped area. Then, the adhesive was squeezed onto the bottom steel sheet, in the area where the joint overlap would occur, using a bead with an X shape, as described in prior work. 19 The overlap was 25 mm × 25 mm, so when a sufficient quantity was applied, an even thickness of adhesive resulted across the entire overlap area after the two coupons were squeezed together by the welding fixture. The thickness of the adhesive was controlled by adding glass beads to the adhesive. Three different conditions were tested: no glass beads, 300 μm glass beads and 500 μm glass beads. The lap shear specimens were prepared with the aluminium sheet placed on top of the steel sheet, as shown in Fig. 1. Finally, a clamping fixture was used to hold the two assembled sheets together while welding by FBJ was done. Adhesive that squeezed out of the joint during the clamping and welding process was removed with acetone. The welded specimens were then cured in a furnace at 165°C for 30 min. In addition to lap shear tension specimens, some cross-tension specimens were prepared both with and without adhesive, but no glass bead spacers were used.
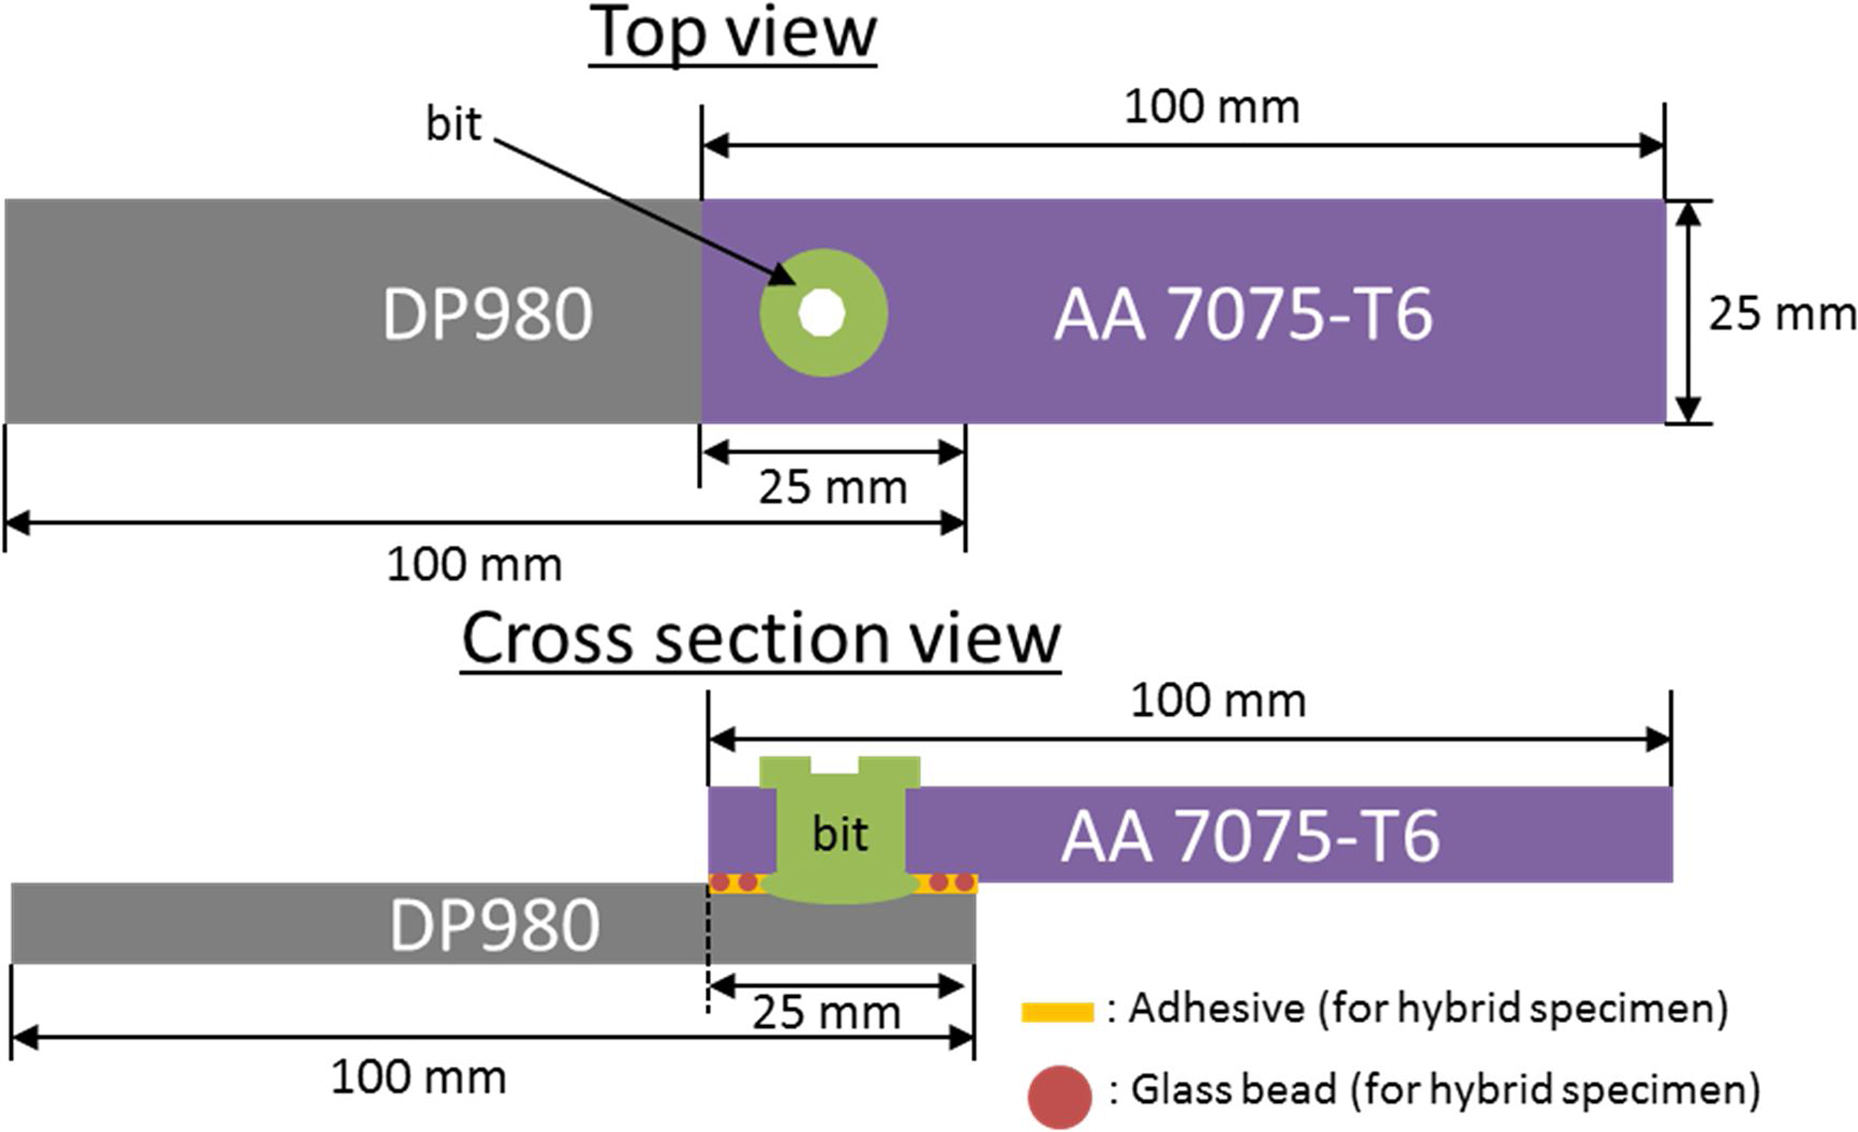
Schematic of FBJ process (top) and hybrid (adhesive+FBJ) process; specimens had different sizes (300 and 500 μm) of glass beads to control adhesive thickness, as well as no glass beads
Mechanical testing methods
The FBJ and hybrid (adhesive+FBJ) specimens were tested in both the lap shear configuration and the cross-tension configuration in order to characterise joint strength. The tests are shown in Fig. 2.
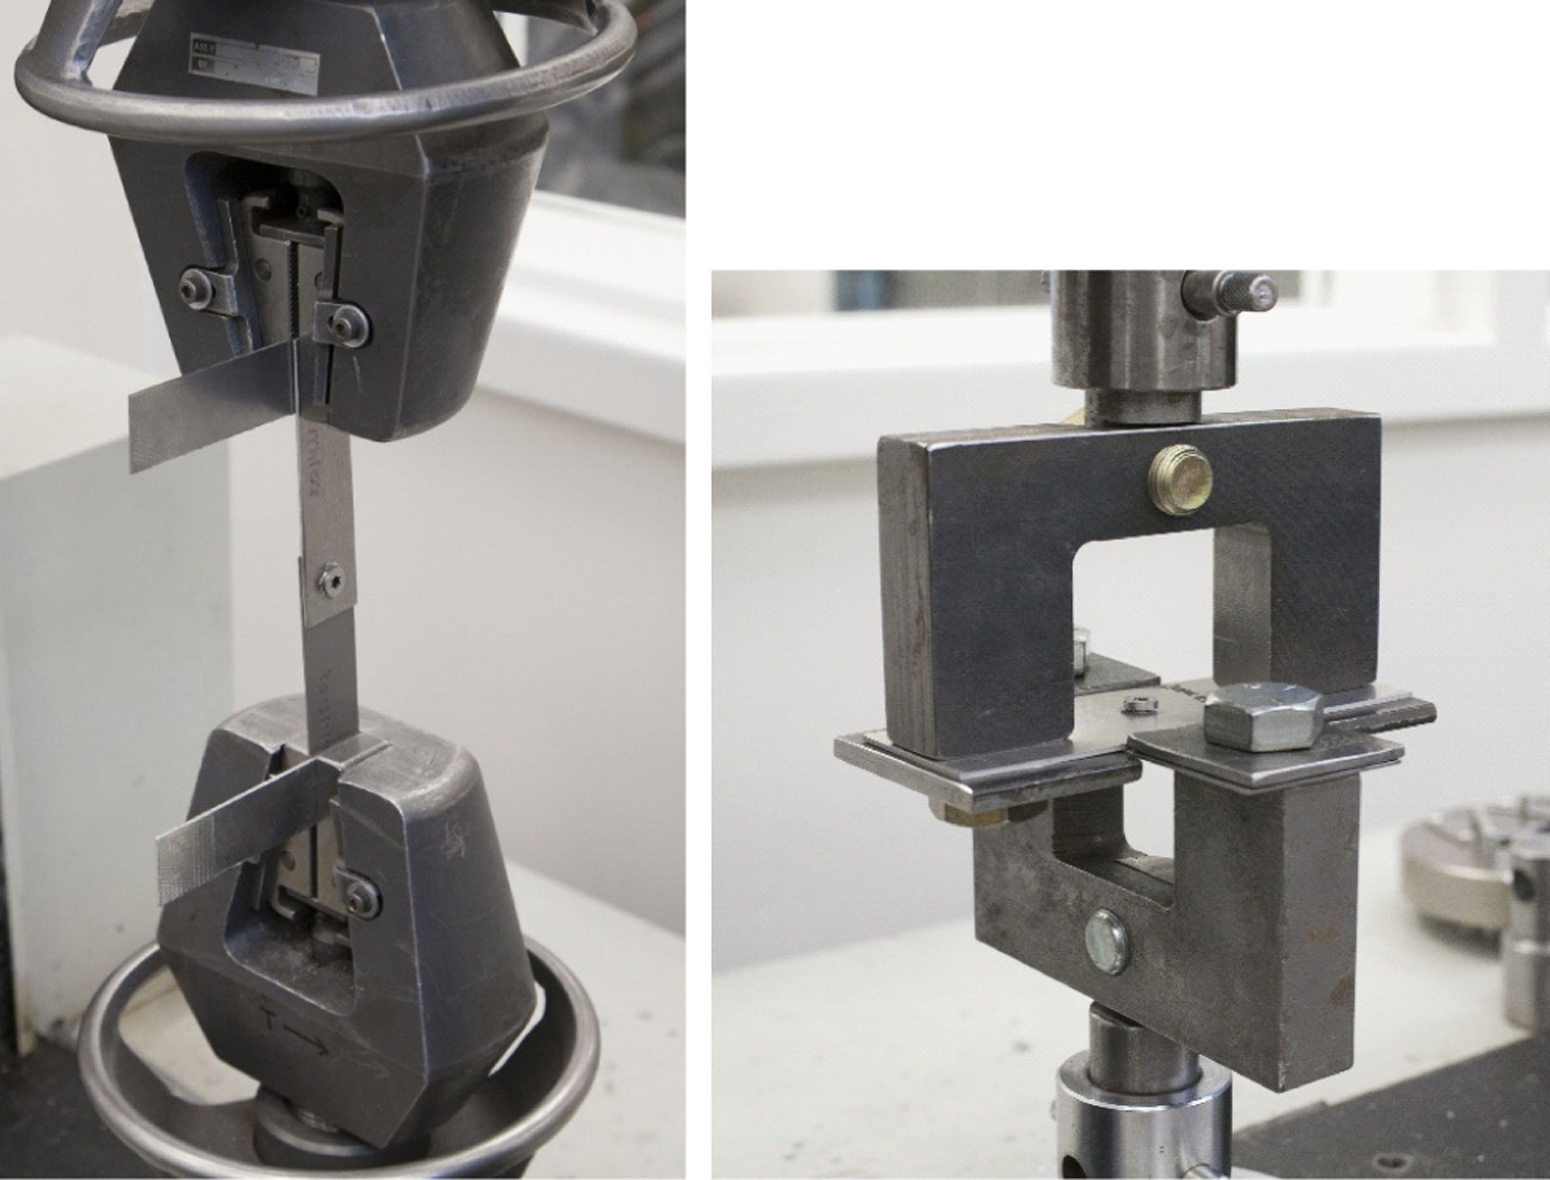
a lap shear tension specimen gripped for testing, with shims to align specimen between the grips; b cross-tension specimen gripped for testing
The surfaces of both as received sheet metals were cleaned with acetone, followed by isopropyl alcohol. Steel and aluminium sheets were then cut into coupons with dimensions of 25 mm in width and 100 mm in length for lap shear specimens, and 50 mm in width and 150 mm in length for cross-tension specimens. Lap shear specimens had a 25 mm overlap, while cross-tension specimens had a 50 mm overlap. In both cases, the welds were placed in the centre of the overlap. Spacers were used to grip the lap shear specimens in order to align them vertically between the grips. Cross-tension specimens used coupons that were 50 mm wide and 150 mm long, with the weld placed in the centre of the overlap. The lap shear specimens had several different adhesive thicknesses (a thin layer of ∼30 μm), and cross-tension specimens only had one adhesive thickness and did not use glass bead spacers. Testing was conducted on an Instron screw driven test frame, using a constant crosshead speed of 10·2 mm min− 1, at room temperature.
Microhardness and metallographic characterisation
Selected specimens were cross-sectioned, then mounted and polished for metallography examination using both optical and electron microscopy. Sectioned joints were mounted in Bakelite and then polished using different grades of SiC paper (400, 600, 800, 1200 and 2400). Finally, the specimens were polished using 6, 3 and 1 μm diamond paste. Before microscope inspection, most specimens were etched with a 0·5% Nital solution. An optical microscope (Nikon Epiphot) and field emission scanning electron microscope (SEM) (Hitachi S4800) were used to characterise microstructures. Vickers microhardness testing (Leco LM100AT) was also done with FBJ specimens under the following conditions: 150 μm spacing, a 500 g load and 13 s of dwell time. Then, the Origin software was used to visualise the measured hardness maps. Sectioning was performed using wire electrical discharge machining (EDM), with the cut being made through the centre of the joint.
Results and discussion
Lap shear tension and cross-tension testing
Several different conditions were used for the welds that were tested in the lap shear configuration. Specimens were produced with various combinations of overlap and with adhesive present in different thicknesses, as controlled by glass bead spacers. Three specimens were tested, and the lap shear failure loads were averaged for each condition. In the case of DP 980 steel in 1·2 mm thickness, the lap shear failure loads were ∼10 kN, as shown in Fig. 3, with not much difference between overlap conditions.
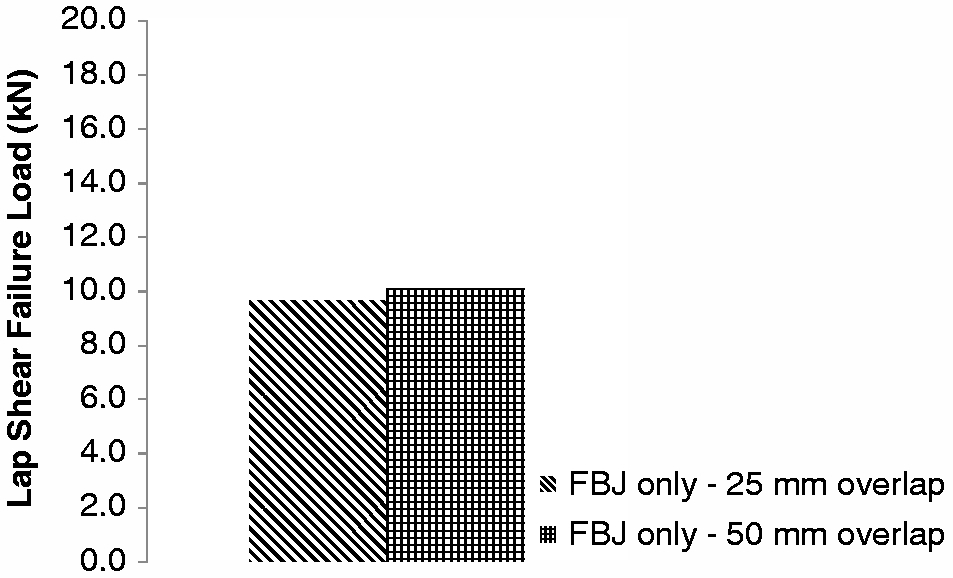
Lap shear failure loads for FBJ only specimens, using 25 and 50 mm overlap (average of three specimens for each case)
When adhesive was added to the joint, lap shear failure loads increased for overlaps of 25 and 50 mm, as seen in Fig. 4. For each overlap condition, three different adhesive thicknesses were used. In the first case, no glass bead spacers were used, so adhesive was squeezed out of the joint during FBJ, but some residual adhesive remained (measured to be ∼30 μm in thickness). In the second and third cases, specimens had 300 or 500 μm glass beads as spacers to maintain adhesive thickness at a precise level. The adhesive thicknesses were verified by measurement with a caliper, after testing of the joints. When 300 and 500 μm glass beads were used, the adhesive thickness was accurate to the bead diameter, within 5 μm.
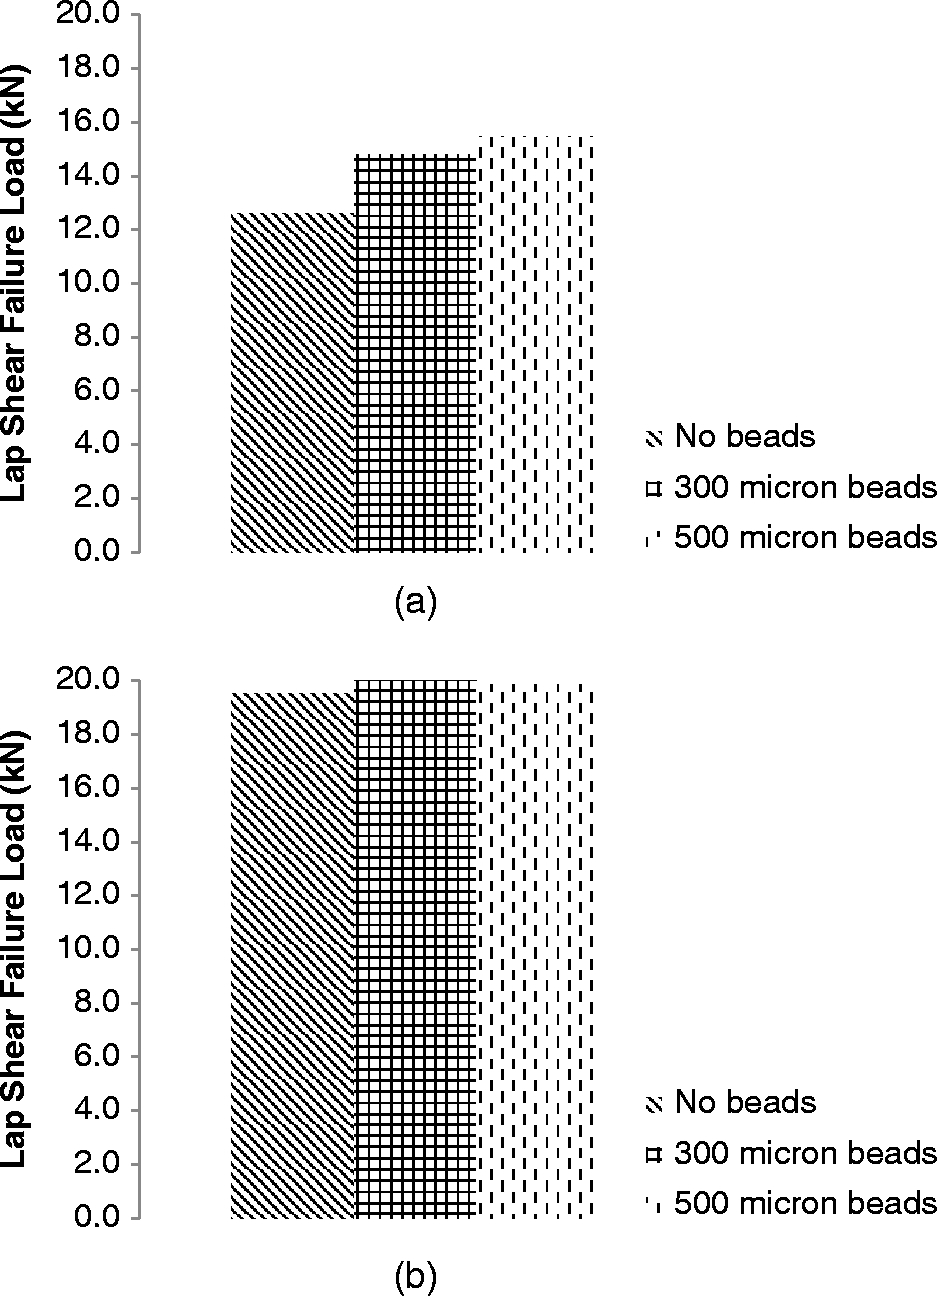
a lap shear failure loads for hybrid (adhesive+FBJ) specimens, using 25 mm overlap (average of three specimens for each case); b lap shear failure loads for hybrid (adhesive+FBJ) specimens, using 50 mm overlap (average of three specimens for each case)
For the 25 mm overlap, the adhesive thickness had an effect on lap shear failure load, with greater thickness leading to higher joint strength, as seen in Fig. 4. When a 50 mm overlap was used, the lap shear failure loads all ranged from 19·5 to 20·5 kN, regardless of the adhesive thickness.
Specimens bonded with only adhesive were also tested in order to compare the relative contributions to joint strength of the FBJ spot weld and the adhesive. The same process used to prepare hybrid (adhesive+FBJ) specimens was used in this case, but after the specimens were cured, the spot weld was removed by plunge EDM, which minimised the damage to both the metal coupons and the adhesive in the joint. Removal of the spot weld left only the adhesive present and allowed for an evaluation of its contribution to joint strength. Figure 5 shows the mating surfaces of an adhesive joint that had the spot weld removed before testing.
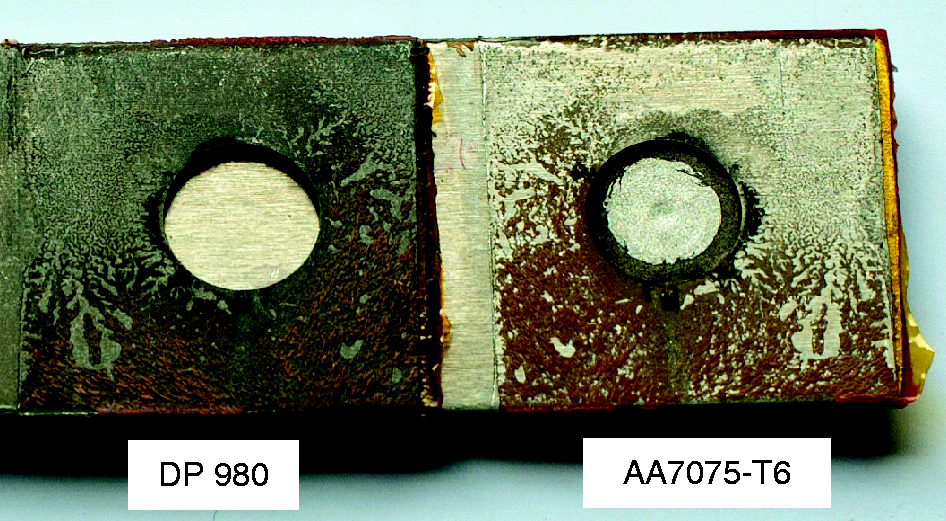
Adhesive specimen, after testing in lap shear tension; in this case, no glass bead spacers were used, so only small amount of adhesive (orange colour) was present in joint; FBJ weld was removed before testing, using plunge EDM, in order to evaluate contribution of only adhesive to joint strength
After removal of the FBJ spot weld from the hybrid (adhesive+FBJ) specimens, they were tested in lap shear tension. Results for the 25 mm overlap and 50 mm overlap specimens are shown in Fig. 6.
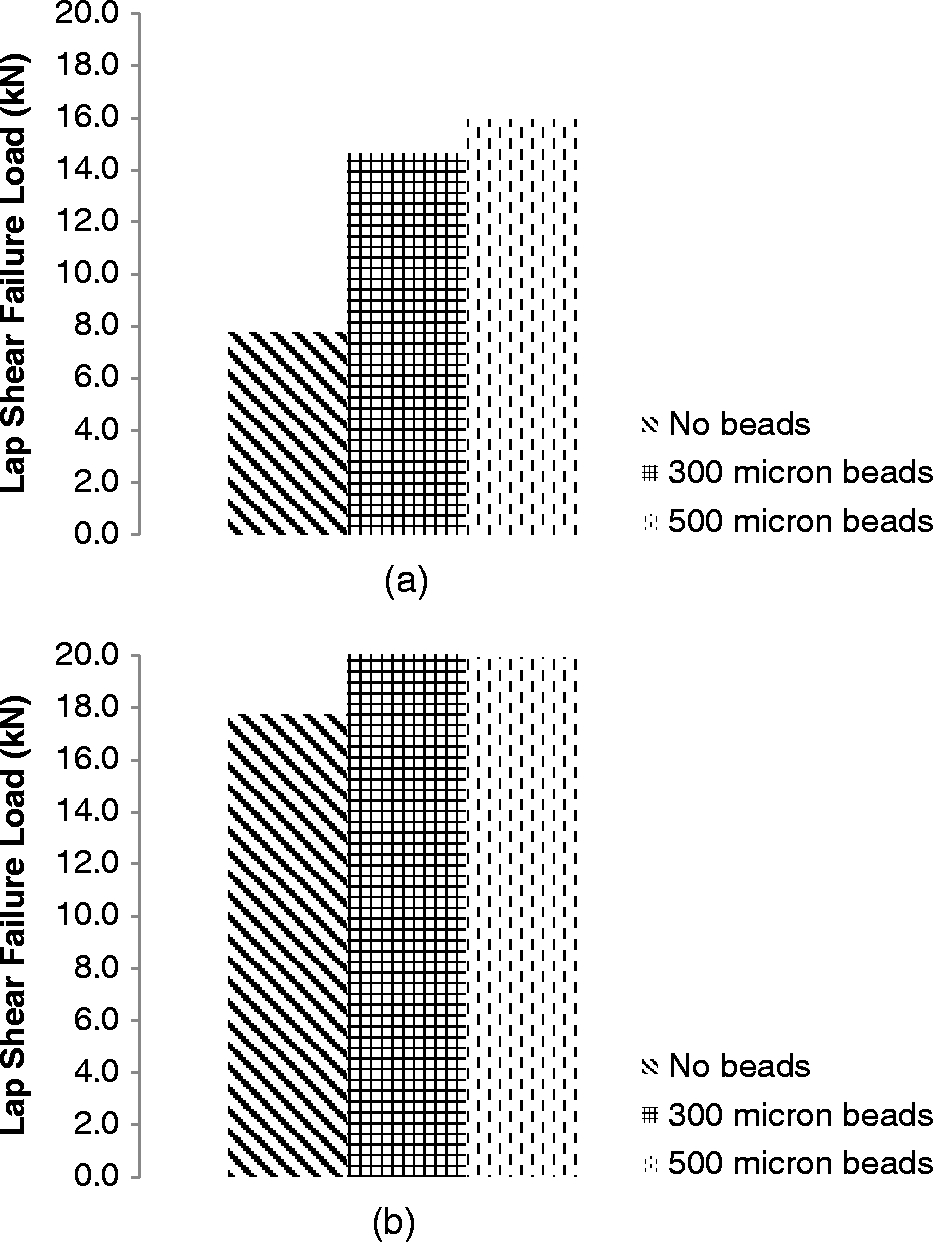
a lap shear failure loads for adhesive only specimens, using 25 mm overlap (average of three specimens for each case); b lap shear failure loads for adhesive only specimens, using 50 mm overlap (average of three specimens for each case)
The 25 mm overlap specimens show a clear effect of adhesive thickness on joint strength. Most of the difference is seen when going from specimens with minimal adhesive thickness (no glass bead spacers and measured thickness of ∼30 μm) to specimens with 300 μm glass bead spacers at an increase of 87%. The additional strength in going from 300 to 500 μm glass bead is only ∼9%. For the 50 mm overlap, the joint strength is essentially the same for the specimens with 300 and 500 μm of adhesive thickness. The difference between these and the specimens with no spacers was not as pronounced as in the 25 mm overlap case, at only 14%. Prior work on aluminium lap shear tension specimens bonded with epoxy showed that joint strength dropped for adhesive thicknesses >0·7 mm, but was stable at thicknesses lower than this. 20 The results in the current work show relative stability in joint strength between 0·3 and 0·5 mm, but a much lower strength for specimens with the thin adhesive layer (∼30 μm) that occurred when no glass beads were used.
For the cross-tension specimens, only one adhesive condition was tested: adhesive with no glass bead spacers. The overlap area for these specimens was 50 mm × 50 mm in the centre of the specimen. Cross-tension failure loads, as an average of three specimens, are shown in Fig. 7 for FBJ only and hybrid (adhesive+FBJ) specimens.
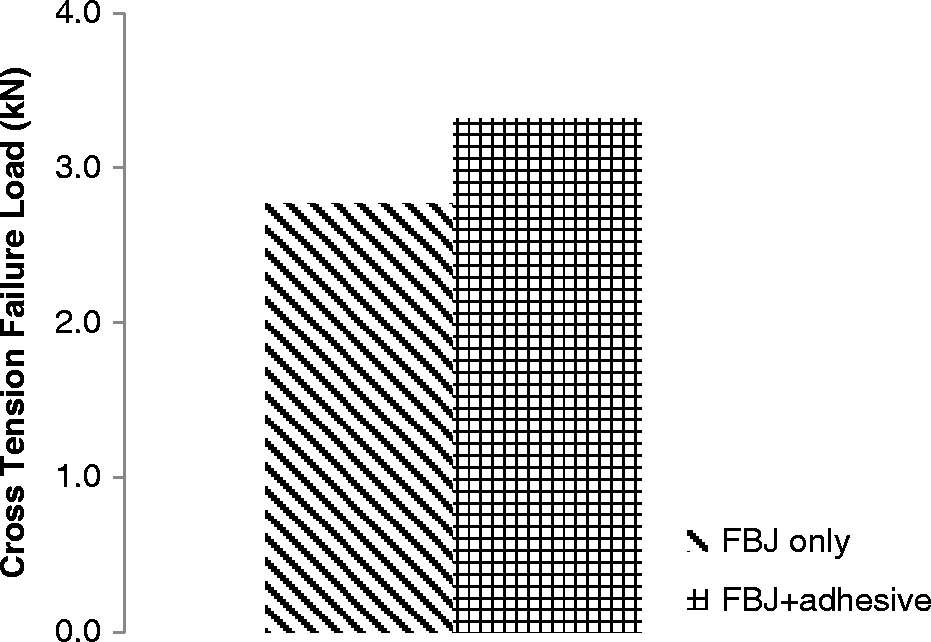
Cross-tension failure loads for FBJ only and FBJ+adhesive specimens with no glass bead spacers (average of three specimens for each case)
Specimens with adhesive provided an increase in cross-tension failure load of ∼20%.
Failure modes and joint strength comparison against other methods
Lap shear tension specimens without adhesive exhibited two different failure modes. One mode was nugget pullout, where the weld nugget at the bit/steel interface was pulled out, with a tearing of the steel sheet around the weld periphery. In the case of FBJ joints, the weld nugget is considered to consist of the bit and the adjacent material (DP 980 steel sheet) joined to the bit by friction bonding. Another was interfacial failure, where the joint failed in the bit at the interface between the sheets. Examples of these two failure modes are shown in Fig. 8.
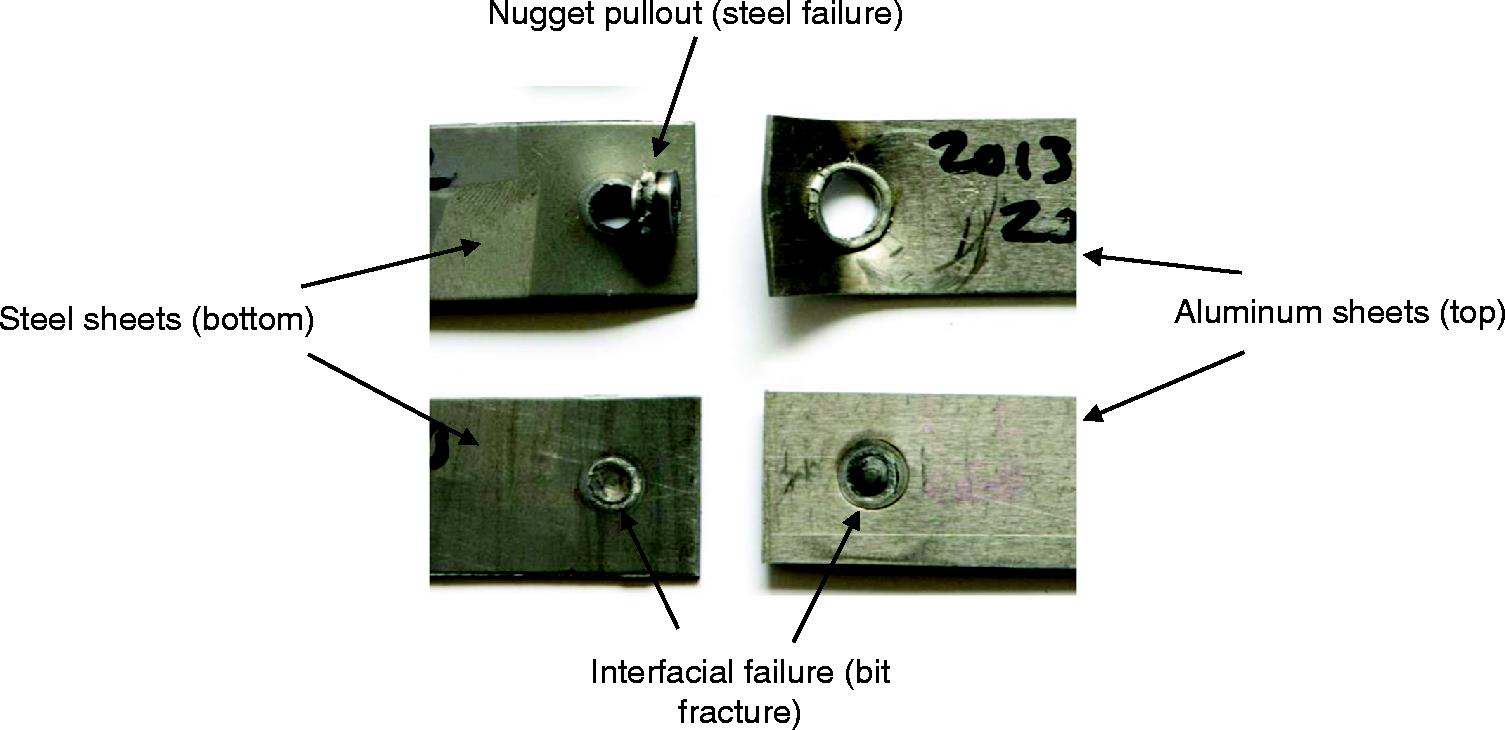
Failure modes in lap shear tension for specimens welded without adhesive; Nugget pullout failure (top) and interfacial failure (bottom); coupons on left are DP 980 steel and coupons on right are AA 7075-T6; for nugget pullout failure, top surface of aluminium sheet is shown with mating surface of steel sheet; interfacial failure shows mating surfaces of both coupons, so bit head is not visible (it is on back side of aluminium sheet in this case)
The specimens with 25 mm overlap had one nugget pullout and two interfacial failures, while all three specimens with 50 mm overlap had interfacial failures. Observation of the nugget pullout failure during lap shear tension testing revealed that it was a slow, ductile tearing of the steel sheet around the periphery of the nugget. For the hybrid specimens with various adhesive thicknesses, three failure modes were observed: nugget pullout, interfacial and fracture of the aluminium sheet, while the joining bit remained intact on the steel sheet. Table 2 summarises the failure modes for the hybrid specimens.
Failure modes for hybrid lap shear specimens (FBJ+adhesive) (three specimens were used for each condition)

Regardless of the type of final failure that occurred in the friction bit portion of the joint, the adhesive always failed first in the hybrid lap shear specimens, as observed during testing.
While nugget pullout failures are more desirable than interfacial failures within the automotive industry, 21 the failure loads for this material combination are nevertheless high compared to other methods used to join dissimilar metal alloys. A direct comparison from the literature is not possible because joint dimensions, joining processes used and material combinations were different than the FBJ process described in this paper. However, a reasonable idea of what is currently possible in the spot joining of dissimilar materials can be gained by such a comparison. In the case of RSW, for example, Qiu et al. 22 obtained a maximum lap shear strength of 6·5 kN for a combination of AA5052 (1 mm thick) and austenitic stainless steel SUS304 (1 mm thick). For friction stir spot welding, a flat tool was used for joining of AA6061-T6 and mild steel (both 1 mm thick), realising a best lap shear failure load of 3·6 kN. 23 For clinching, LeBozec et al. 24 obtained a lap shear failure load of ∼5 kN for a material combination of AA6016 and hot dip galvanised steel. For SPR, a combination of 1·6 mm high strength low alloy (HSLA) 350 was joined to 2·0 mm AA 5754-O, yielding a lap shear failure load of 5·2 kN. 25 FBJ lap shear specimens without adhesive had failure loads significantly higher than the examples found in the literature, at ∼10 kN, for various combinations of aluminium and steel. FBJ is especially useful when joining a softer alloy, like AA 7075-T6, to a harder alloy like DP 980. For the cross-tension specimens, all of the failures, whether with or without adhesive, were interfacial.
Microhardness and metallography
Figure 9 shows the measured Vickers microhardness profile from the cross-section of FBJ specimen, where the x direction is transverse to length direction of the lap shear specimen. The DP 980 (0·15 wt-% C) base metal (BM) has an average hardness of ∼320 HV, which is slightly higher than the joining bit hardness (280–300 HV).
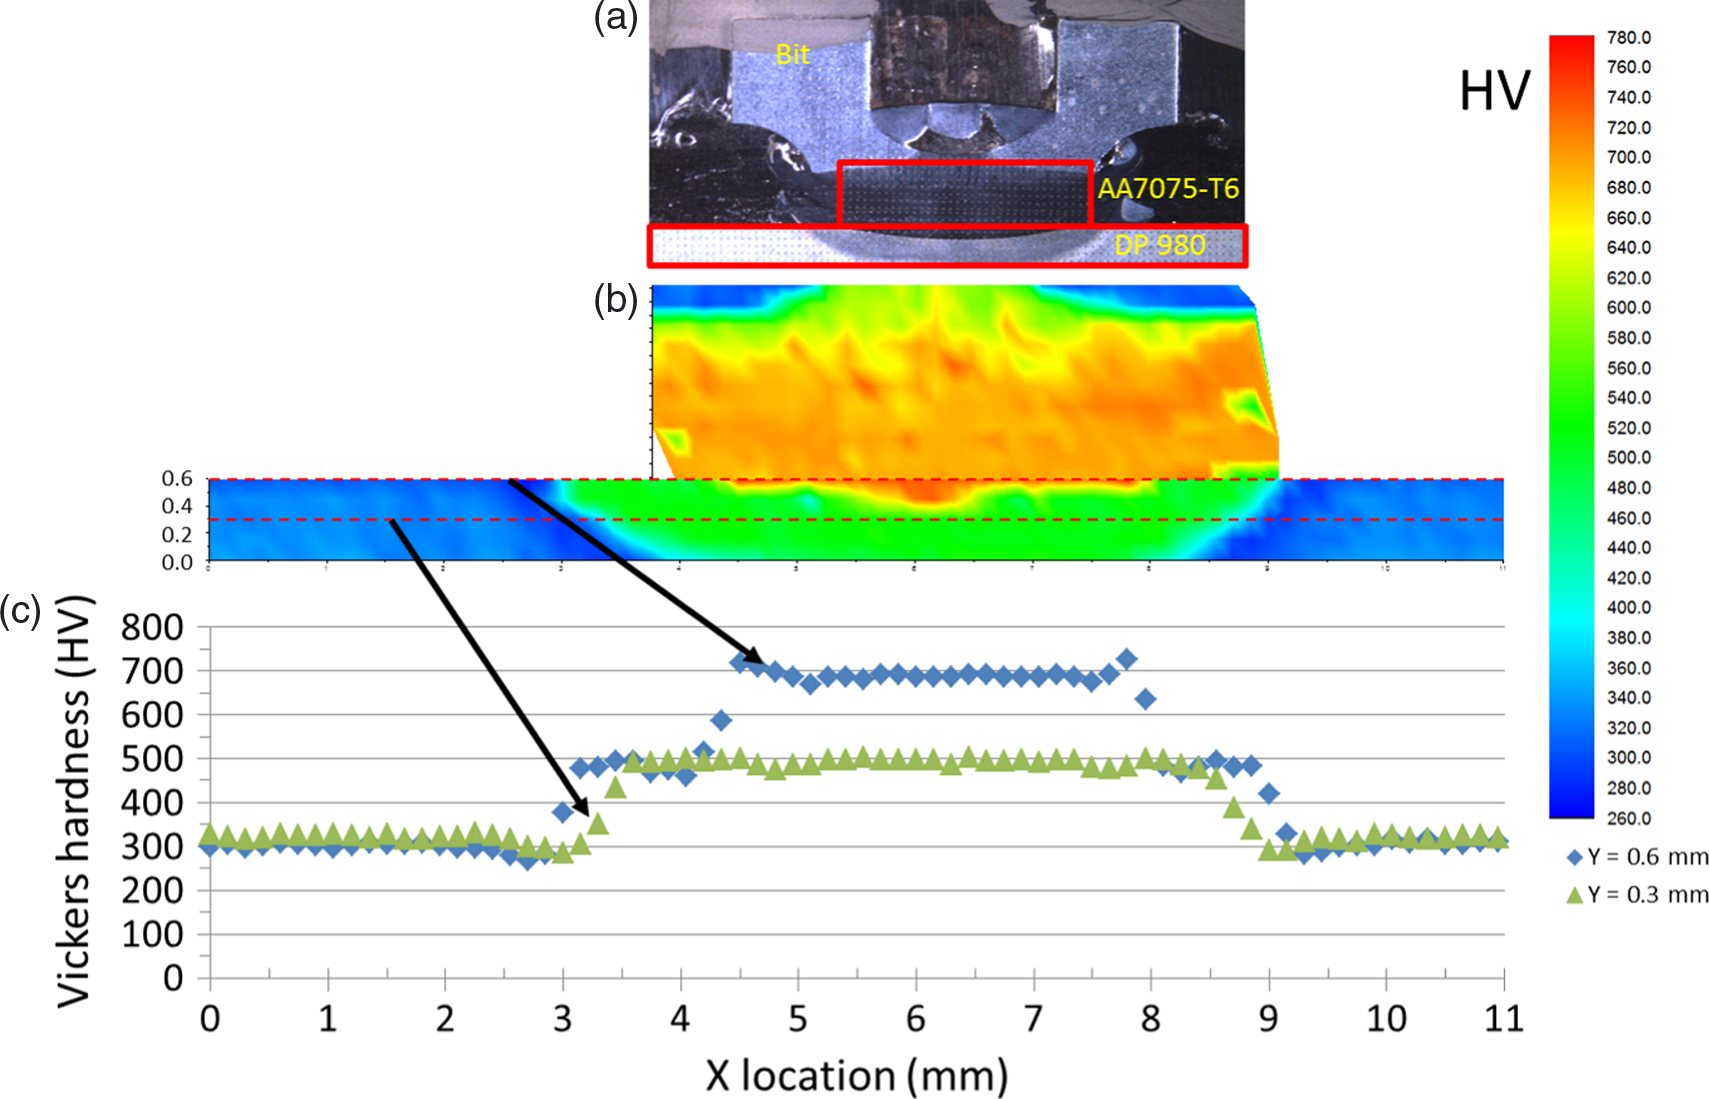
Vickers microhardness distribution measured at cross-section of FBJ specimen
The microhardness inside the DP 980 steel is the maximum in the interface region, which is close to 500 HV. One potential reason for the increasing hardness in this region may be due to introduction of additional carbon from the joining bit (0·38–0·43 wt-% C), as the bit material mixes with the DP 980 at the interface. In addition, transformation of microstructure from a mixture of ferrite and martensite to martensite during the joining step resulted in greater hardness in this region. Next, the hardness slightly decreases from the interface region toward the heat affected zone (HAZ) and then increases again toward the BM. In the joining bit area, the maximum hardness ranged from 700 to 720 HV, whereas initial microhardness of the joining bit ranged from 280 to 300 HV. The increase of hardness in the joining bit (small red box in Fig. 9) is caused by a microstructure change from tempered martensite to fully martensitic during the joining step.
SEM images of the cross-section view of the FBJ specimen are given in Fig. 10.
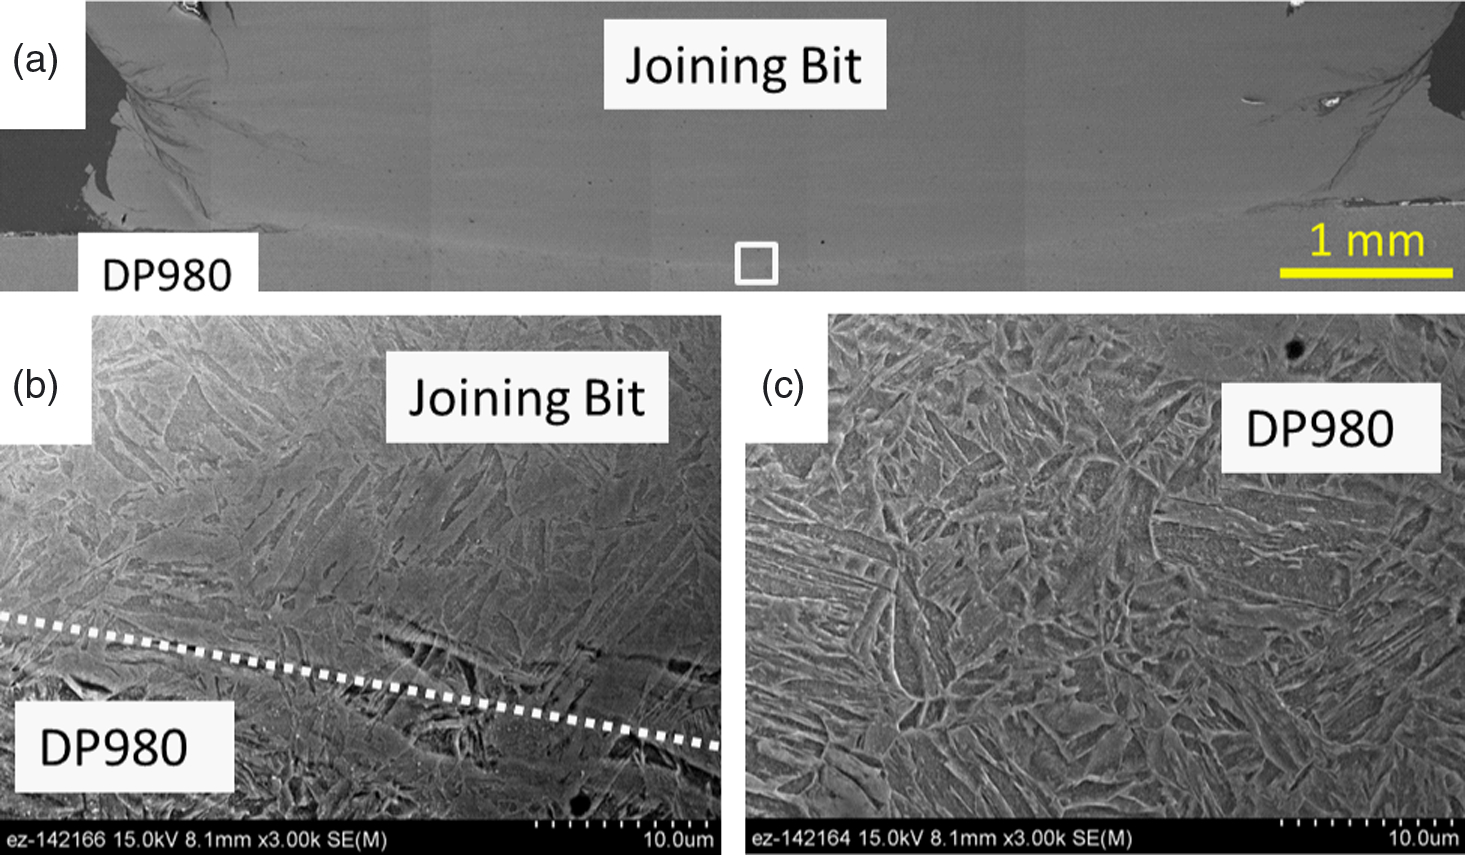
SEM images showing cross-section view of FBJ sample from Fig. 9a: a low magnification of cross-sectioned FBJ specimen; b magnified SEM image of joining bit (white box from a); dashed white line is approximate location of interface; c magnified SEM image of DP 980 in weld area, next to bit/sheet interface, after joining step
The low magnification image in Fig. 10a shows the portion of the spot weld corresponding to the rectangular box from Fig. 9a. Good metallurgical bonding between the joining bit and DP 980 is seen without any cracking between the two materials. In addition, the weld diameter was measured to be ∼5·3 mm, which is closed to the original diameter of the joining bit ( = 5·58 mm). Since joining strength is mainly dependent on the bond area, joint strength could be further increased if a larger diameter joining bit was used. However, the relationship between bit diameter and joint strength is beyond the scope of the present paper. Next, Fig. 10b and c depicts higher magnification SEM images near the interface between the joining bit and the DP 980 in the weld zone (white box in Fig. 10a). Again, metallurgical bonding between the joining bit and DP 980 was found without presence of any defects in the joint. In the joining bit, mostly martensitic microstructures were observed. Similarly, the lath martensite with ferrite microstructure is clearly seen inside the DP 980. The transformation of microstructures in the joining bit and the DP 980 in this region of the weld is the primary reason for increased hardness in the joint, as previously quatified in Fig. 9.
Evolution of microstructure during FBJ can be explained by referring to prior work on FSW. For FSW, the maximum temperature (typically between 1000 and 1200°C) is higher than the A3 temperature of the steels being welded. 25 The FBJ process produces heat in a manner analogous to FSW, generating a significant amount of frictional heat during the joining step. As a result, the martensitic microstructures in the weld zone indicate that the A3 temperature was exceeded during welding. This would have resulted in the formation of austenite in the weld zone, followed by transformation to martensite during the rapid cooling cycle. The observation of the weld microstructure is borne out by examination of the microhardness map in Fig. 9 and the microstructures seen in Fig. 10.
Conclusions
Dissimilar materials spot welding of AA7075-T6 and DP 980 was successfully done by FBJ. A hybrid (adhesive+FBJ) approach was also employed to demonstrate the feasibility of combining adhesive with FBJ. The following conclusions were drawn from this work.
Lap shear failure loads for specimens without adhesive averaged ∼10 kN, while for cross-tension specimens, the average was 2·8 kN. The absolute value of the lap shear failure loads without adhesive is high compared to similar examples of dissimilar metals joining found in the literature (∼6·5 kN). Average static lap shear failure loads for the hybrid process were 50% higher than for FBJ only specimens when the adhesive thickness was at least 300 μm. For the cross-tension specimens, the adhesive thickness was not controlled with glass bead spacers, but the increase in failure load was still ∼20% compared to the FBJ only specimens (adhesive thickness was ∼30 μm). Maximum Vickers hardness in the weld zone ranged from 700 to 720 HV in the joining bit to ∼500 HV in the DP 980. Microstructural analysis was conducted in a welded joint, showing mostly martensite in both the joining bit and the DP 980. The greater hardness in the joining bit (steel alloy 4140) is explained by its higher carbon content compared to the DP 980. Failure modes in lap shear tension included nugget pullout, interfacial and failure of the aluminium coupon. In the case of nugget pullout, the slightly softer HAZ was the fracture path where the steel sheet was torn around the periphery of the weld nugget.
Footnotes
Acknowledgements
This research was financially sponsored by the U.S. Department of Energy, Assistant Secretary for Energy Efficiency and Renewable Energy, Office of Vehicle Technologies, as part of the Lightweight Materials Program. Oak Ridge National Laboratory (ORNL) is managed by UT-Battelle, LLC for the U.S. Department of Energy under Contract DE-AC05-00OR22725.