
Abstract
Ultrasonic welding is attracting increasing attentions in lithium battery joining in the field of battery electric vehicle manufacturing. A three-dimensional finite element model was constructed to study the temperature distribution and heat generation in ultrasonic welding process. Numerical analysis showed that heat generation from plastic deformation accounts for nearly a quarter of the whole heat generation (material plastic deformation and interface friction). The fraction changes little with different sequence of specimens. The highest temperature locates at the contact interface of specimens and it is much lower than the melting point of the joining materials. Temperature distribution of the structure is not symmetric, and there are abnormal points under the effect of serrated ridges of sonotrode tip. Welding process can be divided in to three periods based on temperature evolution on the contact interface of lower specimen. The proposed model is validated by comparing simulated temperature evolution with experimental result.
Keywords
Introduction
Hybrid and electric vehicles are attracting increasing attentions in automotive industry with the increasing demand on energy and fuel efficiency. 1 Batteries have been one of the main focuses of development of electric vehicles in the last years. 2 New technologies, such as the lithium battery, are entering the market and fast growing since they provide the highest energy density of all available systems. 3 A typical automotive battery pack consists of large numbers of modules. A module is composed of several battery cells. It is of great significance to join numerous battery cells to deliver electricity because of the difficulty in welding thin and dissimilar materials, such as copper to aluminium between anode and cathode. 3 Therefore, developing effective methods for battery manufacturing is becoming an essential condition for automobile makers.
Traditional fusion welding technologies, including laser welding and resistance spot welding, are faced with challenges because of the remarkable differences in electrical and thermal properties between copper and aluminium. As a solid state welding process, ultrasonic welding (USW) can avoid the defects caused by fusion welding, such as brittle phases and porosities. 4 Meanwhile, it can reduce the formation of intermetallic compounds between dissimilar materials.5, 6 Therefore, USW has drawn increasing attentions recently, especially in the field of automobile batteries. 7
USW is a rapid joining process during which high frequency ultrasonic energy is used to produce a bond between two pieces of metals under clamping pressure.8, 9, 10 The bonding mechanism of USW has been studied by numerous researchers for more than 50 years. Nevertheless, the joining process is still not fully understood.11, 12 Researches have put forward various mechanisms for the joining process based on experimental observation, for example, mechanical interlocking, 13 interdiffusion and recrystallisation,14–16 generation of heat by friction and plastic deformation and even melting.17–20 Among all the proposed theories, heat generation due to interface friction between joining metals and material plastic deformation has generally been considered playing significant roles for the joint formation process. 21
During USW process, the workpieces make relative motion to each other at ultrasonic frequency under the effect of sonotrode. Tremendous heat is generated from frictional work between the contact interfaces. Meanwhile, under the combined effect of normal and vibratory shear stress caused by ultrasonic vibration of sonotrode, large areas of materials come into plastic deformation stage. 22 Proportional plastic deformation work will be converted to heat generation in the high strain rate process. Heat generation from these two sources leads to elevated temperature of specimens, which will then influence material behaviour in return. In the experimental work of Bakavos and Prangnell, temperature measured during USW of aluminium reached nearly 400°C, which would lead to dramatic loss of strength of workpieces. 23 Zhao et al. measured the temperature at the sonotrode/specimen interface and concluded that the maximum temperature during the welding process are sufficient enough to result in dramatic softening of the workpieces and complex metallurgical reactions. 24 Weld thermal cycles were measured in the experimental study of Prangnell et al. The obtained data showed that USW can lead to extremely rapid heating rates and cooling rates of workpieces, which will influence the microstructure evolution of materials. 25 Patel et al. conducted experiment to find out the influence of USW on microstructure in a magnesium alloy and concluded that the peak temperature plays key roles in controlling the grain size of the welded samples. 26
Therefore, it is important to find out the temperature distribution and heat generation in order to understand the welding process. However, the serrated geometry of sonotrode tip and transient nature of welding process leads to some special characteristics of USW process, such as instant temperature increase, severe plastic strain concentration, complicated contact status and friction condition. It is difficult to obtain the real time data from experimental measurements. 12 On the other hand, the numerical simulation method, such as the finite element method, can overcome these obstacles to some extent and has been employed by researchers in recent years.
The work by Siddiq and Ghassemieh incorporated the materials' thermal softening effects into finite element model particularly. They adopted the material properties with extension for temperature dependence. The effects of welding parameters, such as applied load, vibration amplitude and sonotrode velocity, on friction work and temperature distribution were analysed.27, 28 Zhang and Li constructed a dynamic thermomechanical coupled finite element model of USW of aluminium foils on aluminium substrate. Their model was a small part of the whole USW process, namely, up to 50 cycles, a period of 2.5 ms. Heat generation and temperature distribution on the contact interface were discussed to propose a possible mechanism for ultrasonic bond formation. 12 de Vries 29 and Elangovan et al. 30 analytically computed the heat generation by friction and plastic deformation separately rather than considering the dynamic thermomechanical analysis for the process. The presented finite element model took the calculated heat generation as boundary conditions. Temperature distribution and their influences on the workpieces, sonotrade and anvil were analysed. Gao and Doumanidis31, 32 characterised the interface friction conditions via a simple analytical model of elastic stress field. The calibrated model was capable of studying the material plastic deformation initiation and propagation, the slippage at the interface surface. Lee et al.33, 34 used the combined standard/explicit algorithm, incorporating the commercial software Abaqus to simulate dissimilar metal USW. They made assumptions using the implicit algorithm to simulate the dynamic process for the goal of calculation time reduction. The procedure was used to predict welding energy and temperature distribution of the workpieces. Kim et al. 35 constructed a thermomechanical model of USW process, in which heat generation from plastic deformation was ignored. They found that frictional heating has a significant effect on the welding process and should be included in the analysis. As can be seen, useful results have been obtained by the stated numerical simulations. However, they have either not took into consideration of heat generation from plastic deformation or comprehend the actual frictional heat generation in incomplete welding cycles. This will result in inaccurate heat generation and temperature result. More importantly, the particular geometry of serrated ridges of the tip knurl pattern was ignored. Therefore, the severe local concentration of plastic deformation and friction condition can hardly be obtained.
In the present study, a three-dimensional (3D) thermomechanical coupled finite element model is constructed to analyse the USW process of Cu to Al plates. The model takes into consideration of interface friction and plastic deformation heat generation, thermal softening effects of materials and the specific geometrical feature of sonotrode tip. The results can provide specific temperature evolution and heat generation process. Furthermore, the model is of scientific and engineering significance by offering parametric analysis of the thermal process.
Finite element analysis model
Finite element model
The proposed finite element model can be applied to simulate USW process of different kinds of materials, such as copper alloy and aluminium alloy. In the present work, numerical simulation of USW process of Cu to Al is presented as a typical example. The commercial software Abaqus 6.10 36 is incorporated. The model is composed of three main components, i.e. workpieces, sonotrode and backing anvil as depicted in Fig. 1. Cu and Al plates are stacked in sequence with a dimension of 19 mm × 19 mm with thickness of 0.2 mm between the sonotrode and anvil. The anvil is of the same length and width as the workpieces. The detailed geometrical feature of sonotrode tip and anvil has been incorporated. The size of the sonotrode is 7 mm long and 5 mm wide, and its knurl pattern is shown in Fig. 2. The anvil shares the same knurl pattern with the sonotrode. The eight ridges of the sonotrode tip are oriented perpendicular to the vibration direction with a height of 0.3 mm. Figure 3 shows the projection of the eight ridges' centrelines on the Al plate before deformation, labelled from ‘L1’ to ‘L8’ with a length of 5 mm and spacing distance of 0.85 mm. The lines of ‘L1’ and ‘L8’ (as well as ‘L2’ and ‘L7’, ‘L3’ and ‘L6’, and ‘L4’ and ‘L5’) are symmetrical about the centre of the structure. Because the plastic strain and stress under the sonotrode tip have great influence on the joint formation, the temperature distribution and evolution on the defined paths are discussed in detail in the following sections.
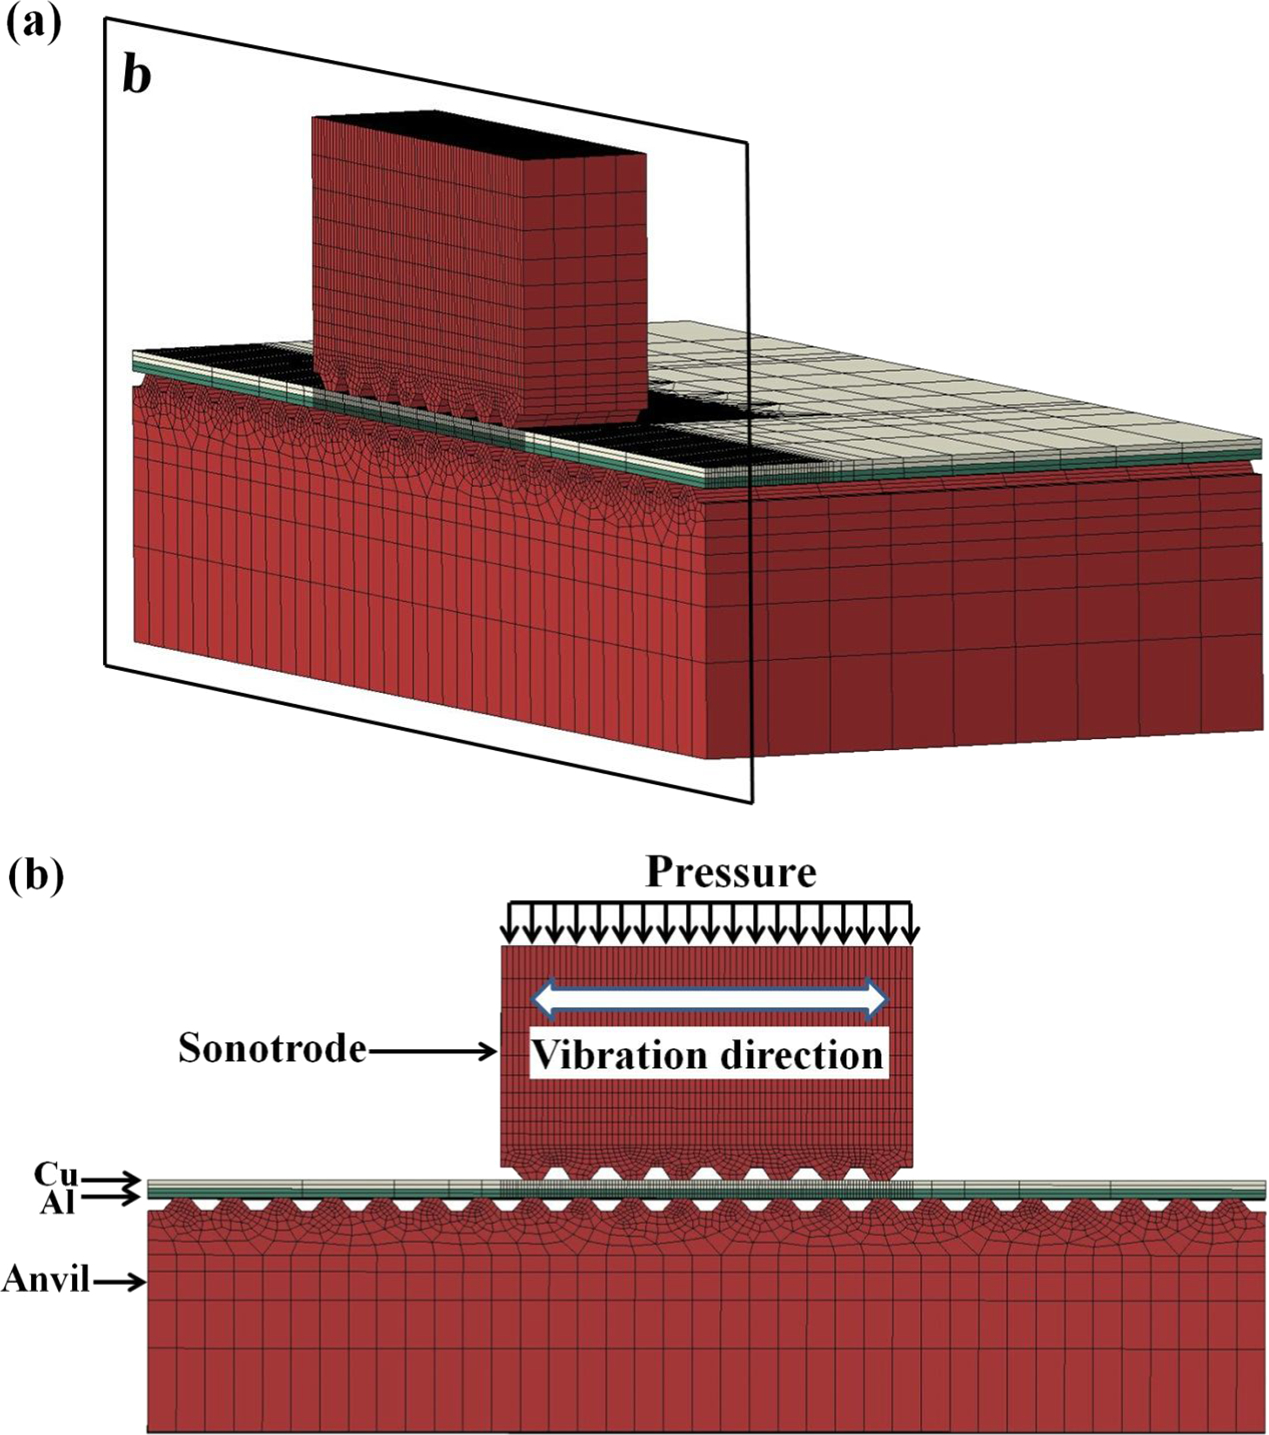
a half of finite element model; b detailed representation of ‘b’
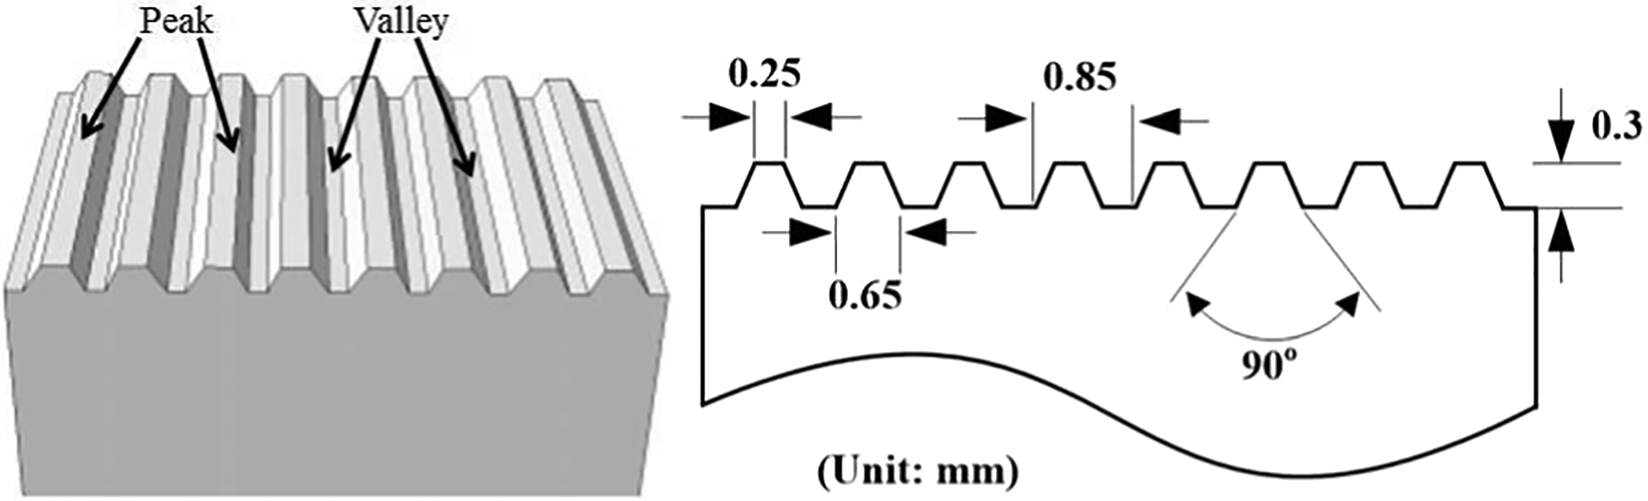
Detailed knurl pattern of sonotrode tip (left) and its dimension (right)
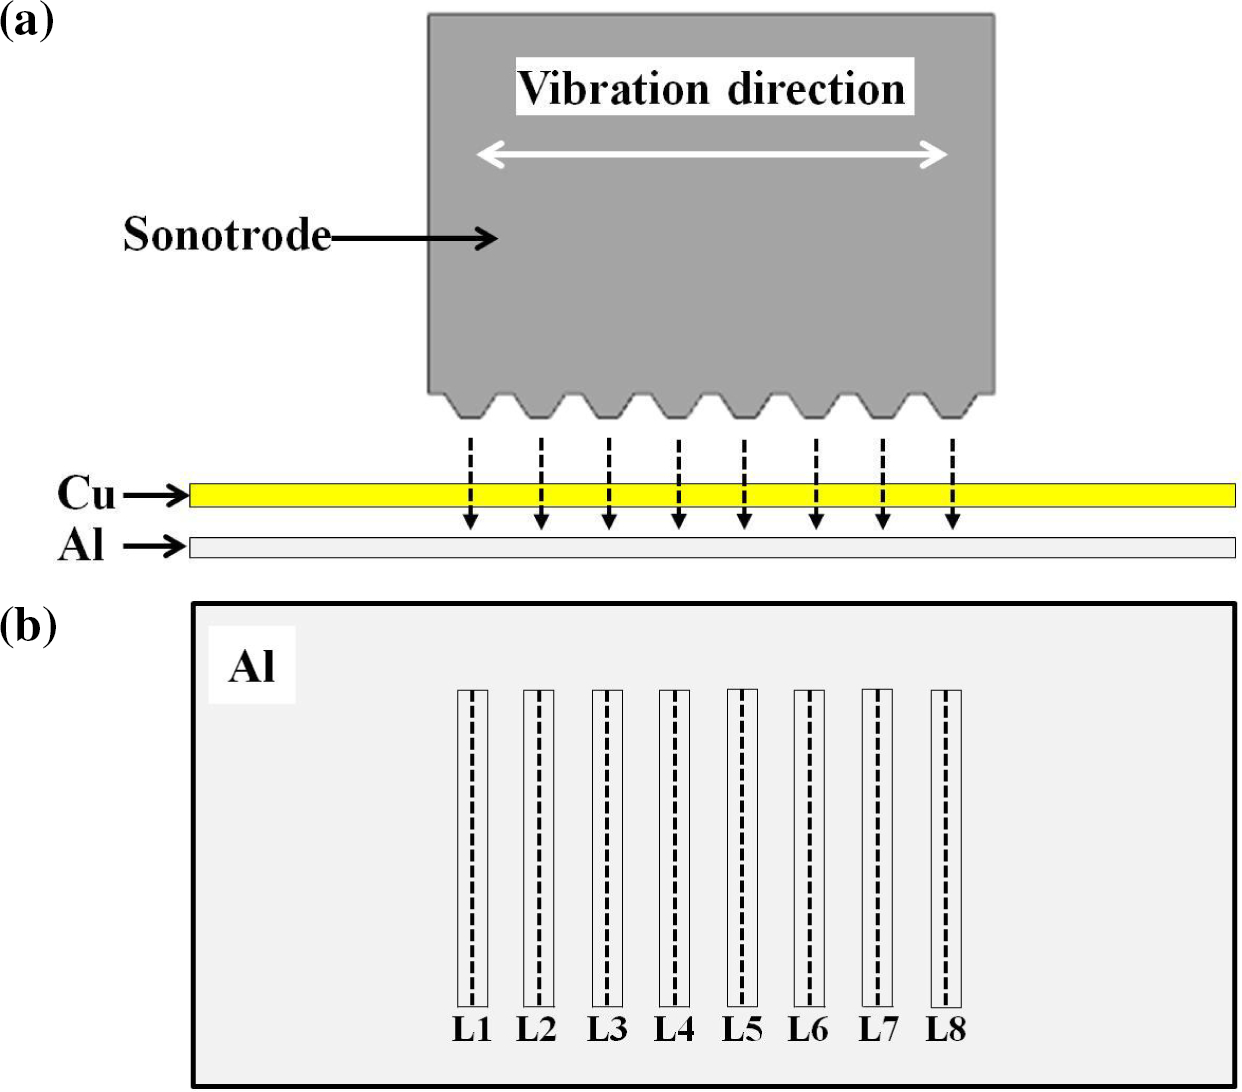
a projective relation between sonotrode tip and Al; b location instruction of defined paths on surface of Al
Figure 1a shows half of the model, which is sectioned through the central region to reveal the contact area. Figure 1b illustrates grids of the cross-section, namely, detailed ‘b’ in Fig. 1a. The grids are graded from fine to coarse. Mesh is dense at the central contact region of the workpieces to reduce hourglassing effect and improve computing accuracy. The element size is ∼0.05 mm in the region near the sonotrode tip. There is sparse mesh partition away from the contact region to enhance calculation efficiency. Since the sonotrode and backing anvil have much greater stiffness and relatively smaller deformation than the workpieces, they are modelled as rigid bodies with prescribed motion at reference points. The rigid body surfaces, however, carry thermal response. The entire cross-section of the workpieces and the anvil are incorporated, but only a portion of the sonotrode is modelled to improve the computational efficiency since the sonotrode is very large compared to the workpieces and anvil. In order to ensure that the size of the modelled sonotrode does not affect the accuracy of the temperature distribution, the extracted portion is large enough so that there is no heat flux through the upper surface of the sonotrode. A total of 107 512 elements and 144 155 nodes have been generated in the model. The workpieces are modelled with thermomechanical coupled element, C3D8RT. This kind of element type has eight-node trilinear displacement and temperature degree of freedom, with reduced integration point and hourglass control.
Parameters of the welding process need to be incorporated in the model, including the frequency of ultrasonic vibration (f), applied force (F) and amplitude of sonotrode vibration (A). They all have significant effect on the welding process and should be defined carefully. The anvil is fixed in all six free degrees, which agrees with the practical situation. The sonotrode gets into contact with the upper workpiece under applied load (1000 N in the model) in the clamping step and then vibrates in the horizontal direction in ultrasonic frequency. The vibration displacement is
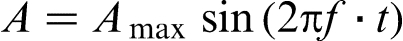 , where Amax is the amplitude of vibration (12 μm in the model) and t is the real time during the welding process.
The temperature of the bottom surface of anvil and the top surface of sonotrode are kept constant at 20°C as it has been found that the heat flux never reached these boundaries in the relatively short welding time. Initial temperature of 20°C has been prescribed to the entire model. All the surfaces exposed to air have been set under free convection with a convective heat transfer coefficient of 5 W (m2 °C)− 1, and the ambient temperature is 20°C. The duration of the welding step is 0.1 s.
Material properties
Johnson–Cook plasticity model is suitable for modelling the high strain rate deformation of metals, which is the situation of USW.
35
The hardening rule of Johnson–Cook is a particular type of isotropic hardening where the effective stress,σ, is assumed to be of the following form:

 is the equivalent plastic strain,
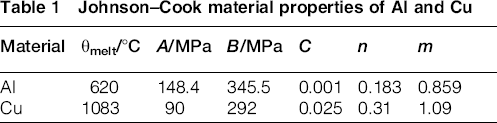
 is normalised effective plastic strain rate (typically normalised to a strain rate of 1.0 s− 1), and A, B, n and m are the material parameters measured at or below the transition temperature,θtransition.
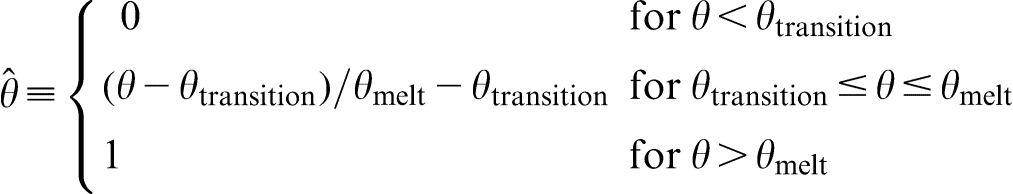
 is the non-dimensional temperature defined as
Johnson–Cook material properties of Al and Cu
The thermal expansion of Al and Cu should also be considered thermomechanical coupled since the thermal strain εth directly couples mechanical and thermal behaviour as follows:

The densities of Al and Cu are set as 2.7 × 10− 6 kg mm− 3 and 8.9 × 10− 6 kg mm− 3 respectively. As for the temperature dependent thermal conductivities and specific heats, they can be acquired in the work of Touloukian et al. 40 and are not introduced in detail.
Heat generation model
Heat generation during USW comes from two main aspects: frictional work at the contact interfaces of specimens and material plastic deformation. The Coulomb friction model is incorporated. The slipping motion occurs when
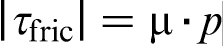 , and sticks status happens when
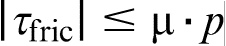 between the contact interfaces, where μ is the coefficient of friction and p is the clamping pressure. Corresponding friction heat will be generated when there is relative slipping motion between the two workpieces and the formula is as follows
36
:
between the contact interfaces, where μ is the coefficient of friction and p is the clamping pressure. Corresponding friction heat will be generated when there is relative slipping motion between the two workpieces and the formula is as follows
36
:
 is the relative speed of the slipping motion. The parameter η, which ranges between 0 and 1, is not explicitly known but can be indirectly obtained from experiments. In the present study, it is assumed that 90% of the frictional energy is converted to heat generation. Another assumption is that the generated heat by friction is evenly transferred to both the contact surfaces.
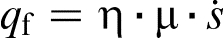
USW is a rapid process involving large amount of plastic strain. Heating of the material caused by its plastic deformation is an important factor because of the temperature dependent material properties. The heat generation due to plastic deformation, qp, is given as
 is the plastic strain rate.
Results and discussion
Heat generation process
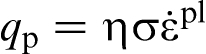
Heat generation due to interface friction and material plastic deformation results in elevated temperature and influences the welding process. The two heat sources can hardly be measured by experimental method. However, they can be obtained from numerical analysis and are plotted in Fig. 4. As welding proceeds, heat generation from both sources increases. It can be seen that although heat generated from plastic deformation is much lower than that by frictional work (nearly accounting for one third of the latter one at the end of the welding process), it is comparable to the latter one. Therefore, it cannot be ignored.
Heat generation from interface friction and material plastic deformation
During the whole welding process, the curve slope of heat generation from interface friction remains nearly unchanged. It means that frictional heat generation rate stays almost constant. Nevertheless, heat generation rate from plastic deformation varies over the welding process. At the initial phase (from the beginning to 10 ms), the rate is relatively high. From 10 ms to the end of the welding process, the rate decreases gradually. It can be explained by the decrease of plastic deformation as welding proceeds.
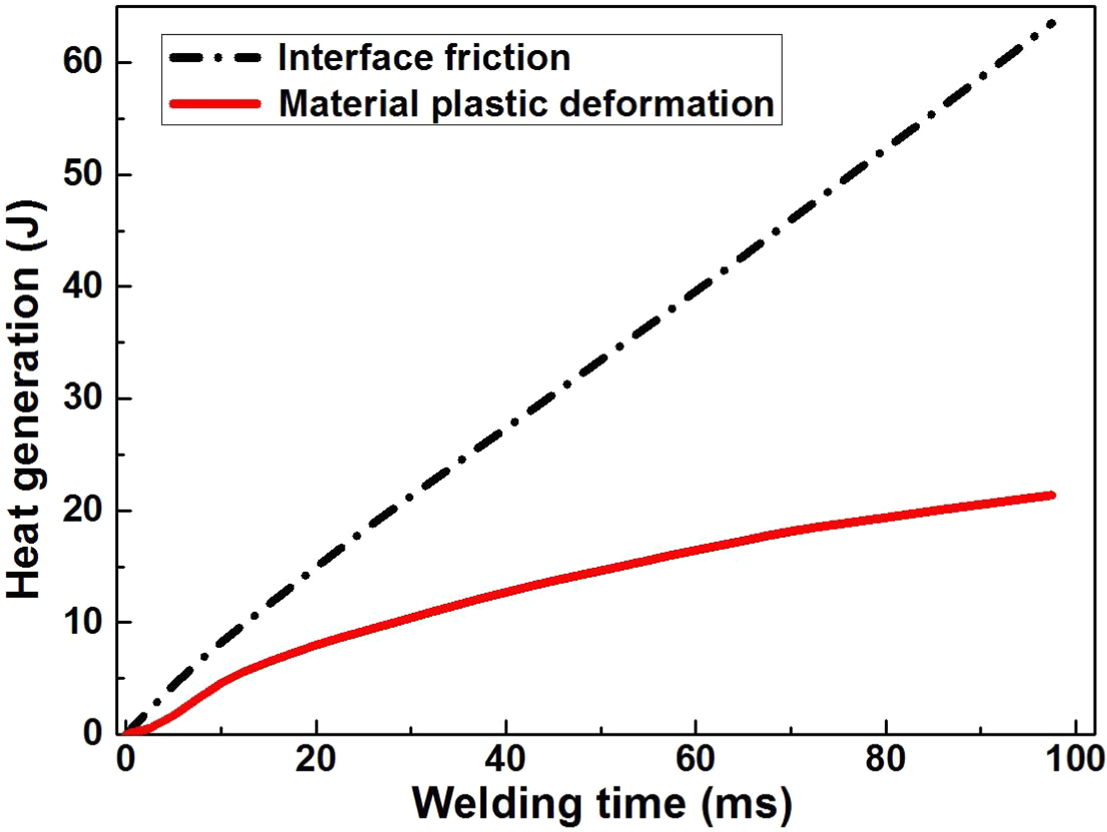
When the welding parameters are fixed (the applied load is 1000 N and the amplitude of ultrasonic vibration is 12 μm), fraction of heat generation from material plastic deformation under different conditions of specimens' sequence (variation of specimens' sequence, for example, changing place order of Cu and Al) is plotted in Fig. 5. Fraction of plastic deformation work under different welding sequence combinations does not change much, all about a quarter of the total heat generation. The fraction with the sequence of Al–Cu is a little larger than the other three conditions. It means that the specimens' sequence has a minor effect on the heat generation process.
Heat generation with different sequence of specimens
Temperature distribution
Temperature contours and deformation shape are obtained from the simulated result at the end of the welding process. As shown in Fig. 6a, the whole structure is sectioned vertical (Fig. 6b) and parallel (Fig. 6c) to the vibration direction to show temperature distribution in the central area of the structure. Temperature at the centre of the structure is higher than that at the exterior. The highest temperature is just below 160°C, which is much lower than the melting point of Cu and Al. Therefore, it can be concluded that the USW of 0.2 mm Cu to Al is a solid state joining process.
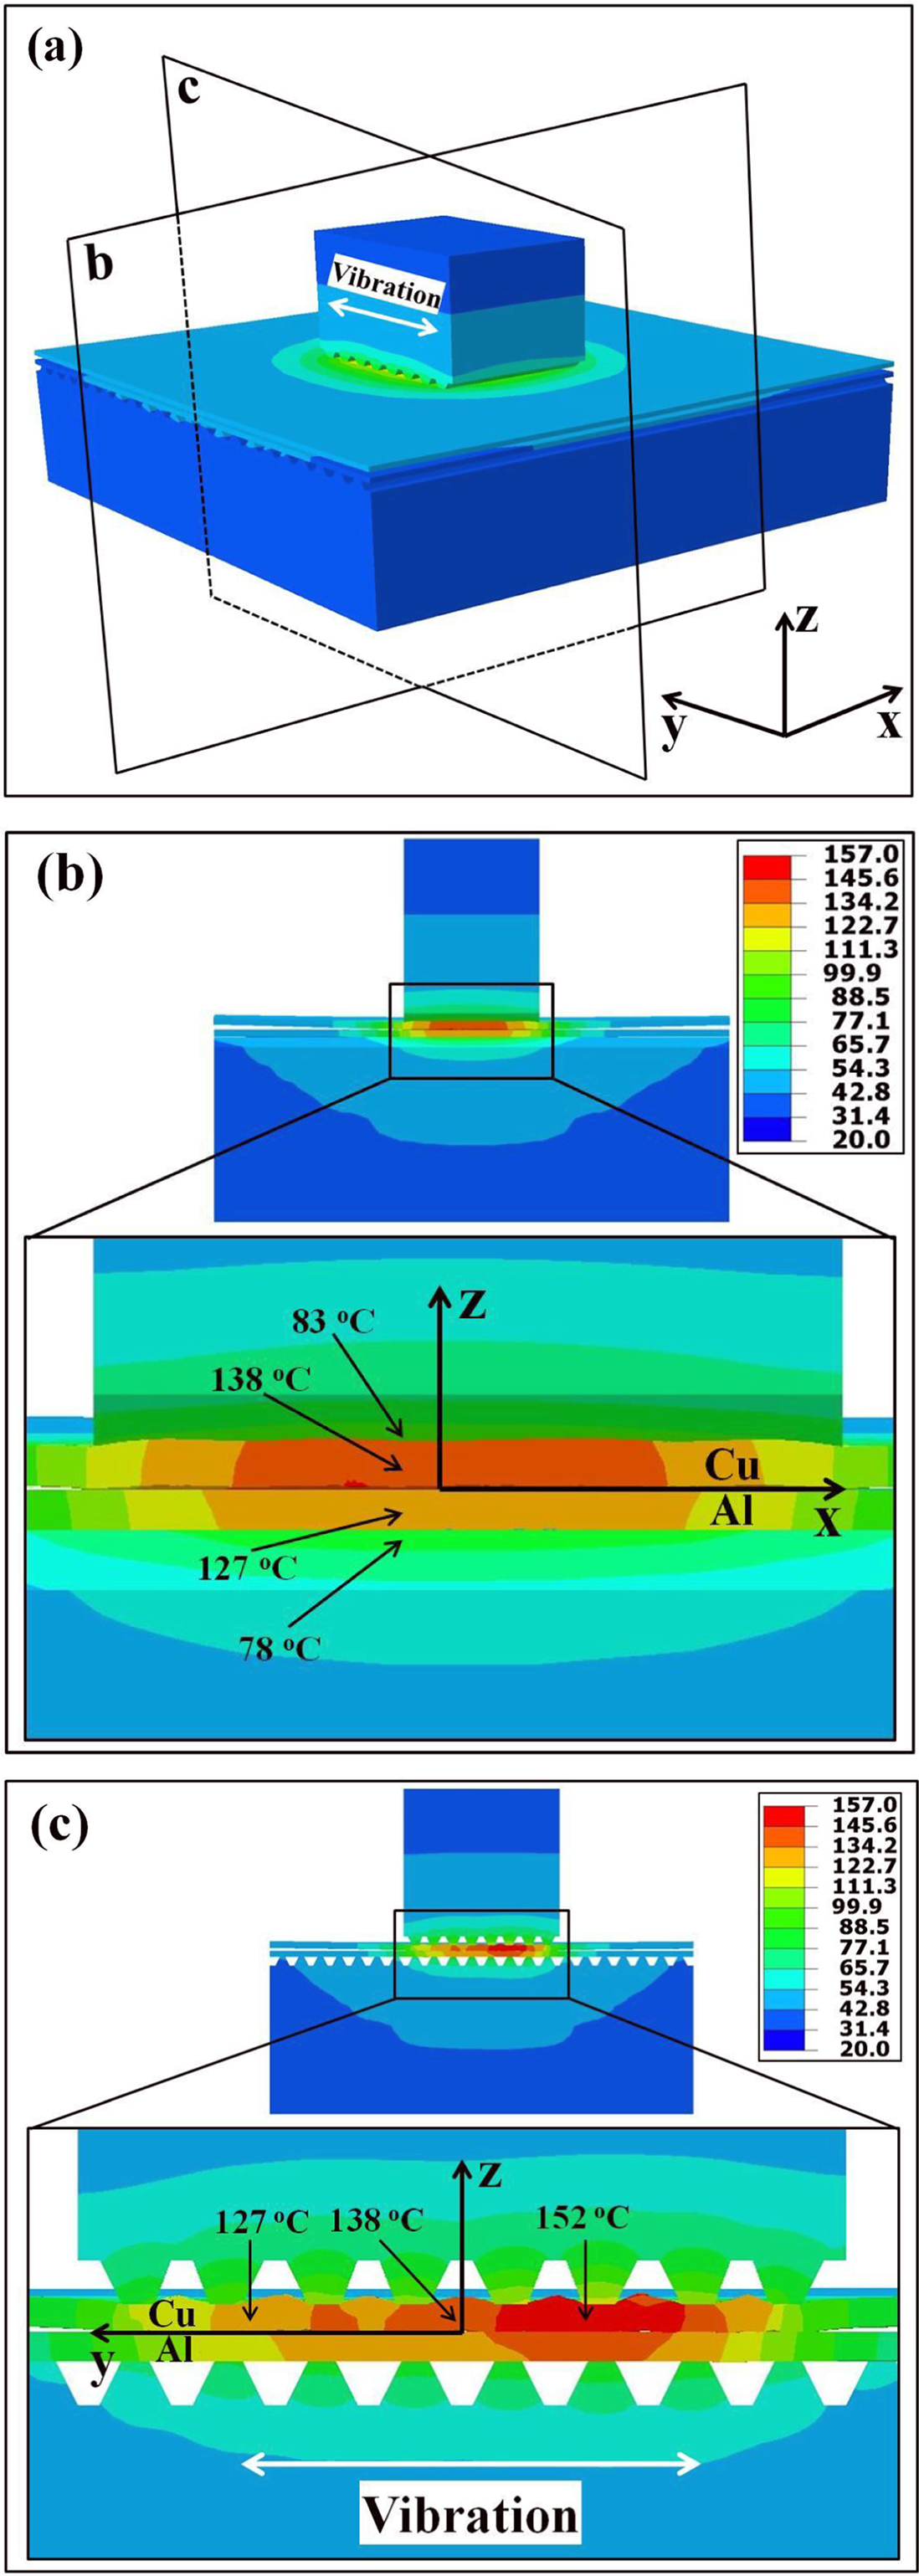
a whole model of structure; b half of model sectioned vertical to vibration direction; c half of model sectioned parallel to vibration direction
It can be inferred from Fig. 6b that temperature distribution is nearly symmetric about the centre in the cross-section vertical to the vibration direction. There are obvious temperature gaps at the contact interface of sonotrode/Cu, Cu/Al and Al /anvil. The highest temperature locates at the Cu/Al interface and decreases towards the interfaces of sonotrode/Cu and Al/anvil.That is because heat is mainly generated by friction at the interface of Cu/Al and then transferred to the sonotrode and anvil. Unlike a symmetric condition in Fig. 6b, temperature at the cross-section parallel to vibration direction shows no regular trend as can be seen in Fig. 6c. The highest temperature is not at the centre of the contact interface but deviates to one side. The reason for this asymmetric fact is thought to be the localised frictional and plastic deformation concentration caused by the serrated ridges of the tip knurl pattern. Once the sonotrode begins to vibrate in ultrasonic frequency, the initial structural geometry symmetry is disrupted slightly. This asymmetrical situation will become more severe with the process of USW.
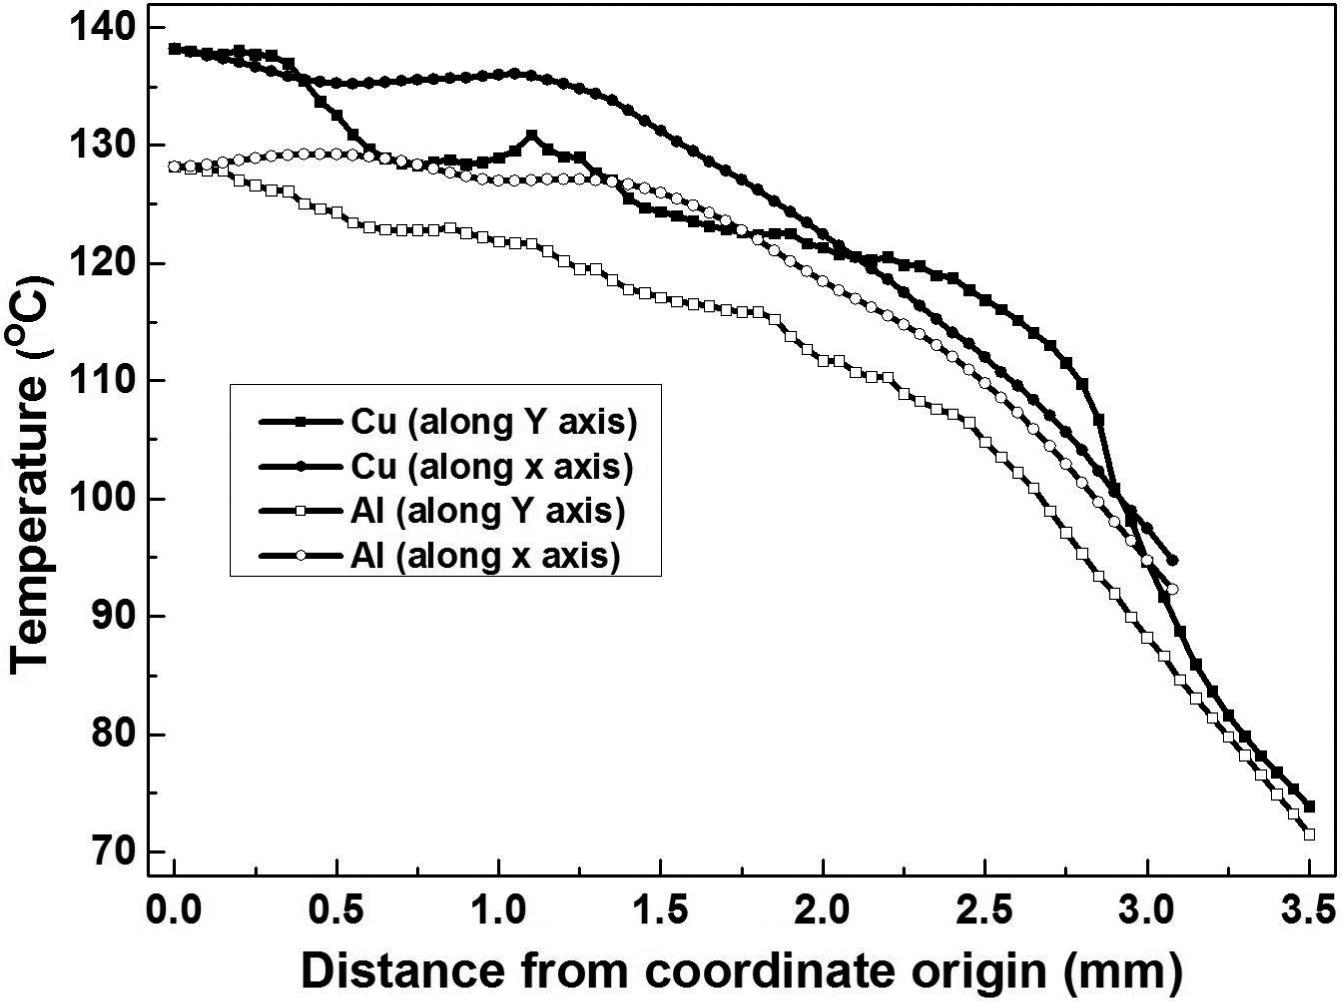
Based on the coordinate in Fig. 6, temperature variation along x and y axis at the contact interface of Cu/Al is plotted in Fig. 7. The zero point of transverse coordinates is at the centre of the structure. The general trend is that temperature decreases with the distance from centre region and the decrease rate is higher along y axis, namely, the vibration direction. Temperature is higher at the Cu plate than that at the Al plate at the same location. The four curves, especially the two parallel to vibration direction, are not so smooth but show some singular points. Temperature may be higher when the distance from the centre place is no longer at some places. For example, temperature grows slowly between 0.8 and 1.2 mm at the Cu plate along the y axis. This kind of abnormality indicates the uneven change of temperatures. It is caused by the localised concentration of plastic deformation and frictional heat generation related to serrated ridges of sonotrode tip, which will be illustrated in the following section.
A contrast model, in which the sonotrode tip is flat, is constructed and calculated. Comparisons are made between the two models in order to find the phenomenon of local frictional and plastic deformation heat generation concentration caused by the effect of serrated sonotrode tip knurl pattern. Temperature distribution on the contact interface of Al at the end of the welding process is obtained. Figure 8 shows the results of temperature distribution from the two models considering serrated ridges of sonotrode tip or not. The maximum temperature locates at the central region of the contact area when the serrated geometry of sonotrode ridges is ignored, as can be seen from Fig. 8b. Temperature decreases regularly with the increase of distance from the central position. As for the result considering geometrical features of sonotrode tip, we can see from Fig. 8a that the highest temperature is not located at the central region, but bias not only in the vibration direction but also in the direction vertical to the vibration direction. Meanwhile, the isothermal line is nearly an elliptical shape in Fig. 8b. However, there is no regular trend of temperature variation in Fig. 8a. The isothermal line is disorganised, and there are some singular points. The average temperature is higher in the model that considers the effect of sonotrode tip than the model that does not. The reason may be that the contact stress is more concentrated and there is more plastic deformation on the contact interface under the effect of serrated ridges. Therefore, there will be much more heat generation from plastic deformation to result in higher temperature.
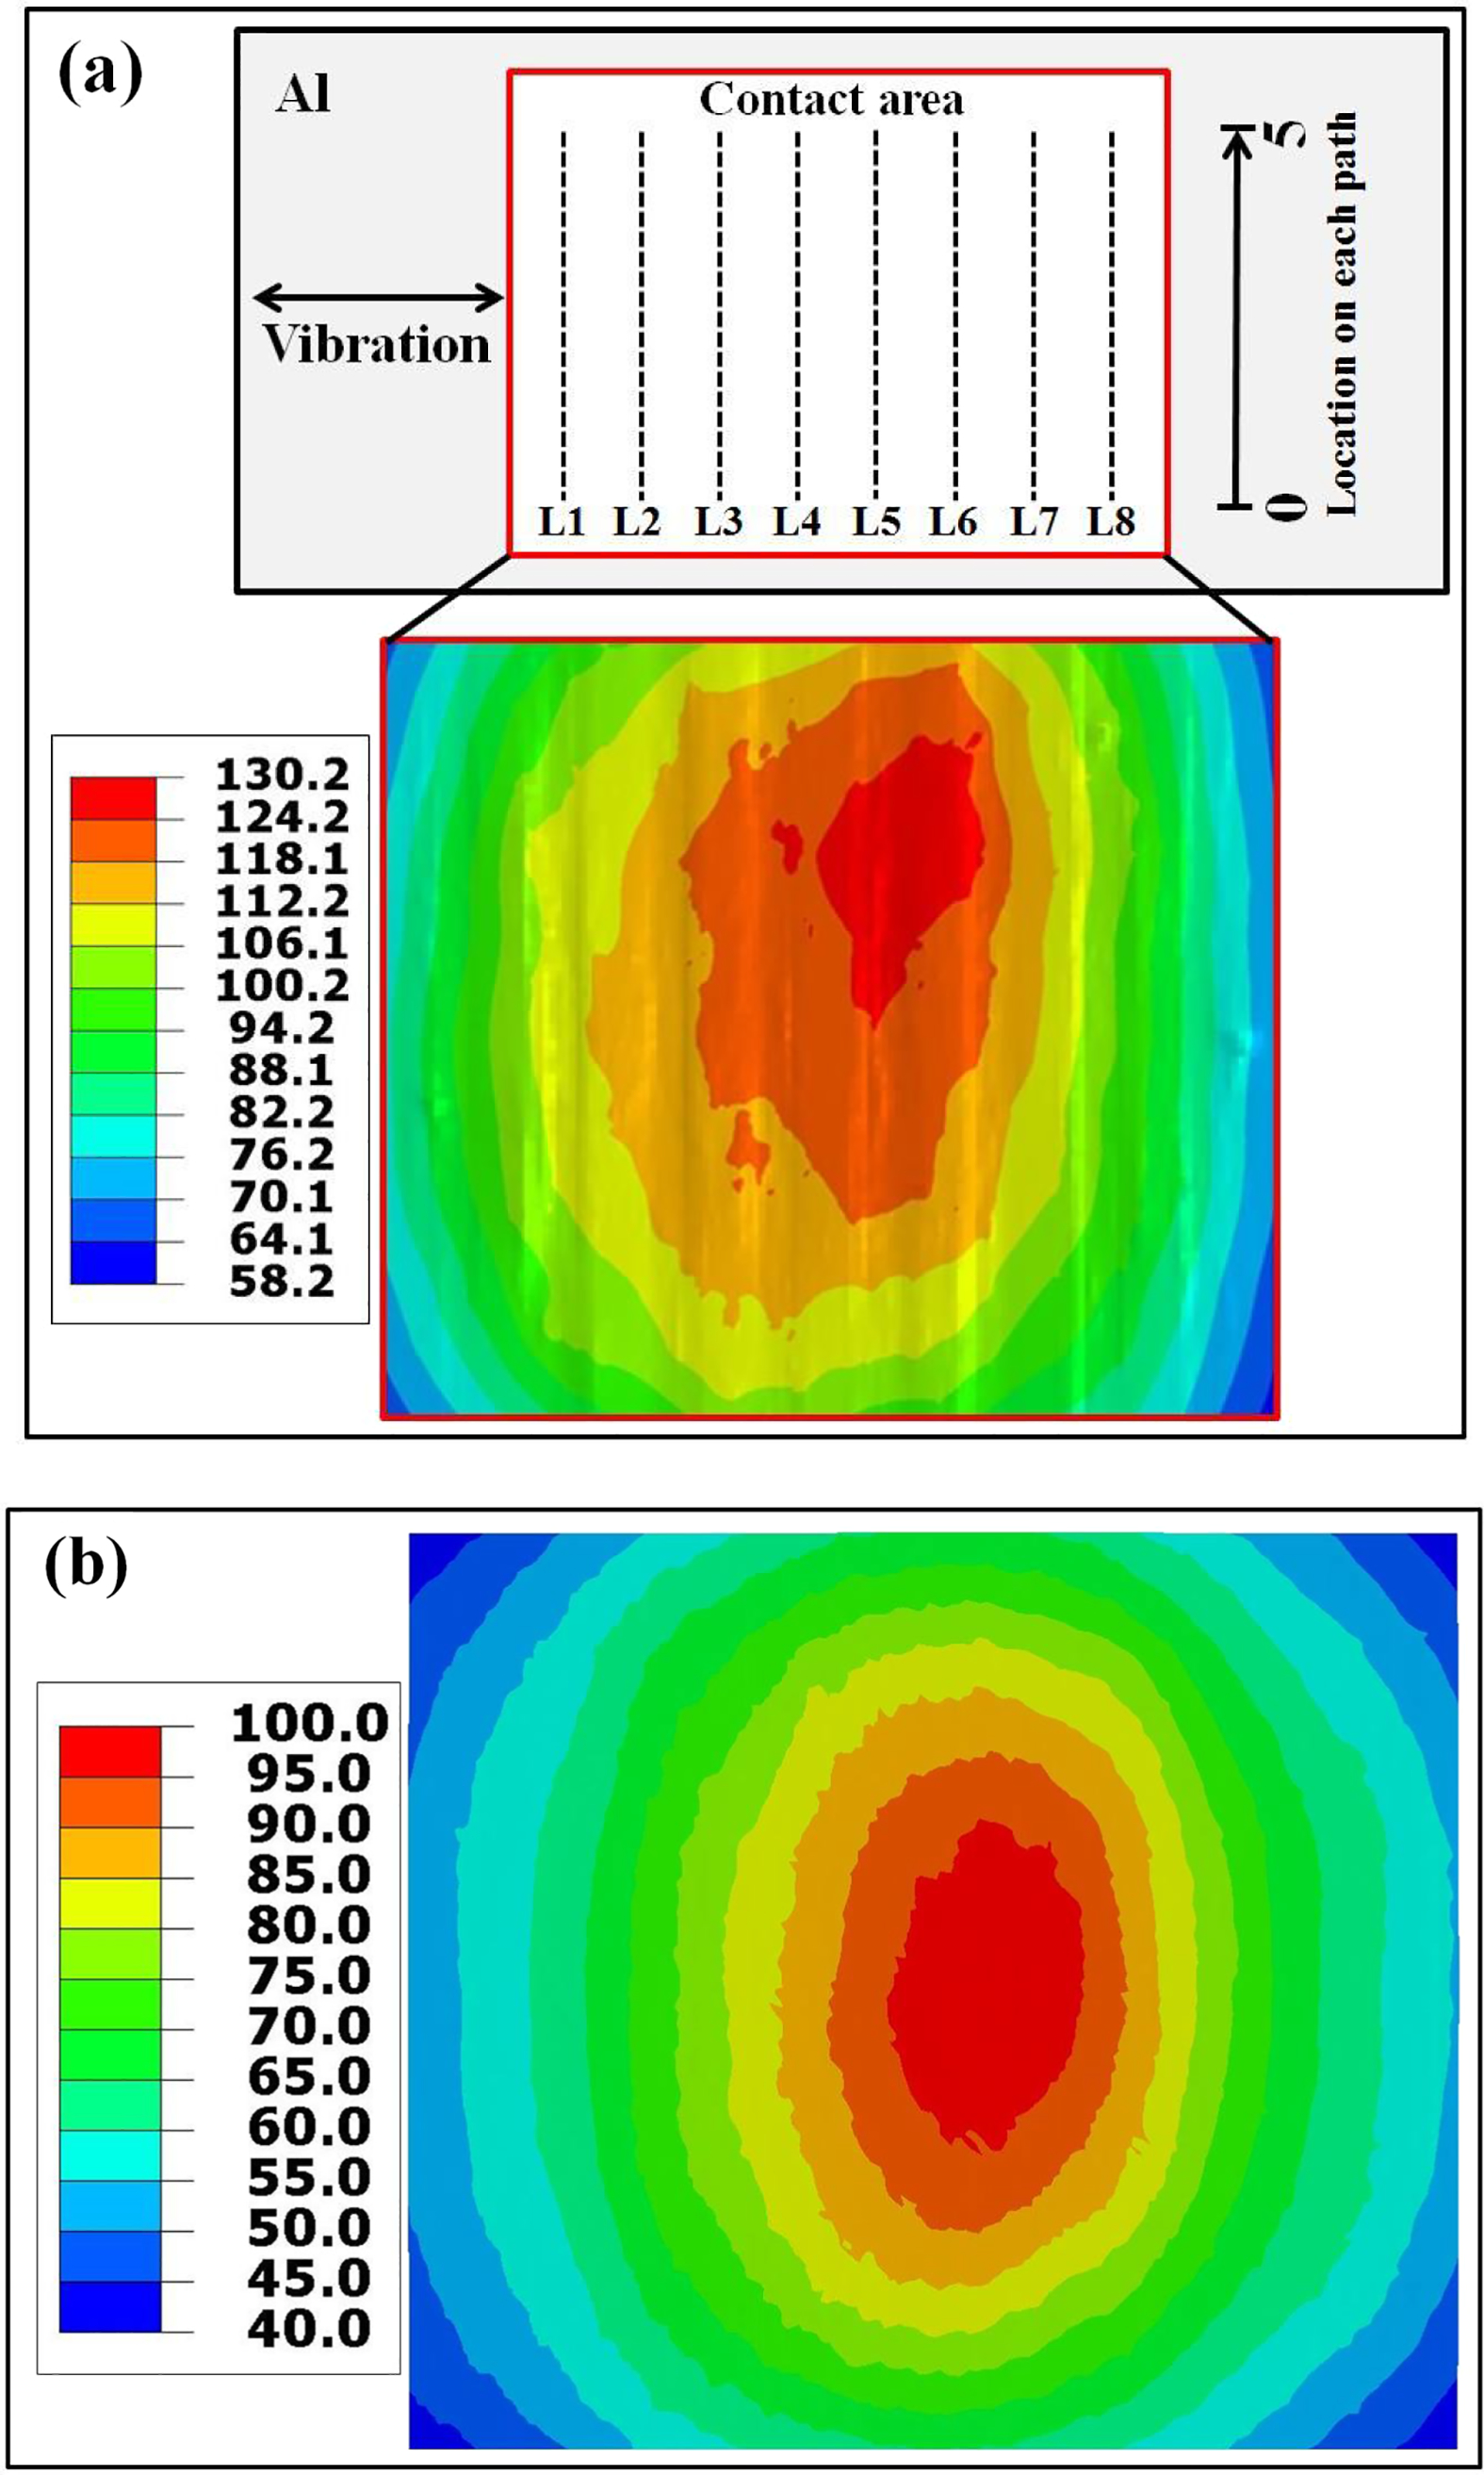
a considering geometrical features of sonotrode tip; b with flat sonotrode tip
In order to find out the effect of sonotrode tip quantitatively, temperature distribution along defined paths in Fig. 8a (the location is illustrated in Fig. 3) is obtained and illustrated in Fig. 9. The x axis is along the direction shown in Fig. 8a. The eight lines in Fig. 8a are projections from the centres of eight sonotrode ridges on Al. As can be seen from Fig. 9a, in the model considering serrated ridges of sonotrode tip, temperature distribution is not symmetrical about the centre for one single curve, but slightly bias to the right side. For instance, temperature distribution at the location from 2.5 to 5 mm is a bit higher than that from 0 to 2.5 mm along ‘L4’ and ‘L5’. The two curves are not so smooth. This kind of abnormality indicates the uneven change of temperatures. However, in the model with flat sonotrode tip, temperature distribution along ‘L4’ and ‘L5’ is regular. Both decrease from the centre place to exterior area and are nearly symmetric about the centreline.
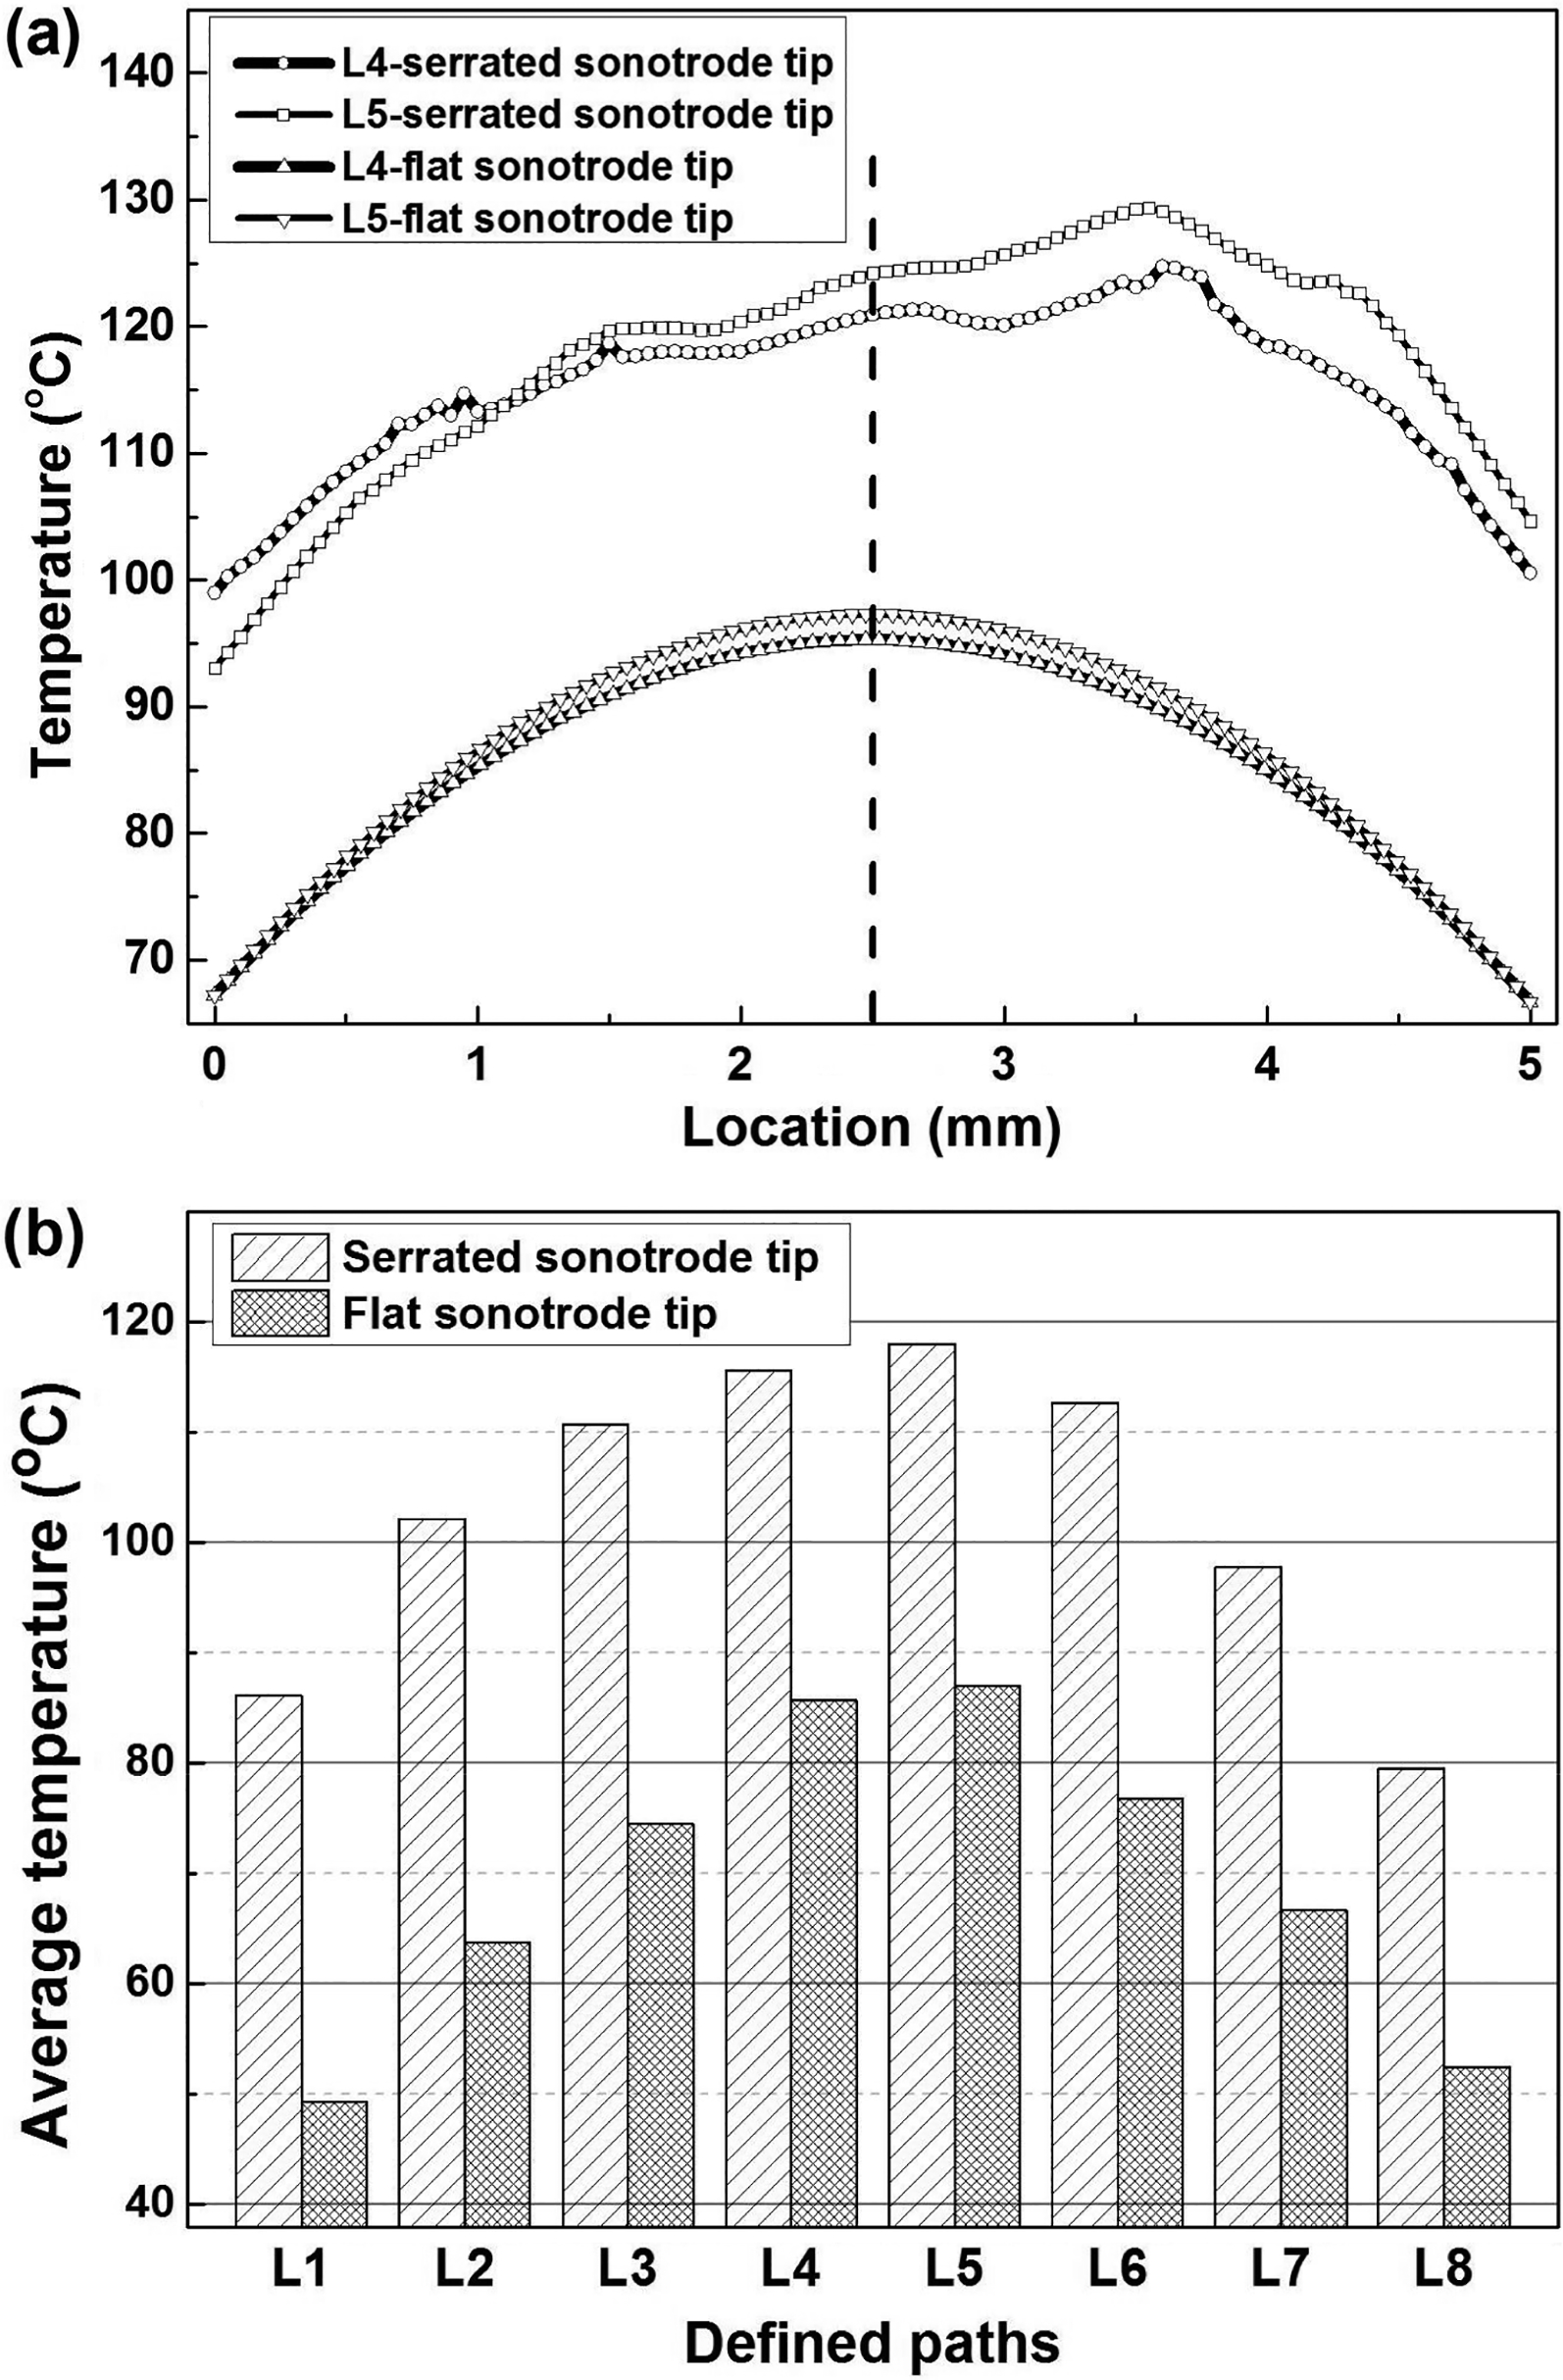
a temperature distribution along ‘L4’ and ‘L5’; b average temperatures along defined paths (‘L1’ to ‘L8’)
Figure 9b shows the average temperatures along defined paths. In both models, average temperatures decrease with the increase of distance from the centre increases. For example, the size order of average temperature value is ‘L4’ (high), ‘L3’, ‘L2’ and then ‘L1’ on one side. No symmetry about the centreline can be seen in the model considering geometric feature of sonotrode tip. However, in the model with flat sonotrode tip, the differences of average temperatures at symmetric locations (‘L1’ and ‘L8’ for instance) are minor. Temperatures on the side of initial vibration direction (‘L5’ to ‘L8’) are a bit higher than those on the other side (‘L1’ to ‘L4’).
Temperature evolution on the contact interface depends on two major factors: heat generation (due to frictional work and plastic deformation) and dissipation because of the temperature difference. Frictional work between the contact interfaces is the main heat generation source. Therefore, heat generation on the contact interface is higher than that at other places. Heat dissipation direction is always from the interface to interior zone. Figure 10 plots the average temperature evolution on the contact area of Al.
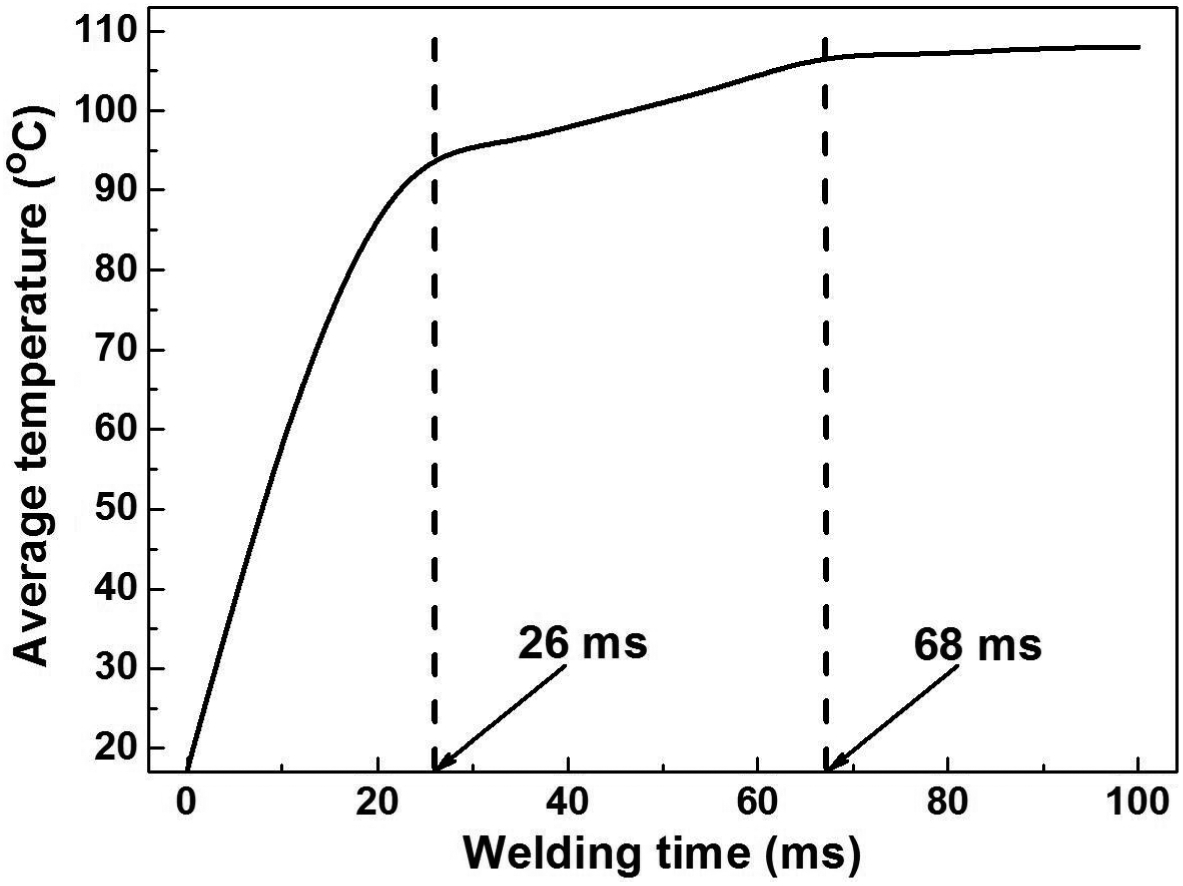
Evolution of average temperature on contact interface of Al
At the beginning of the welding process (before 26 ms), the average temperature grows quickly to more than 90°C. From 26 to 68 ms, the temperature growth rates decrease sharply. The average temperature is still lower than 110°C. After 68 ms, the average temperature barely increases, nearly coming to a saturation condition. The conclusion that the temperature growth rate turns from huge to micro after a certain time agrees well with the experimental work of de Vires. 29 The temperature growth at the contact interface is determined by the interaction of heat generation and dissipation. Temperature varies between the contact interface and interior zone because of heat generation difference. Large amount of heat is generated on the contact interface because of interface friction work. Temperature is higher at the contact interface, and the heat dissipation direction is from the interface to the interior area. At the initial phase of the welding process, the temperature difference is not so obvious and heat dissipation is minor. As the welding proceeds, temperature variation becomes relatively large, leading to increasing heat dissipation simultaneously. Thus, the growth rate of temperature on the contact interface will be lowered. The rate of heat generation is still higher than that of dissipation at the end of the welding process. However, the values of the two factors nearly equal each other, resulting in minor temperature increment.
Temperature validation
USW experiments of Cu to Al are conducted. Temperature at the edge of contact interface of sonotrode/Cu is measured using infrared methods at an angle of 20° between camera view and weld area plane. The IR camera used in this work is a FLIR A615 and records images with an accuracy of ± 2°C at 200 Hz. Temperatures are recorded throughout the entire welding process. The experimental set-up for the thermal measurements is shown in Fig. 11. Figure 11a shows the testing site, and Fig. 11b illustrates the position of temperature measurement. There are several advantages of IR camera over other methods in monitoring temperature process during USW. The IR camera allows great flexibility in location and special resolution of measurements. Another method to measure USW temperatures, discussed by Sriraman et al. 41 , involves the use of thermocouples. In their work, temperatures were measured by placing a thermocouple between the bond interfaces. The usage of an IR camera has three distinct advantages compared to thermocouples during USW: (i) one thermocouple is required for each data point, (ii) placing a thermocouple between weld materials will alter the weld properties at the location and (iii) the thermocouple cannot be reused afterwards.
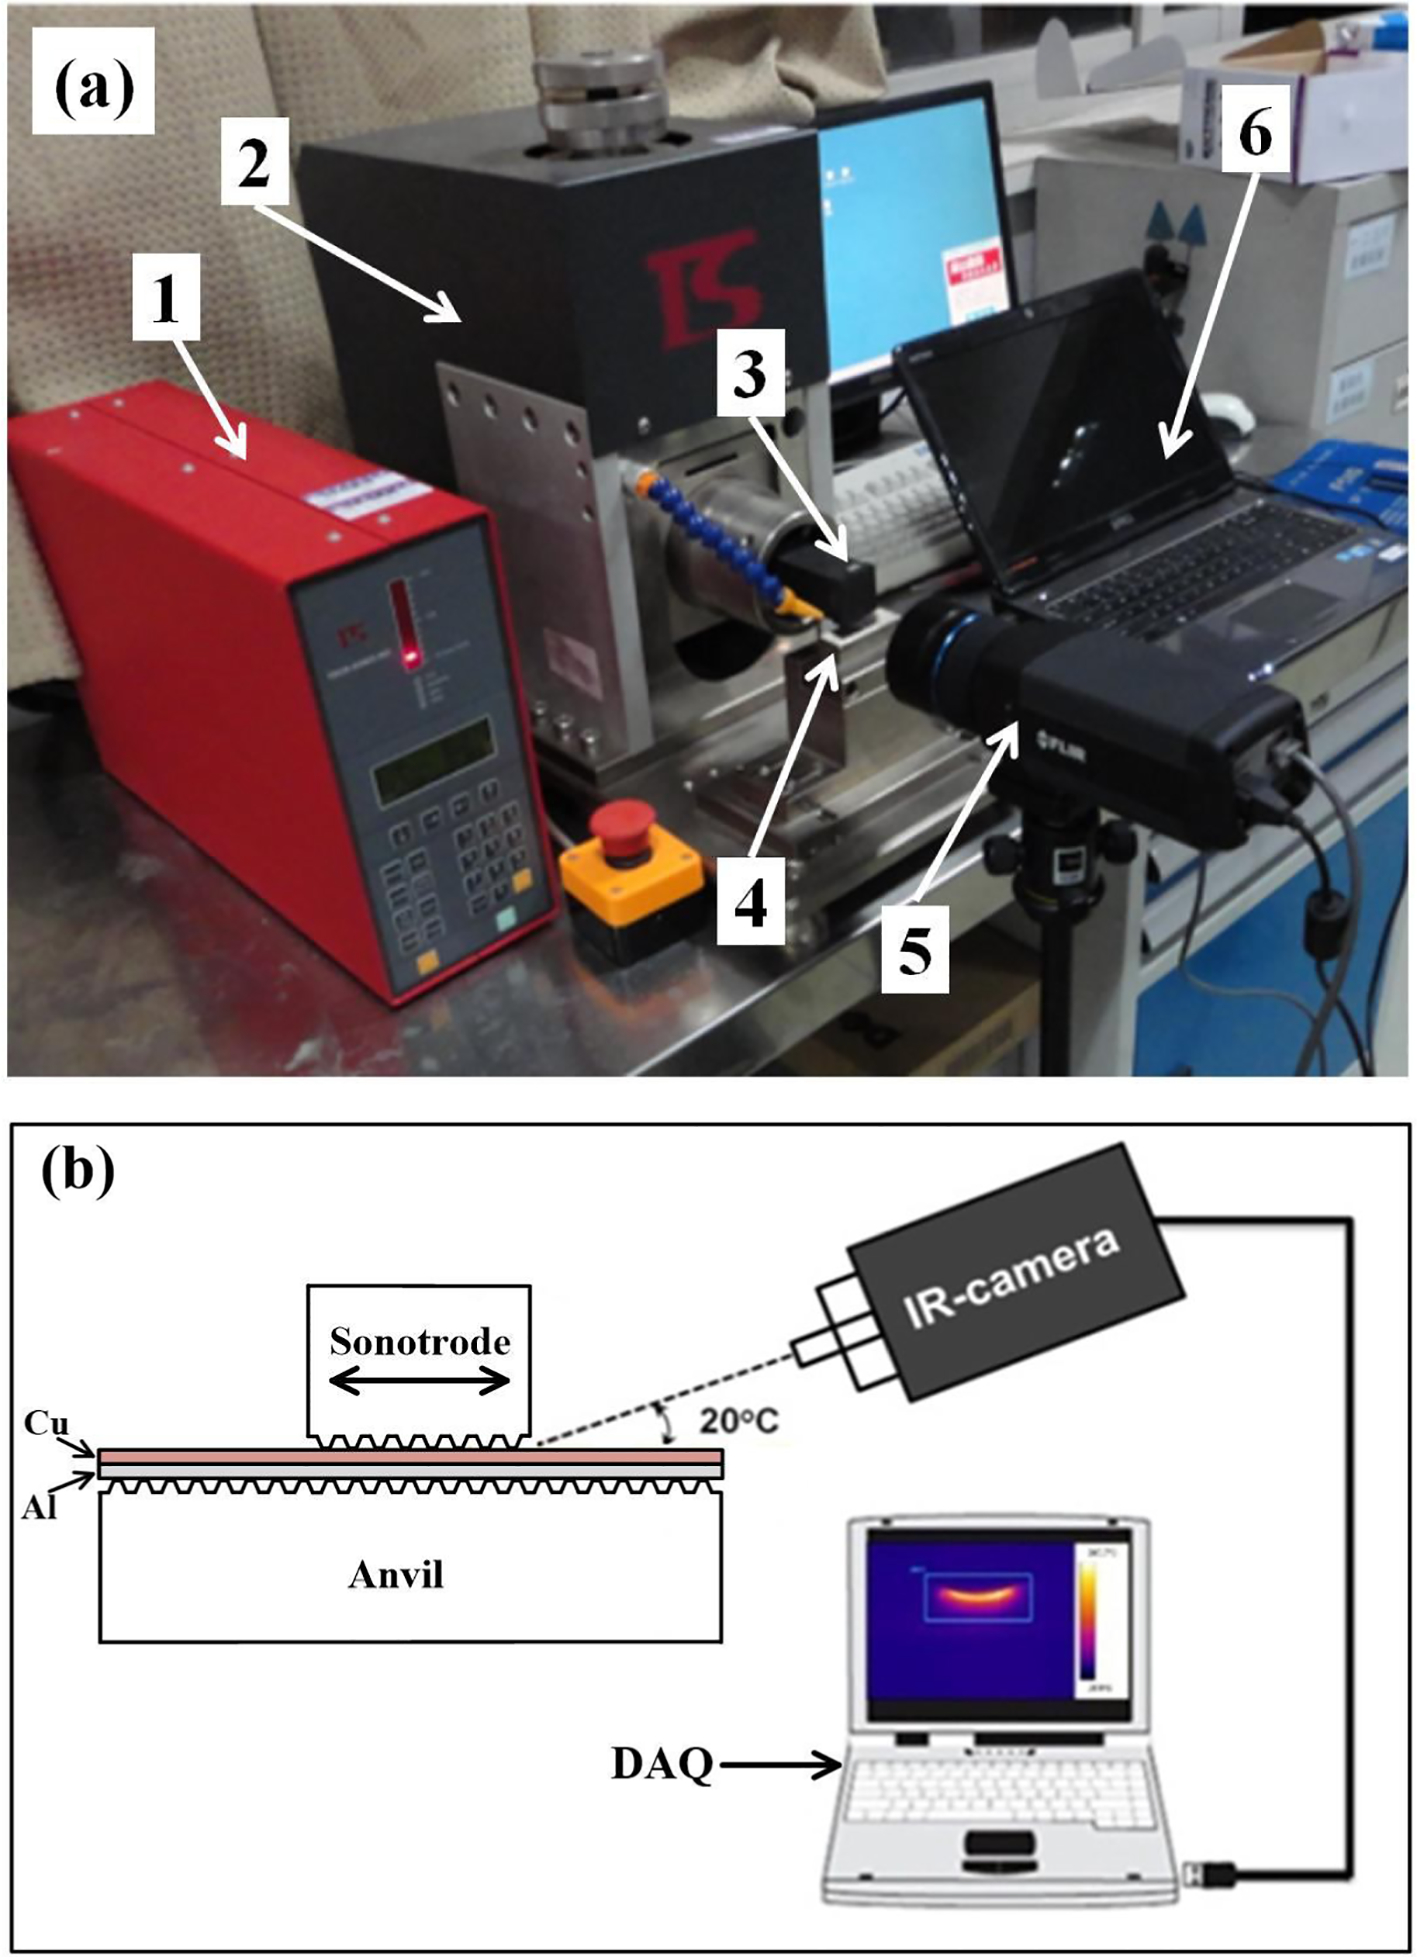
a testing site: 1, controller; 2, welder; 3, sonotrode; 4, anvil; 5, infrared camera; 6, data acquisition system (DAQ); b location instruction of temperature measured point
Four sets of tests with the same welding parameters are carried out. Temperature evolution of experimental measurements and simulated result at the same location are presented in Fig. 12. The four thin solid lines represent experimental data, while the thick dashed line denotes simulation result. It can be seen that there is slight deviation of the four tests, with the maximum temperature values at the end of welding process ranging from 97 to 109°C. The simulated temperature evolution is within the range of experiments. At the end of the welding process, the error of simulated temperature is 4.3%, slightly lower than the average value of experimental results. The conclusion can be drawn that temperature evolution agrees well between the proposed model and experimental results.
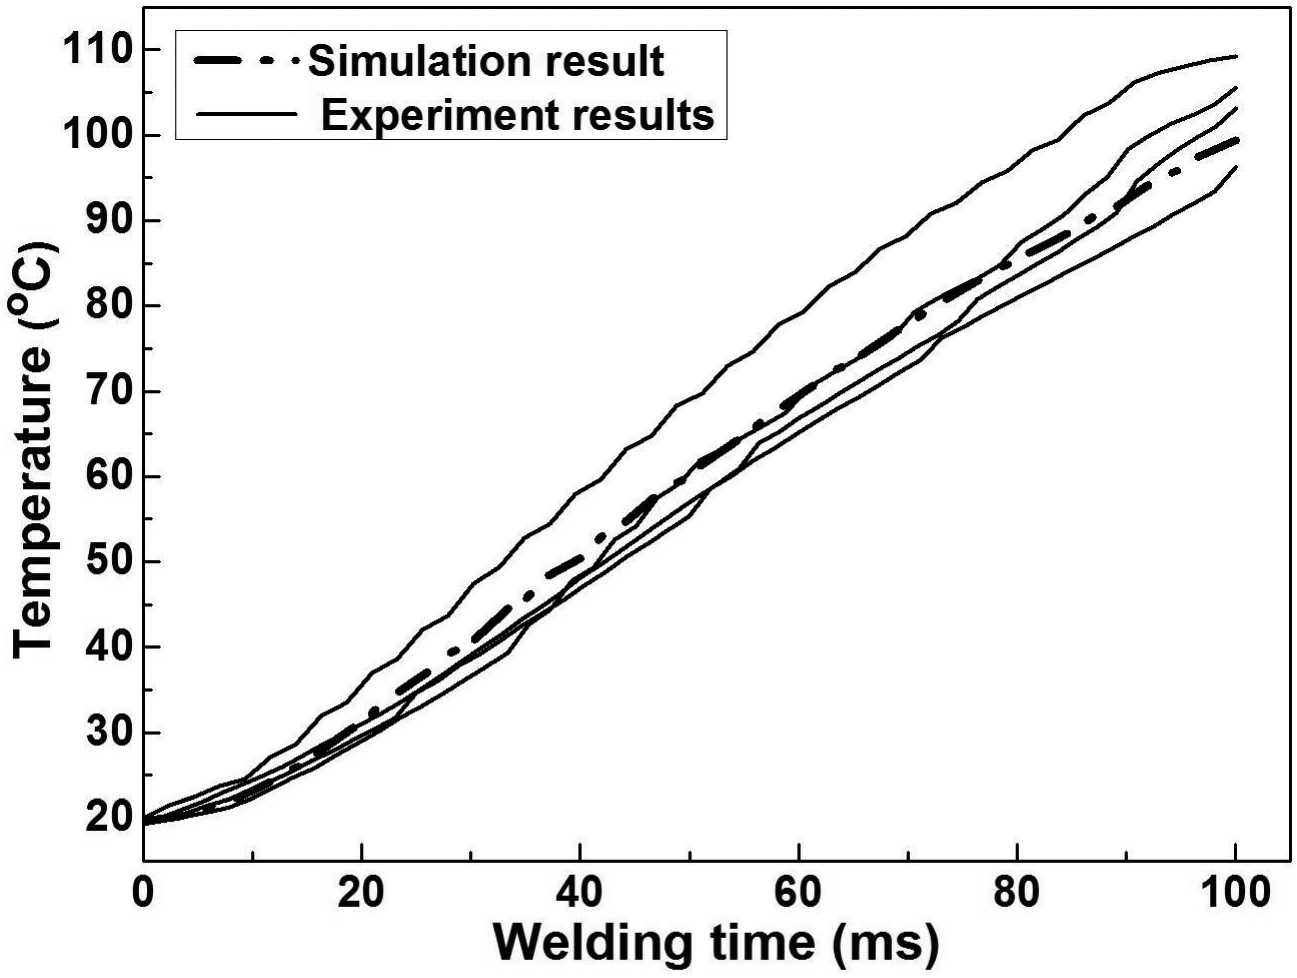
Comparison of temperature evolution between simulation and experiments
Conclusions
A 3D finite element model was constructed to study the heat generation process and temperature distribution during USW. The model is validated by comparing simulated temperature evolution with experimental result. The proposed model is of scientific and engineering significance by offering parametric analysis of the thermal process. The main conclusions are summarised below.
Heat generation from plastic deformation is comparable with that from interface frictional work. It has significant effect on temperature distribution and cannot be ignored. The sequence of specimens has little effect on fraction of plastic deformation heat generation. Maximum temperature locates at the contact interface of specimens because of large amount of frictional heat generation. There are temperature gaps at the interface of sonotrode/Cu and Al/anvil. Under the effect of serrated ridges of sonotrode tip, there are regions of local interface friction and plastic deformation concentration. Temperature distribution of the whole structure is not symmetric. Nevertheless, it is uneven and there are abnormal temperature points. Based on the evolution of average temperature on the contact surface of Al, the welding process can be divided into three periods. During the first period, temperature grows quickly and then the growth rate drops in the second period. At the last period, the average temperature barely grows, nearly coming into a saturation condition.
Acknowledgement
This research was supported by project no. 51275304 sponsored by the National Natural Science Foundation of China.