
Abstract
The macro- and microtextures of gas metal arc welds fabricated using both conventional ferritic and low transformation temperature (LTT) filler metals were examined. Both welds were largely composed of acicular ferrite. The weld textures were found to be distinct, which is observed to be due to variant selection during the austenite to ferrite transformation. In situ electron backscatter diffraction performed during thermal cycling of the LTT fusion zone into the austenite phase field confirmed that these transformations satisfy the expected crystallographic relationships. Implications for welding consumable design and finite element process modelling are drawn.
Introduction
The thermal strains that arise during welding give rise to residual stresses and distortion in welded joints that are problematic in initial fabrication of a satisfactory structure and its subsequent strength, fatigue and stress–corrosion cracking performance.1, 2 However, in the majority of welds, a filler metal is added, and therefore, the possibility exists to select a filler material with the aim of improving the performance of the welded joint. Over recent years, there has been much interest in using filler metals during the welding of steels that exploit the austenite to ferrite (γ → α) transformation strains to accommodate some of the thermal strains from welding, mitigating the residual stress and distortion.3–9 It has been shown that weld fabrication using, for example, filler metal wires with a lowered γ → α transformation temperature, so-called low transformation temperature (LTT) wires, can result in lowered residual stresses and distortion.8, 10–12
Where the transformation is entirely reconstructive, one might initially believe that the transformation strain will simply be due to the volume change between the two unit cells. However, for a fully displacive transformation, one must consider if the applied stress state can bias which orientations of the product phase form from the parent—in the case of the γ → α transformation, 24 crystallographic variants of the body centred cubic (bcc)/body centered tetragonal (bct) ferritic (bainite or martensite) phase can form from the austenite.
However, even for fully reconstructive transformations, some ‘memory’ is commonly observed in the product phase textures. For example, in Zr and Ti, it is now commonly accepted that the simultaneous satisfaction of the orientation relationship (OR) at the parent phase grain boundary by the product phase can result in a memory effect.13–15 Such an effect has also been observed in the macroscopic textures observed using in situ synchrotron diffraction in an interstitial free steel. 16
For displacive transformations, the OR between the two phases is complicated by the possibility to minimise the strain at the interface plane by slight rotations from the ideal OR, as shown by Mackenzie and Bowles17, 18 and Wechsler et al. 19 in the phenomenological theory of martensite crystallography. The overall transformation elastic strain tensor can be calculated and compare to the applied stress, resulting in a calculation of which variants are favoured by the applied stress state.20–23 Bhadeshia 10 showed that the volume change due to the transformation in bainite is much smaller than the shear component. Babu and Bhadeshia 24 studied the effect of applied stress on the formation of acicular ferrite. In a series of heat treatment experiments and subsequent microstructural observations, they revealed at least six crystallographic variants form where no stress is applied and that much less are observed when the transformation occurs under an applied elastic load. Of course, plastic strains can also have an effect by favouring variants that grow across slip planes and by the hindering of plate growth by plastic damage.25–27
Hase et al. 28 examined the influence of stress on the transformation kinetics of upper bainite. It was found that compressive stresses of 4–200 MPa strongly favoured the growth of compliant variants, potentially even leading to large regions of bainite in identical orientations. In addition, they demonstrated that the stress increases the bainite start temperature and accelerates the kinetics of the transformation.
In the present paper, we demonstrate that these effects do operate in LTT filler metal, but that the effect is not discernible in conventional weld (CW) filler, and so that these transformations are relevant to weld models for the mitigation of residual stress and distortion using LTT fillers. The macro- and microtextures have been observed in LTT and CW welds, and fusion zone material from these welds is then characterised using in situ electron backscatter diffraction (EBSD) during thermal cycling.
Experimental
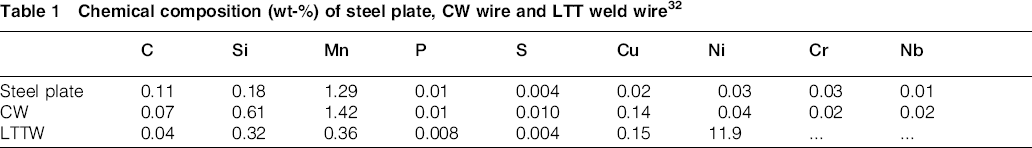
Weld samples were fabricated using manual gas metal arc welding (GMAW) procedure.29–31 Two high strength low alloy steel plates of dimensions 500 mm long, 250 mm wide and 4 mm thick were single pass butt welded. A CW wire with high transformation start temperature, i.e. 560°C, and a consumable with an LTT, i.e. 420°C, were used in the fabrication of the welds, 32 and the latter is above the Ms temperature calculated according to Ishida. 33 Plates were held apart by series of three tack welds 25 mm long, which were located in the plate centre and at the both ends. Ceramic backing tiles were used to contain the weld pool. During welding, plates were unrestrained and rested on wooden pallets. The chemical compositions of the plates and the weld consumables are shown in Table 1. The welding was performed using parameters shown in Table 2. Residual stresses in the welded plates were measured employing the neutron diffraction technique and were reported in previous studies.29, 31, 32 The results indicate remarkably different residual stress pattern in longitudinal direction. While in the fusion zone and its vicinity of plates welded with CW wire, tensile stresses of magnitude 440 MPa were developed, whereas for the LTT filler, compressive stresses of ∼100 MPa are present. Macrograph from the plate welded with CW wire (Fig. 1) shows widths of the fusion zone and the heat affected zone, which are ∼10 and 20 mm respectively. The shape of the weld on the lower side replicates the contours of ceramic backing tiles used during welding. It is also obvious that the weld does not fill the gap fully on the upper side.
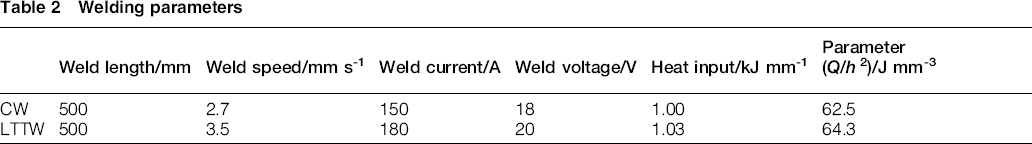
Chemical composition (wt-%) of steel plate, CW wire and LTT weld wire 32
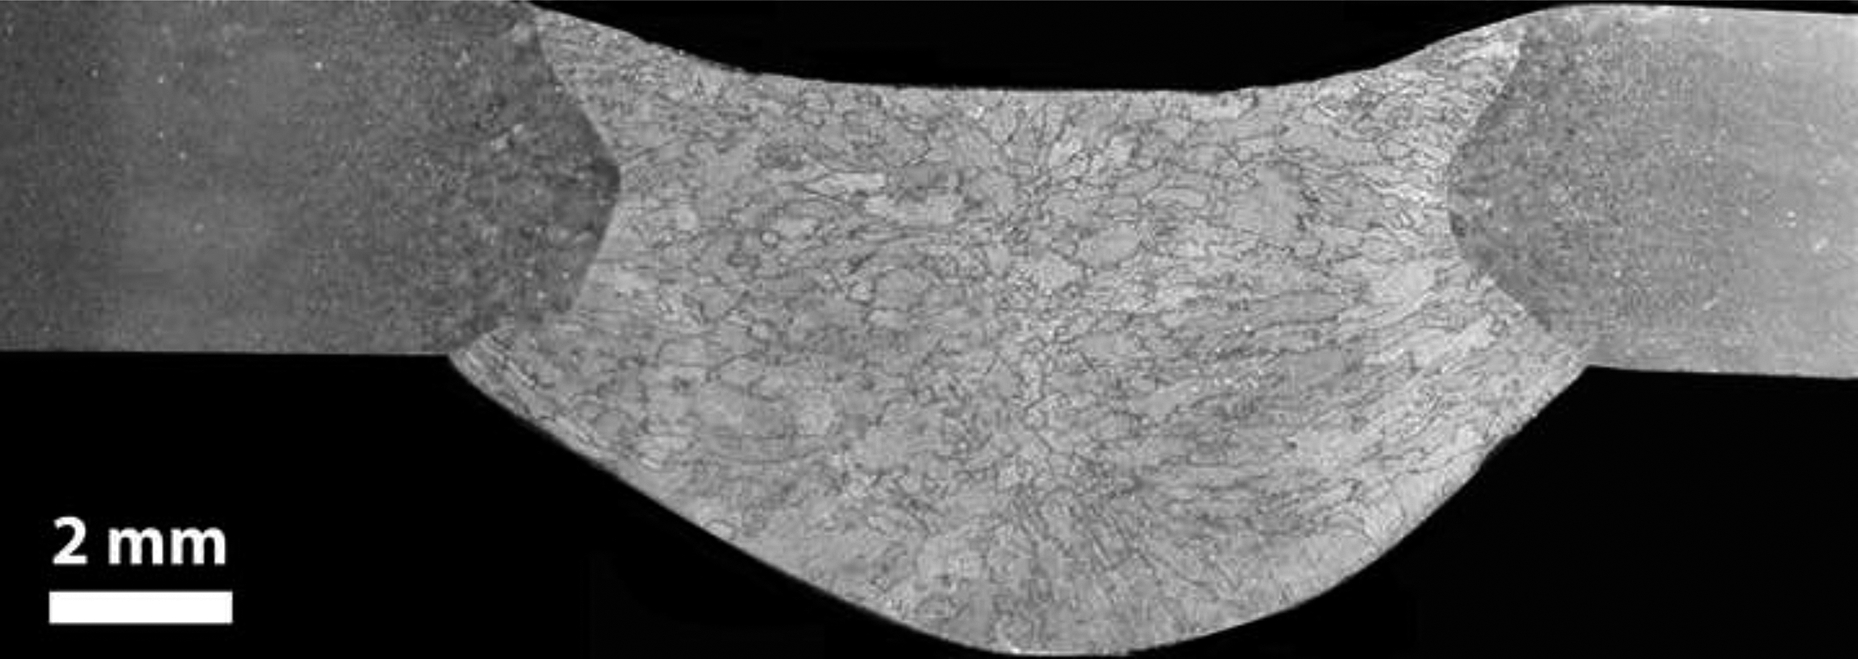
Welding parameters
Macrograph fusion zone and heat affected zone of CW wire
All of the microstructural observations including conventional transmission electron microscopy (TEM), scanning electron microscopy (SEM) and electron backscattering diffraction (EBSD) were carried out in longitudinal direction of specimens extracted from the butt welded plate (i.e. in weld cross-section). For TEM examinations, specimens ∼1 mm in thickness were cut. The specimens were ground on SiC paper up to 1200 grade down to a thickness of 200 μm. The final foil specimens for TEM were prepared from punched 3 mm discs, after fine grinding on SiC paper up to 4000 grade down to a thickness of ∼50 μm. Twin jet electrolytical thinning (Struers TenuPol-5) to electron transparency in a solution of ethanol with 5% perchloric acid at ∼(20°C and an applied voltage of 22 V was used. TEM specimens were examined in a JEOL 2000 FX TEM operating with a LaB6 filament. Bright field (BF) TEM images were obtained from thin foil specimens to enable a microstructural characterisation of samples.
To acquire both secondary electron micrographs and the EBSD maps the specimens were prepared by mechanical grinding and polishing followed by electrolytic polishing with A2 Struers electrolyte (78 mL perchloric acid, 700 mL ethanol, 100 mL ethylene glycol monobutyl ether), at a tension of 40 V, a flowrate of 6 (instrument setting) and a time of 15 s at ambient temperature. In addition, some samples were subjected to a thermal cycle and examined using a high temperature SEM equipped with laser powered heating stage, 34 where in situ EBSD acquisition was performed. The laser powered heating stage consisted of a SiC sample holder in addition to inner and outer heating shields. The sample was mounted onto the holder by a tungsten clamp. A continuous wave infrared laser light of wavelength 810 nm and maximum power output of 100 W were used to heat the SiC sample holder by absorption only. To ensure high temperature stability, the inner heating shield is made of unchilled tantalum sheets. The outer heating shield is made of copper, and it is cooled together with the copper base of the heating stage by an integrated water cooling circuit. A detailed description of the assembly may be found in work of Lischewski et al. 34 Initial EBSD map was acquired at ambient temperature. The temperature was then ramped up to 1000°C s1, and an acquisition of austenite EBSD map was performed. Following this, the laser that was switch off allowed cooling of samples from 1000 to 500°C with rate of ∼15°C s− 1. At 70°C, the EBSD transformation texture was acquired. The EBSD data were collected at 70°C, in which the transformation process is completed and where a fully transformed bcc structure is present. No further changes in the microstructure below this temperature were observed. Subsequent data analysis was carried out using HKL's Technology “Channel 5” software.
Macrotexture measurements were performed by means of X-ray diffraction technique, and the data obtained were inputted into the texture analysis software popLA (preferred orientation package, Los Alamos) to plot the pole figures.
Calculation of variant ORs
In solid state phase transitions, the transformation texture can be calculated from knowledge of the orientations of the parent crystals and their OR with the product phase. 35 This assumes that the product phase grows in the parent crystal in which it nucleates. In a displacive transformation, the crystal structure of the parent phase is deformed into that of the product without the need for any diffusion. Since the coordinated movements of atoms associated with this transformation mechanism cannot in general be sustained across grain boundaries, it is reasonable to assume that the product is confined to the parent grain with which it has an OR. 36
Displacive transformations involve the disciplined motion of atoms. As a result, there are clearly defined relationships between all aspects of the parent and product lattices. The theory for this is well established and can be found elsewhere.17, 18
The description of complete crystallographic set of a single plate of martensite includes the habit plane, the shape deformation and the OR as shown in previous studies.37, 38 All of these quantities are mathematically connected and cannot in general vary independently.
The product of the austenite orientation matrix (S J γ) times the OR (γ J α) results in the martensite orientation matrix (S J α).
Equation (1) is valid for one variant. To obtain all 24 variants, the left side of the equation should be multiplied by the symmetry matrix χn.
37


For each of the martensite variant (S J α), the following operation was performed.

When during the phase transformation not all possible crystallographic variants are equally selected, variant selection occurs. This is because the shape deformation of martensite/bainite plate may or may not comply with external stresses and can be expressed by interaction energy U.
39
 is the stress component normal to the habit plane and τ is the shear stress resolved on habit plane in the direction of shear. ζ; and s are the respective normal and shear strains associated with transformation.
Results
Weld microstructures
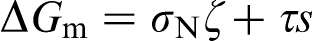
The fusion zone of specimens welded with the CW wire (Fig. 2a) consisted of proeutectoid ferrite at the prior austenite grain boundaries of the fully transformed solidification microstructure, while the remainder of the prior austenite grains consisted of interlocked acicular ferrite, cementite and non-metallic inclusions. The distribution of acicular ferrite plates does not show evidence of preferred orientation. The acicular ferrite plates were ∼5 μm long and 1 μm wide. The presence of acicular ferrite in the fusion zone, with the characteristic lenticular plate morphology observed in Fig. 2a, was confirmed using BF TEM (Fig. 2b). This fusion zone microstructure was observed to have a high dislocation density. Specimens welded with the LTT weld wire (Fig. 2c) comprised acicular ferrite and non-metallic inclusions. The observed average grain size was ∼7 μm long and 1 μm wide, and they were aligned with a preferred orientation. The corresponding BF TEM micrograph is shown in Fig. 2d, indicating an acicular ferrite plate morphology with high dislocation density. One might expect a martensitic microstructure in the sample welded with the high Ni content LTT weld consumable. However, acicular ferrite morphology was observed in the fusion zone, which was confirmed by both the TEM and SEM. The formation of acicular ferrite is presumably due to the reduced cooling rate in thin (4 mm) plates, where the heat transfer is much lower compared to that in thick plate preventing formation of martensite. Another issue is the weld metal dilution level in a dissimilar weld joint. Although Ni content in the LTT consumable is 11.9 wt.-%, this will be reduced due to the metal dilution, leading to decreased stability of austenite.
SEM-SE (left) and TEM-BF (right) micrographs of a, b CW wire and c, d LTT weld wire
Weld textures
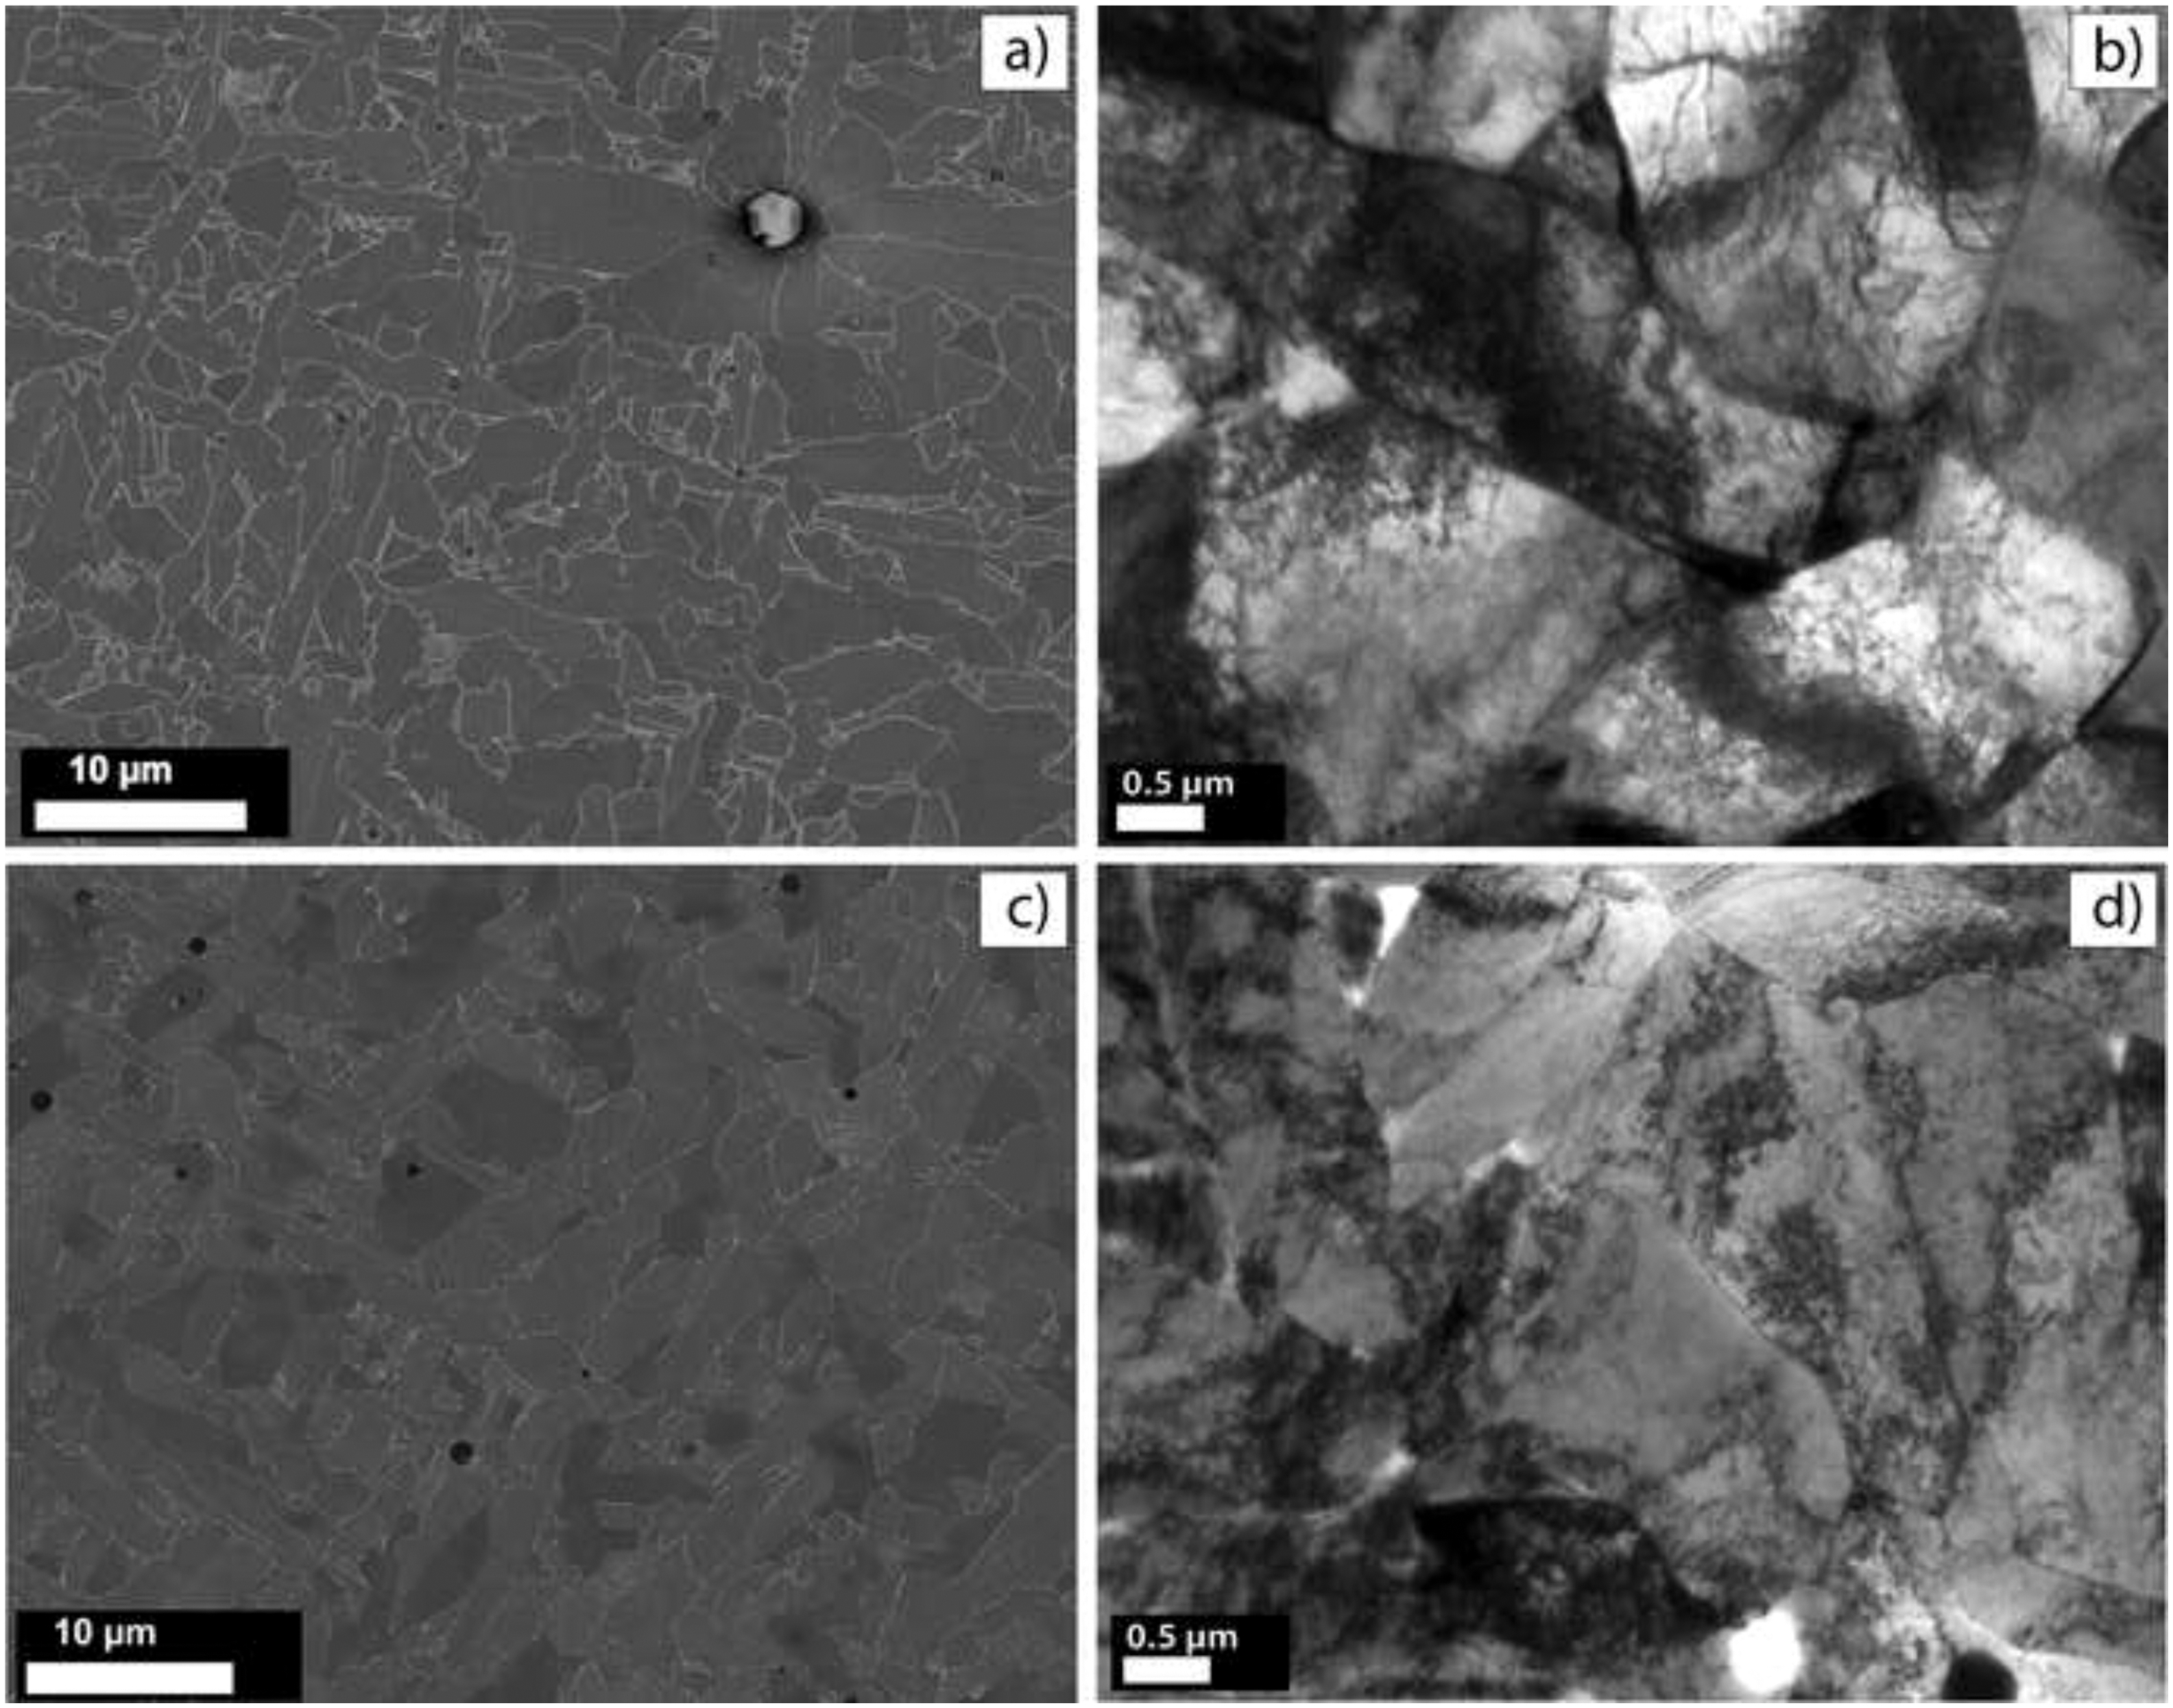
Fig. 3 shows the macroscopic texture of the fusion zones of welds using both conventional and LTT weld wires, obtained using laboratory X-ray diffraction. The pole figures show a stronger texture in the LTT sample, with the {100} secondary axes in particular being rotated 45° from the TD towards the ND axis. Such a difference can also be observed in the reconstructed {111} pole figures. A stronger effect for variant selection would be expected since, with a lower transformation temperature, more elastic strain will be built up due to thermal contraction in the austenite before transformation occurs.
Measured macroscopic texture of fusion zones from welds manufacture using a CW wire and b LTT weld wire
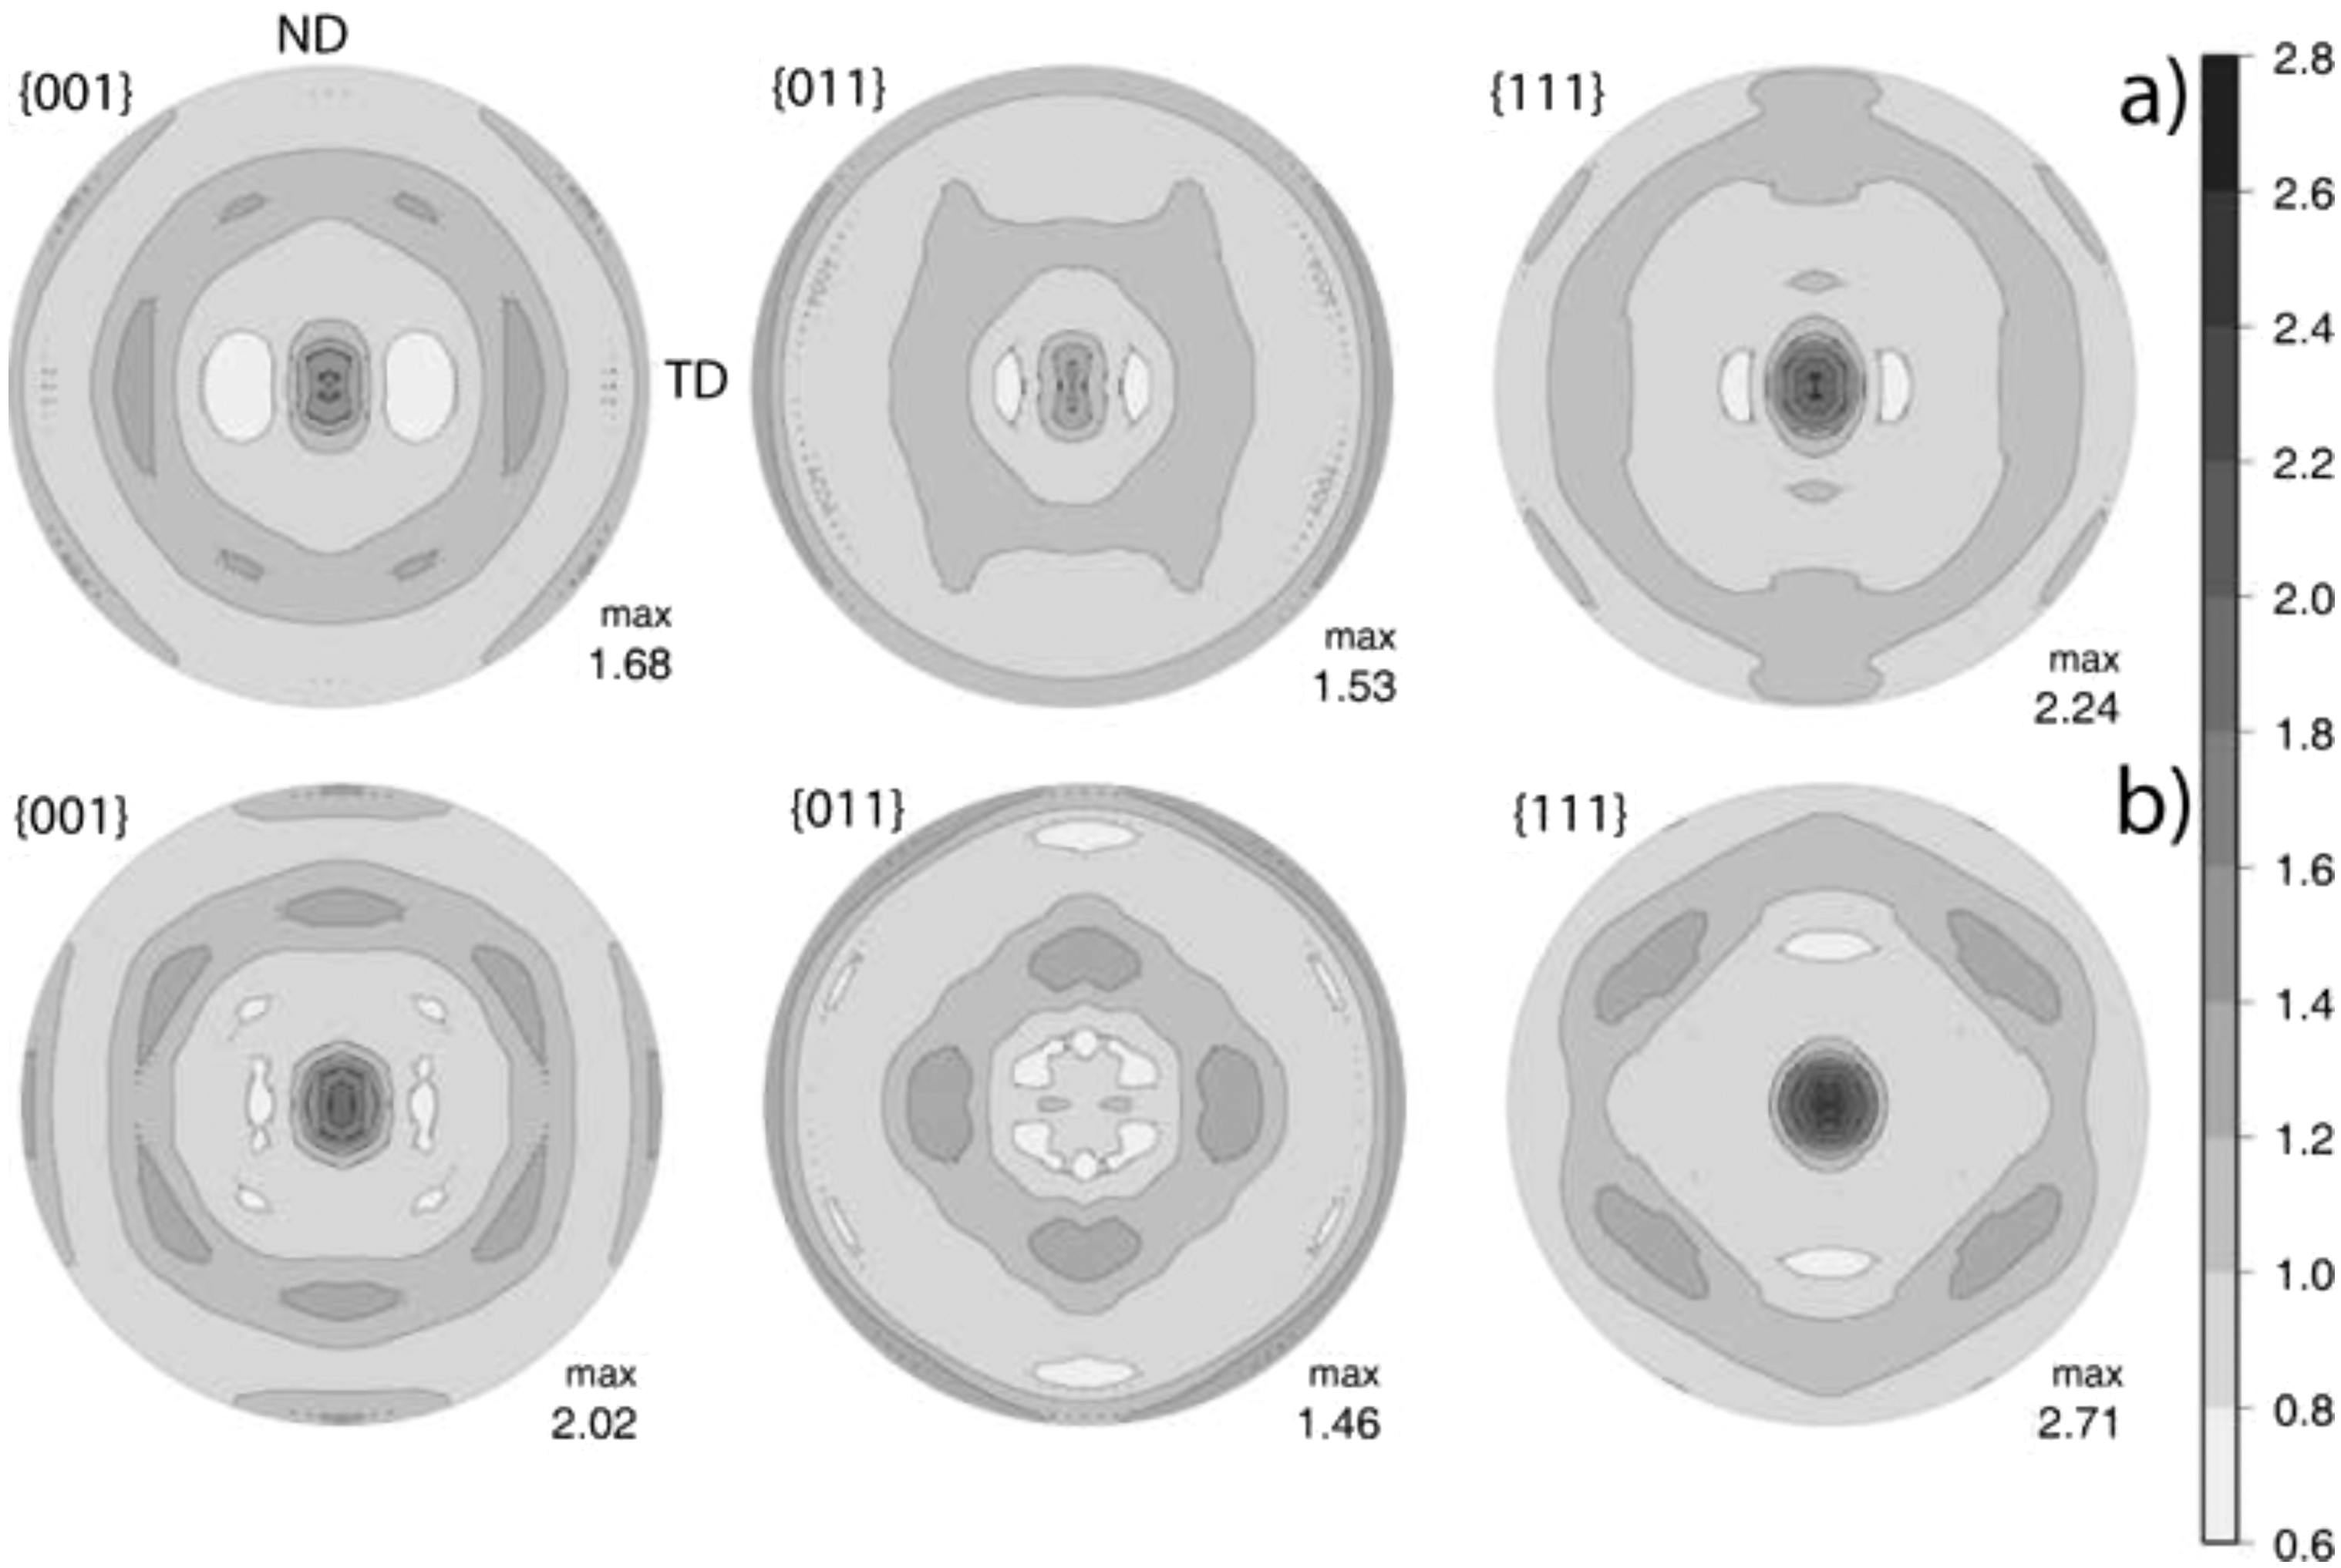
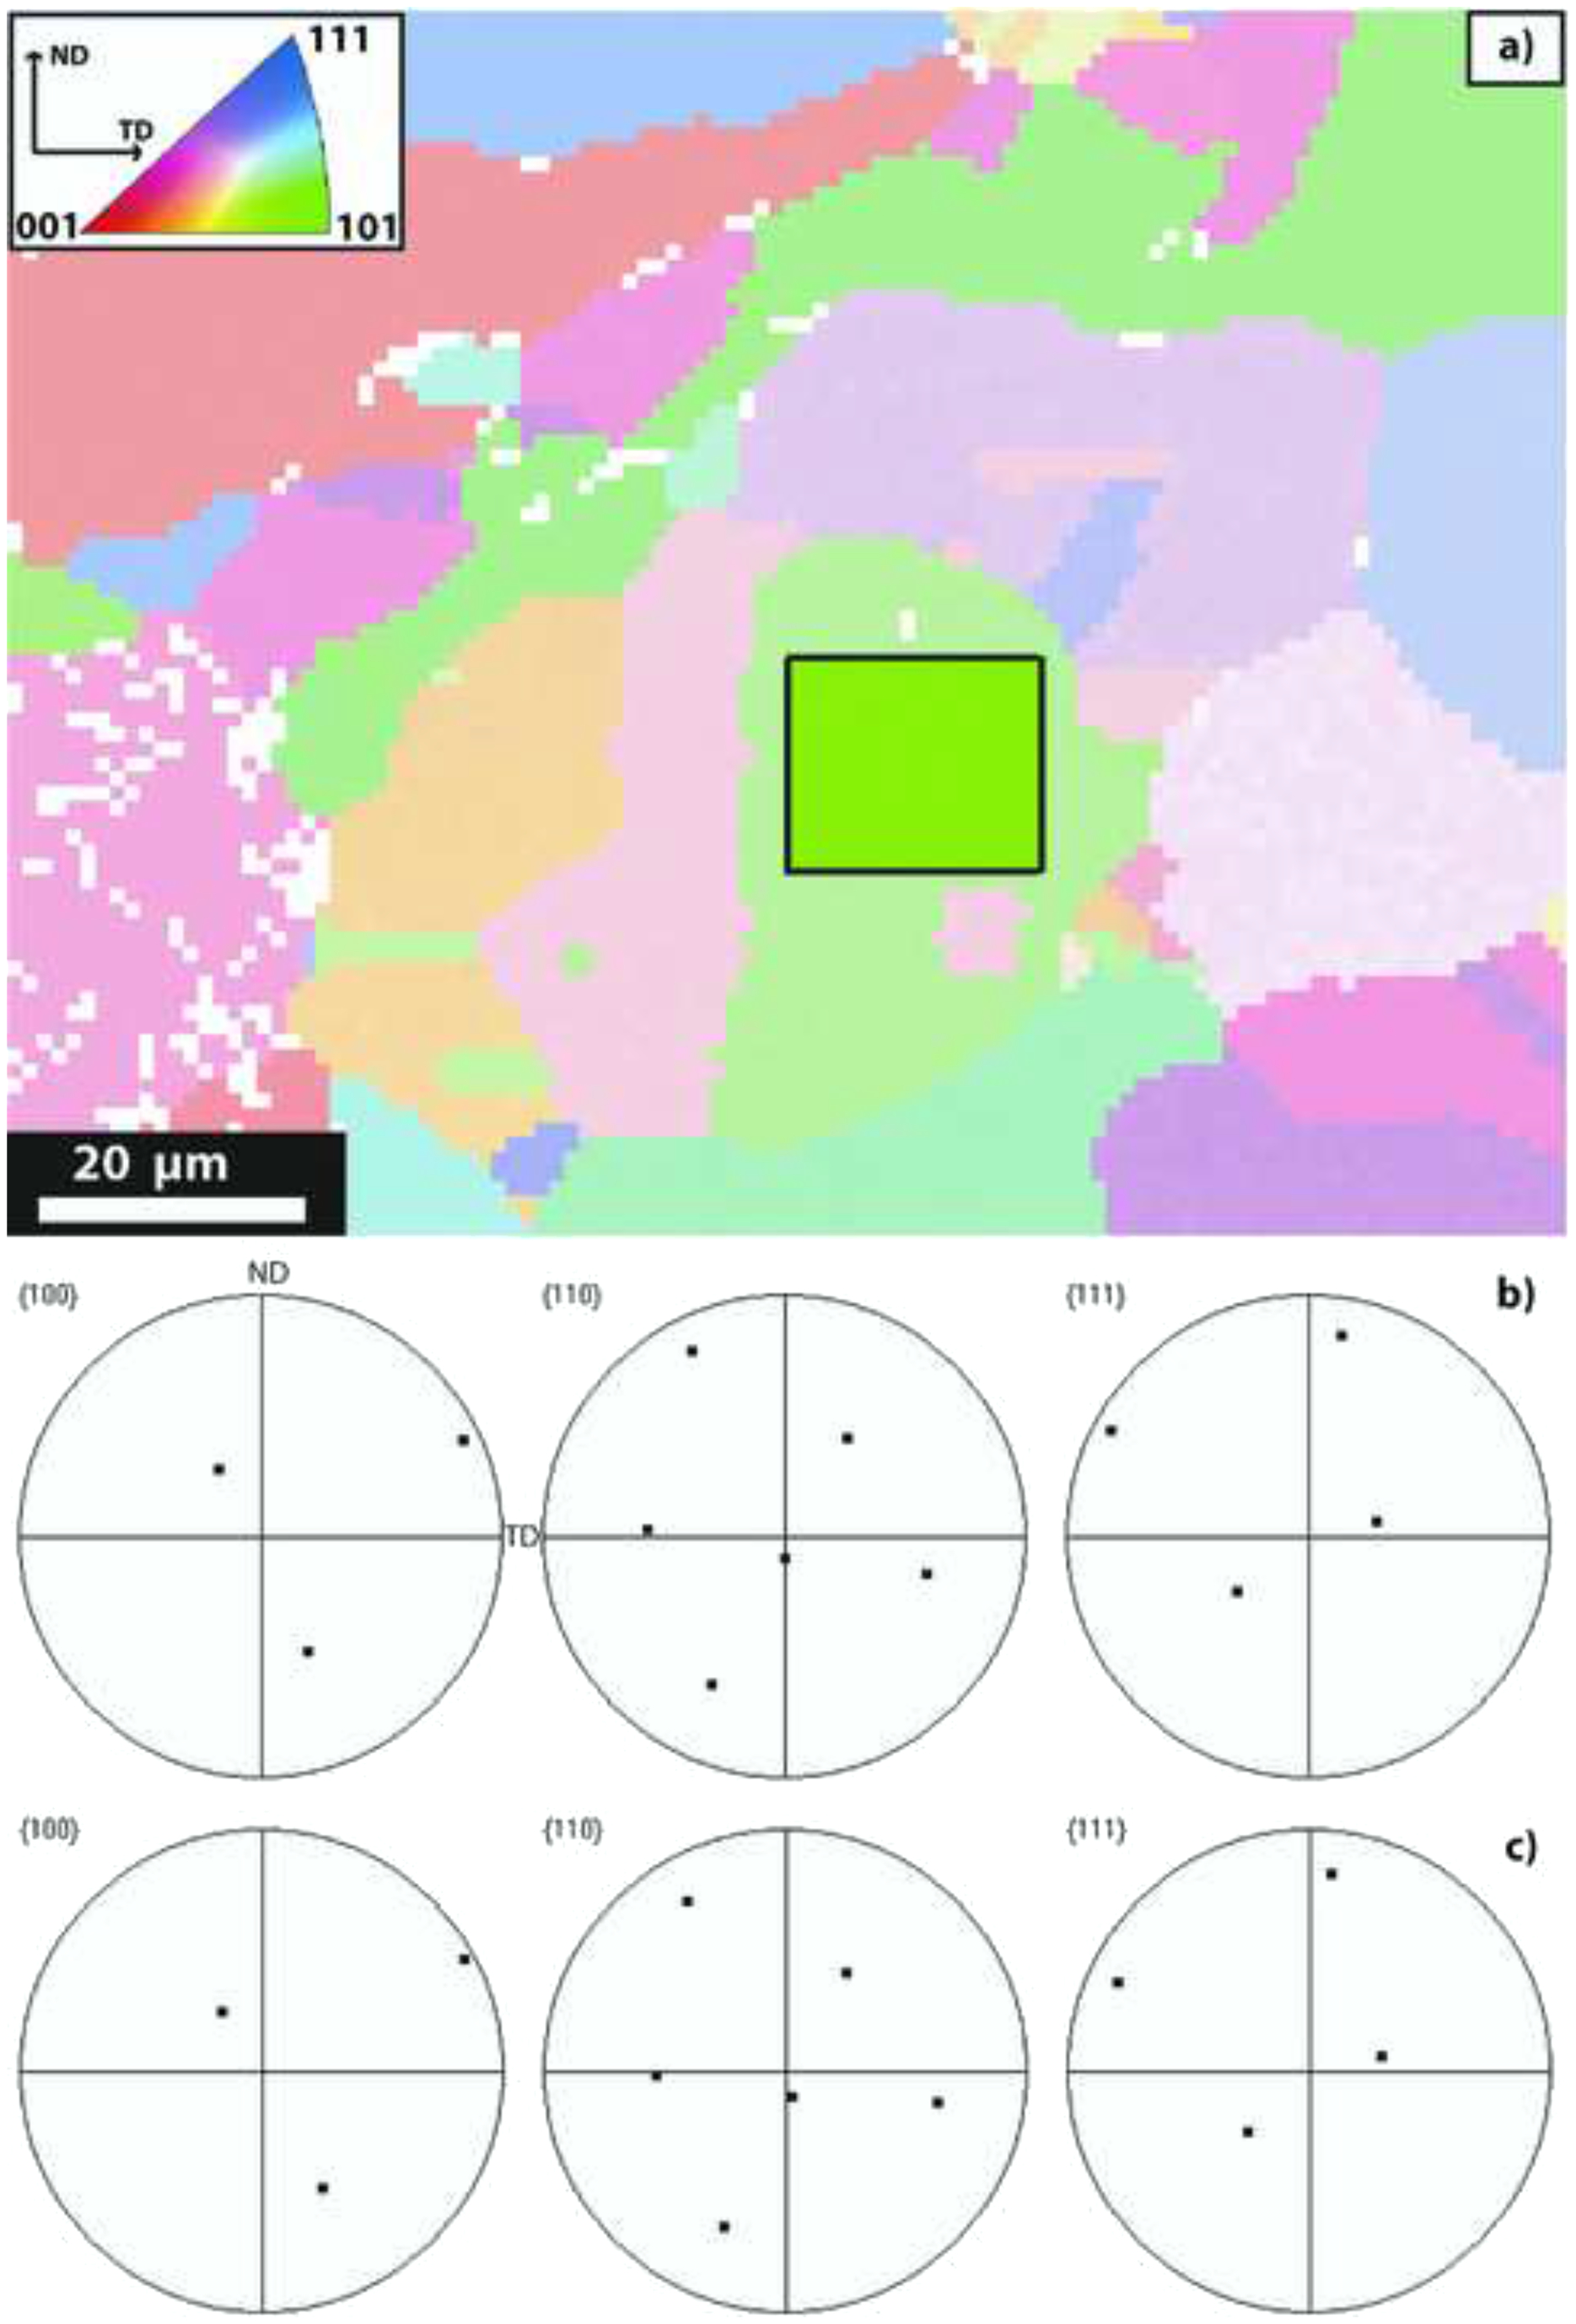
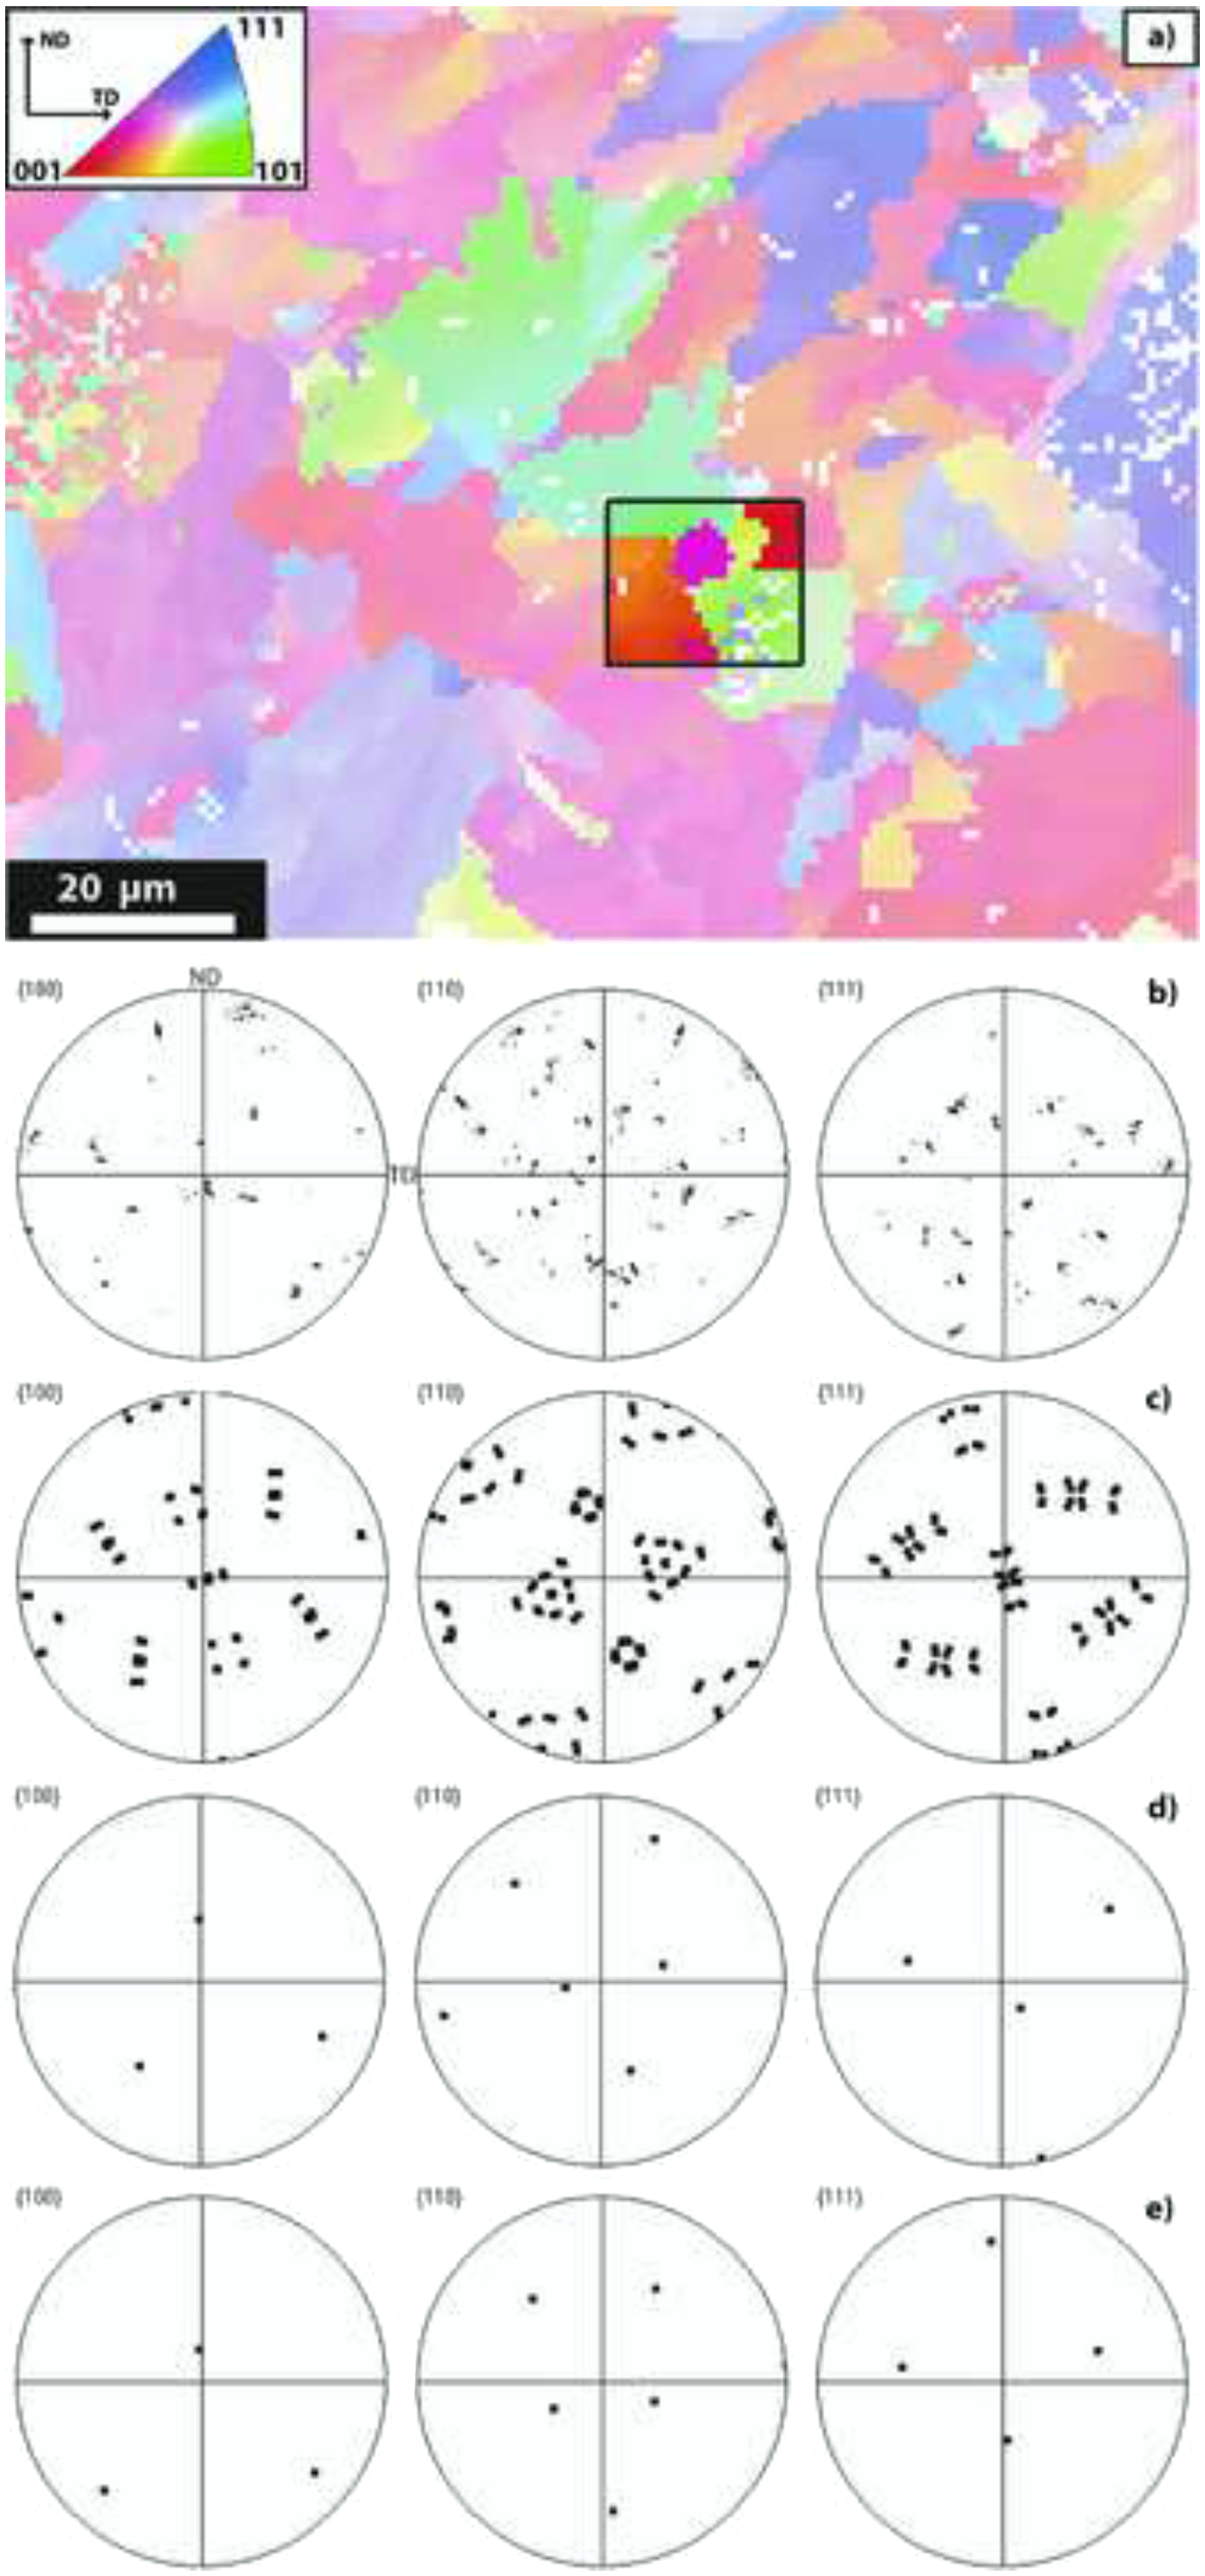
Fig. 4a and b shows an EBSD map in the fusion zone for each weld filler, both comprising acicular ferrite without any retained austenite. The highlighted region, containing material from a single prior austenite grain, was chosen for further analysis. The distribution of orientations present has been used to determine the prior austenite orientation and then the possible ferrite orientations resulting from the γ → α transformation deduced, as observed in Fig. 4c and d. The fusion zone of the CW wire matches the case where no variant selection operates and all 24 variants occur. Conversely, a 100 MPa applied compressive stress would be expected to inhibit the formation of 9 of the possible variants, leaving only 13. The pole figure thus generated for the single austenite grain does not match that observed for the CW filler. In contrast, for the fusion zone manufactured using LTT filler metal, two of the characteristic rings associated with occurrence of all 24 variants are incomplete, which matches the prediction for the case of an applied compressive stress.

EBSD inverse pole figure map with selected subset of a CW wire and b LTT weld wire; c comparison of experimentally determined {100} pole figures in the highlighted subregion of a with computed {100} pole figures following α → γ → α transformation; d same comparison as in c but considering subregion of b; Exp, experimental; Calc, calculated; 13 V, number of variants considered in computation
Therefore, one can deduce that variant selection did operate during the γ → α transformation in the LTT weld filler, whereas it does not seem to have occurred in the weld manufactured using a CW filler. Although this conclusion is qualitative in nature, it is grounded in both the local and global texture measurements. However, if larger regions are taken for study within the EBSD map, the problem becomes more complicated due to the effect of accommodation stresses with the grain and between the transforming laths.
In situ EBSD and comparison with modelling approach
In some situations, when austenite transforms to bainite, martensite, or acicular ferrite, some retained austenite is present after transformation, and so, it is possible to know the texture of prior austenite. However, in the present welds, no retained austenite was detected by EBSD. Thus, an in situ observation of texture can provide invaluable information for the validation of transformation models, and so here, such experiments on fusion zone material from the LTT weld metal were performed. At the start of the experiment, the EBSD map revealed fully ferritic initial bcc structure. Fiducial markers were used to ensure registry of the areas examined. After heating up to 1000°C and holding at this temperature, an EBSD map of austenite was collected from the same region, indicating large >30 μm austenite grains. After cooling, the final microstructure consisted of ferritic grain size of ∼20 μm.
Fig. 5a shows the in situ EBSD map for the initial condition. The highlighted region shown was chosen for analysis in Fig. 5b, and a single orientation within that region was extracted for clarity in Fig. 5c. For this single grain orientation, the Euler angles were 26.5°, 35.3° and 31.2°. On heating to 1000°C, this region transformed to a single γ grain (Fig. 6a and b). For comparison, the austenite orientation inferred 20 from the α orientation originally present in this region (Fig. 5b) is given in Fig. 6c; it is readily observed that the α → γ transformation obeyed the expected OR.
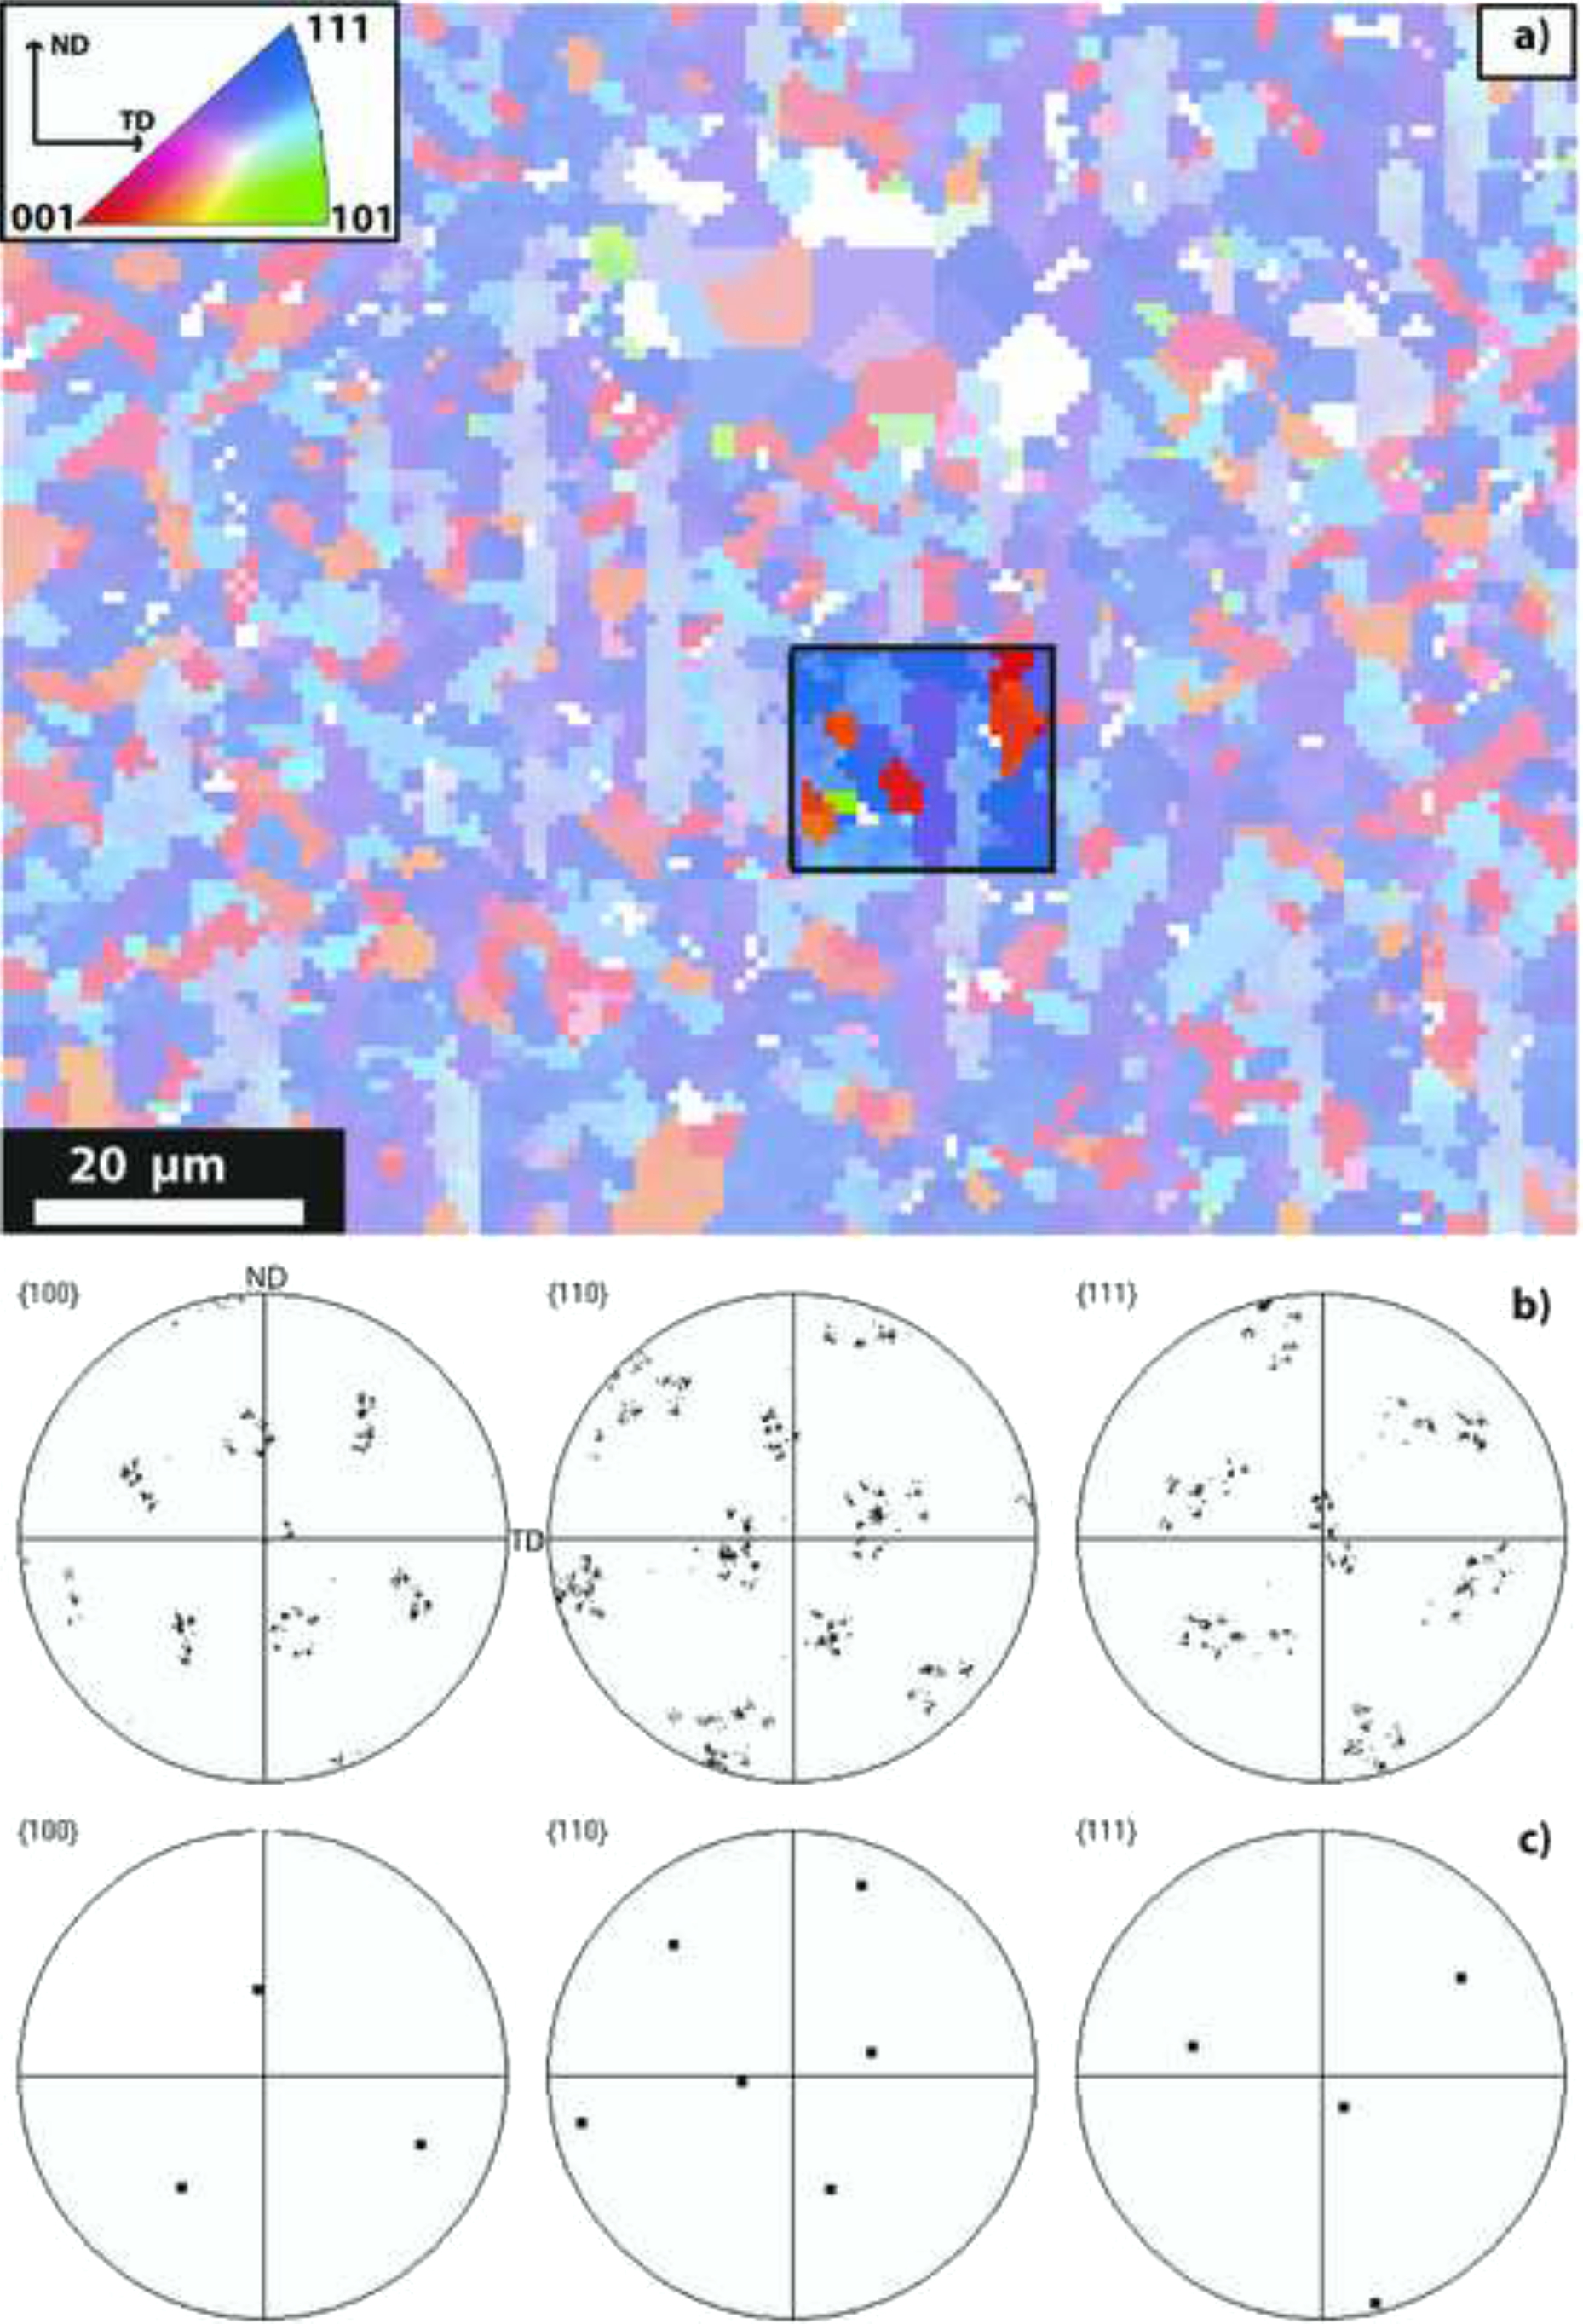
a in situ EBSD map for initial, ferritic condition, LTT weld wire; b measured orientations for highlighted subregion; c and measured orientations for single orientation within subregion
a in situ EBSD map for same region as Fig. 5, after heating to 1000°C and transformation to austenite; b measured austenite orientation for subregion highlighted (which is the same region as in Fig. 7a); c calculated pole figure from one grain within the highlighted region in Fig. 5a following α → γ transformation
The measured EBSD map after cooling the material back into the ferritic phase field under no applied load is shown in Fig. 7a and b. It is observed that many more grains exist with their {001} plane normal along the welding direction (LD) and that also some orientations have disappeared from the selected subregion, particularly those with the {001} between the LD and ND. In addition, the grain size obtained on slow cooling without load was larger, and fewer orientations are observed overall. Again, the number of orientations present is less than the 24 possible, and so, some variant selection has occurred (compare Fig. 7b and c). However, included among the orientations found is the orientation originally selected (Figs. 5c and 7d), which can readily be confirmed to be a permitted variant of the prior austenite grain (Fig. 7e).
a in situ EBSD map after cooling back to the ferritic phase field at 70°C; b measured bcc orientations in highlighted subregion (which is the same region as in Figs. 5 and 6); c calculated possible bcc orientations are shown for all 24 variants formed from initial face centred cubic (fcc) orientation shown in Fig. 6a and b; these include orientation shown in e, which is one of the orientations observed in the highlighted subregion; d after α → γ → α transformation
Therefore, thermal cycling of the material into the austenite regime and back to ferrite again results in final grain orientations that obey the expected ORs for each transformation. Thus, even where the transformation might traditionally be held to be reconstructive (α → γ), the ORs are obeyed, presumably because this involves the minimum movement of substitutional atoms. Then, on cooling (γ → α), again the ORs are obeyed although the original set of orientations are not necessarily recovered, for example, the grain with their {001} near the welding direction in Fig. 7b.
Discussion
Residual stress analysis by Murakawa et al. 32 indicates a difference between the residual stress and distortion patterns in welds manufactured using these two consumables. In both cases, the microstructure consisted of acicular ferrite. One might believe that the similarity in microstructures would give rise to similar residual stress patterns. However, the lower temperature at the onset of transformation may result in higher yield strengths, different variant selection conditions and hence textures and internal shear strains, the production of differing amount of thermal strain before transformation, and also differing transformation strains.25–28
Lischewski et al. 34 reported that the nucleation of the newly formed bcc phase during γ → α transformation takes place predominantly at triple junctions of the austenite grains. However, the present study did not confirm these observations. The nucleation appeared to occur at austenite grain boundaries. It is notable that there is a difference in grain size after the α → γ → α transformation.
Shirane et al. 40 demonstrated that a martensitic ferrite to austenite reverse transformation takes place in B containing 9% Cr steel. In contrast to this work, the LTT weld consumable used in the work present does exhibit a diffusional reverse transformation observed during in situ EBSD experiment.
Previous studies39, 41 have shown that the selection of certain crystallographic variants, whose shape deformation relieves the applied stress, can be analysed in terms of the overall Gibb's energy of the transformation, composed of its chemical (ΔGc) and mechanical (ΔGm) contributions. Where the interaction energy U (equation (5)) is a significant contributor to ΔGm and is a large fraction of the total ΔG = ΔGc+ΔGm, then variant selection can occur and contribute to the minimisation of G occurring at equilibrium. This analysis suggests that this condition is satisfied for the LTT wire, whereas it is not for the CW metal, presumably because ΔGc is smaller for the LTT wire, which is consistent with a lowered transformation temperature. Therefore, in designing a welding consumable that provides variant selection as a means of minimising residual stress and distortion, ΔGc should be minimised. Such an approach provides a simplified thermodynamic approach to welding consumable design.
Conclusions
The textures and microstructures observed in GMA welds fabricated using both a conventional ferritic weld filler metal and an LTT wire have been observed. In addition, thermal cycling through the ferrite–austenite–ferrite transformation has been performed using in situ EBSD on material from the LTT weld fusion zone. The following conclusions can be drawn.
In both cases, acicular ferrite microstructures were obtained, and in the case of the CW wire, some allotriomorphic ferrite was also observed.
The macroscopic textures observed in the two welds were quite different.
EBSD analysis of the LTT fusion zone showed evidence of variant selection consistent with an applied compressive stress in the welding direction; no such evidence was observed for the conventional welding consumable.
Cycling of the LTT fusion zone material through the austenite phase resulted in a change in the orientations observed in a small subregion, but these variants all obeyed the expected crystallographic ORs.
It is suggested that the maximisation of the mechanical contribution to the Gibbs energy of transformation and minimisation of the chemical contribution will provide a simple route to the design of welding consumables that exploit variant transformations to minimise residual stress and distortion in GMA welds. Consideration of such transformations would then need to be included in finite element models of the welding process where these are used for joint design and process optimisation.
Acknowledgements
We would like to thank Mrs Tatiana Gorkaya at RWTH Aachen University, Germany, for performing in situ EBSD maps. This research was supported by a Marie Curie Intra European Fellowship within the 7th European Community Framework and EPSRC under grant number EP/D060729/1.