
Abstract
Friction stir welding was successfully applied to joint Mg–3Al–1Zn alloy sheets. Serious strain localisation was observed during transverse tensile tests of the welds. Fracture was initiated from the interface of thermal–mechanical affected zone and stir zone in retreating side. The reasons for such localised fracture behaviour were explained by analysing the texture, Schmid factor, grain size and strain localisation characteristics in retreating side and advancing side. The results suggest that the coarser grain size and higher Schmid factor resulted in the easier activation of basal slip in retreating side than advancing side, which caused more serious strain localisation and stress concentration, and hence promoted fracture initiation from the interface of thermal–mechanical affected zone and stir zone in retreating side.
Keywords
Introduction
As one of the lightest structural materials, magnesium (Mg) alloys have promising application in aerospace and automotive industries for the purpose of weight saving. 1 However, the increasing application of Mg alloys has been hampered by the poor formability inherent to its hexagonal close packed structure. 2 Therefore, it is important to consider the weld properties of Mg alloys in order to expand their applications. Friction stir welding (FSW) is a solid state joining technology, which can avoid fusion related problems and is especially favourable for the joining of light metals, such as Mg and aluminium (Al) alloys.3–8 In previous studies, FSW has been successfully applied in several Mg alloy systems, such as AZ (Mg–Al–Zn), 9 AM (Mg–Al–Mn) 10 and ZK (Mg–Zn–Zr). 11 However, the joint strength of Mg welds is generally decreased compared to basal metal (BM). This has been related to a fracture behaviour commonly observed in Mg welds during transverse tensile deformation. Therefore, it is important to understand the underline mechanism of fracture localisation.
It is known that the microstructure and texture are varying along the transverse direction (TD) of Mg welds because of the difference in plastic deformation and frictional heat they suffered.5, 12–16 Accordingly, the Mg welds can be divided into several regions, including the crown zone (CZ), stir zone (SZ), thermal–mechanical affected zone (TMAZ) and heat affected zone (HAZ) (see Fig. 1a). In previous studies, fracture was generally observed to initiate from TMAZ/SZ interface in advancing side (AS).17, 18 The reasons have been ascribed to the drastic texture change and the easy activation of basal slip in the fracture region.19, 20 Recently, it was found that the fracture location was also dependent on the sampling design for the tensile tests. A triple junction region (close to TMAZ/SZ interface) was observed in AS but not in retreating side (RS). 21 Therefore, if the triple junction region was included in the tensile sample, it could cause strain incompatibility and promote fracture in AS. Actually, fracture location was also occasionally observed in RS in previous studies.21–26 However, the relative reason and the detail on the sampling design were not very clear.
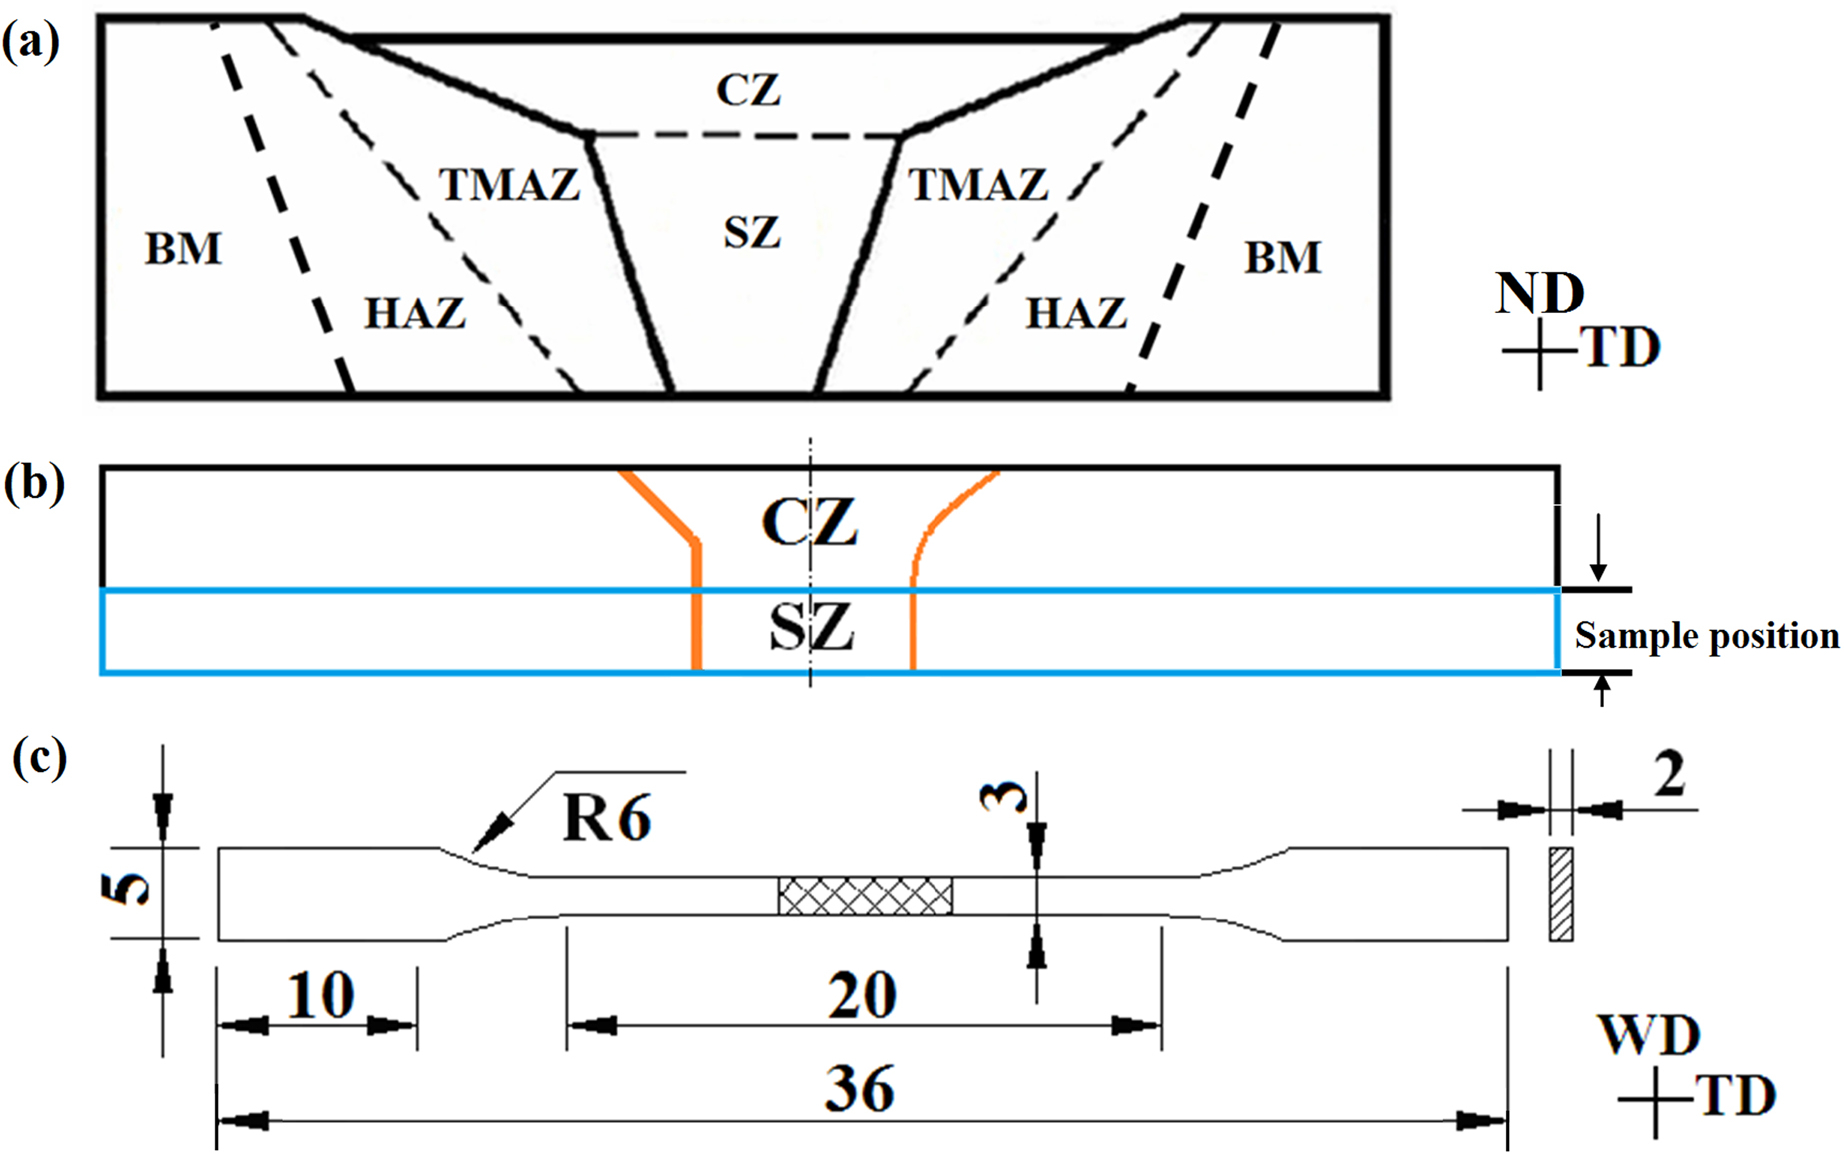
a various regions in weld; b sampling design; c dimensions of tensile samples
The present paper reports that fracture localisation was found in RS of the FSWed Mg alloys. The triple junction regions were excluded in the tensile samples to rule out their effect on fracture. The reasons for the occurrence of fracture in RS were explained by the analysis and comparison of texture, Schmid factor (SF), grain size and strain localisation characteristics in AS and RS.
Experimental
A hot rolled commercial AZ31 Mg alloy sheet (Mg–3%Al–1%Zn) with a thickness of 6 mm was joined by FSW. A cylindrical thread pin tool with a probe length of 5.7 mm, a pin diameter of 5 mm and a shoulder diameter of 15 mm was used. The welding was conducted with the tool tilt angle of 2.5° at a rotation rate of 1600 rev min− 1 and a welding speed of 600 mm min− 1. Dog bone shaped specimens with nominal gage dimensions of 20 mm × 3 mm × 2 mm were prepared for transverse tensile tests. All the tests were performed at room temperature with a strain rate of 1 × 10− 3 s− 1.
After welding, cross-section of the joint vertical to the welding direction (WD) was chosen for microstructural characterisations via optical microscope (OM) and electron backscatter diffraction (EBSD). In addition, EBSD was used to analyse the evolution of grain orientations in various regions of the joint. The EBSD detector was an HKL Channel 5 Systems equipped in a field emission gun SEM (FEI Nova 400). The specimens for OM characterisation were etched by a solution of 2 mL distilled water, 2 mL glacial acetic acid, 14 mL ethanol and 0.84 g picric acid. The specimens for EBSD analyses were polished in a commercial polishing solution AC2 at 20 V and 20°C. The EBSD step size was 1 μm. Pole figures were obtained based on an EBSD scan area of ∼150 × 150 μm2.
In the present study, samples excluding triple junction region (i.e. the region close to TMAZ, CZ and SZ interface) were employed for tensile tests along the TD (see Fig. 1b). As illustrated in Fig. 1c, the width and thickness of tensile samples are 5 and 2 mm respectively. In addition, tensile samples were cut ∼1 mm away from the bottom surface of the FSW plates to exclude unwelded layers. More than six tensile specimens were tested to get representative results. The Vickers hardness profile was measured along three lines of the transverse cross-section (0.5, 1 and 1.5 mm from bottom) on a Vickers hardness tester with a 200 gf load for 10 s.
Results and discussion
Fracture
To study the effect of FSW on the mechanical properties of AZ31 Mg alloys, tensile test specimens were cut along the TD across SZ. Figure 2a presents the stress–strain curves of the tensile test specimens. The yield strength (YS) and ultimate tensile strength (UTS) of the joint specimen are 79 and 262 MPa respectively, and the elongation is 18%. The YS and UTS of the joint specimen are lower than those of the as received plate. Similar results were also reported in other papers.20, 27 In previous studies, the strength decrease was attributed to the grains in certain region of the weld, which were favourably oriented for basal slip and extension twinning.20, 28
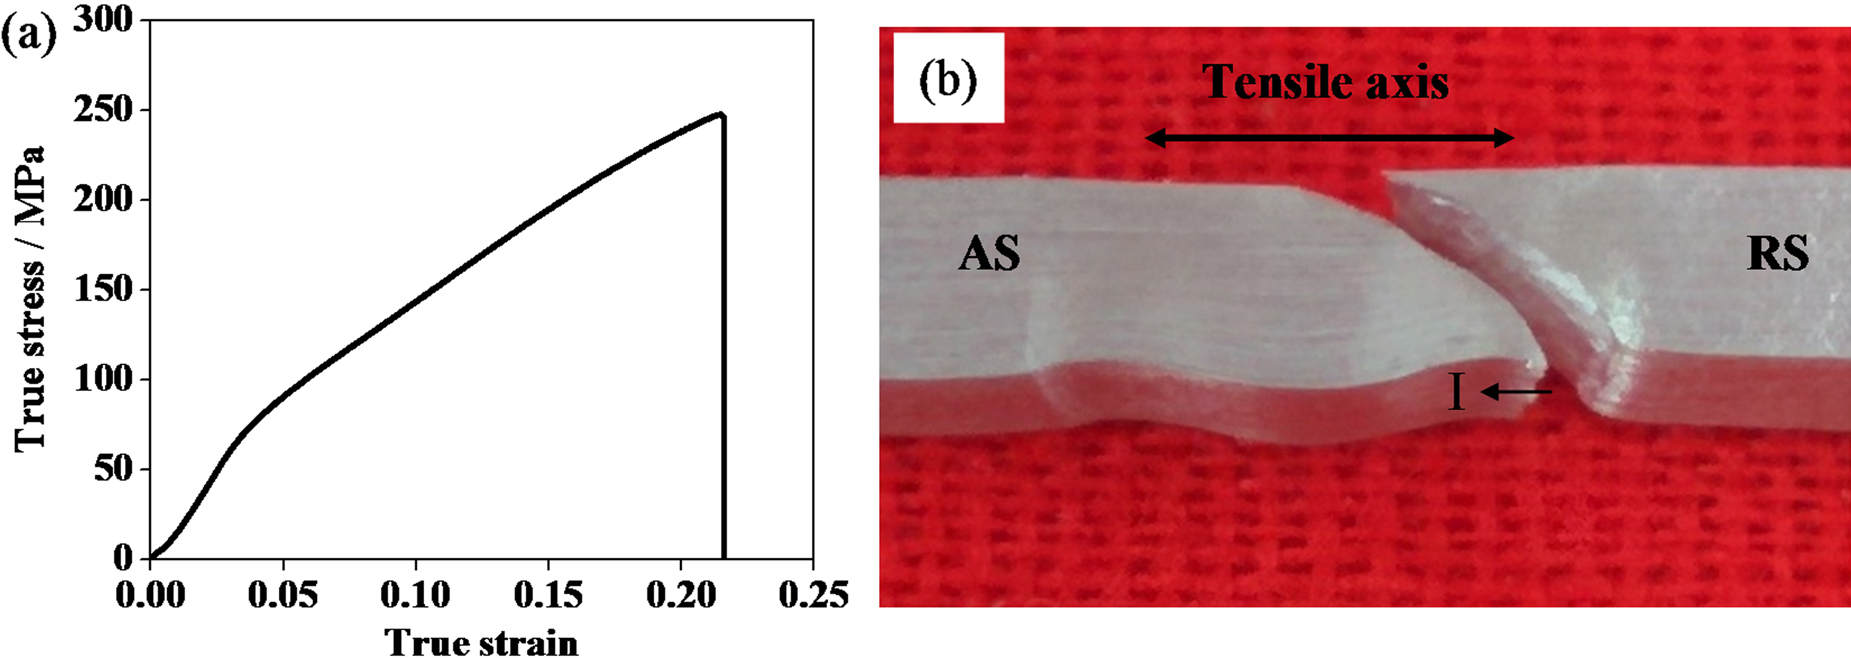
a true stress–strain curve; b fracture morphology
The macrograph of tensile fracture of the specimen is shown in Fig. 2b. It is seen that the facture position is in RS of the weld. The crack trace was inclined by 45° to the TD. It is expected that there is the maximum shear stress in this direction. It is noted that the crack at the position ‘Ⅰ’ seems to extend along TMAZ/SZ interface, which was likely to be a weak zone for fracture in the weld joint. 19 However, the crack did not completely extend along TMAZ/SZ interface but only a part of the TMAZ/SZ interface, which is in the vicinity of the normal direction (ND)–TD plane away from the WD. Moreover, the crack went through one of two neckings, which distribute in the two sides of SZ-centre, indicating the deformation is inhomogeneous through the specimen length.
In a previous study on FSWed AZ31B-H24 alloy by Afrin et al., the tensile samples mostly failed at the boundary between SZ and TMAZ in AS. 9 The failure of the samples was basically 45° shear fracture similar to the fracture characteristic observed in the present study. The localised fracture in Afrin et al.'s study has been ascribed to the formation of texture and the presence of oxides on the fracture surface as well. In addition, Liu et al. found that the microstructure and texture are very complicated in a triple junction region in AS, and whether or not the triple junction region was included in the tensile samples would affect fracture locations. 21 A further study showed that the strain localisation was more severe in the triple junction region in AS than in the other areas in SZ during transverse tensile tests, confirming the important effect of the triple junction region on fracture. 29 Note that the tensile samples in Afrin et al.'s study included both CZ and SZ, whereas in the present study CZ was excluded in the tensile samples. The sampling design difference was therefore considered as the major reason for the different fracture localisation in the two studies. In the following, the reasons why the present samples failed in RS will be discussed from the aspects of strain localisation, texture distribution and twinning/slip SFs.
Strain localisation
Severe non-uniform macroscopic plastic deformation is observed in the specimen with 17% true strain (Fig. 3a). A ‘concave–convex’ appearance appears in the weld zone. Similarly with a previous study, 29 SZ-side exhibits ‘concave’ appearance and SZ-centre exhibits ‘convex’ appearance. The obvious ‘concave–convex’ appearances are only on the A and C planes, while the ‘concave’ appearances are much less obvious on the B and D planes (Fig. 3b). These results are consistent with previous reports.29, 30 In this paper, only the ‘concave–convex’ appearances on the A and C planes were focused on.
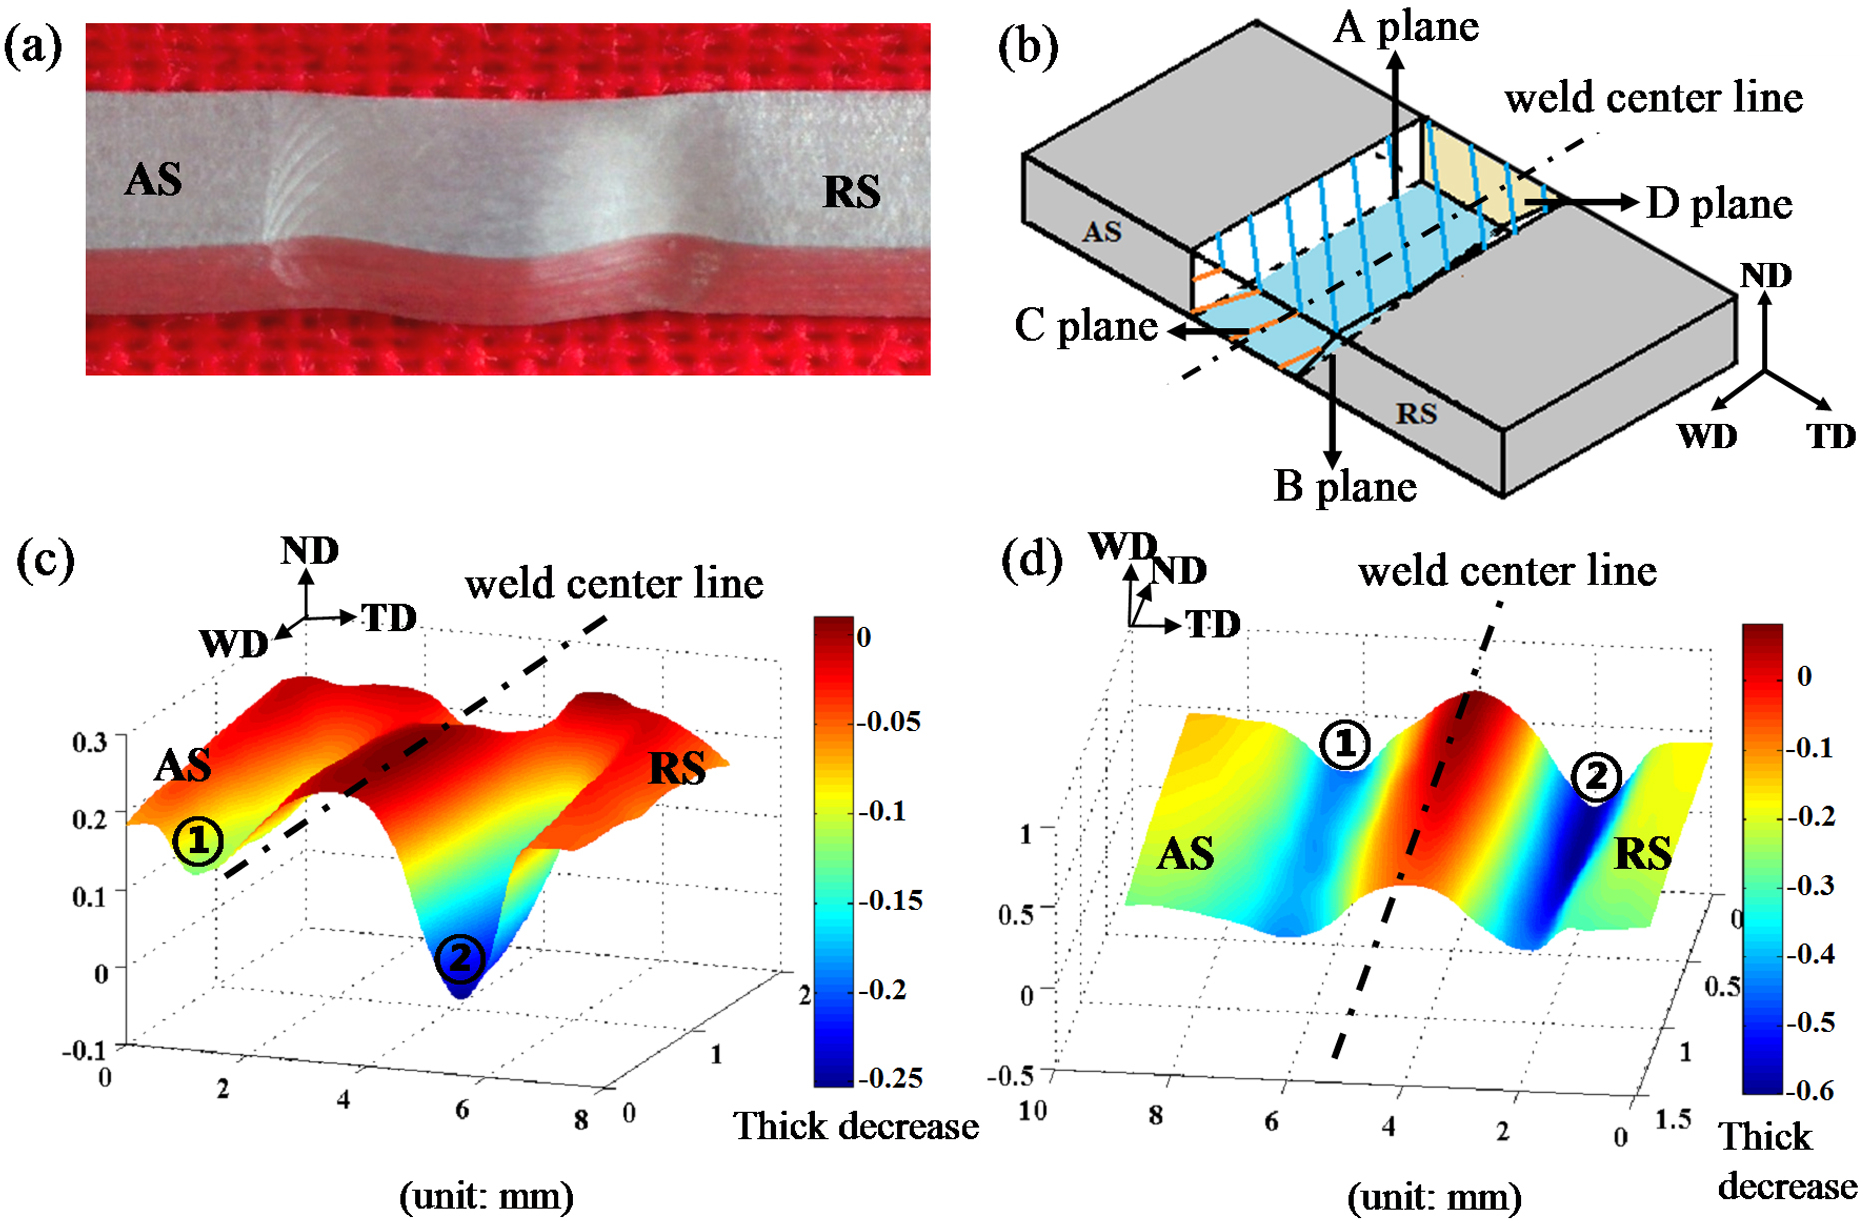
a ‘concave–convex’ appearance of specimen subjected to 17% true strain; b schematic diagram of different planes in weld; c, d three-dimensional height maps of ‘concave–convex’ appearance on A and C planes in b respectively
To quantitatively compare the non-uniform macroscopic plastic deformation, the thickness changes on the A and C planes of tensile specimen with 17% true strain were measured (Fig. 3c and d). For simplicity of comparison, the relative thickness change in BM is assumed to be zero. As shown in Fig. 3c and d, the ‘concave–convex’ appearances are described by the thickness curves of A and C planes. The ‘concave’ appearance displays the thickness decrease of necking. The locations with the maximum thickness decrease in AS and RS are indicated by the marks
 and
and
 respectively in Fig. 3c and d. The most thickness decreases were 65 and 198 μm in AS and RS respectively on the A plane, and they were 302 and 461 μm respectively on the C plane. This indicates that the necking was more serious in RS than in AS on both the A and C planes. Moreover, no obvious thickness change was noticed in SZ-centre, indicating that it was relatively hard for the tensile deformation.
Strain localisation makes the longitudinal cross-sectional area evidently smaller in the necking region, leading to higher stress concentration. Considering that the region bearing the maximum stress may be a weak zone for fracture failure, the cross-sections with the maximum thickness decrease in both AS and RS were focused on and the stresses were calculated to be ∼249 and 287 MPa respectively when the specimen was subjected to 17% true strain. To examine the effect of strain localisation on the stress distribution, the stress in SZ-centre was also calculated, which was ∼203 MPa. Clearly, the necking region in RS suffered the highest stress, which could be one important reason for the fracture in RS.
Effect of interface between TMAZ and SZ-side
The TMAZ/SZ-side interface is generally a weak region for fracture due to the drastic change of texture, grain size and deformation mode across the interface. Therefore, careful examinations were performed near the interface. Figure 4 shows the microtexture of the various regions in both AS and RS. It indicates that a significant change of basal pole orientations is present in TMAZ/SZ-side. Such texture change is of typical characteristic in the weld of FSW Mg alloys. 31 The grain orientation change in SZ-side was generally ascribed to shear related dynamic recrystallisation during FSW. It shows that the angle difference of basal pole orientations is ∼90° between TMAZ and SZ-side (Fig. 4). SF analysis indicates that the grain orientation in SZ-side is very favourable for extension twinning during transverse tensile tests, but the grain orientation in TMAZ is unfavourable, indicating that the two regions have very different deformation ability. Such plasticity incompatibility between TMAZ and SZ-side could promote fracture initiation. 19 However, the TMAZ/SZ-side interface presents similar texture transition in both AS and RS, which does not explain why fracture occurred in RS in the present samples.
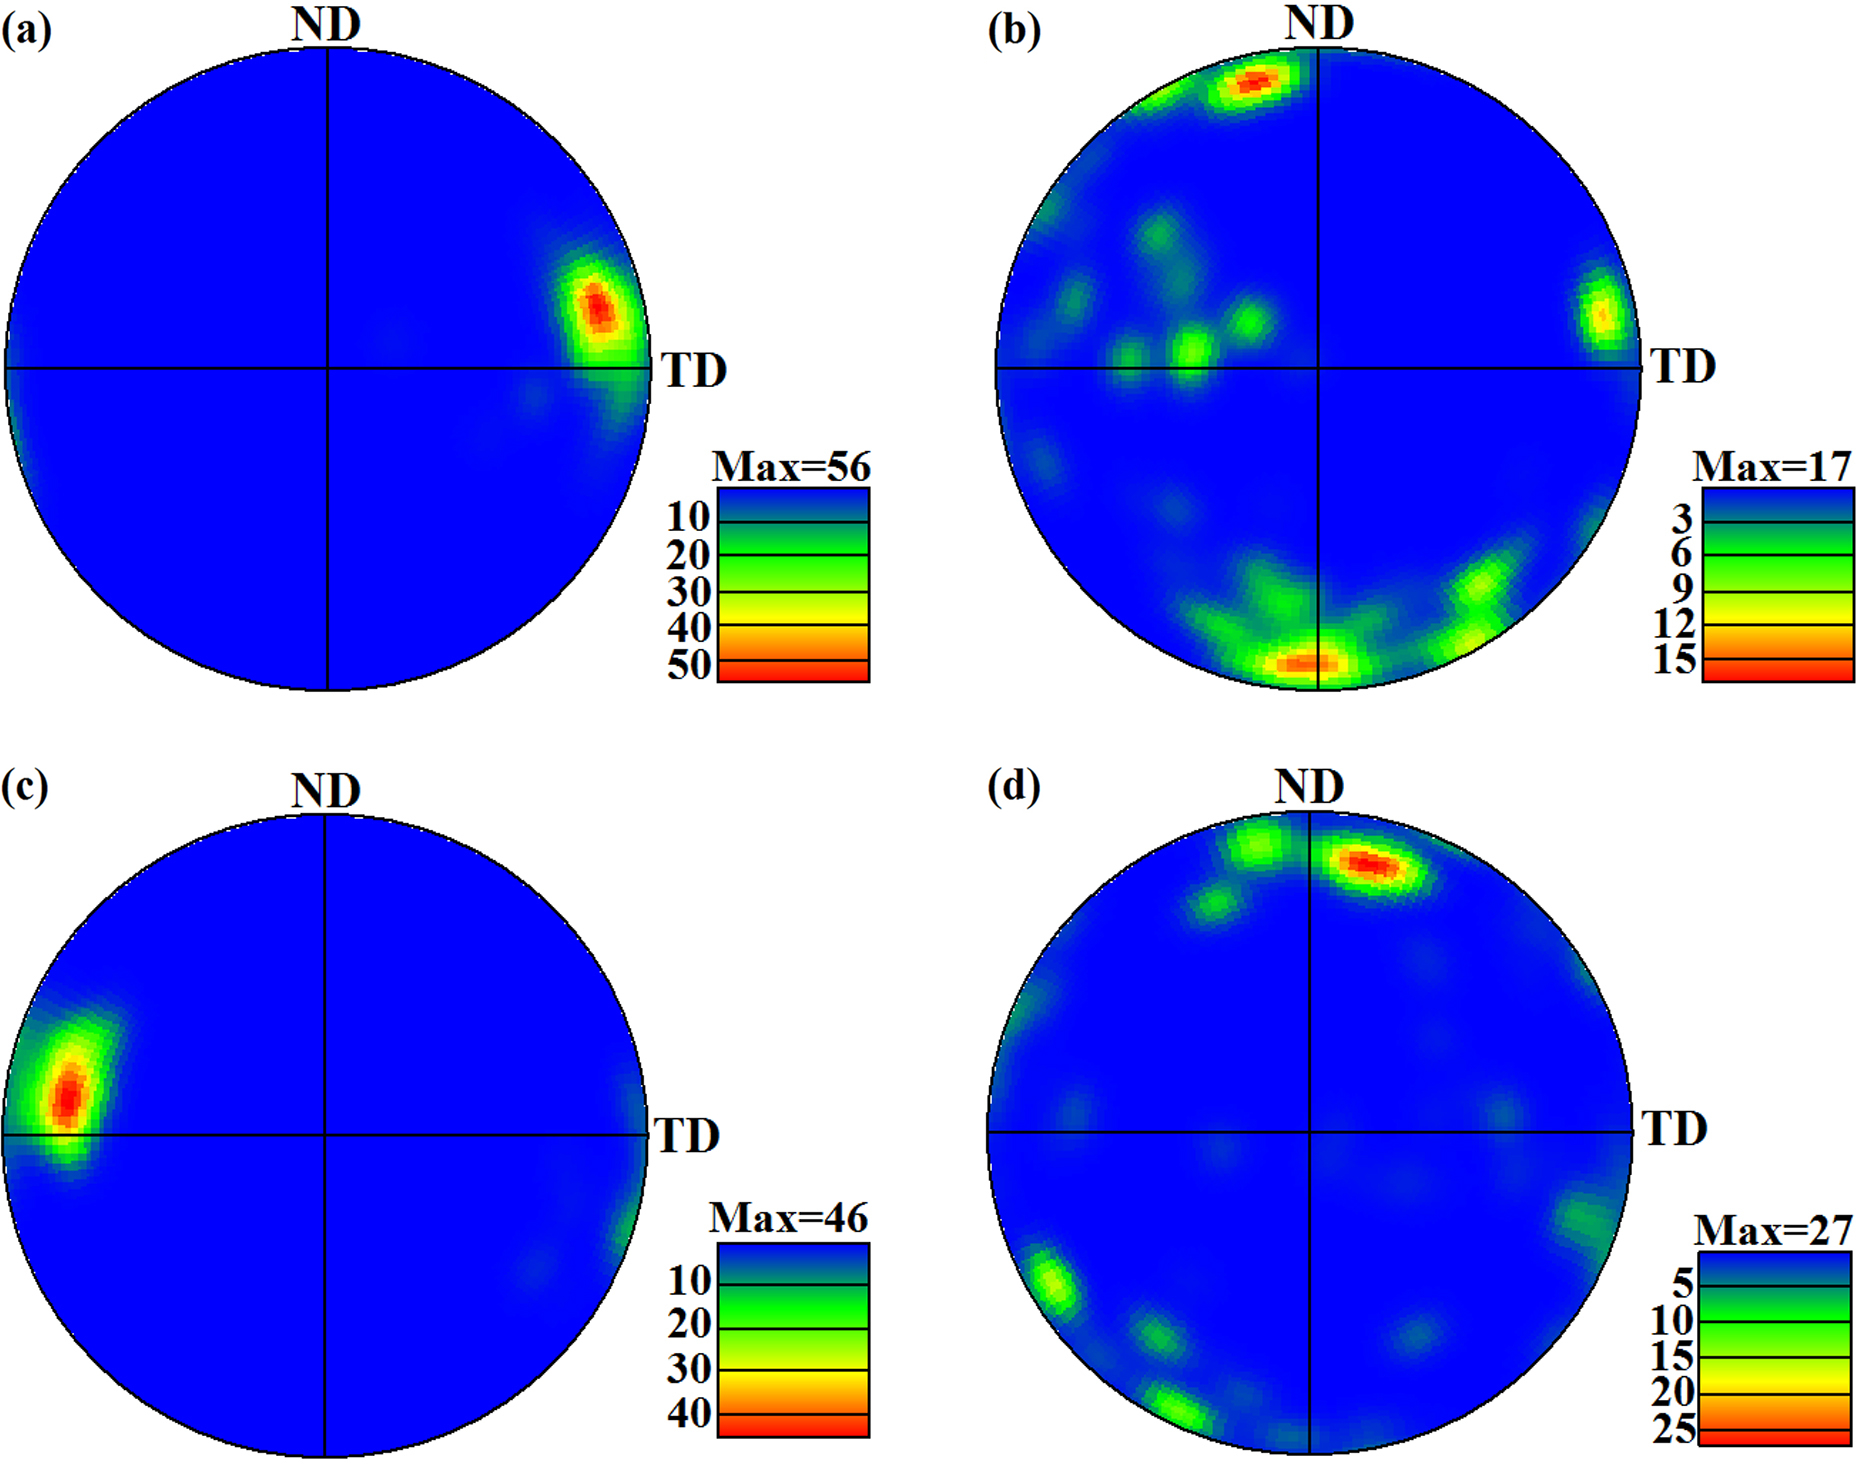
a SZ-side in AS; b TMAZ in AS; c SZ-side in RS; d TMAZ in RS
The activation tendency of basal slip and extension twinning was evaluated in SZ-side of AS and RS. It is considered that basal slip and extension twinning have comparable critical resolved shear stress for the Mg welds at room temperature. Therefore, the competition of basal slip and extension twinning in SZ-side was assessed by simply comparing their mean SF. The results are shown in Fig. 5, indicating that the mean SF for extension twinning is more than that for basal slip in the region of 0–200 μm in AS and in the region of 0–300 μm in RS. This indicates that the dominant deformation mechanism may change through SZ-side, which was considered as the reason for the fracture in SZ-side in a previous report, 28 in both AS and RS, and the region favourable for basal slip is wider in RS than in AS.
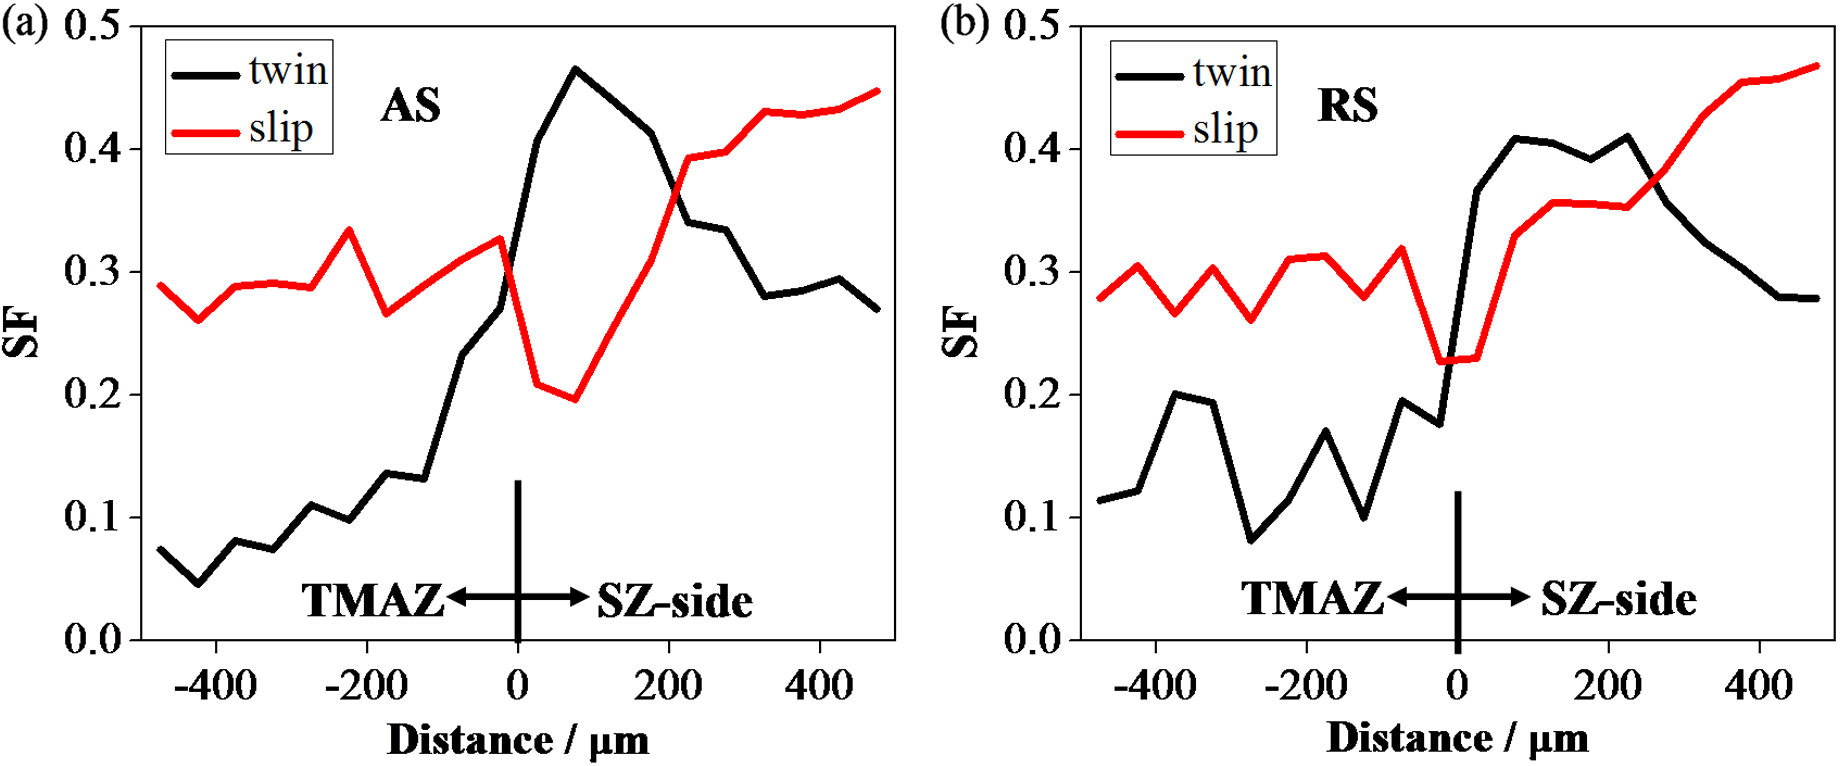
a AS; b RS
As revealed in Fig. 5, the mean SF for basal slip is higher in the region of 0–200 μm in RS than in AS, while the mean SF for extension twinning is lower. It implies that basal slip is easier in the region of RS than AS. As found before, basal slip has more effect on strain localisation than extension twinning; plastic deformation could be more severe in the region of RS than AS, leading to the largest local strain in SZ-side of RS. Moreover, Fig. 6 shows optical micrographs in SZ-side of the weld samples. The mean grain sizes are measured to be 10.3 and 15.4 μm in AS and RS respectively by linear intercept method. It is expected that the coarser grains make the activation of basal slip easier in SZ-side of RS than AS, also implying that plastic deformation could be larger in SZ-side of RS.
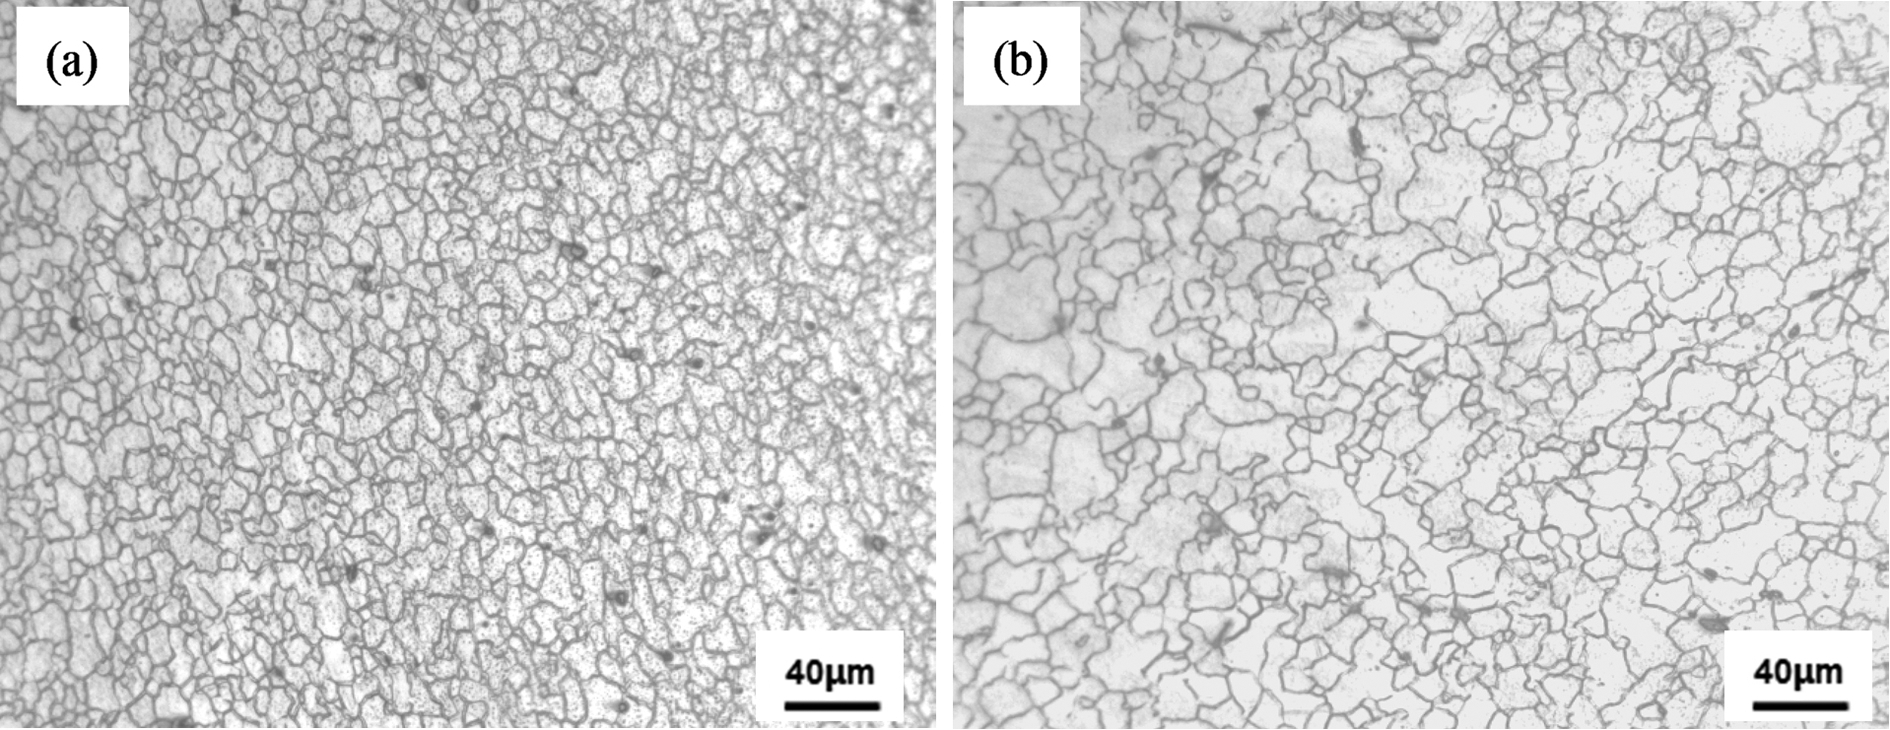
a AS; b RS
Figure 7a and b shows optical micrographs of deformed samples to ∼5% strain. Lenticular twins are found in SZ-side of both AS and RS. EBSD was also employed to examine the twin structure in the same deformed samples on the cross-section of the joint vertical to WD. As shown in Fig. 7c and d, a number of extension twin boundaries are identified, indicating that the twins that formed in SZ-side are of extension twin type. The hardness profile of the FSWed sample is presented in Fig. 8. It is seen that the hardness scatters in very regions, but a general trend is that the hardness decreases sharply with increasing the distance from SZ centre toward BM. Note that the most severe strain localisations (i.e. necking) correspond to the regions ± 2.5 mm in the hardness map. It indicates that the hardness in RS is relatively lower than that in AS, which could be one reason for the fracture initiated in RS. BM exhibits even lower hardness, but it is stronger than SZ-side during transverse tensile tests because of texture effect.
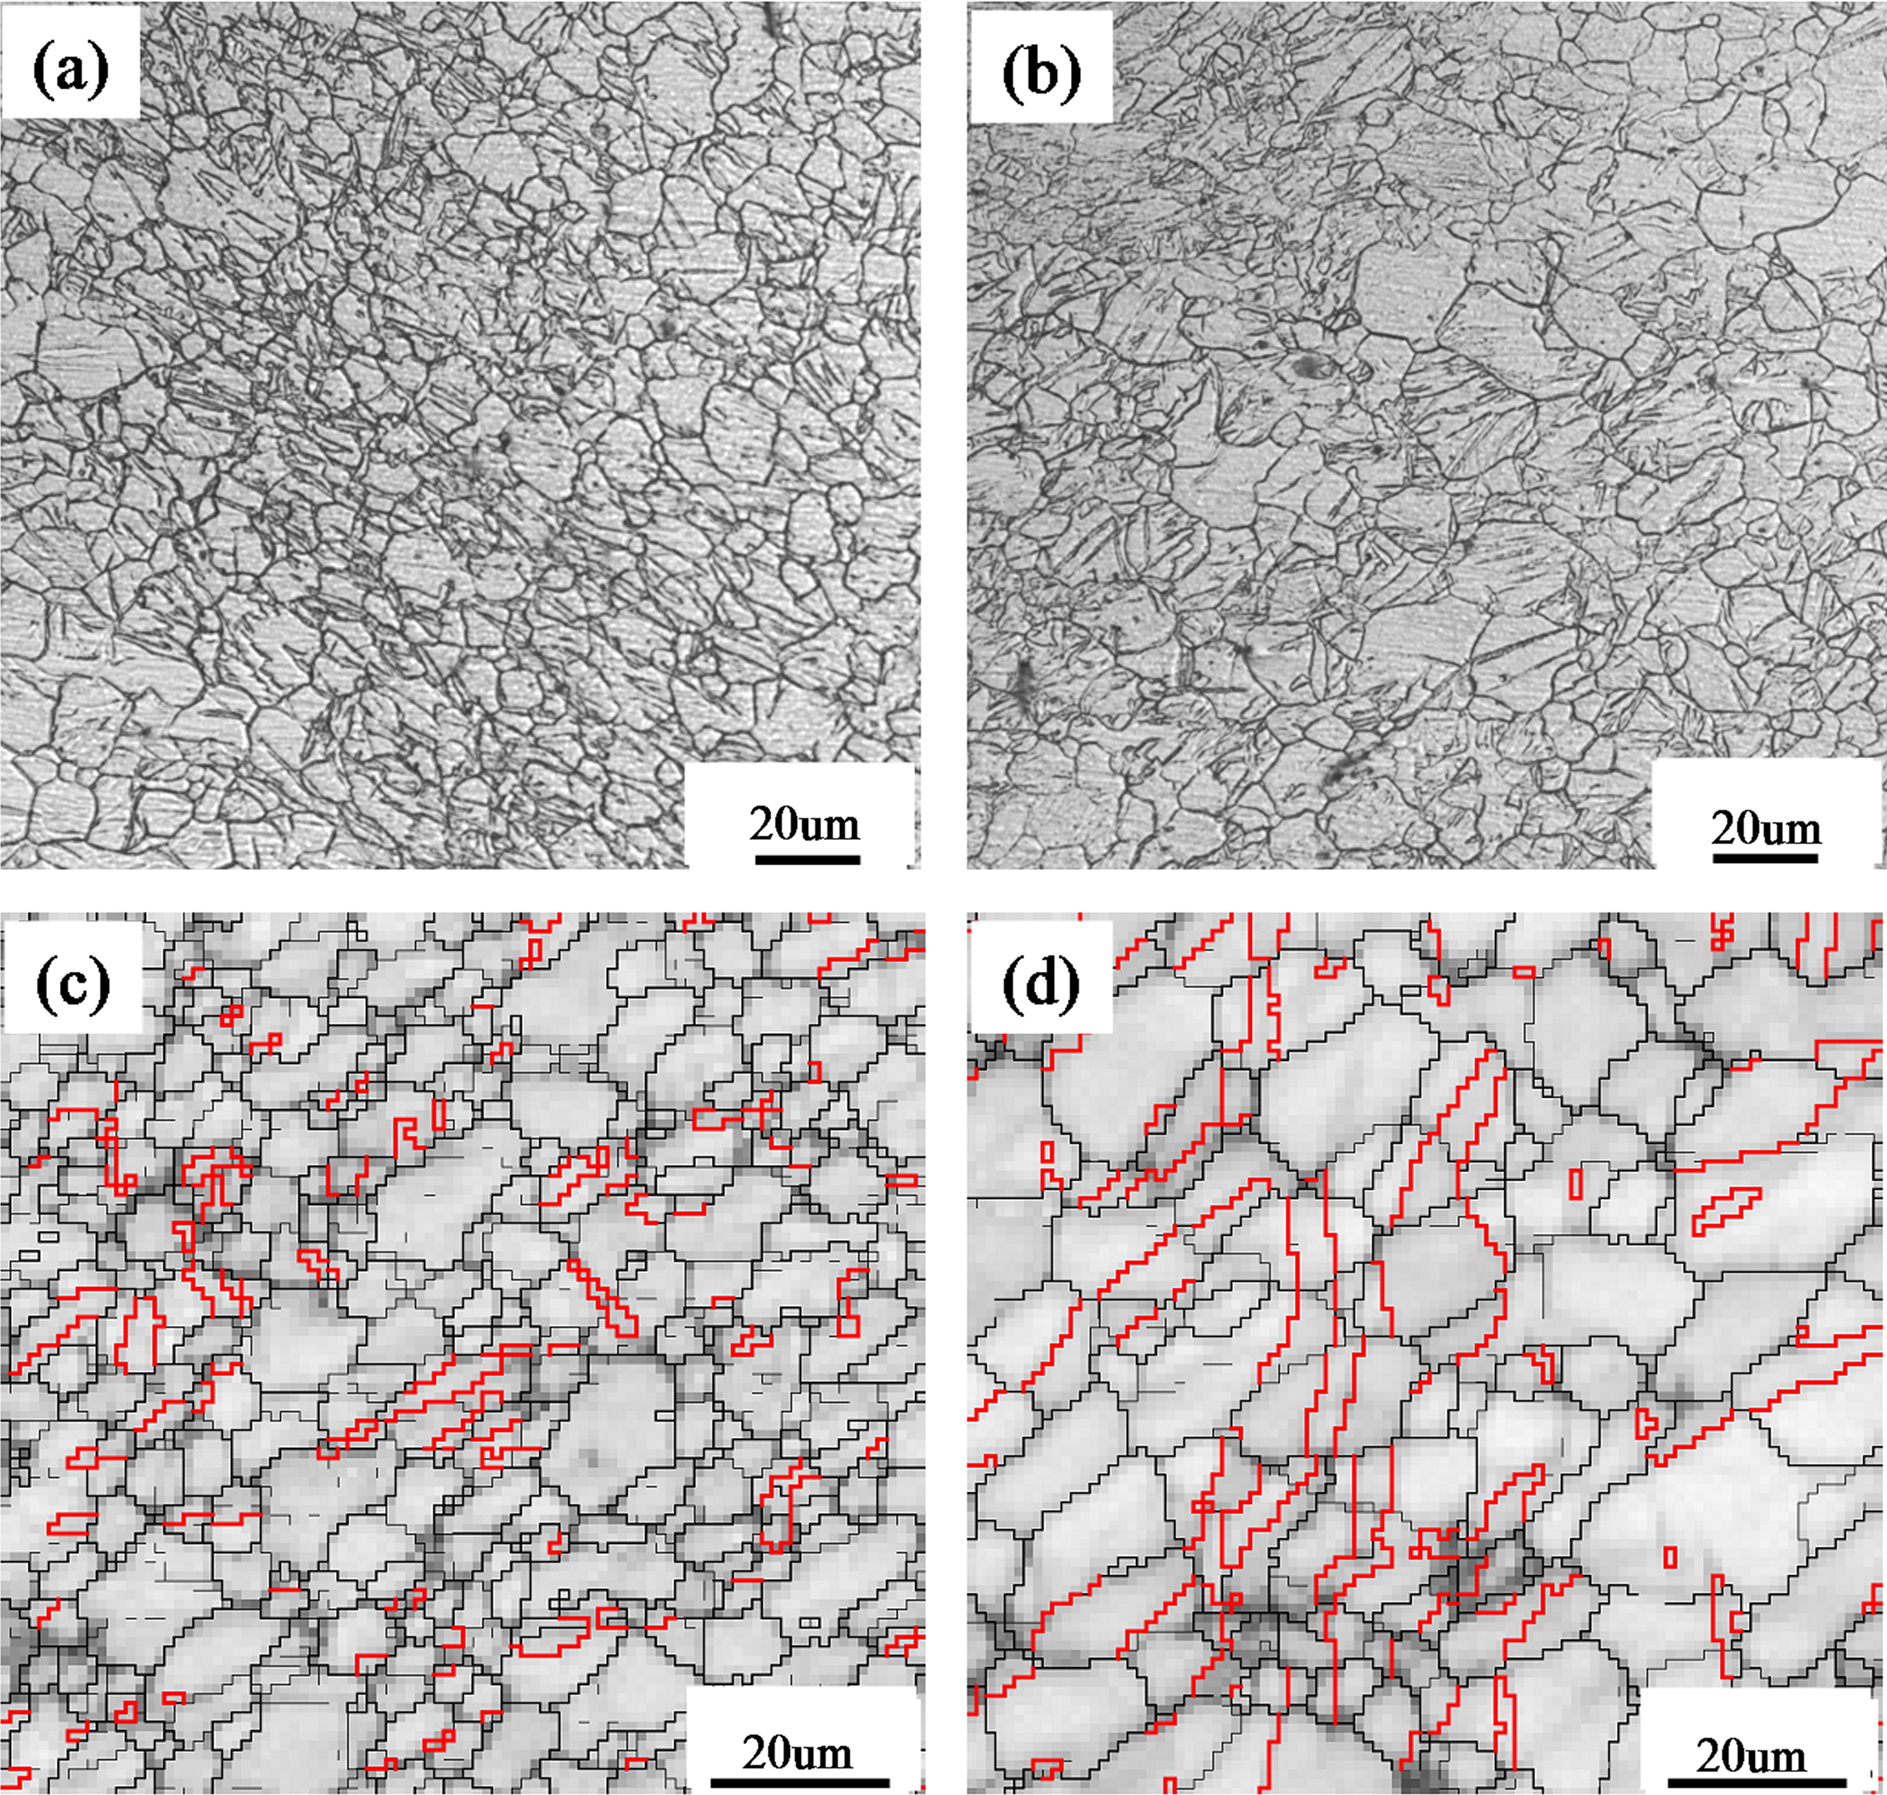
a, c AS; b, d RS
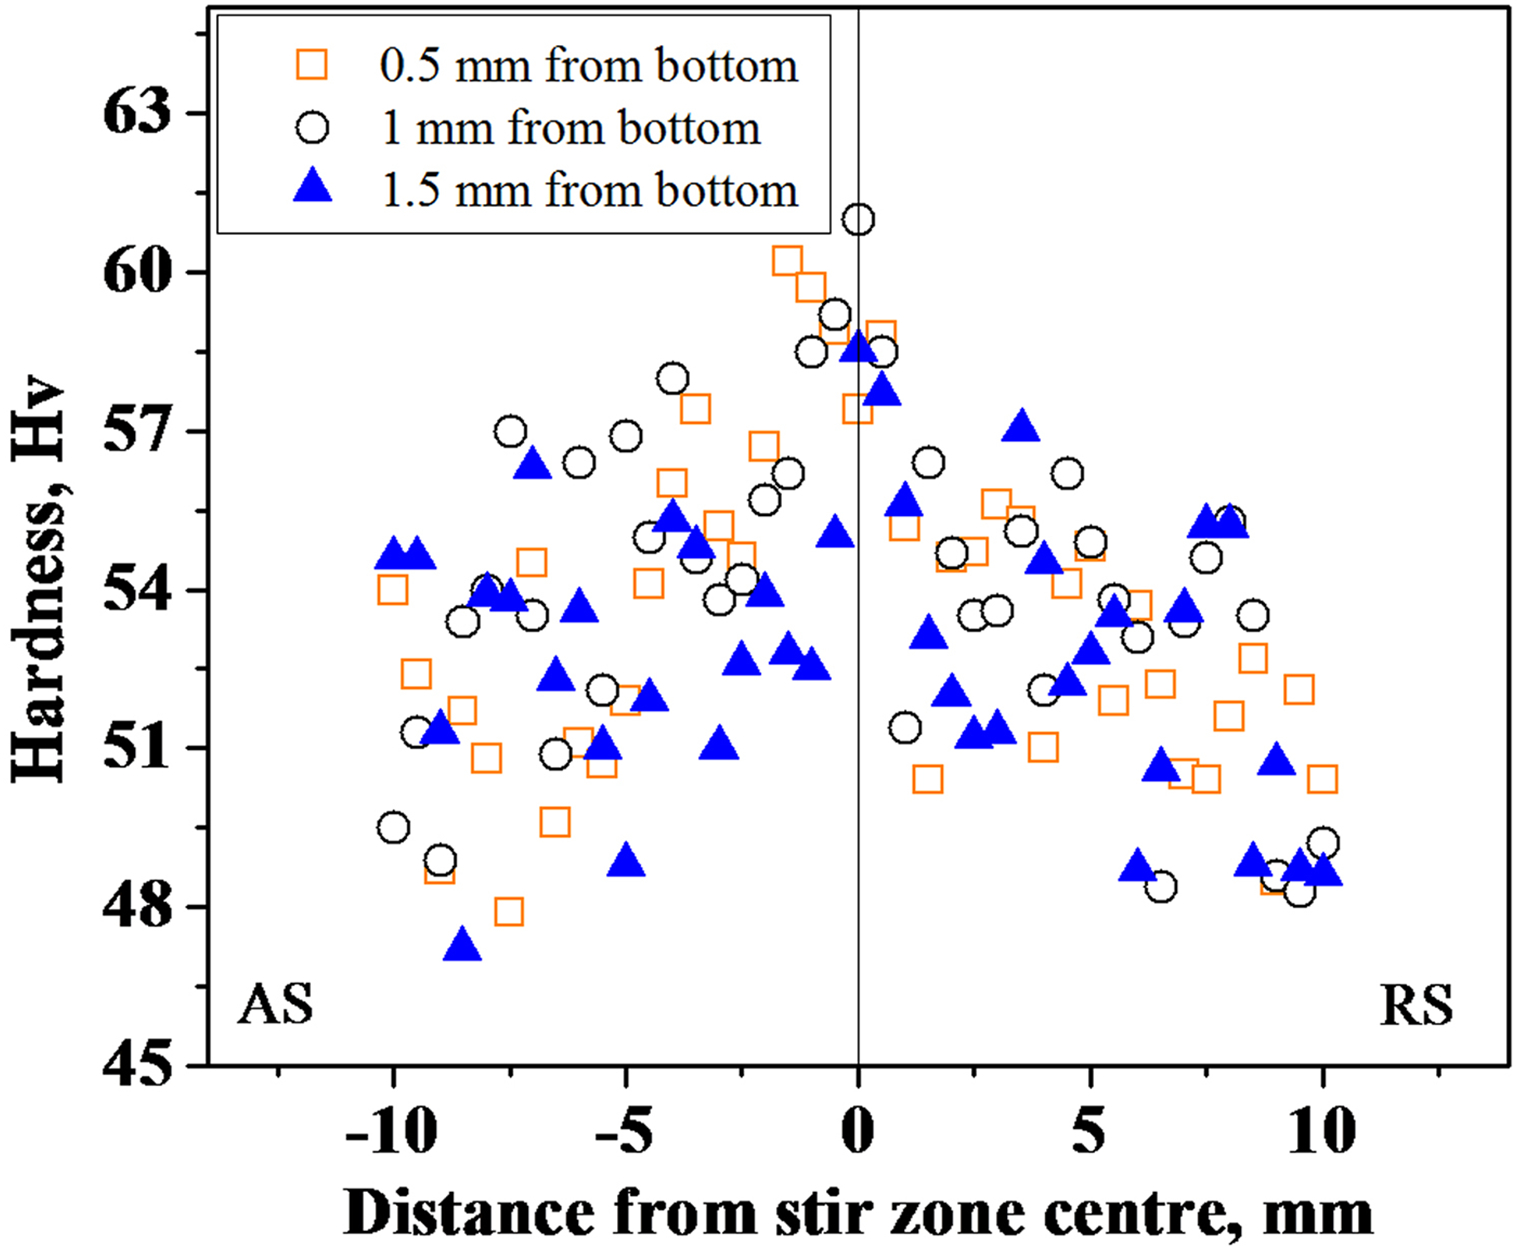
Hardness profile on transverse cross-section of FSWed sample
Effect of region of easy to activate basal slip
As discussed above, the more severe necking in SZ-side of RS than AS is likely to be the major reason for fracture in RS. To further understand the reason for the different thickness decrease between the two necking places, the height map of the C plane is shown in Fig. 9. It is clear that two locations marked as
 and
and
 on a horizontal line parallel to the TD have the maximum thickness reduction. They are measured to be 167 and 219 μm respectively in AS and RS. Figure 10a and b demonstrates that the two locations correspond to the region of easy to activate basal slip regions because most grains are orientated with the c axis tilted ∼45° from TD. This further confirms that the generation of maximum thickness decrease is ascribed to the easy activation of basal slip.
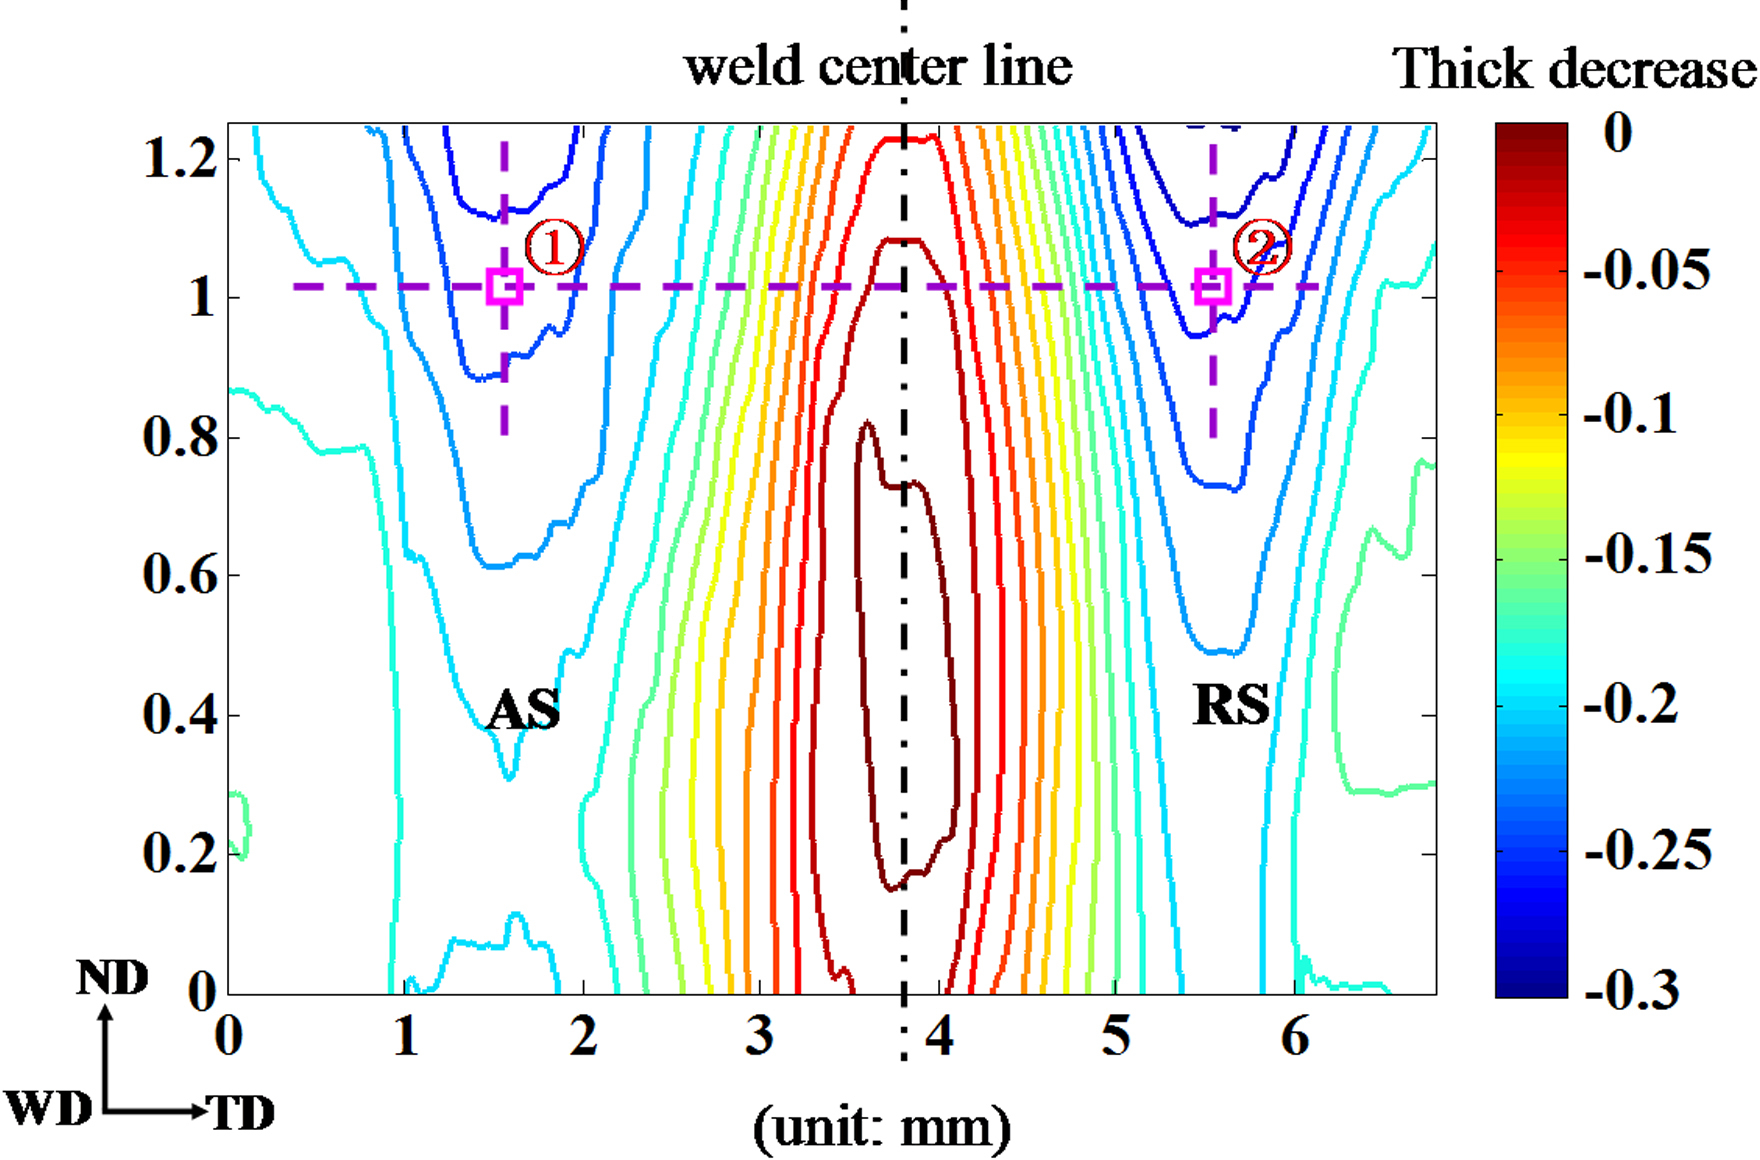
Two-dimensional height map of ‘concave–convex’ appearance on C plane (see Fig. 3b) of weld subjected to 4% true strain

{0002} pole figures of locations indicated in
and
 of Fig. 7 respectively
Based on EBSD data, the mean SFs for basal slip were calculated to be 0.44 and 0.47 in locations
 and
and
 respectively, which indicates that these two locations indeed are favourable for basal slip. Moreover, the mean SF is higher in location
 than in
 , suggesting that basal slip is slightly more likely activated in location
 . This is probably one reason for the occurrence of more plastic deformation in location
 than in
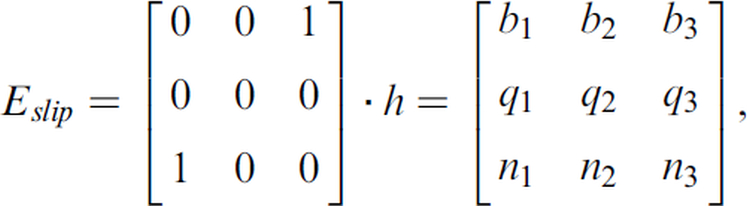
 . Furthermore, once the major basal slip system is determined based on the SF analysis, the effect of its activation on macroscopic plastic anisotropy can be estimated by calculating its strain tensor in sample reference frame via the following equation:

 and
and
 can be obtained and averaged. The results show that the average ϵWD and ϵND are -0.38 and -0.06 respectively in location
 and -0.40 and -0.07 respectively in location
 . It indicates that there should be apparent shrinkage strain in WD compared to ND, being consistent with the strain localisation feature observed on the sample. The thickness changes between the location with the maximum thickness decrease and the TMAZ/SZ interface are more intense in RS than in AS, which was observed in the upper right corner in RS and in the upper left corner in AS, as shown in Fig. 9. The rapid thickness decreases might cause more intense stress concentration at the TMAZ/SZ interface of RS than AS at the top of C plane, where the crack marked with ‘Ⅰ’ appears (see Fig. 2b).
Conclusions
Fracture occurred in the interface of TMAZ and SZ in RS of the present weld. The microstructure and texture of the weld were systematically examined. The results reveal that the occurrence of fracture in RS was due to the following reasons:
Strain localisation occurred in SZ-side in both AS and RS. However, it was more severe in RS than in AS, causing higher stress concentration.
The grains in SZ-side or the interface of TMAZ and SZ are favourably oriented for extension twinning and basal slip. However, the grains are coarser in RS than in AS in the present sample.
The mean SF for basal slip is relatively larger in RS than in AS. Therefore, basal slip more likely occurred from RS. The effect of basal slip on the macroscopic plastic anisotropy, however, was similar, being consistent with the experimental observations.
Acknowledgements
This project was financially supported by the National Basic Research Program of China (‘973’ Project) (grant no. 2013CB632200) and the National Natural Science Foundation of China (project no. 51421001).