
Abstract
Microstructure evolution and texture evolution in the weld zones during stationary shoulder friction stir welding of Ti6Al4V alloy of 7 mm thickness have been investigated by optical microscopy and electron backscatter diffraction method. A unique method was developed to differentiate the heat affected zone (HAZ) and the thermomechanically affected zone (TMAZ). The weld zones are characterised by equiaxed structure in the base material (BM), bimodal structure in the HAZ, coarse lamellar structure in the TMAZ and fine lamellar structure in the stir zone (SZ). Prismatic texture {11
 0} < 0001> and {11
 0} < 10
 0> were developed in the BM and the HAZ, the SZ is dominated by the simple shear texture component D1 (11
 )[111] and the TMAZ has intermediate shear texture D1.
Keywords
Introduction
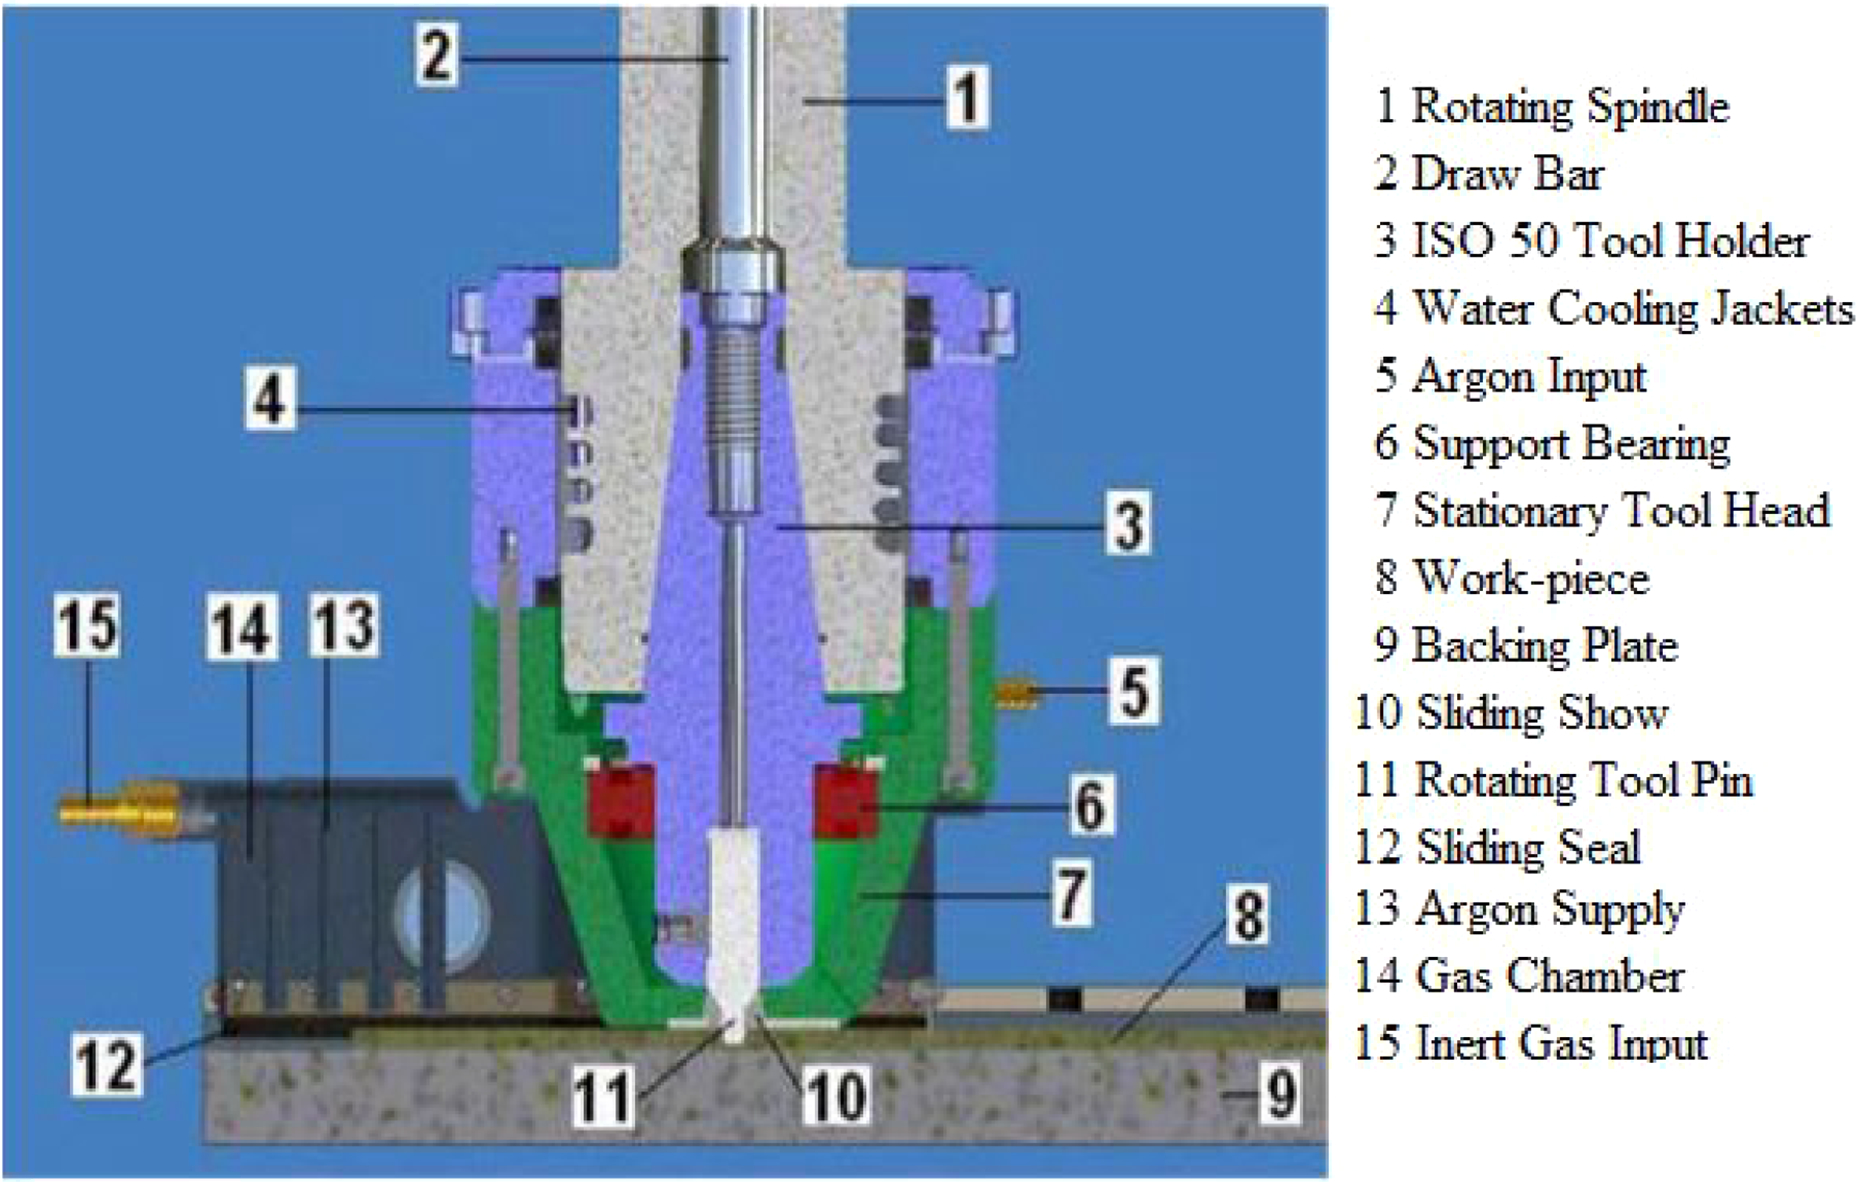
Friction stir welding (FSW) is a solid state process that eliminates some of the welding defects compared to fusion welding such as hot cracking and porosity. 1 Stationary shoulder friction stir welding (SSFSW) was developed by TWI Ltd primarily to improve the FSW of titanium based alloys.2–6 In conventional FSW of titanium alloys, most of the heat is generated at the surface/shoulder interface, and a significant temperature gradient develops through the weld thickness during welding due to the low thermal conductivity of titanium; this often leads to poor weld quality and mechanical properties. To generate a more uniform heat input through the weld, SSFSW uses a rotating pin passing through a non-rotating (stationary) shoulder. During welding, the shoulder slides over the surface of the material with the heat being solely generated by the pin. Thus, the shoulder contributes little to the heat generated during welding, enabling the process to produce a focussed heat generation around the probe, which can eliminate the problem of surface overheating and improve the process stability and repeatability. 10 Fig. 1 shows a cross-sectional view of the SSFSW head.2–3 Wynne et al. 4 found that the effect of the stationary shoulder is limited to a very thin surface layer in terms of grain size and texture.
The FSW of titanium alloys has been widely studied in recent years in terms of microstructure evolution, crystallographic texture evolution and mechanical properties in the weld zones.1–19 The typical weld zones of friction stir welded (FSWed) titanium alloys are classified into the base material (BM), the heat affected zone (HAZ), the thermomechanically affected zone (TMAZ) and the stir zone (SZ).1–4 The two characterised sides are the advancing side (AS) and the retreating side (RS).
5
The welding direction (WD) is parallel to the rolling direction of the plates. On the AS, the tool rotation has the same direction as the forward motion, while, the tool rotation opposes the forward motion on the RS.
3
A study of FSWed Ti–6Al–4V by Zhou and Liu
8
reported that the SZ has experienced peak weld temperature below the β transus temperature (Tβ), which is ∼996°C, leading to a refined bimodal microstructure due to dynamic recrystallisation. For FSWed titanium alloys, the HAZ had the lowest hardness compared to the other regions;5–6 however, Wu et al.
9
reported that the lowest hardness was found in the TMAZ, and they proposed a new grain refinement model associated with continuous dynamic recrystallisation and grooving in the TMAZ. Su et al.
10
found that the SZ has a fully β transformed microstructure consisting of typical basketweave lamellar α+β structure. Zhang et al.
11
observed a similar lamellar structure in the SZ with enhanced mechanical properties and the absence of the TMAZ due to phase transformation. The finer prior β grains and smaller α colonies in the lamellar structure of the SZ with higher tensile strength were due to the lower tool rotation speed and/or higher traverse speed.
10
However, the higher rotation speed generated the greatest tool wear, including mechanical and chemical wear, which resulted in the increase in hardness and tensile strength but a loss of ductility of the SZ.
15
A banded lamellar structure was formed in the SZ centre and extended to the AS for FSWed millanealed Ti–6Al–4V due to the diffusion tool wear of W containing tool material induced by large thermal gradients.
17
The crystallographic texture of FSWed titanium alloys has been reported to develop the body centred cubic (bcc) simple shear texture.5, 17–18 The simple shear texture components D1 (11
 )[111], D2 (

 2)[111], E1 (01
 )[111] and E2 (0
 1)[111] were present for the mill annealed Ti–6Al–4V BM.
17
The shear texture component D2 (
1)[111] were present for the mill annealed Ti–6Al–4V BM.
17
The shear texture component D2 (

 2)[111] was developed in the SZ of FSWed Ti–6Al–4V
5
and FSWed Ti-5111.
18
However, Pilchak et al.
19
found that the SZ has cube recrystallisation texture component {001} < 100> and F {110} < 001> component. The D2 (
2)[111] was developed in the SZ of FSWed Ti–6Al–4V
5
and FSWed Ti-5111.
18
However, Pilchak et al.
19
found that the SZ has cube recrystallisation texture component {001} < 100> and F {110} < 001> component. The D2 (

 2)[111] component was also observed in the equal channel angular extrusion of bcc materials and face centred cubic materials20, 21 and torsion test of α-iron and interstitial free steels.22, 23 Montheillet et al.
22
reported that the D2 (
2)[111] component was also observed in the equal channel angular extrusion of bcc materials and face centred cubic materials20, 21 and torsion test of α-iron and interstitial free steels.22, 23 Montheillet et al.
22
reported that the D2 (

 2)[111] component became dominant with increasing temperature and strain, and it remained significantly at 800°C. Baczynski and Jonas
23
observed an increase in D1 and a decrease in D2 with an increase in strain from 0.5 to 1.9, and the D2 component disappeared at a strain of ∼1.9.
2)[111] component became dominant with increasing temperature and strain, and it remained significantly at 800°C. Baczynski and Jonas
23
observed an increase in D1 and a decrease in D2 with an increase in strain from 0.5 to 1.9, and the D2 component disappeared at a strain of ∼1.9.
The objective of the present work was to investigate the microstructure and crystallographic texture evolution of the weld zones in the optimum Ti–6Al–4V weld produced by SSFSW using electron backscattered diffraction
Experimental
The SSFSW of hot rolled Ti–6Al–4V plates of 7 mm thickness were produced by TWI Technology Centre (Yorkshire) Ltd, UK. The chemical composition (in wt-%) of the as received as rolled Ti–6Al–4V plate is Ti–6.44Al–3.98V–0.14Fe–0.01C–0.006N. The stationary shoulder was made of Si3N4 with an external diameter of 17.75 mm, and the probe was a parallel tool (without any features) with 6 mm length and 9.8 mm diameter made of a tungsten–rhenium alloy (W–25%Re). One weld was chosen for this study, and it has the optimum welding parameters of 800 rev min− 1 rotation speed and 150 mm min− 1 traverse speed. The weld was made with force control mode to maintain a constant pressure on the welding tool. 5 The specimen for microstructure and EBSD analysis was prepared using standard procedures for cutting, grinding and polishing. The progressively finer grades of silicon carbide grinding paper at 800 and 1200 grit were used for grinding. After grinding, initial polishing was carried out for several minutes with 9 μm diamond suspension until a satisfactory polish was achieved. Final polishing was carried out for 10 min using a polishing cloth in a solution of 0.05 μm colloidal silco suspension. For microstructure analysis, the sample was immersed in Kroll's reagent consisting of 1 to 3 mL hydrofluoric acid, 2 to 6 mL nitric acid and 100 mL distilled water for 15 to 20 s, and the etched sample was washed in running distilled water and thoroughly dried before microscopic characterisation. The sample was ready for EBSD analysis after the final polishing procedure. 6 Microstructure analysis was undertaken using a Polyvar optical microscope. The EBSD investigations were performed using an Oxford-HKL EBSD system fitted in a Sirion microscope. The largest EBSD map was obtained using an accelerating voltage of 20 kV and a 2 μm step size with hexagonal α phase indexed. The map crossed the wed centre in the transverse direction and covered the BM of 2.06 × 0.46 mm and an area of 16.71 × 0.46 mm from the HAZ on the RS to the HAZ on the AS.
Figure 2 shows a scanned cross-section of the weld with superimposed three orthogonal directions: normal direction (ND), traverse direction (TD) and WD. We can identify that typical weld zones of SSFSWed titanium alloys are similar to that produced by the conventional FSW method, and the black arrows in Fig. 2 point these weld zones. Blue enclosed rectangles indicate the different regions of the weld zones, and they are the BM, the HAZ on the RS, the TMAZ on the RS, the SZ centre, the TMAZ on the AS and the HAZ on the AS respectively.
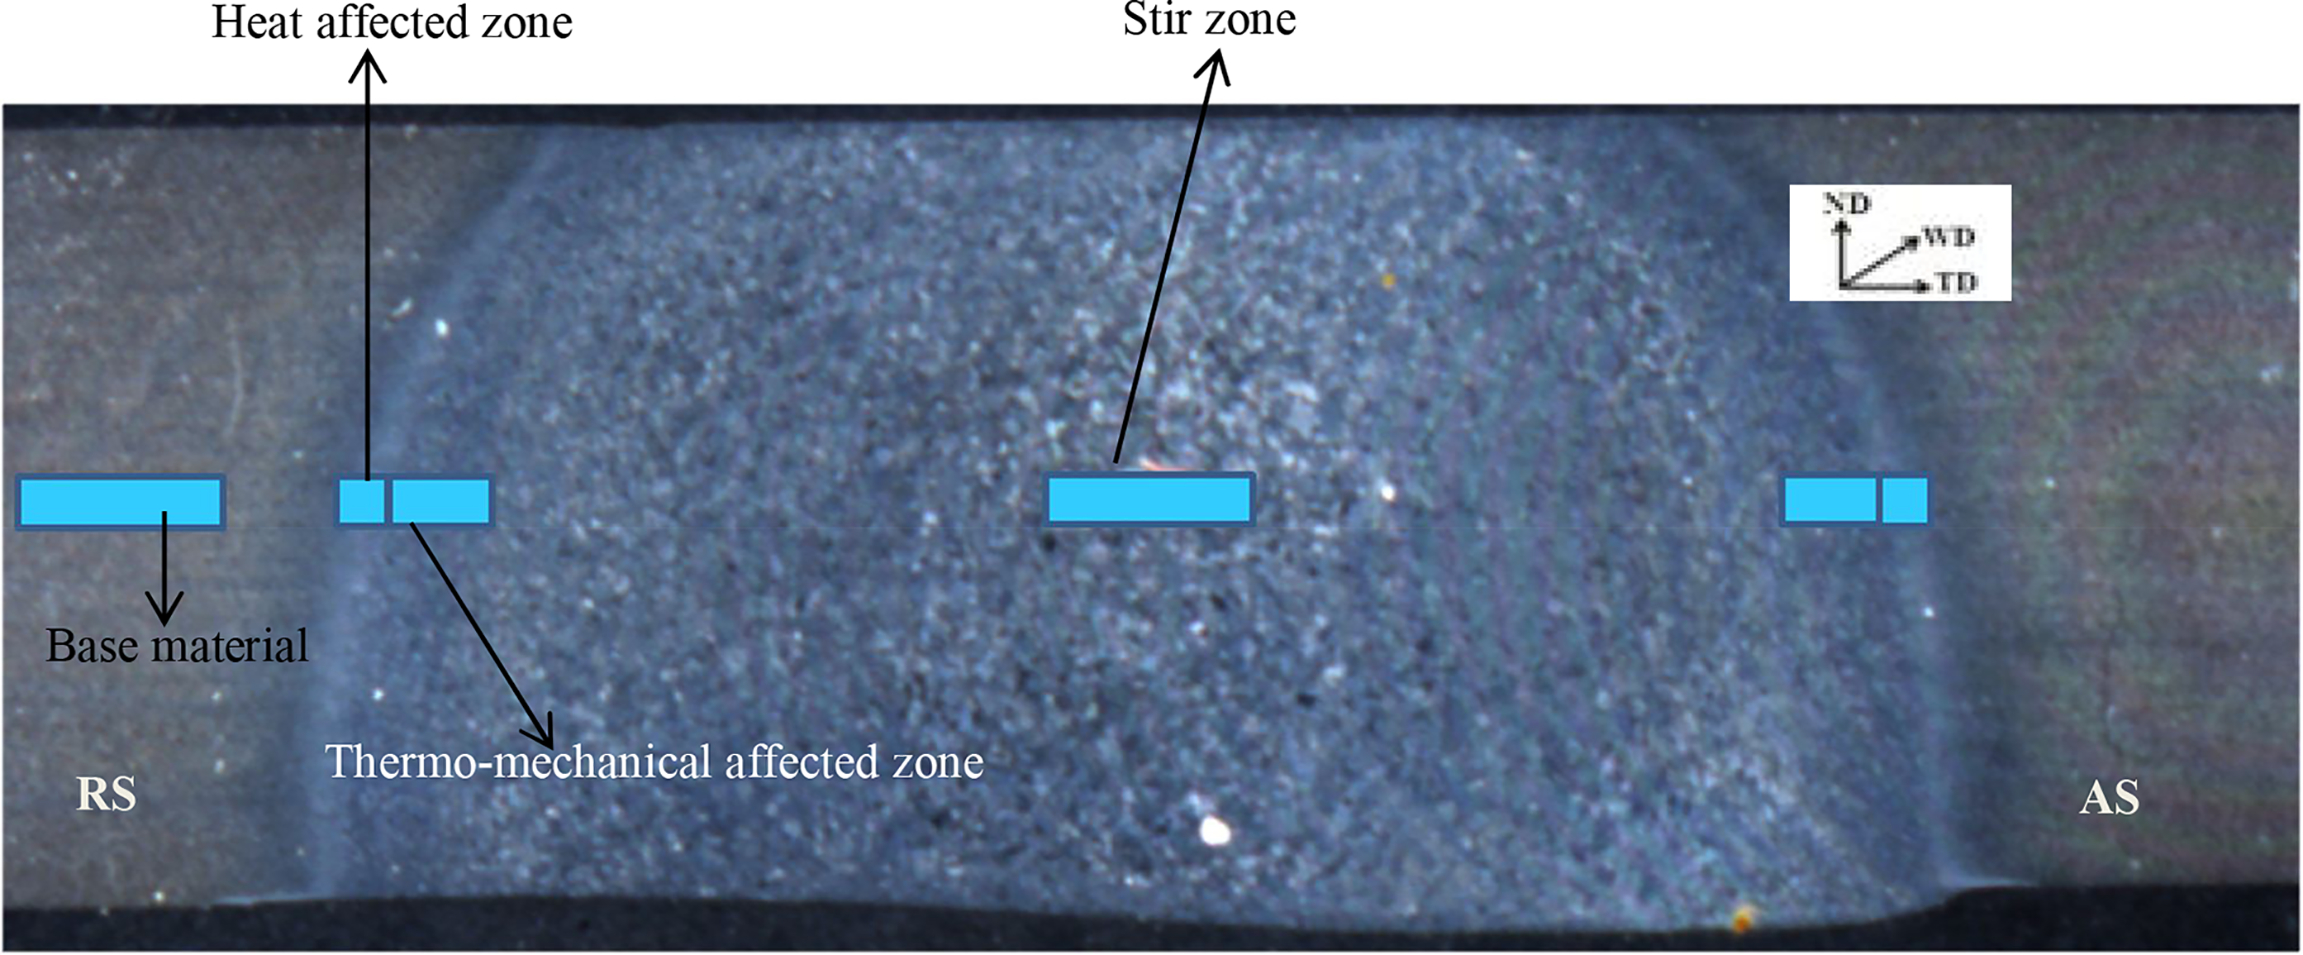
Scanned image of whole weld joint of Ti6Al4V with superimposed welding axes: ND, TD and WD; RS: retreating side; AS: advancing side
Results and discussions
Method to define HAZ and TMAZ
A unique method was developed in this work to differentiate the HAZ and TMAZ. Crystallographic texture evolution in FSW of Ti–6Al–4V has been shown to follow simple shear of bcc materials, and textures are usually presented by the pole Figs. (PFs).5, 17–18 Note that the axes for the micrographs and the PFs are not the same; to correlate the welding axes with the shear axes generated by the shearing action of the probe and to best illustrate the textures, ND was put in the centre of the PF, TD at the right and WD at the bottom. 28 The shear direction is thus parallel to the TD tangent to the tool probe, and the shear plane normal is perpendicular to the shear direction.
Figure 3a is an inverse PF colouring (IPF) map taken from the RS of the welding edge using 1 μm step size; for convenience, the map has been divided into four zones, corresponding to equiaxed structure (A+B), bimodal structure (C) and fully transformed lamellar structure (D). The α phase (hcp) texture and retained β phase (bcc) texture are represented by the {0001} PFs and {110} PFs respectively, as shown in Fig. 3b and c. The welding axes for the IPF map, IPF colour key and PF density bars are shown at the bottom of the figures. It is clearly seen that the α phase texture starts to change at the bimodal structure (C), while the β phase texture of the bimodal structure retains the same as the BM (A+B). This would suggest that in sections A, B and C the material has not been deformed because the β texture remains the same as the BM (A+B) and the material in section C constitutes the HAZ. Both α and β textures of section D have changed, indicating that the material has undergone deformation, and thus, they must be part of the TMAZ. The IPF map taken from the AS of the welding edge using 0.5 μm step size (see Fig. 4a) was divided into three zones: fully transformed lamellar structure (A), bimodal structure (B), equiaxed structure (C), {0001} PFs of the α phase texture and {110} PFs of retained β phase texture are shown in Fig. 4b and c respectively. The welding axes for the IPF map, IPF colour key and PF density bars are shown at the bottom of the figures. It is clearly seen that in section B, the α phase texture starts to change, while the β phase texture of the bimodal structure retains the same as the BM (section C). This meant that in sections B and C the material has not been deformed because the β texture remains the same; thus, section B must be the HAZ. Both α and β textures of section A have changed, indicating that the material has undergone deformation, and thus, they must be part of the TMAZ. Therefore, it can be concluded that the HAZ has a bimodal structure while the TMAZ has a fully lamellar structure.
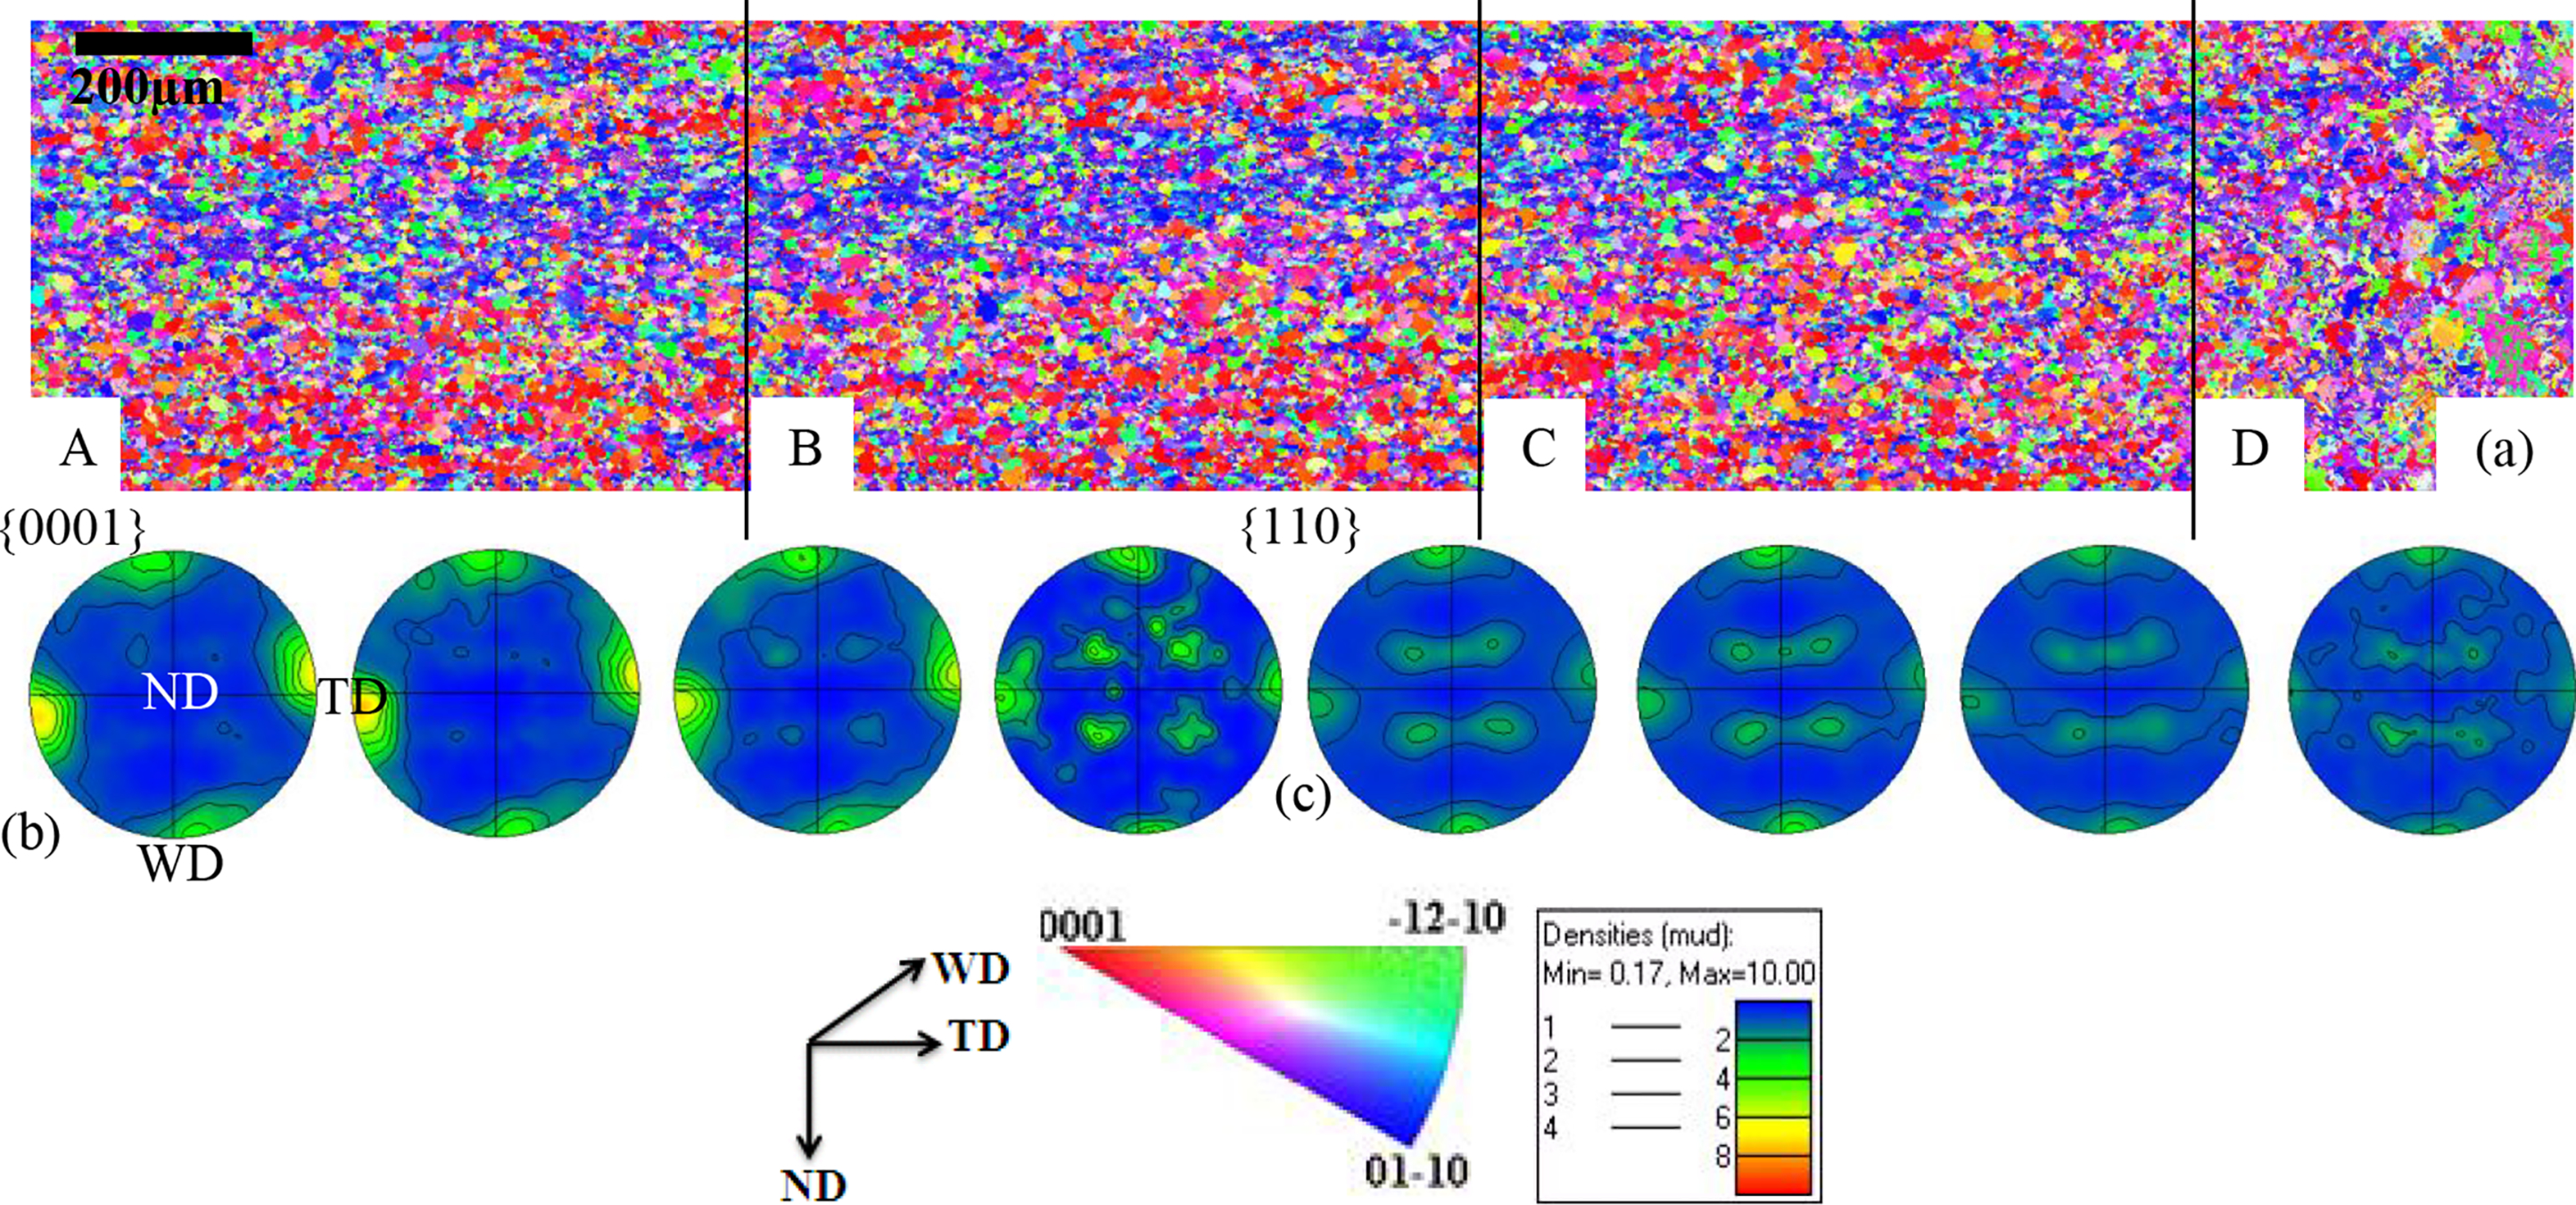
a IPF map of transition zone at RS of W19, b {0001} PFs of room temperature α phase and c {110} PFs of room temperature β phase
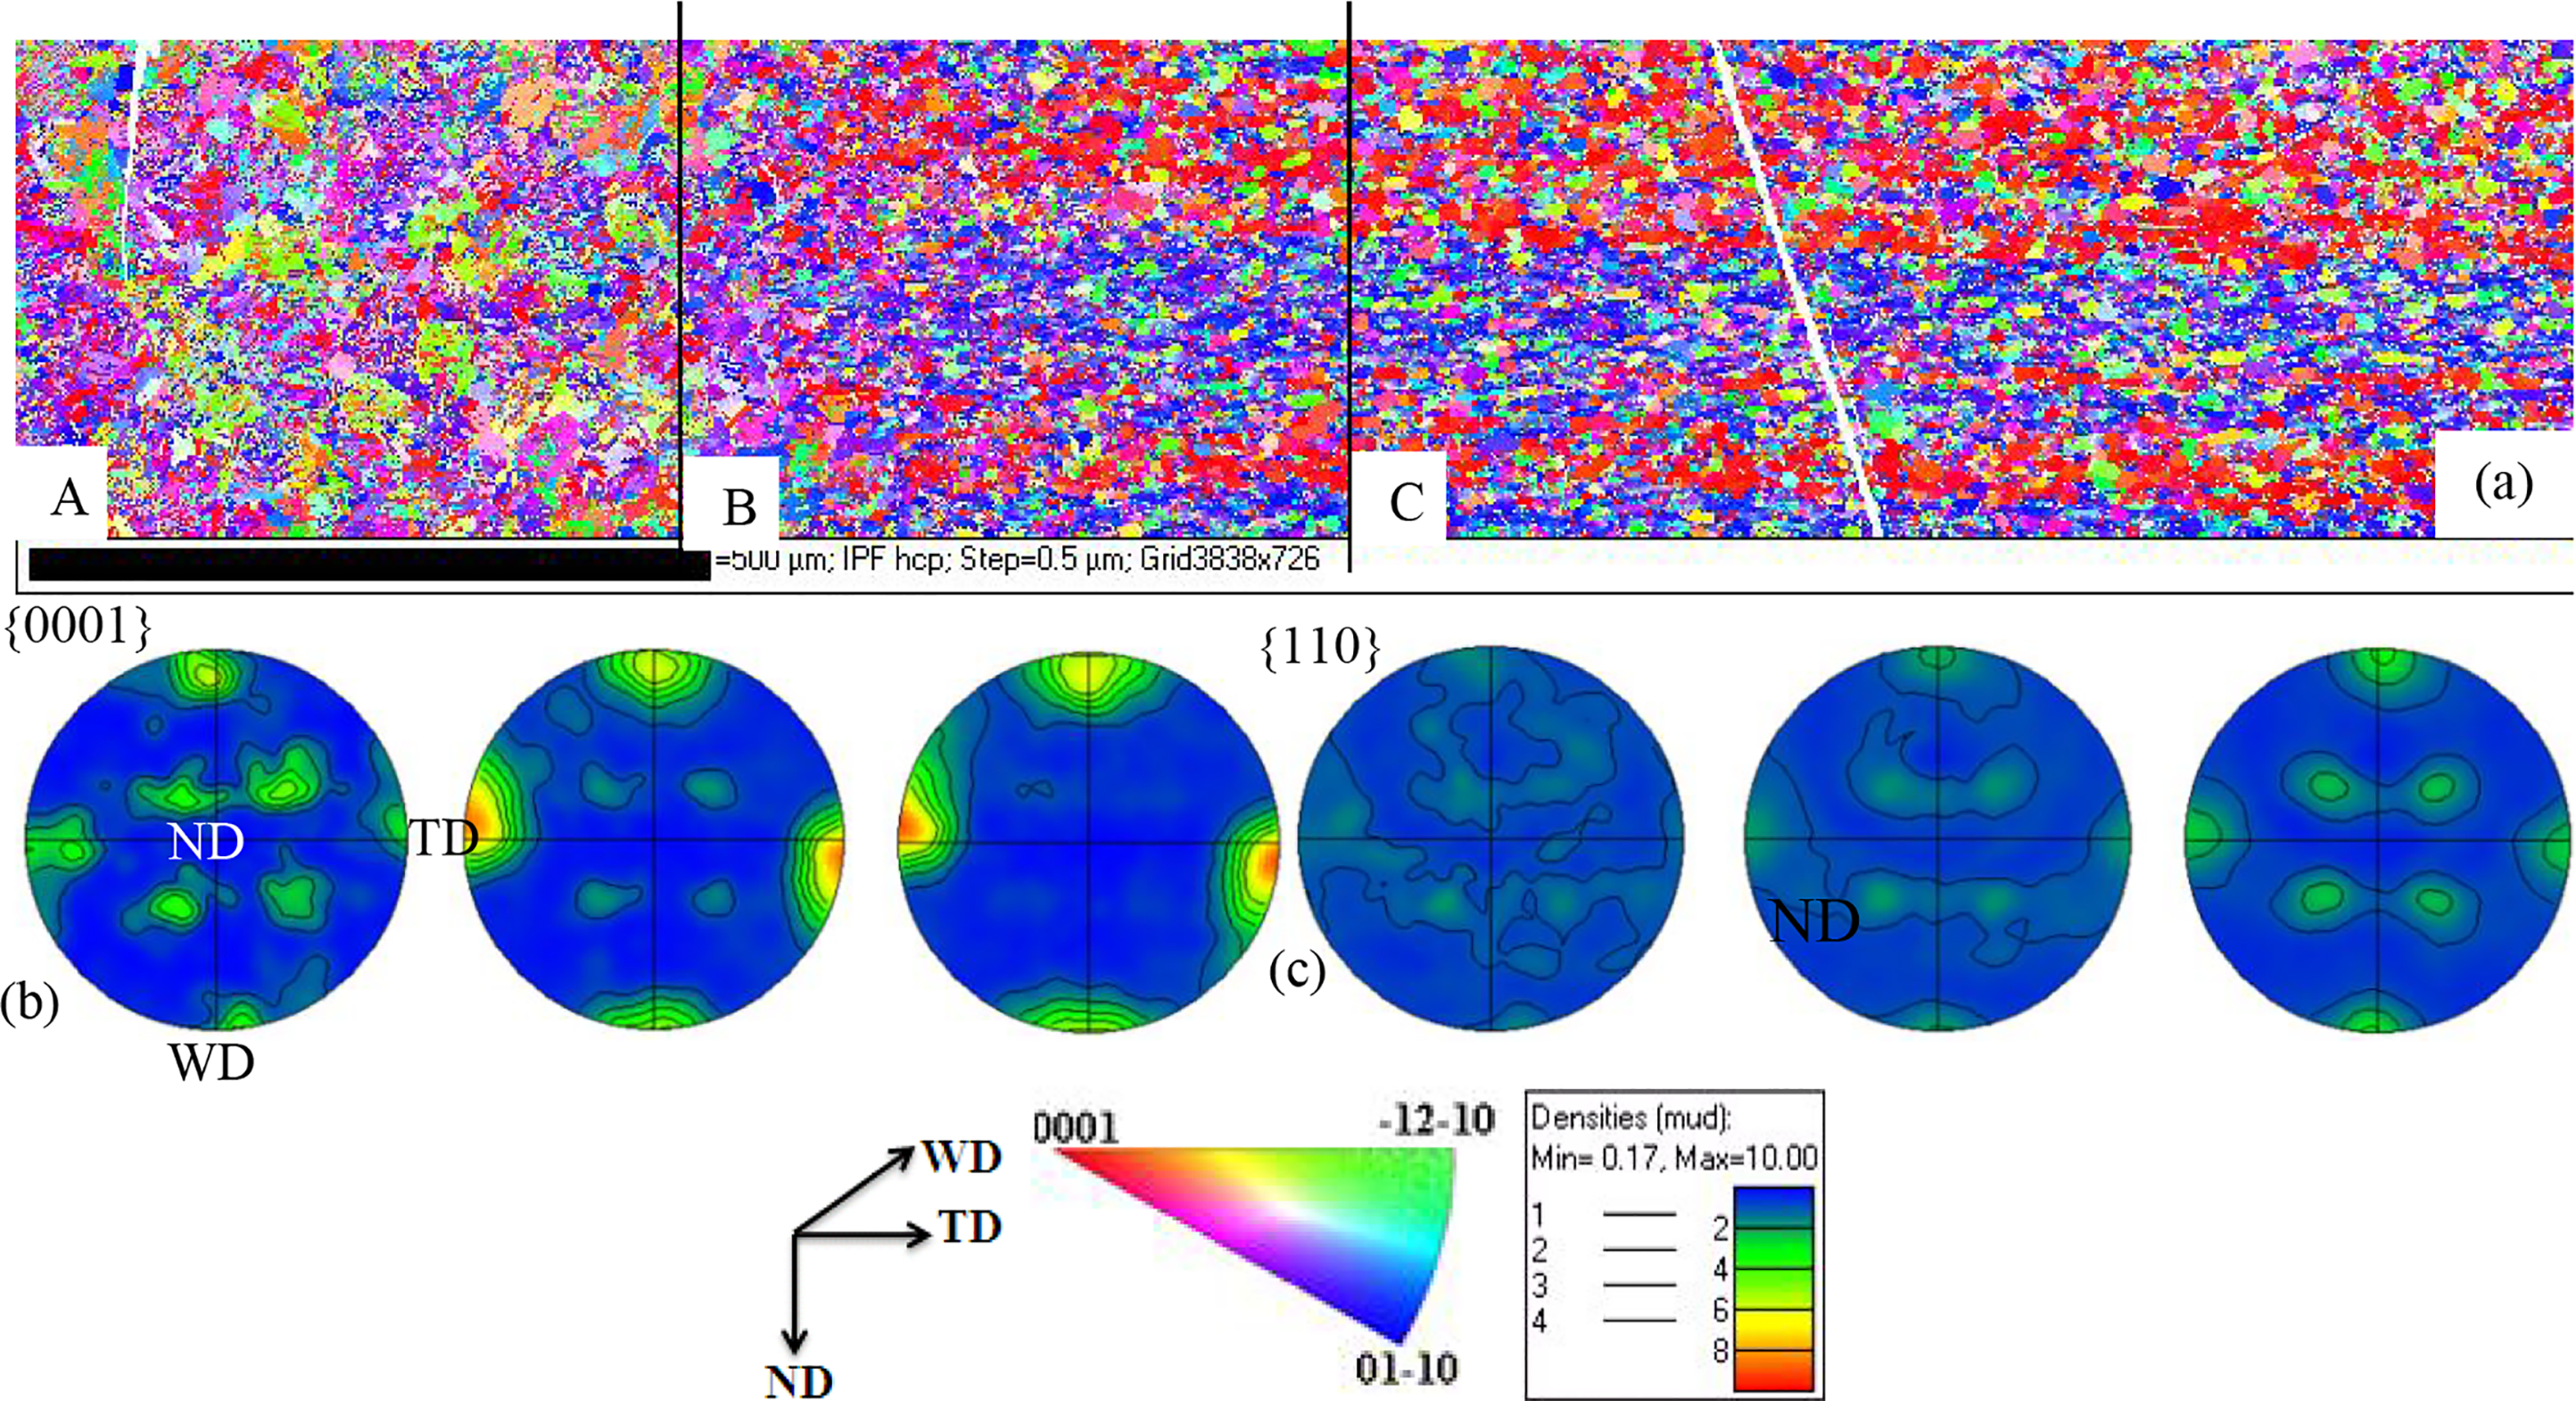
a IPF map of transition zone at AS of W19, b {0001} PFs of the room temperature α phase and c {110} PFs of room temperature β phase
Microstructure in weld zones
Microstructures of the weld zones including the BM, the HAZ and the TMAZ on the AS and the SZ centre were investigated by the optical microscope, and the results are given in Fig. 5. Figure 5a shows the equiaxed microstructure of the BM consisting of primary α in the form of near equiaxed primary α grains with an average grain size of 10 μm and a retained β with volume fraction of ∼6%. The retained β phase was in the form of grains with an average grain size of 2 μm. The retained β phase is located at α grain boundaries and triple points. The as received BM has clearly experienced a peak temperature well below the beta transus temperature (Tβ). Figure 5b is the HAZ close to the BM, and the HAZ contains primary α grains and fine lamellar α+β laths delineated by the prior β grain boundaries. Thus, the material at the HAZ has experienced a high enough temperature to generate a microstructure change from equiaxed structure (in the BM) to bimodal structure but there is no optically visible deformation. The microstructure in the HAZ was due to the deformation occurring below the Tβ as a result of lower temperatures. 5 Pilchak et al.18–19 found the similar equiaxed microstructures developed in FSWed Ti–6Al–4V, and these microstructures were due to a continuous recrystallisation process during deformation below the Tβ. Moreover, dynamic recrystallisation predominates in titanium alloys processed in the α+β region at both high and low stain rates;26, 27 however, the equiaxed microstructure of BM results from static recrystallisation, and the bimodal structure was formed just because of the effect of heat. In the region near the bimodal structure, the volume fraction of primary α phase was gradually diminishing to 0%, and the microstructure has been changed to a coarse lamellar structure of 800 to 1000 μm length containing coarse α laths, which is typical of material cooled above the β transus. In the region of a typical coarse lamellar structure near the HAZ (Fig. 5c), the material has experienced a sufficiently high temperature for the preexisting β to grow, that is, consume some of the primary α and generate a bigger volume fraction of β, which on cooling transforms to classic lamella transformed β. When the primary α phase is fully consumed by the retained β, a fully lamellar structure starts to grow as shown in Fig. 5c, which is part of the TMAZ. The TMAZ has undergone deformation to change the grain shape from bimodal structure to lath lamellar structure, indicating the material in the TMAZ has experienced a temperature above the Tβ as there is no remaining primary α; thus, the TMAZ is above the Tβ. 6 Fig. 5d is inside the SZ with a fully transformed β microstructure. In this microstructure, prior β grains are delineated by the grain boundary α, and the interiors of the prior β grains consist of colony α, basketweave α and Widmanstätten α. Both TMAZ and SZ exhibit a fully lamellar structure; however, it is seen that the TMAZ has a smaller prior β grain size and much coarser α+β laths than the SZ. The fine lamellar structure in SZ contains much finer α laths and larger prior β grains compared to the coarse lamellar structure in the TMAZ, which resulted from the much higher cooling rate in the fine lamellar structure of the SZ. The shear strain rate generated during the process was determined to be larger than 260 S− 1 (Ref. 6), and dynamic recovery is the operative deformation mode in the microstructure of the TMAZ and the SZ processed in the β region at high strain rates.26, 27
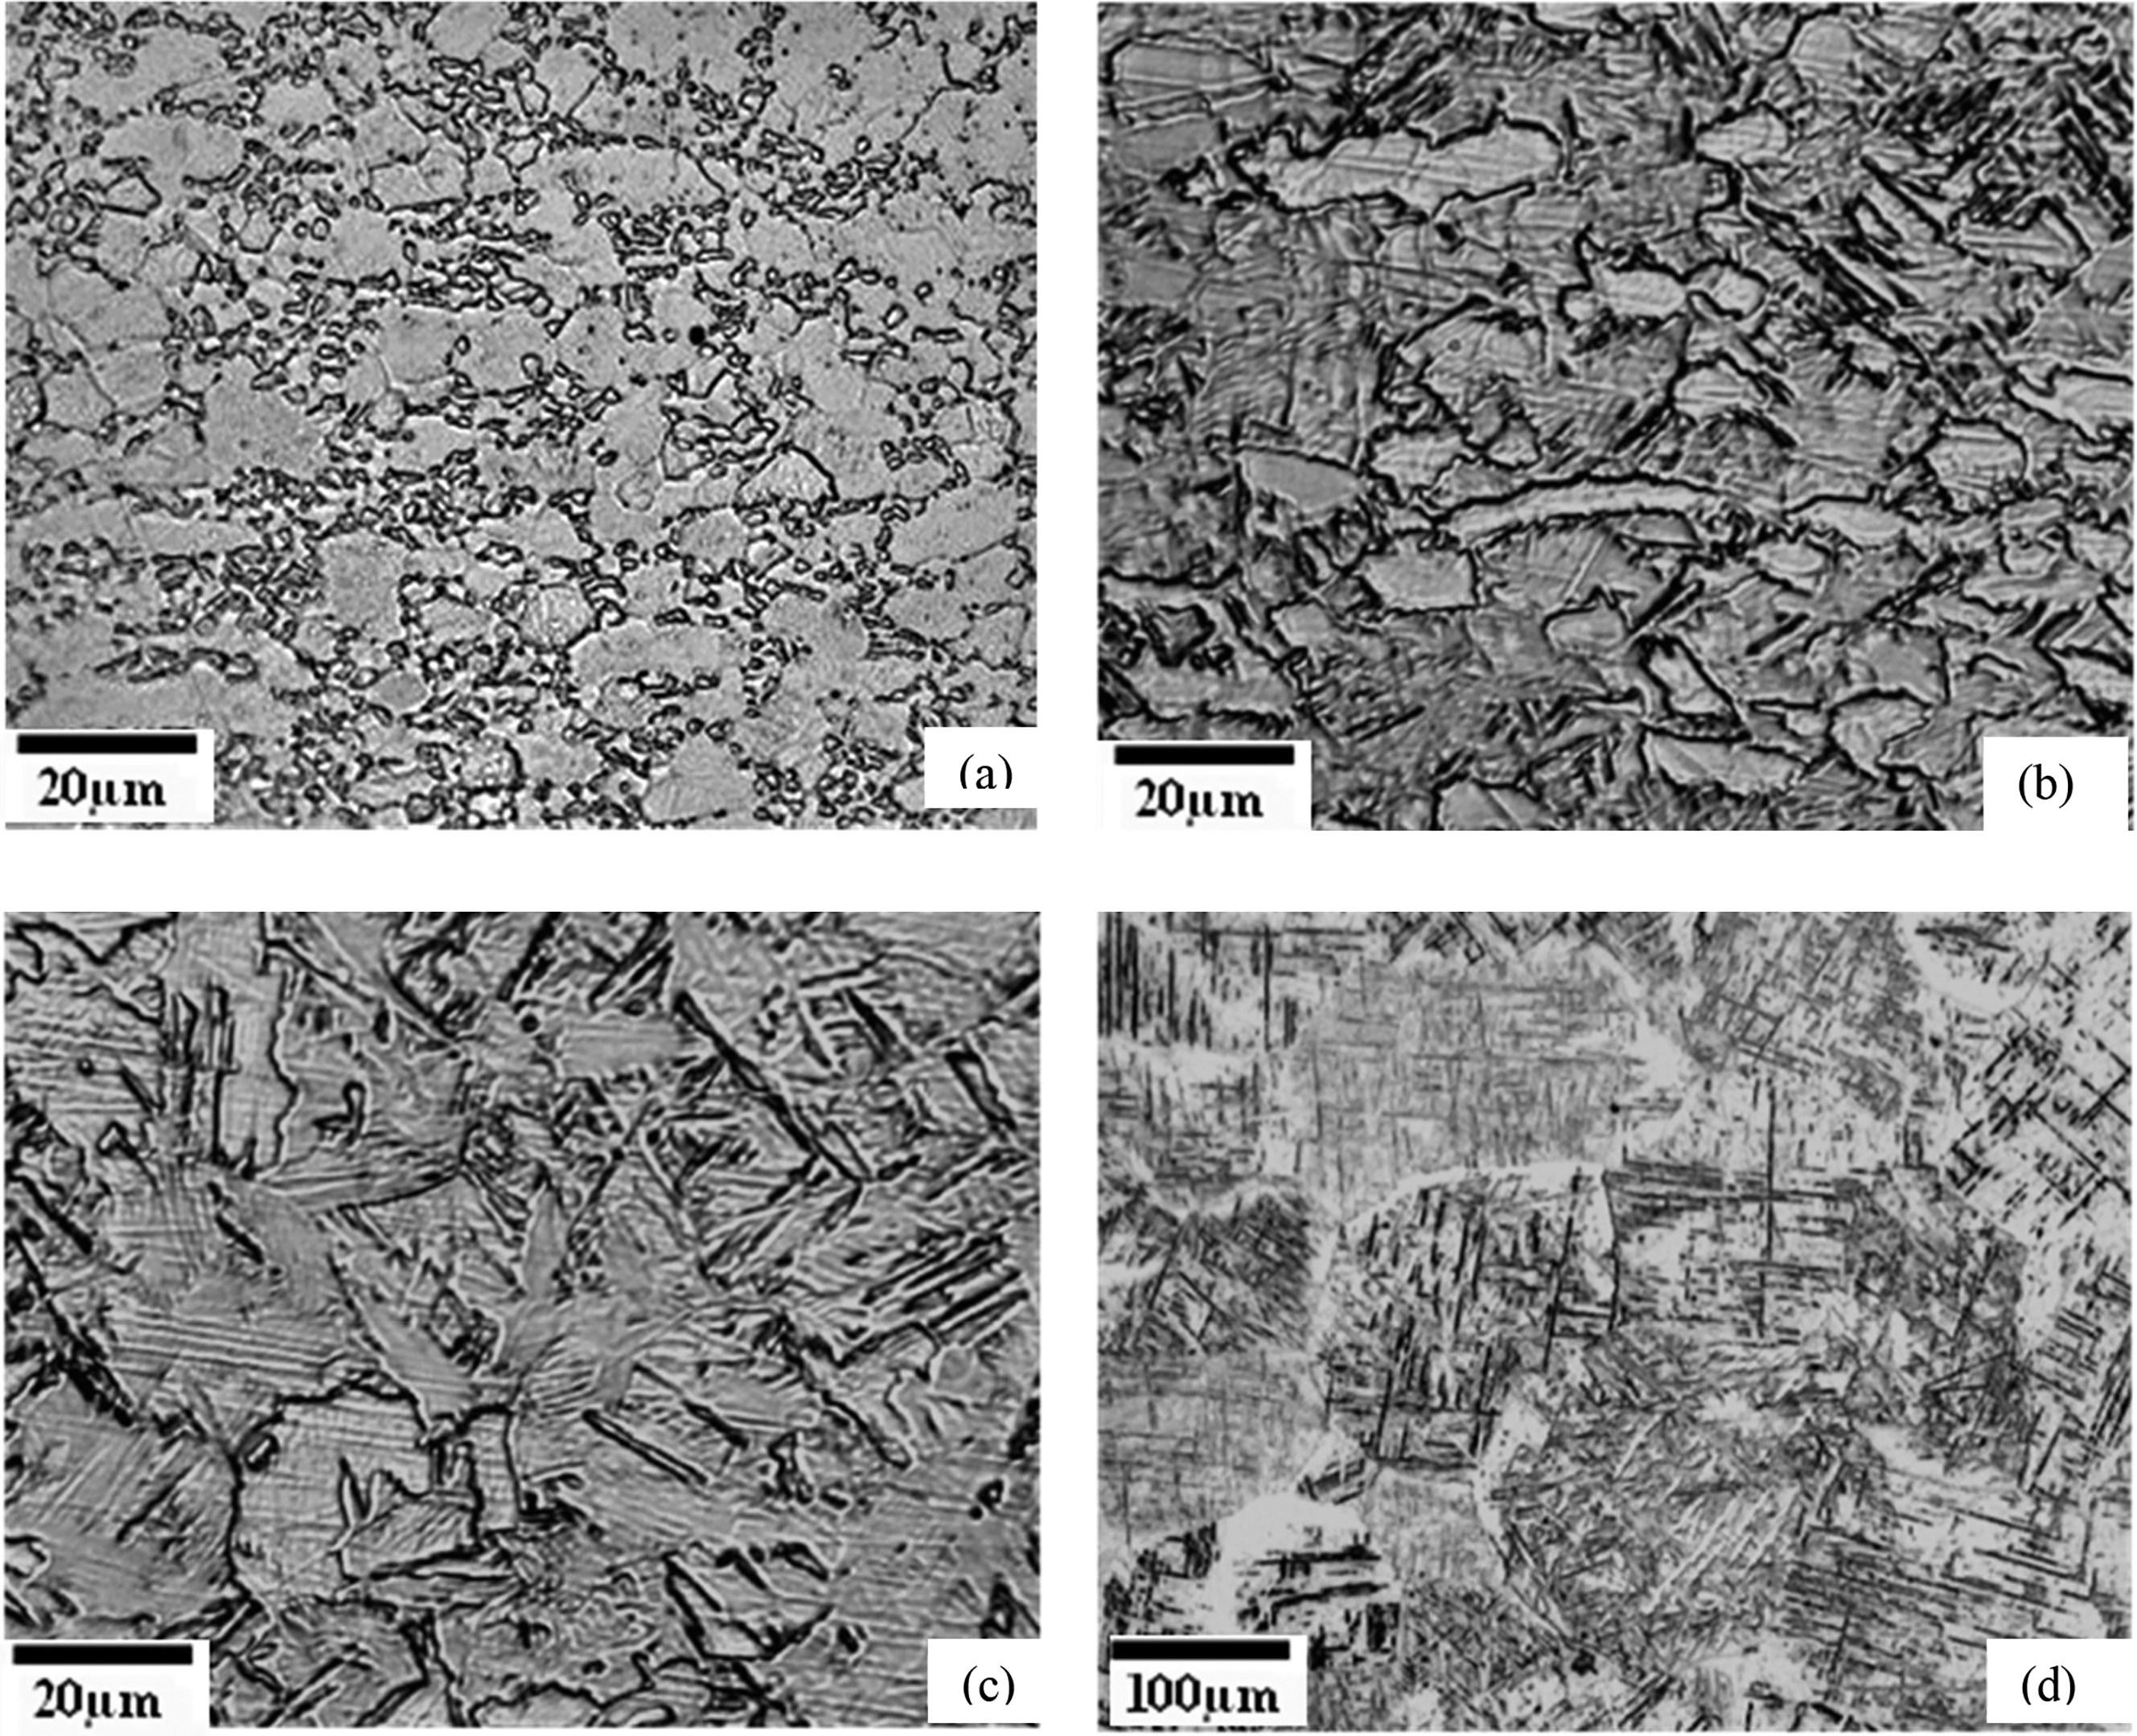
a BM; b HAZ; c thermal mechanically affected zone; d SZ on AS of weld
Texture of weld zones
Figure 6 shows the IPF map and the corresponding {0001} PFs of the α phase texture of the central weld zones with superimposed welding axes (TD, WD and ND). The pole intensity in unit of multiples of uniform density (MUD) is shown at the left of each PF. The intensities of the PFs are shown using MUD. Although the PFs are recognisable for standard deformation histories, orientation distributions provide much more detailed information. 29 Orientation distribution function (ODF) is a four-dimensional object, with the four dimensions being the three Euler angles φ1, Φ and φ2 according to Bunge's notation 30 and a density value corresponding to how strongly a particular orientation appears. Triclinic symmetry was firstly used for displaying ODFs, which has Euler space volume to be defined as follows: φ1 = 0–180°, Φ = 0–180° and φ2 = 0–60°. However, the ODF data of φ1 = 90–180°, Φ = 90–180° and φ2 = 0–60° is symmetric with respect to that of φ1 = 0–90°, Φ = 0–90° and φ2 = 0–60°. Thus, orthorhombic symmetry was introduced to show the ODF data for the BM, the HAZ on the RS, the HAZ on the AS using hcp data and the SZ centre using reconstructed bcc data (Fig. 7). The symmetries permit the smallest possible representative Euler space volume to be defined as follows: φ1 = 0–90°, Φ = 0–90° and φ2 = 0–60°. 31
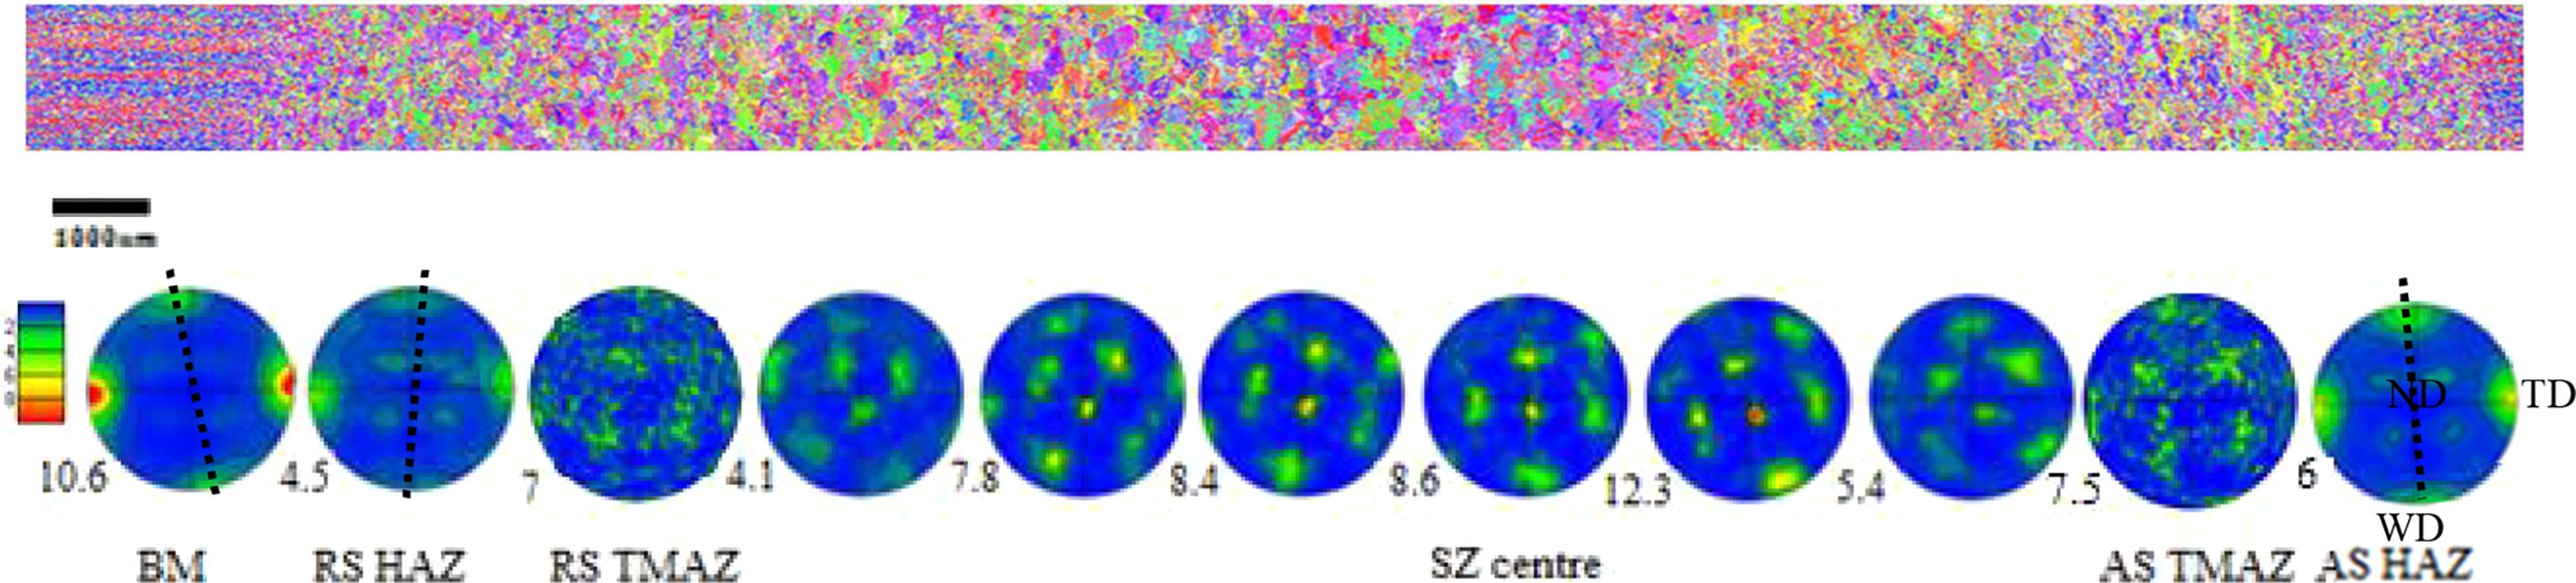
Inverse PF colouring map and {0001} PFs of α phase of central weld zones
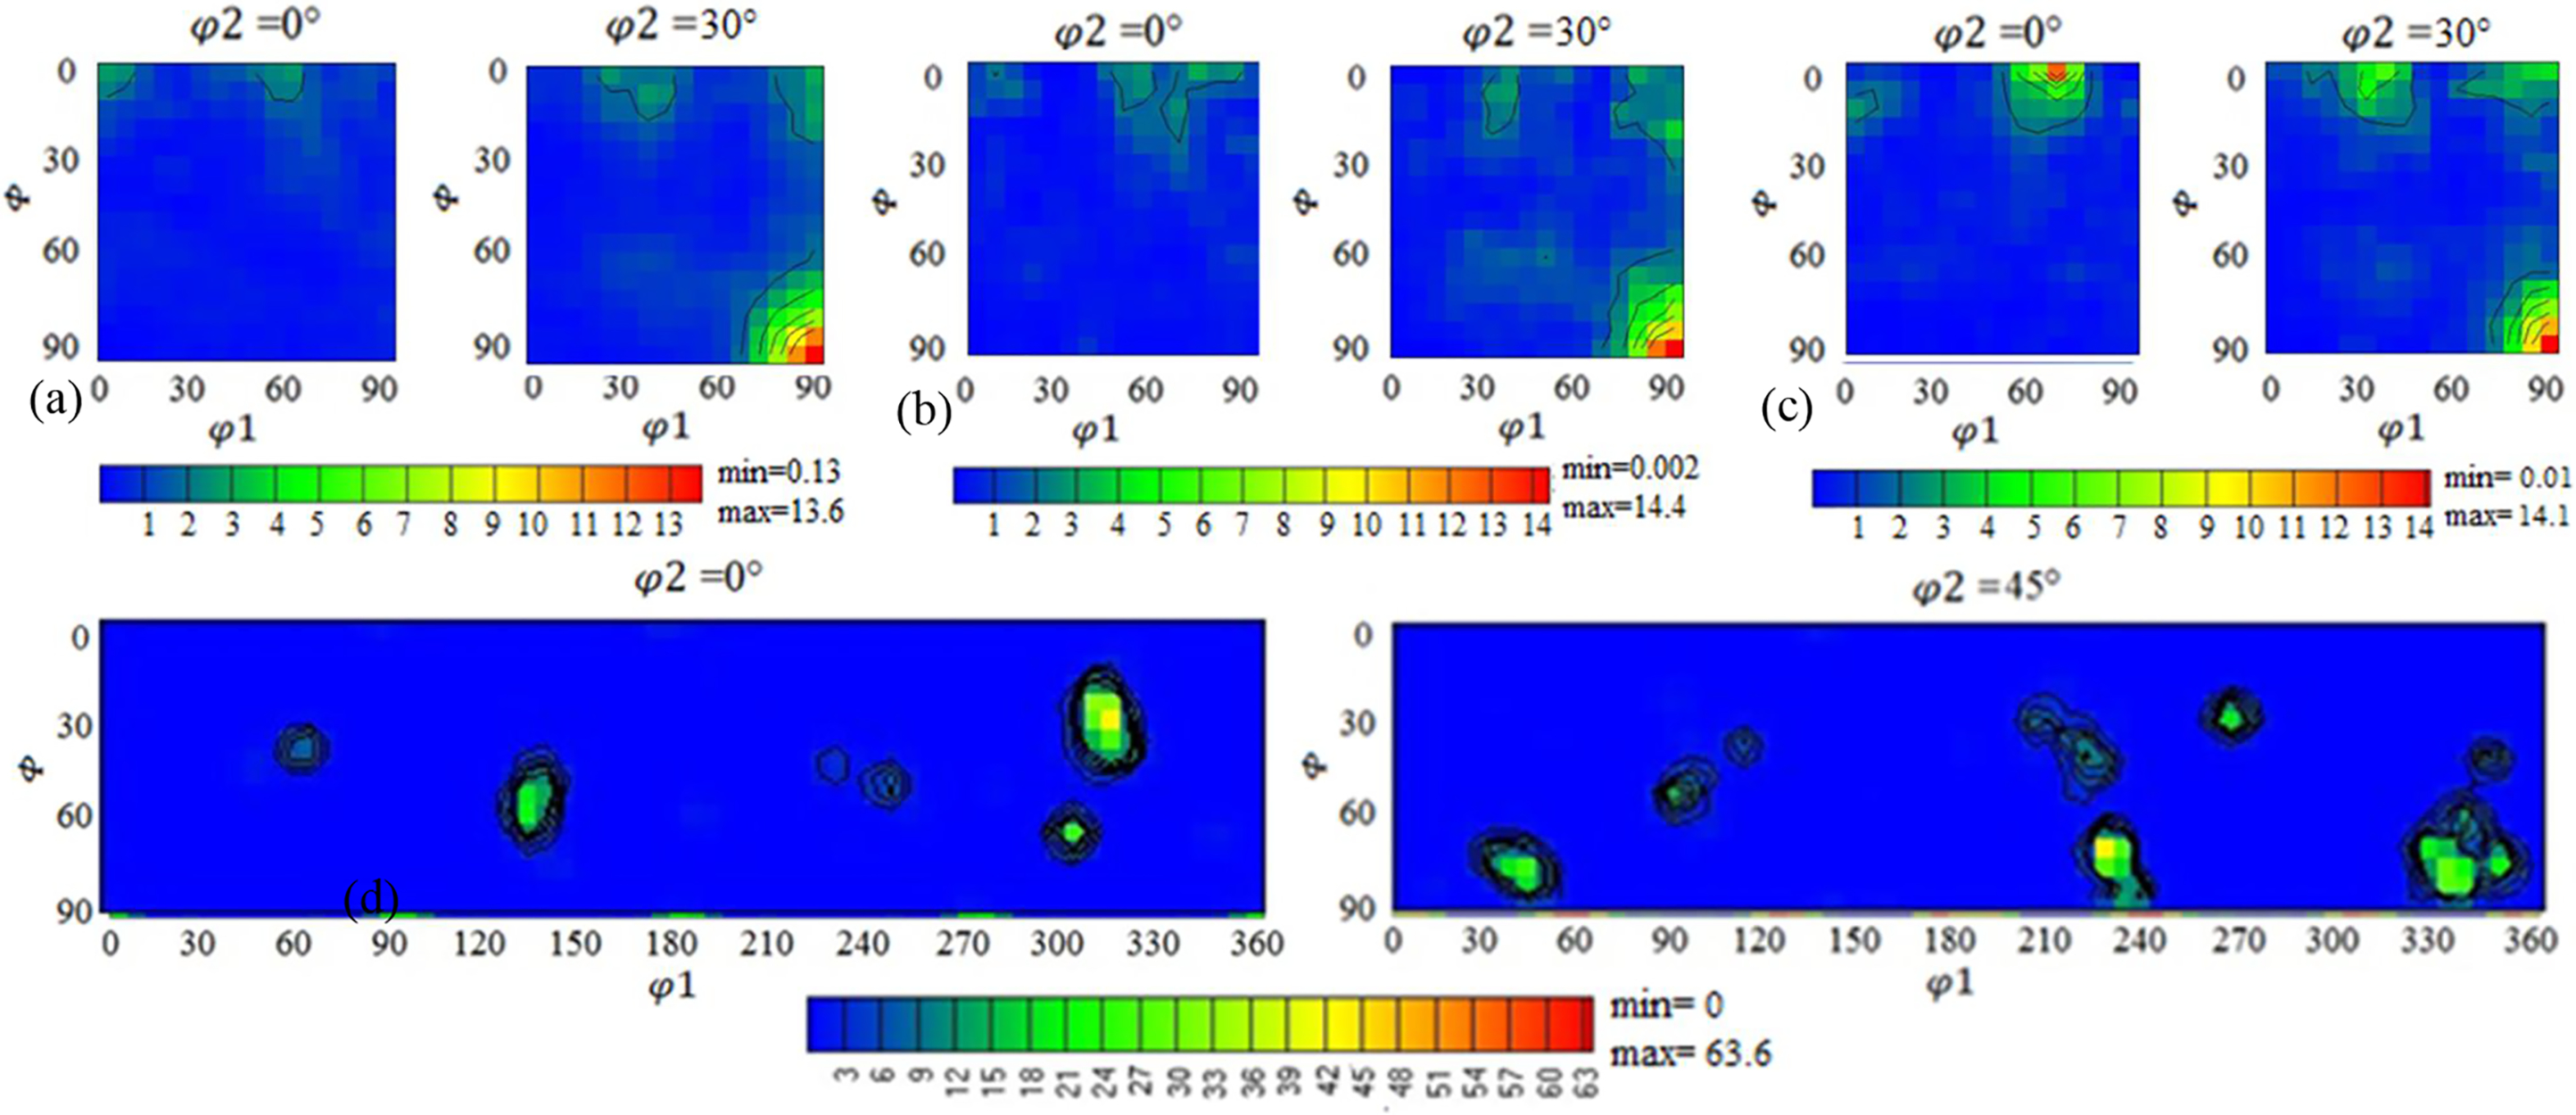
Euler angles in ODF with orthorhombic symmetry for α phase: at φ2 = 0° and φ2 = 30° planar sessions of a BM, b RS HAZ and c AS HAZ; d Euler angles in ODF with triclinic symmetry for β phase: at φ2 = 0° and φ2 = 30° planar sessions of reconstructed SZ centre
In Fig. 6, the BM presents a classic rolling texture, with four main peaks in the {0001} PF: two strong components whose c axes are in the TD resulting from hot rolling and two components with c axes rotated ∼20° to the WD. For the TD component (c axes in TD), this texture is very sharp, and its intensity reaches 10.6 MUD. In the ODF of the BM (Fig. 7a), the BM has strong prismatic texture {11
 0} < 0001> at Euler angles of φ1 = 0°, Φ = 90° and φ2 = 0° corresponding to the TD component with high intensity of 10.6 MUD and weak prismatic texture {11
 0} < 10
 0> at Euler angles of φ1 = 90°, Φ = 90° and φ2 = 0° corresponding to the WD component with intensity of 4 MUD
32
In Fig. 4, the HAZ has developed a mixed texture type containing three components, and they are the TD component, the WD component and the 45° component using Ari-Gur and Semiatin's notation,
33
where the 45° component represents the poles lying in the lines from the pole position to the centre, which is rotated 45° to either the TD or the WD. This 45° component presents scatter distribution of orientation in ODF (Fig. 7b). It is then concluded in the ODF (Fig. 7b) that the HAZ has also developed prismatic texture {11
0> at Euler angles of φ1 = 90°, Φ = 90° and φ2 = 0° corresponding to the WD component with intensity of 4 MUD
32
In Fig. 4, the HAZ has developed a mixed texture type containing three components, and they are the TD component, the WD component and the 45° component using Ari-Gur and Semiatin's notation,
33
where the 45° component represents the poles lying in the lines from the pole position to the centre, which is rotated 45° to either the TD or the WD. This 45° component presents scatter distribution of orientation in ODF (Fig. 7b). It is then concluded in the ODF (Fig. 7b) that the HAZ has also developed prismatic texture {11
 0} < 0001> with intensity of 4.5 MUD and prismatic texture {11
 0} < 10
 0> with intensity of 3 MUD and weak 45° component. The {0001} PFs of the SZ centre can be seen to contain six main poles of intensity. These are the result of the phase transformation of a single dominant orientation in the high temperature β texture.
5
The {0001} PF of the SZ centre and the TMAZ on both the AS and the RS (Fig. 4) show that the α phase texture of the SZ centre is a classic bcc shear texture D1 (11
0> with intensity of 3 MUD and weak 45° component. The {0001} PFs of the SZ centre can be seen to contain six main poles of intensity. These are the result of the phase transformation of a single dominant orientation in the high temperature β texture.
5
The {0001} PF of the SZ centre and the TMAZ on both the AS and the RS (Fig. 4) show that the α phase texture of the SZ centre is a classic bcc shear texture D1 (11
 )[111] component with a pole orientated in the ND;
5
however, the pole is slightly shifted from the ND. The α phase texture of the SZ centre was inherited from the shear texture of the high temperature β phase.
5
The TMAZ has a diffused intermediate texture component between the texture of the HAZ and the D1 texture of the SZ centre at both the AS and the RS. When we deviate away from the centre of the weld, the shear texture rotates about the ND of the weld, as observed by Davies et al.
5
, but remains the D1 component. The D1 shear texture component is at the three Euler angles of φ1 = 270°, Φ = 35° and φ2 = 45° in bcc materials using triclinic symmetry for representing ODF data.
21
In the present study, we have used our own β reconstruction methodology developed by Davies and Wynne to reconstruct a large area orientation image map from a weld in Ti–6Al–4V.
5
The ODF sections of the reconstructed bcc structure of the SZ centre show that the D1 component developed in the SZ centre is at φ1 = 270°, Φ = 30° and φ2 = 45° (Fig. 7d), a deviation of 5° in the Euler angle Φ confirmed the slight shift of the basal poles from the ND (Fig. 4).
)[111] component with a pole orientated in the ND;
5
however, the pole is slightly shifted from the ND. The α phase texture of the SZ centre was inherited from the shear texture of the high temperature β phase.
5
The TMAZ has a diffused intermediate texture component between the texture of the HAZ and the D1 texture of the SZ centre at both the AS and the RS. When we deviate away from the centre of the weld, the shear texture rotates about the ND of the weld, as observed by Davies et al.
5
, but remains the D1 component. The D1 shear texture component is at the three Euler angles of φ1 = 270°, Φ = 35° and φ2 = 45° in bcc materials using triclinic symmetry for representing ODF data.
21
In the present study, we have used our own β reconstruction methodology developed by Davies and Wynne to reconstruct a large area orientation image map from a weld in Ti–6Al–4V.
5
The ODF sections of the reconstructed bcc structure of the SZ centre show that the D1 component developed in the SZ centre is at φ1 = 270°, Φ = 30° and φ2 = 45° (Fig. 7d), a deviation of 5° in the Euler angle Φ confirmed the slight shift of the basal poles from the ND (Fig. 4).
However, Davies et al. 5 observed the D2 component in SSFSWed mill annealed Ti–6Al–4V with 6.35 mm thick, 12° taped probe at a rotation speed of 400 rev min− 1 and a traverse speed of 60 mm min− 1. The present work used a hot rolled 7 mm thick plate with a parallel tool probe at a rotation speed of 800 rev min− 1 and a traverse speed of 150 mm min− 1, the rotation speed and traverse speed are both twice higher than the work of Davies et al. 5 Previous work demonstrated that the rotation speed has a much stronger effect on the FSW process in terms of prior β grain size and α lath thickness in the SZ compared to the traverse speed, 6 which leads to much higher strain in the SZ. This may result in the disappearance of the D2 component and the occurrence of the D1 component according to Baczynski and Jonas, 23 and the D1 component becomes profuse with increasing strain from the TMAZ to the SZ centre (Fig. 6). For convenience, the TMAZ is defined as the region exhibiting intermediate shear texture component D1, and the SZ is the region with shear texture component D1. It should also be noted that the AS has a higher density of {0001} poles than that of the RS, indicating that texture is much stronger on the AS than the RS mainly because of the different material flow conditions as the welding materials has been pushed from the RS to the AS during the FSW process, and this has resulted in a much higher peak weld temperature in the regions on the AS than that on the RS.
Conclusions
The BM exhibits an equiaxed structure that has undergone peak temperature well below beta transus the equiaxed microstructure of the BM; HAZ has a bimodal structure near the TMAZ. The HAZ experienced peak temperature below the beta transus temperature, and the bimodal structure of the HAZ results from heat only but without deformation. Both the TMAZ and the SZ centre consist of fully transformed lamellar that underwent peak temperature above the beta transus temperature. Dynamic recovery is the operative deformation mode in the β region of the microstructure in the TMAZ and the SZ. Texture is much stronger on the AS than that on the RS. Both the BM and the HAZ have the prismatic texture {11
 0} < 0001> and {11
 0} < 10
 0>.The texture of the SZ is dominated by the D1 (11
 )[111] shear texture component, while the TMAZ has intermediate shear texture. The higher strain of the SZ may result in the disappearance of the D2 component and the occurrence of the D1 component.
Acknowledgements
This research was sponsored by the China Scholarship Council, Department for Innovation, Universities and Skills (DIUS) and the University of Sheffield. The authors thank TWI Ltd for their technical help. This work was also supported by the National Science and Technology Major Project of China under grant no. 2011ZX04016-061.