
Abstract
The fatigue behaviour of laser engineered net shaping (LENS) deposited Ti–6Al–4V is studied in the as built condition. The fatigue properties are measured, and the influence of microstructure and physical defects on fatigue performance is analysed through microscopy and fractography. Fine basketweave microstructure is obtained using a substrate with large equiaxed grains. The presence and location of unmelted particles are observed to significantly affect fatigue life. On the other hand, smaller gas porosity is not found to have major effect on the fatigue life. Further, the fatigue properties in a ‘repair’ condition are evaluated through samples consisting of LENS deposited parts joined to a preexisting wrought part. The properties are compared with the as built LENS parts.
Introduction
Laser engineered net shaping (LENS) is a directed energy deposition additive manufacturing (AM) technology capable of building custom shaped parts through layer by layer deposition of material. In the LENS process, a CAD model of the desired part is sliced into a sequence of layers in the control software. The metal is fed in powder form through nozzles to the focal point of a moving laser beam where it is melted to sequentially deposit each layer to form the required finished part.
The ability to cost effectively produce one of a kind, custom parts has led the process to be applied in the repair of worn turbine blades and manufacture of jet engine after burner casings in the aerospace sector. 1 Successful performance depends on achieving reliable mechanical properties in the deposited parts. Fatigue properties are an important indicator of the long term mechanical reliability of the parts in service.
In LENS, physical defects such as interlayer porosity and gas porosity commonly occur in the final product.2, 3 Interlayer porosity is found to have an irregular free surface and extends in an elongated fashion between successive layers. 4 It has been shown that interlayer porosity is mainly caused by lack of fusion and can be reduced by optimising the process parameters. 3 Gas porosity is typically spherical and distributed randomly through the bulk of the sample and is assumed to be caused by gas entrapment during deposition or due to the presence of gas bubbles in the powder. This kind of porosity has been studied by Ahsan et al. 5 and has been found difficult to eliminate by process control efforts. It is noted that hot isostatic pressing (HIP) has been used to eliminate the physical defects in the as built LENS samples, resulting in marked improvement of fatigue properties. However, HIP processing is not a reliable method for removing entrapped gases from builds 6 and can introduce dimensional changes. The proposed end use case for repair applications, where dimensional changes need to be minimised, serves as a motivation to eliminate HIP as a post-processing operation and improve the fatigue properties in the as built condition.
Ti–6Al–4V is extensively used in the aerospace industry and is a candidate material for application of the LENS process. The fatigue performance of Ti–6Al–4V parts is affected by the type of microstructure, presence of physical defects, as well as the loading conditions.7–10 The influences of these three major factors are described as follows.
The final microstructure of LENS deposited Ti–6Al–4V is largely determined by the primary solid state phase transformation on cooling, which is the transformation from the body centred cubic beta (β) phase to a hexagonal closed pack alpha (α) phase starting at a temperature of 1273 K (i.e. the beta transus). Each layer of deposited material in the LENS process undergoes multiple thermal excursions above this beta transus temperature, resulting from the subsequently deposited layers. This thermal history has been modelled and analysed by Makiewicz 11 to study the beta ↔ alpha microstructure evolution. The morphology of alpha, which has a marked effect on the fatigue properties, depends on both the cooling rate and the prior-beta grain size.7, 12 At cooling rates faster than 410 K s− 1, martensitic alpha is formed from the beta phase. 12 On the other hand, when the cooling rate is slower than 20 K s− 1, three microstructures are possible. In particular, the alpha phase first forms along beta grain boundaries (GBs). This is denoted as GB alpha and is detrimental to fatigue properties.7, 13 The coarsening of GB alpha is quickly hindered by two other transformations. At cooling rates of < 2 K s− 1, packets of lamellar ‘colony alpha’ structures grow from the GB phase into the bulk of the original beta grain. On the other hand, at cooling rates >2 K s− 1, the alpha lamellae also nucleate directly in the bulk of the beta grain and grow in a ‘basketweave alpha’ morphology. The beta to alpha transformation does not complete at room temperature and ∼10% of the beta phase continues to exist. The presence of the basketweave alpha morphology is beneficial to fatigue performance of the alloy. 7 A larger prior-beta grain size lowers the GB area per unit volume, thus increasing the nucleation probability for a basketweave microstructure vis-à-vis a colony microstructure. Hence, the large beta grains may be utilised to increase the basketweave fraction in the final deposited parts. Moreover, the prior-beta grain morphology is determined by the ratio of the temperature gradient ‘G’ and the growth rate ‘R’. Manvatkar et al. 14 and Gockel et al. 15 have developed modelling approaches for estimating the G/R ratio and grain morphology from the process parameters in powder blown laser AM and wire feed electron beam AM respectively.
Higher fatigue performance has been observed when the microstructure consists of finer alpha lamellae, higher fraction of basketweave or duplex microstructure. 13 Such higher fatigue life has been attributed to a more tortuous path for the propagation of the fatigue crack in those microstructures. Formation of a duplex microstructure requires extensive thermomechanical processing of the alloy close to the beta transus, and such microstructure is thus difficult to obtain in the as built LENS part. Therefore, among the GB, colony, basketweave or martensitic alpha at room temperature, the basketweave microstructure is most desirable in the as built LENS product for improving fatigue life.
The effect of loading ratio ‘R’, cycling frequency and testing environment on the fatigue properties of Ti–6Al–4V has been studied by various researchers.9, 16, 17 Ritchie et al. 9 studied crack growth rates in a range of stress intensity factors (SIFs) under different R, frequency and environment. They found the fatigue crack growth rate to significantly depend on the loading ratio R and the choice of vacuum or air as the testing environment. On the contrary, the cycling frequency was found to have no significant effect on the crack growth rate in the test range of 50 Hz to 1.5 KHz. Irving and Beevers 16 have also reported a slower crack growth in testing conducted under vacuum condition in comparison to testing in air.
The fatigue properties of LENS deposited Ti–6Al–4V parts were investigated by Kobryn and Semiatin. 18 As expected, HIP'ed samples had far superior fatigue properties than the stress relieved samples, as HIP healed internal physical defects prone in LENS process. Moreover, the fatigue properties of some HIP'ed samples are on par with the reference values for the wrought material. More recently, Makiewicz 11 evaluated fatigue properties of LENS deposits without the use of HIP. Their work focused on developing an improved microstructure consisting of nearly complete basketweave alpha. This was achieved by depositing the LENS parts on a large grained substrate, leading to epitaxially growing large beta grains during deposition. On cooling, these large beta grains formed a predominantly basketweave microstructure. Owing to the possible existence of regions of colony microstructure and lack of fusion defects in their LENS samples, Makiewicz 11 only observed a weak improvement in fatigue life.
The application of LENS process for repair of components may require the joining of deposited parts to preexisting structures. This process of joining is similar to the laser welding process. The fatigue properties of laser welded sheets of Ti–6Al–4V have been studied by various researchers.19–23 However, no published data currently exist for the fatigue performance of additive manufactured parts deposited as a repair to an existing wrought metal part.
The objective of the present work is to evaluate the fatigue properties of as deposited LENS parts and ‘repair condition’ deposits. The results are compared against previously reported properties and microstructures of LENS deposited Ti–6Al–4V. The cause of the fracture, characterised using electron microscopy, is discussed to understand the effect of microstructure and physical defects on fatigue performance.
Experimental
Sample creation
The samples were deposited using an OPTOMEC LENS machine equipped with a 500 W fibre laser and two powder hoppers to dispense powder to the building process. Extra low interstitial grade Ti–6Al–4V gas atomised powder manufactured by Allegheny Technologies Inc. was used to deposit the builds. The size of the powder corresponded to a mesh size of +325 − 100, i.e. the diameter of the powder particles lies in the range between 50 and 150 μm. The maximum oxygen content in the packaged condition was 0.17 wt-%.
Following the method used by Makiewicz, 11 a large grained substrate with an as cast microstructure of Ti–6Al–4V was used in the present case. The substrates were obtained from a cylindrical riser piece by sectioning it lengthwise into rectangular plates through electrical discharge machining. The thickness of the plates was kept constant at 6.35 mm (0.25″). Optical micrography revealed the average grain size of the substrate to be ∼2 mm.
Experimental trials were carried out to determine the LENS parameters that resulted in a minimal interlayer porosity. Analytical calculations using ParaGen software 24 developed by Applied Optimization were used to further optimise parameters, especially the hatch width, to avoid excess overlapping between adjacent beads for the given laser power. The build path of successive layers is rotated by 60° with respect to the preceding layer. This is schematically shown in Fig. 1. The key LENS parameters are provided in Table 1. During the deposition process, the oxygen level in the build chamber was maintained < 3 ppm.
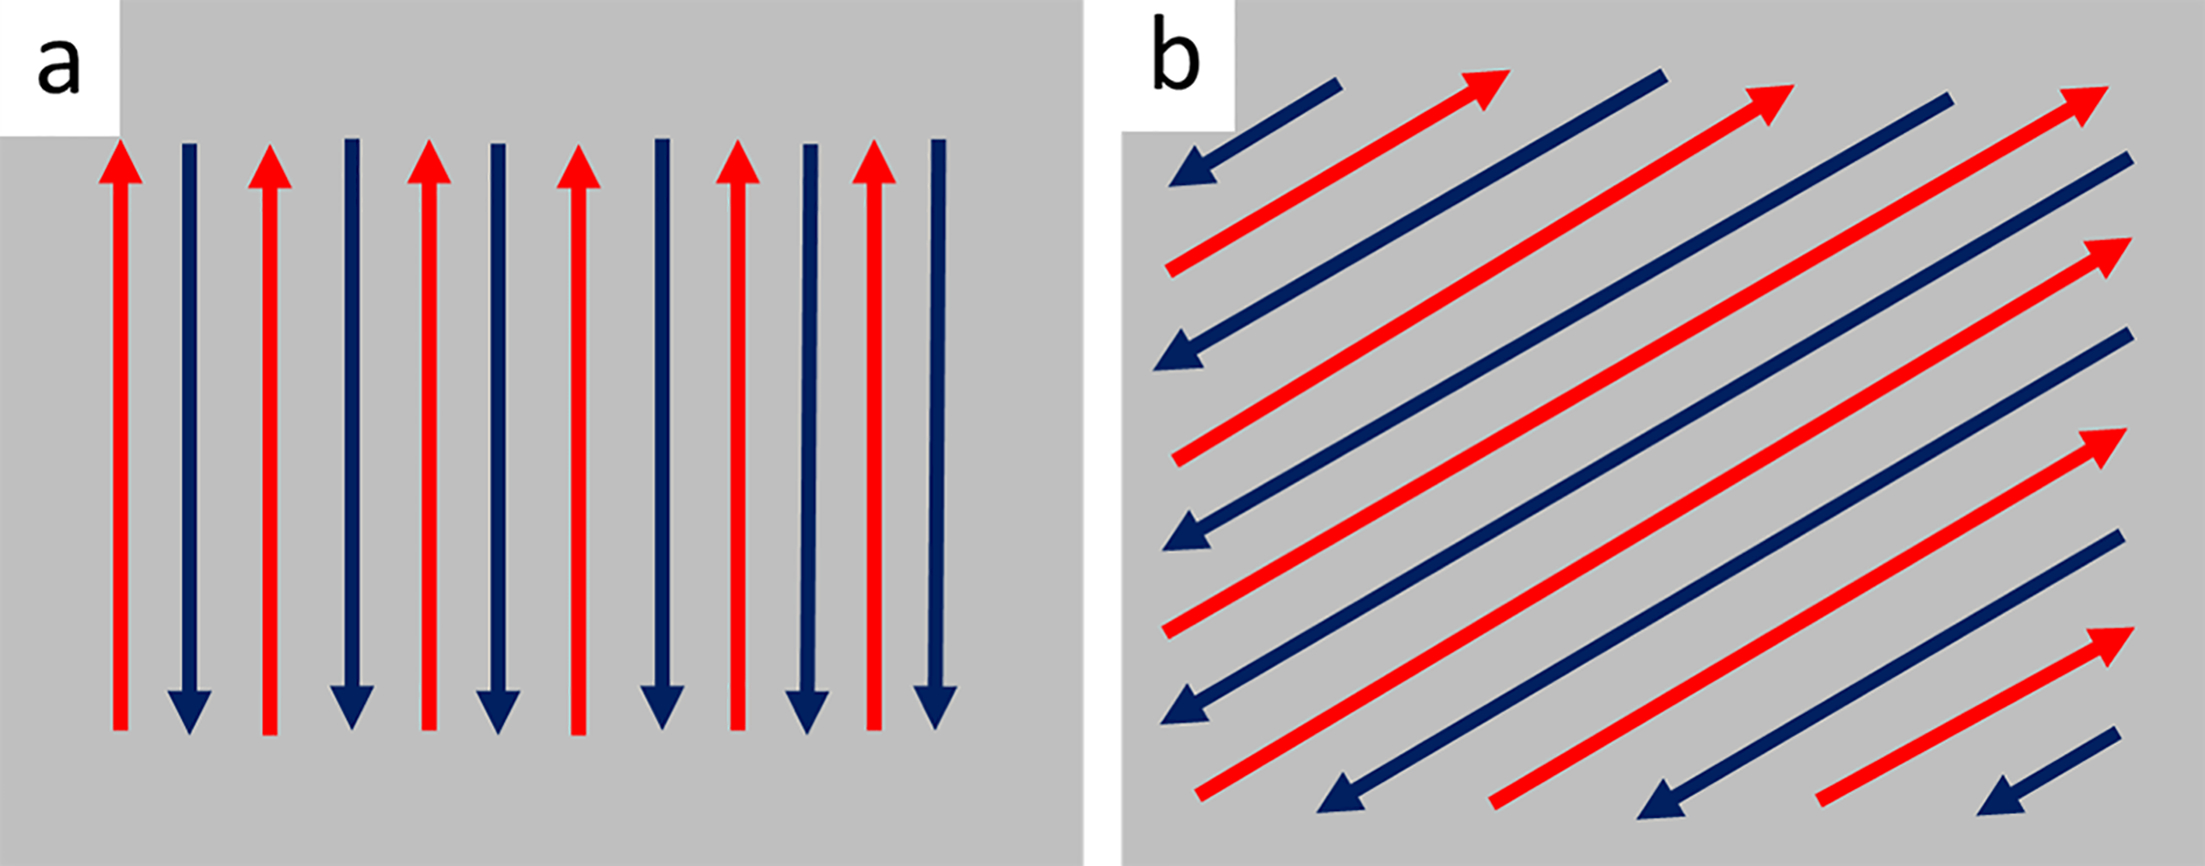
a (n)th layer; b (n+1)th layer
Key process parameters used for LENS deposition of samples
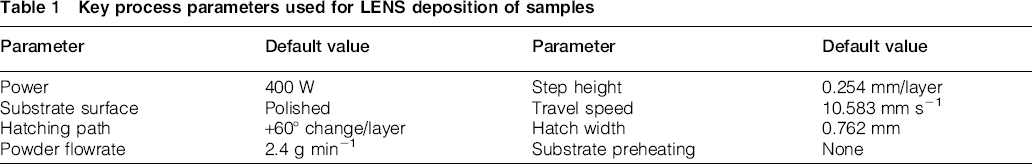
The sample was deposited to a height of 68.58 mm (2.7″) for carrying out the fatigue testing, and a trial build was also deposited alongside to a height of 45.72 mm (1.8″) for microstructure analysis. All the samples were deposited in a cylindrical shape with a diameter of 12.7 mm (0.5″). A second set of samples was deposited as a flat sample welded to a base metal of Ti–6Al–4V to mimic the repair condition. In this simulated repair case, a portion of the wrought base metal itself was used as the substrate, and the sample was deposited to a height of 3.18 mm (0.125″). A schematic diagram of the deposited samples is shown in Fig. 2.
a as deposited testing; b repair condition testing
The deposited samples were sectioned vertically through the centre in the x–z plane to observe the microstructure. The exposed surface was polished and then etched with Kroll's reagent for 20 s to reveal the alpha microstructure as well as prior-beta GBs.
Fatigue testing
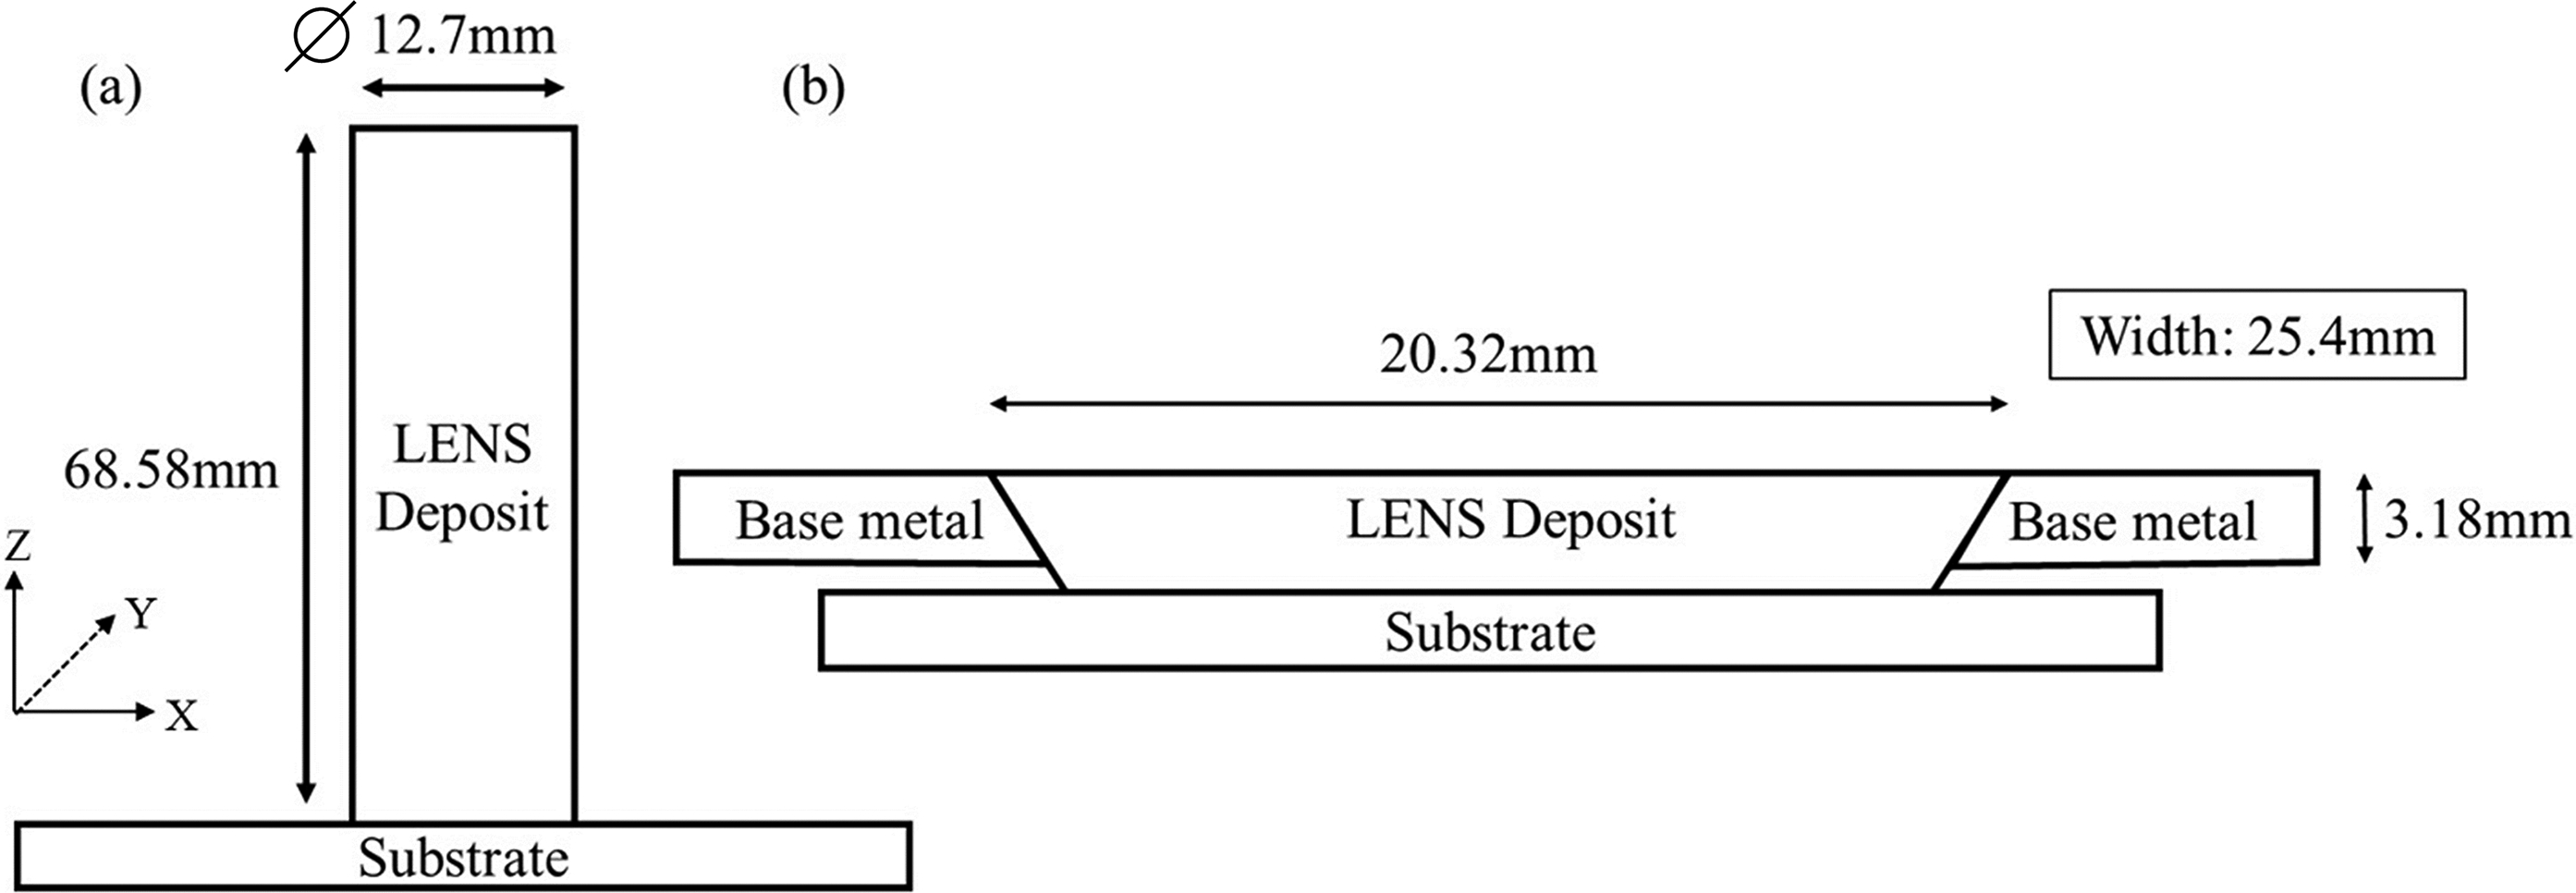
The fatigue testing of the samples was performed in accordance with the ASTM Standard E 466. The geometry is shown below in Fig. 3a and b for the as built (round) and repair condition (flat) samples respectively.
a as deposited round sample; b repair condition sample
The samples were tested at two levels of stress: 650 and 500 MPa. The loading cycle for both types of sample geometries followed a tensile compressive cycle with R ratio equal to − 1. The frequency of the cyclic loading was maintained at 30 Hz for the duration of the test.
The round fatigue samples deposited entirely using LENS were first sectioned vertically through the central plane (i.e. x–z plane) to observe the microstructure. Owing to the large height, the sample was further cut horizontally into two parts to enable mounting on a 38.1 mm (1.5″) press.
The microstructure of the deposited build and the fracture surface were analysed using optical microscopy and scanning electron microscopy (SEM). An Olympus GX51 optical microscope was used to record the images of the sectioned fatigue built after polishing and etching. The microstructure and fracture surface were studied using an ESEM 200 scanning electron microscope. For fractography, the samples were sectioned 12.7 mm (0.5″) away from the fracture surface and mounted on a 12.7 mm (0.5″) diameter stage using a two-way carbon tape. Conducting graphite paint was used to cover the adhesive in the exposed region of the tape.
Results
Microstructure
As deposited samples
The microstructure of the as deposited round part is shown in Fig. 4. Since the hatch path is symmetric about the central axis, no difference in microstructure is expected based on the vertical plane of sectioning through the centre.
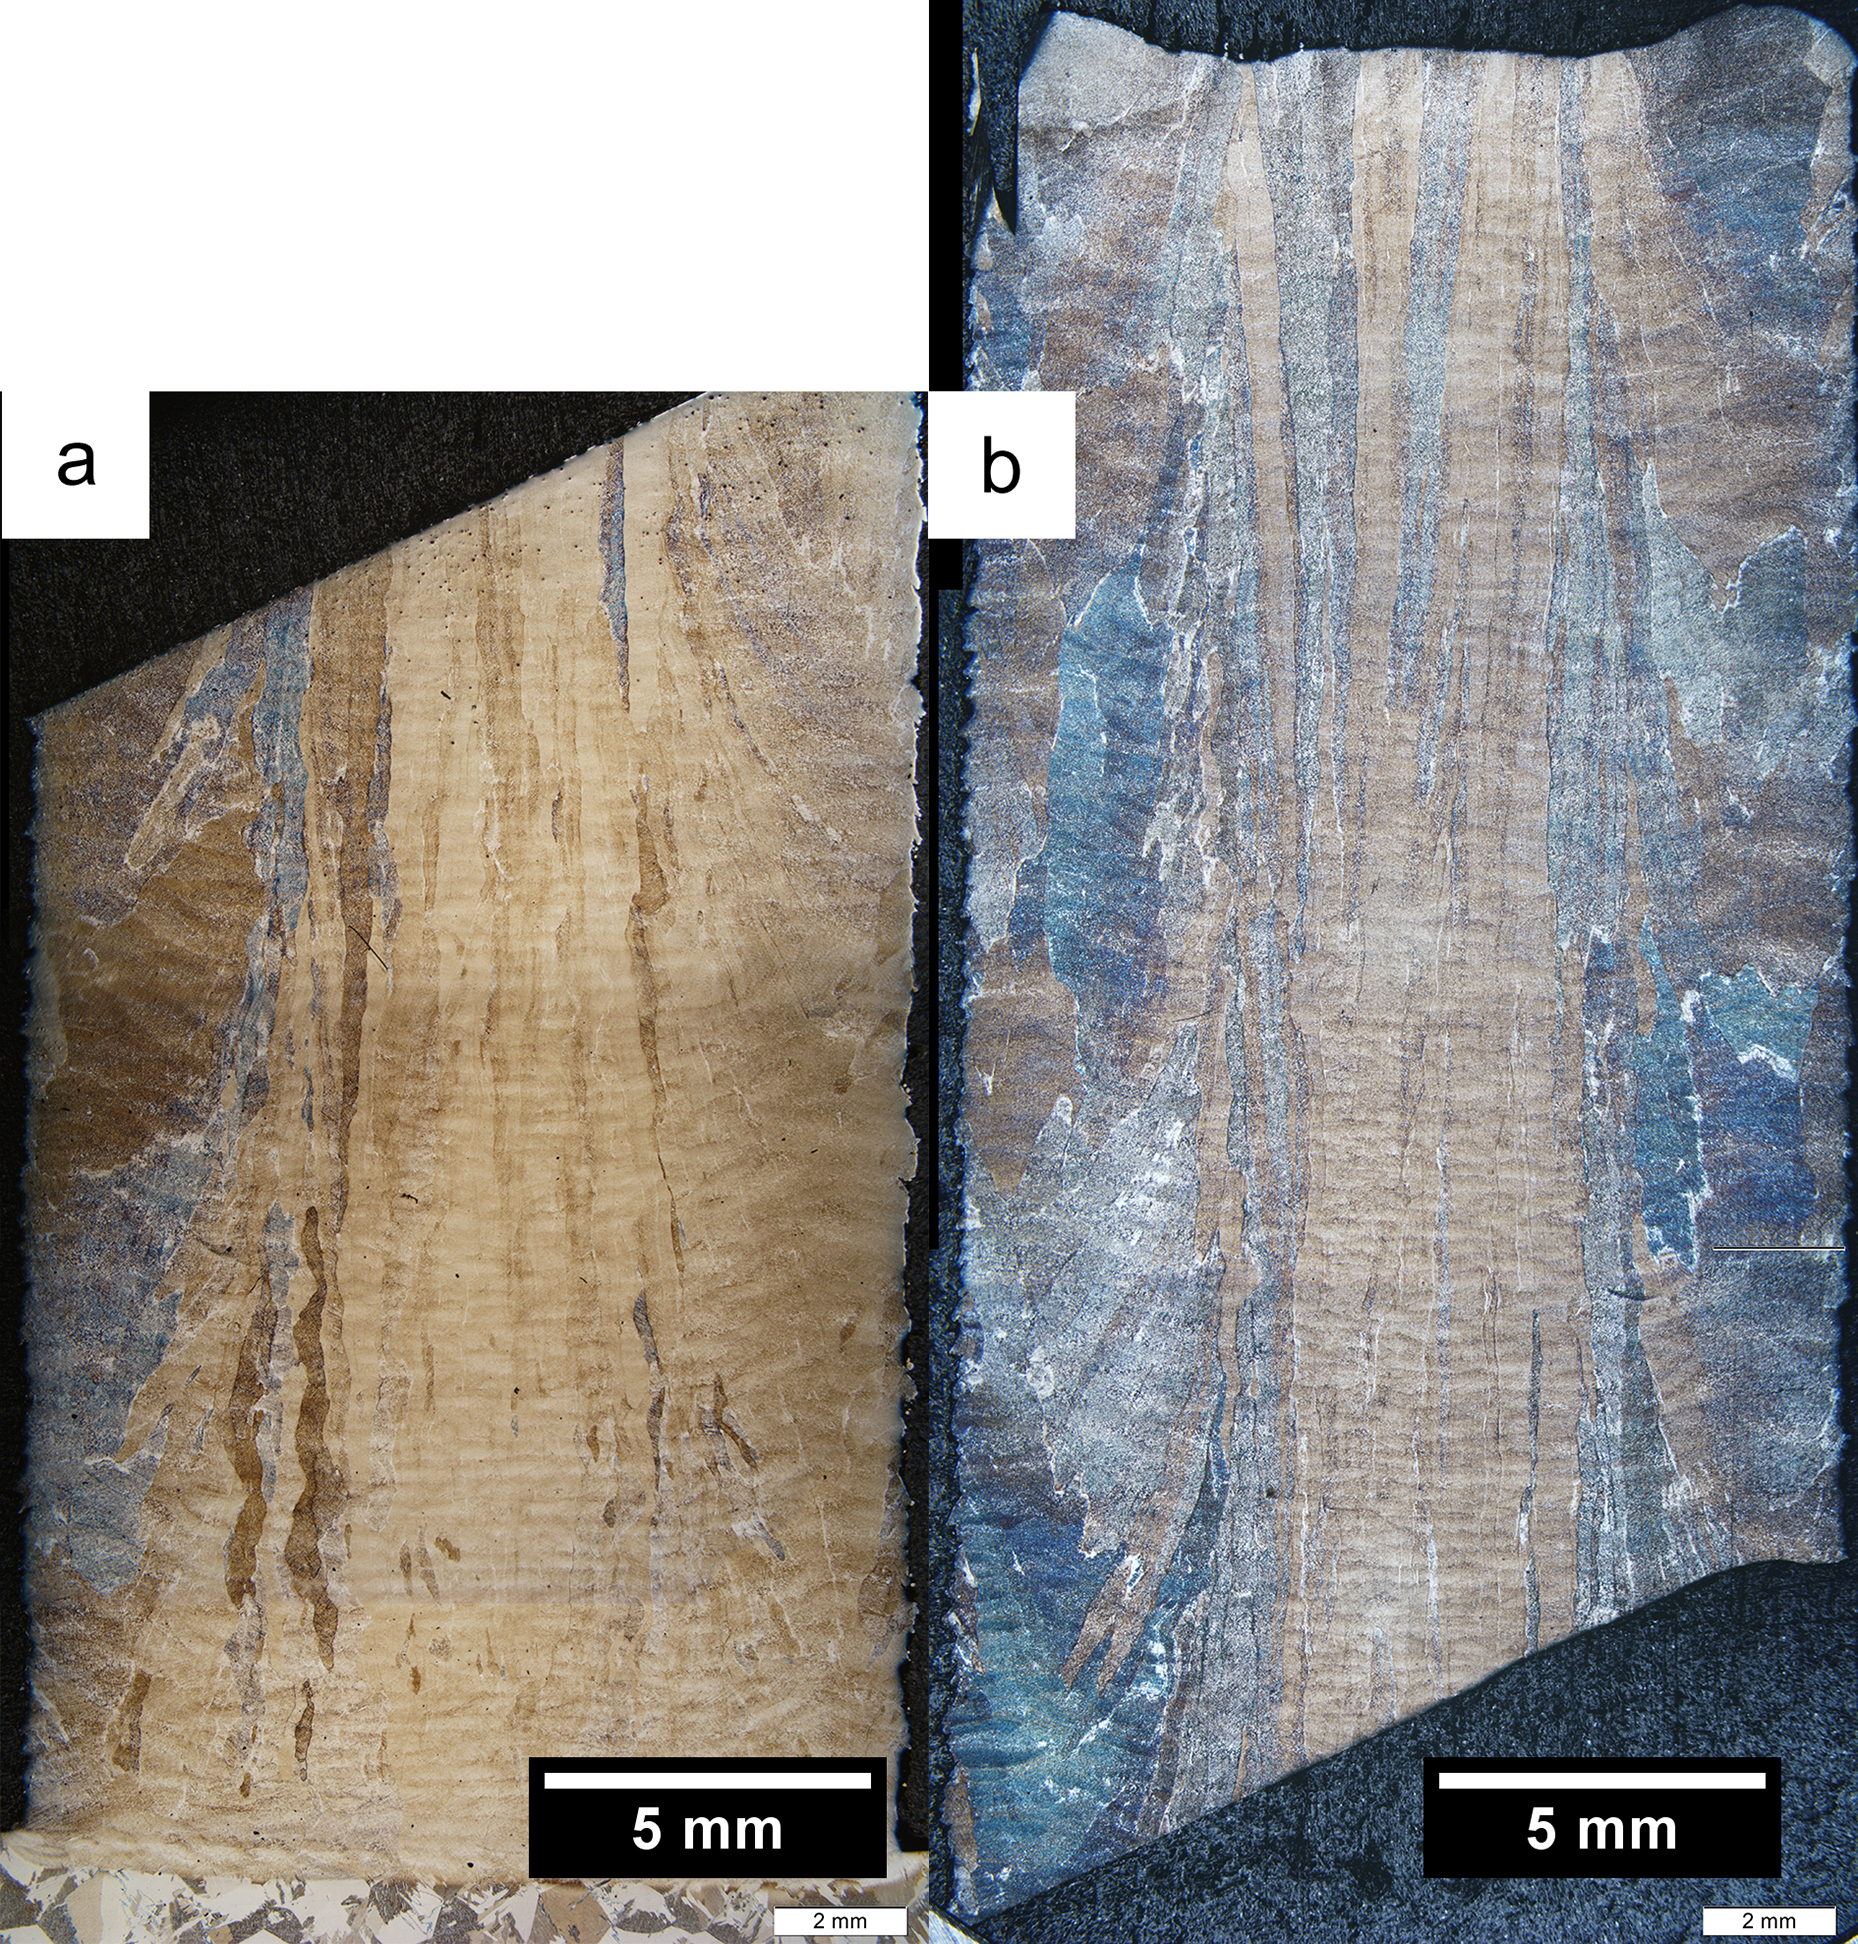
a bottom piece and substrate; b top piece
The sample shows no observable ‘lack of fusion’ porosity based on optical microscopy performed at midsection along the x–z section. Prior-beta grains at the base of the sample grow epitaxially directed towards the centre of the build. The substrate's prior-beta grain size is much larger, and thus, the initial prior-beta grain size is not directly correlated with the substrate grain structure alone in the present case. Beyond a build height of ∼7 mm, a steady state in the grain structure is reached. A central column of relatively thin prior-beta grains epitaxially grows vertically upwards, surrounded by coarser grains on the periphery. The central column widens closer to the top of the sample.
Figures 5 and 6 show the microstructure in higher magnification SEM. The backscattered electron micrograph (Fig. 5) of the interface between the substrate and the sample shows that the location of the original interface lies along the solid line. The melted region of substrate extends up to a depth of 500–650 μm. Lack of fusion porosity is absent in this region of the sample. A few fine ‘gas pores’ exist in the deposit as well in the melted region of the substrate (marked by squares in Fig. 5). The size of this porosity is < 30 μm in diameter.
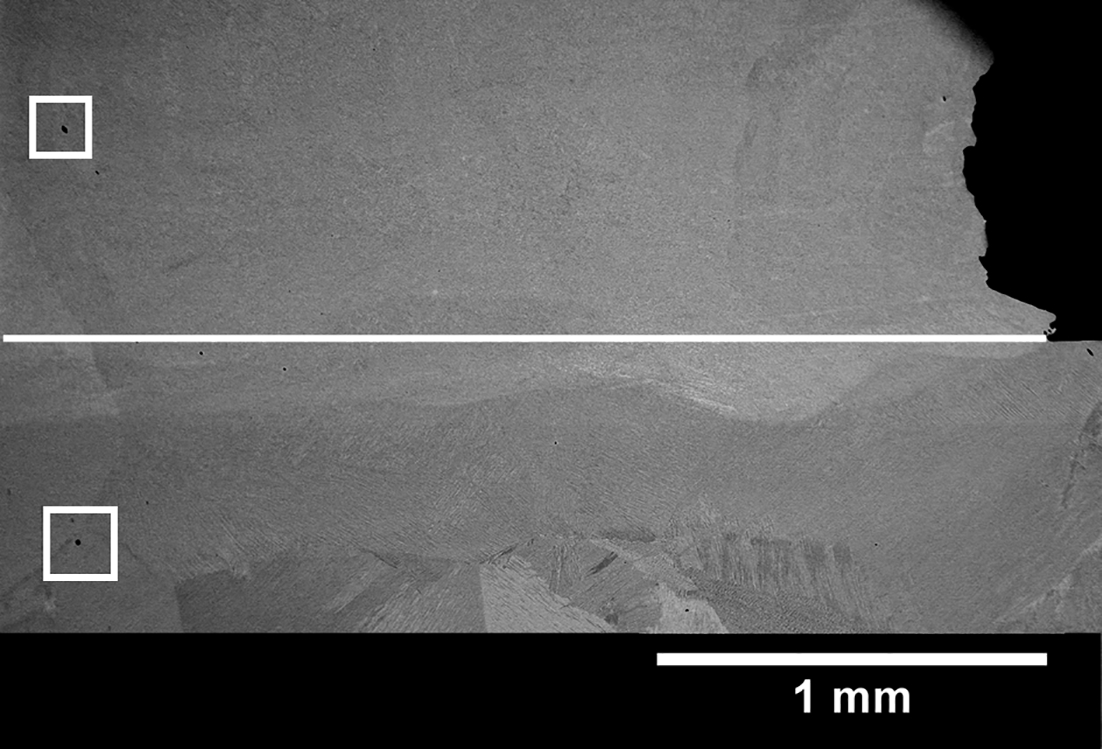
SEM macrograph captured close to substrate/build interface
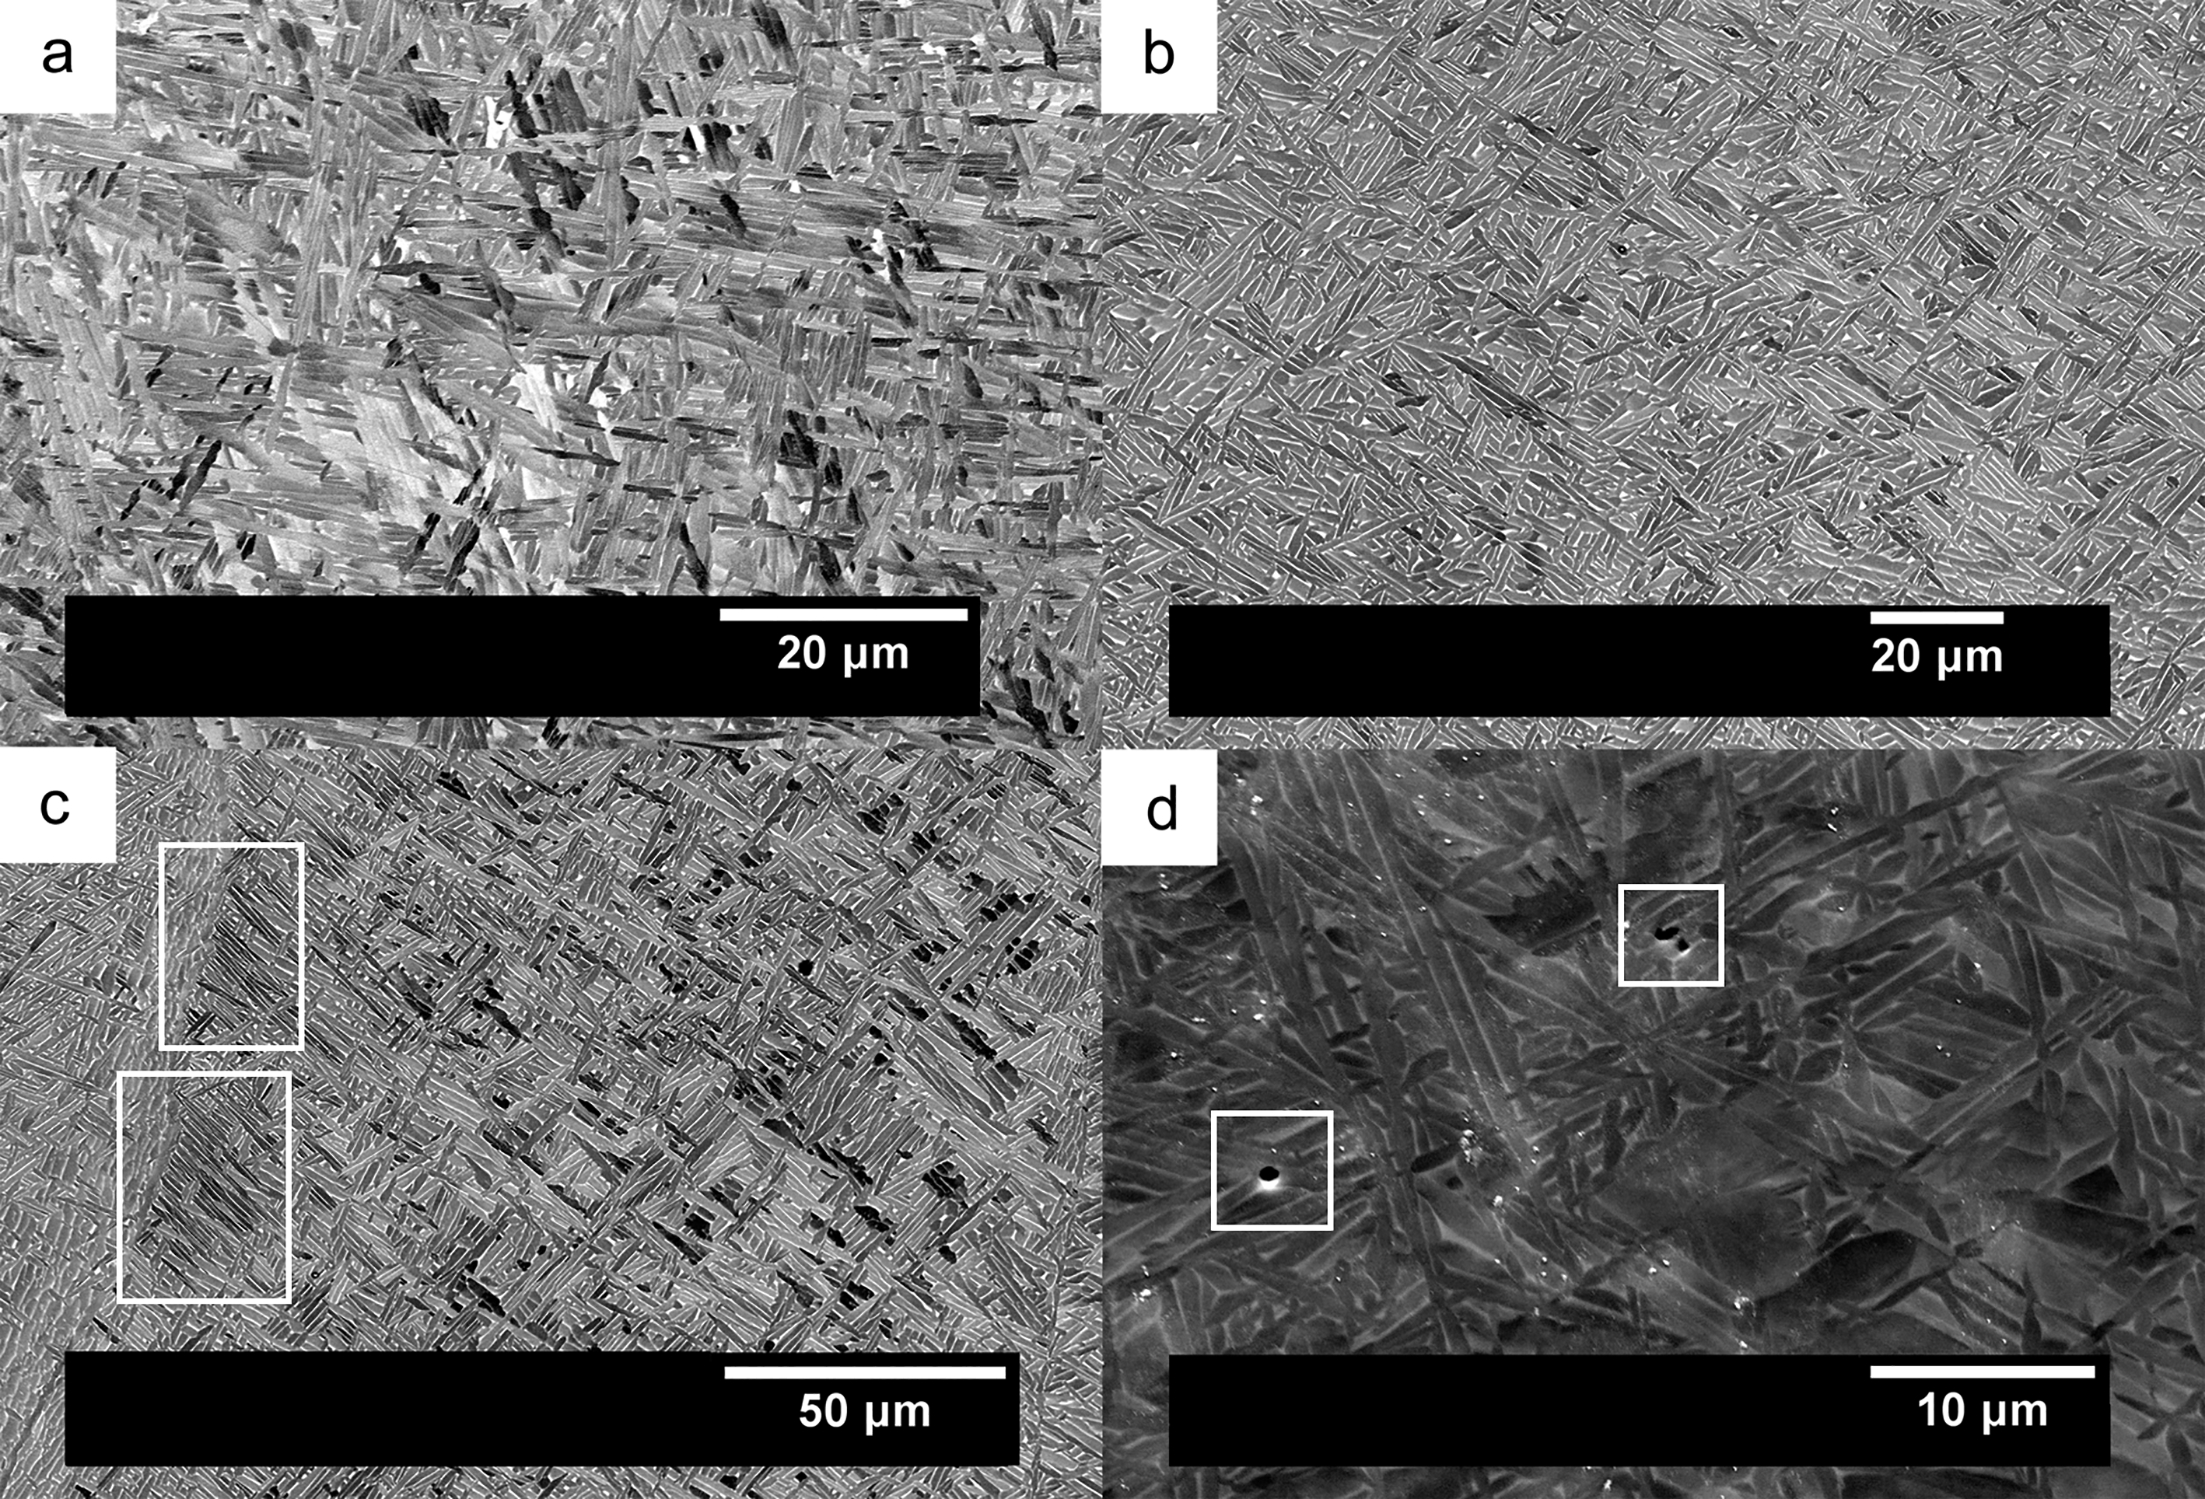
a–d microstructures observed from interface region to top of as deposited sample
The microstructure of the bulk of the build is shown in Fig. 6a–d. The images are arranged in increasing order of height from the substrate. All the images show a predominantly basketweave microstructure at all locations in the build. Comparing Fig. 6a to d, it can be seen that the alpha lath size is similar at all locations. Small fractions of colony alpha can be observed in isolated regions along GBs in the central regions of the sample as marked by the rectangular boxes in Fig. 6c. The alpha colonies are ∼10 μm wide and 20 μm in length. Gas porosity is observed to occur at random locations in the sample, as marked by the rectangles in the zoomed in image in Fig. 6d. The size of this porosity is smaller than the gas porosity observed earlier under optical microscopy and is of the order of the alpha lath width (∼1 μm).
Repair condition samples
The macrograph of a sample containing a joint between a LENS deposited section and a wrought base metal is shown in Fig. 7. The LENS deposited section was built on a wrought substrate. During this deposition, two arms of the base (wrought) metal were present on either side of the build. The laser path was designed to deposit metal such that joining was achieved between the LENS section and the base metal arms simulating a case of repair.
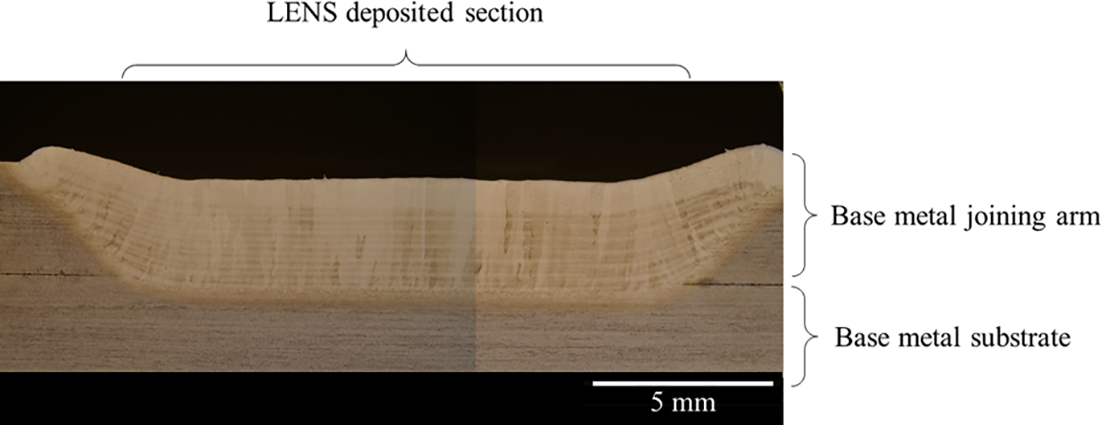
Macrograph of laser deposited section of joined sample (stitched image)
The microstructure near the interface between deposit and substrate is shown in Fig. 8, where epitaxial growth of grains is observed to occur from the substrate. A fine grained zone is formed at the base of the epitaxially growing columnar grains. A similar epitaxial grain growth is also seen to occur from the interface between the LENS deposited section and either arm of the wrought metal. The grains widen as they grow epitaxially in the z direction, consistent with the nature of grain growth.
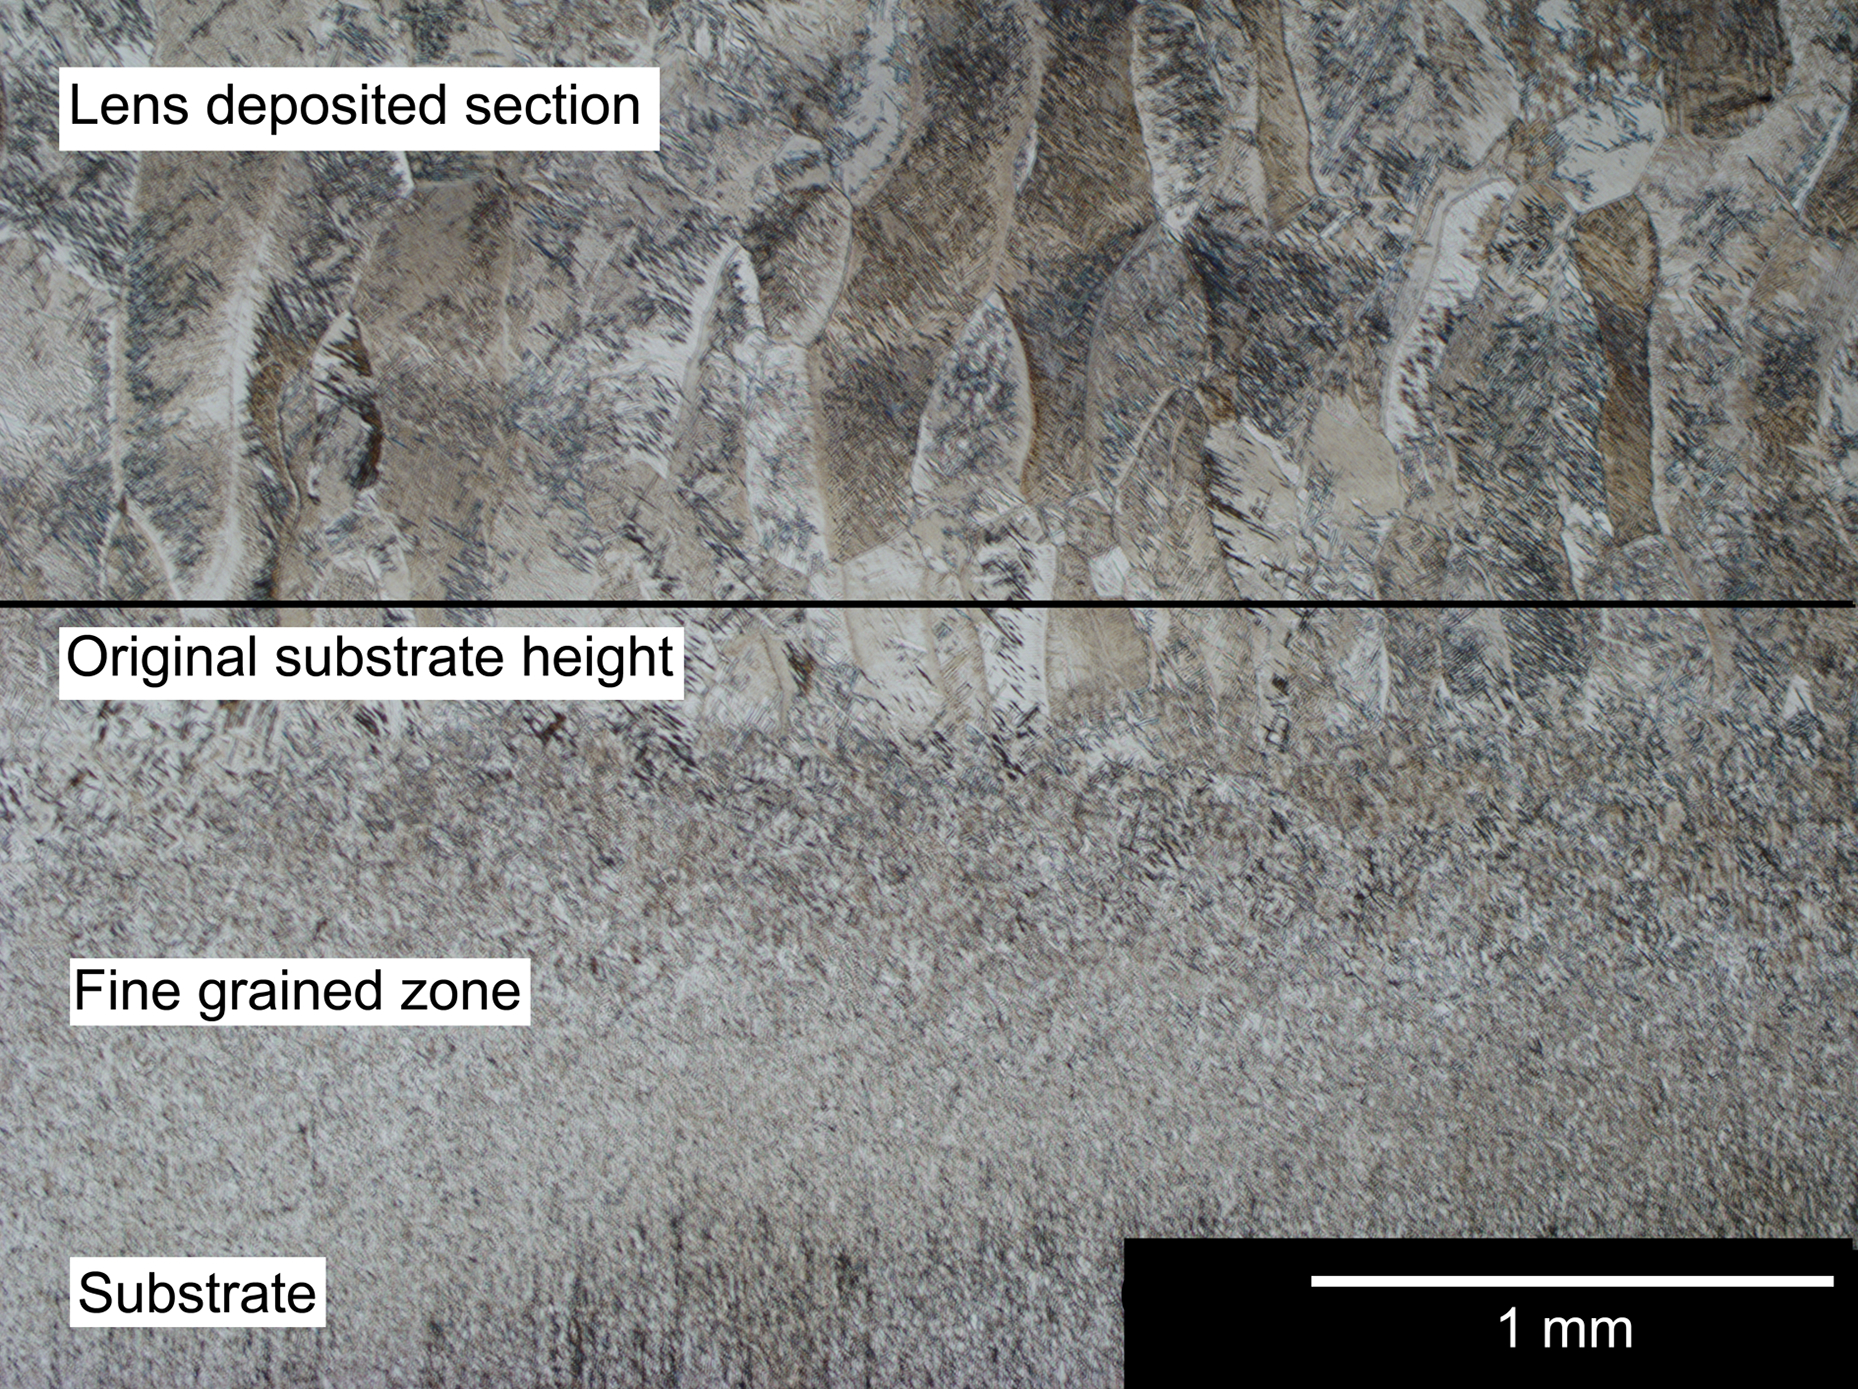
Epitaxial grain growth observed at substrate in LENS section
The optical images of microstructure of the LENS deposit are shown in Fig. 9a–d. The microstructure is found to be a combination of basketweave, colony and a small fraction of GB alpha microstructures. Despite the almost identical processing parameters and powders used, the LENS deposit on the wrought substrate (Fig. 9) exhibits a grain structure that is markedly different from the deposit on the cast substrate (Fig. 6). Such difference in final microstructure is mainly attributed to the large prior β grain size due to epitaxial growth of grains inherited from the coarse grained cast substrate. As discussed previously, large prior β grains promote nucleation for a basketweave microstructure.
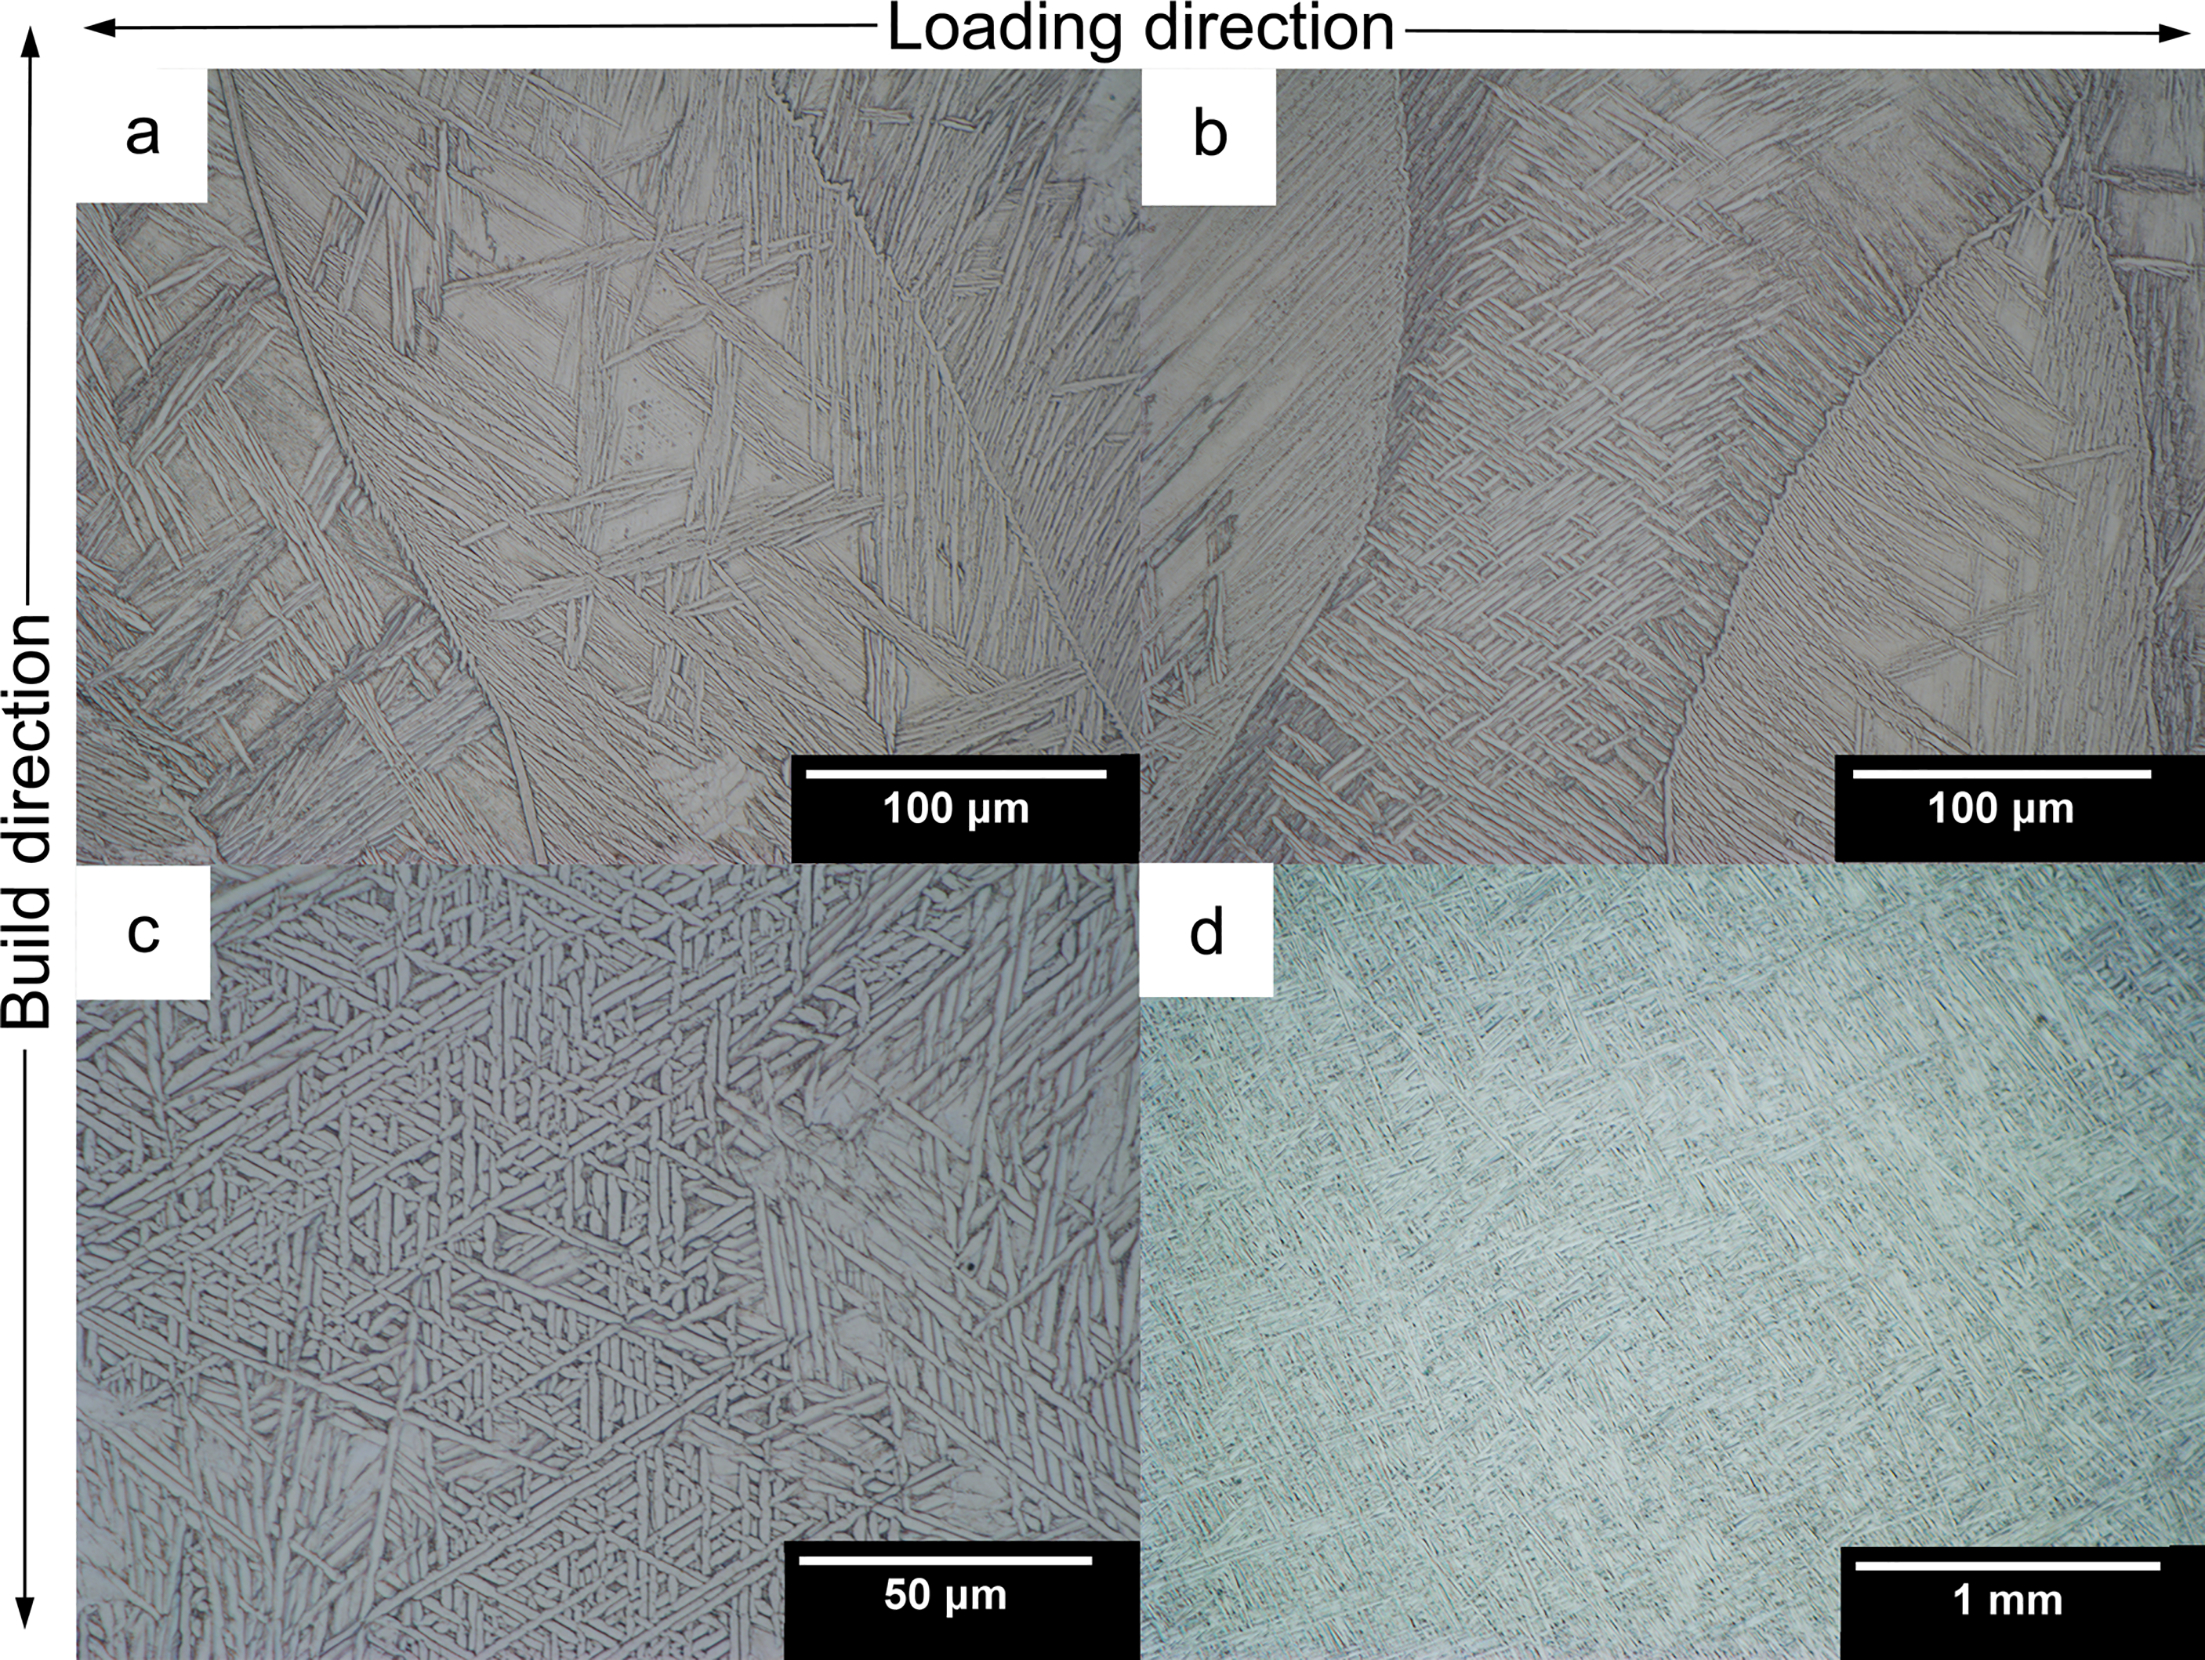
a–d basketweave and colony microstructures seen in sample cross-section with increasing distance from base; fatigue loading direction is horizontal relative to micrograph
Fatigue performance and fractography
The results of the fatigue test and fractography are summarised in Fig. 10. The results are overlaid on previous data published by Makiewicz 11 and Kobryn and Semiatin. 18
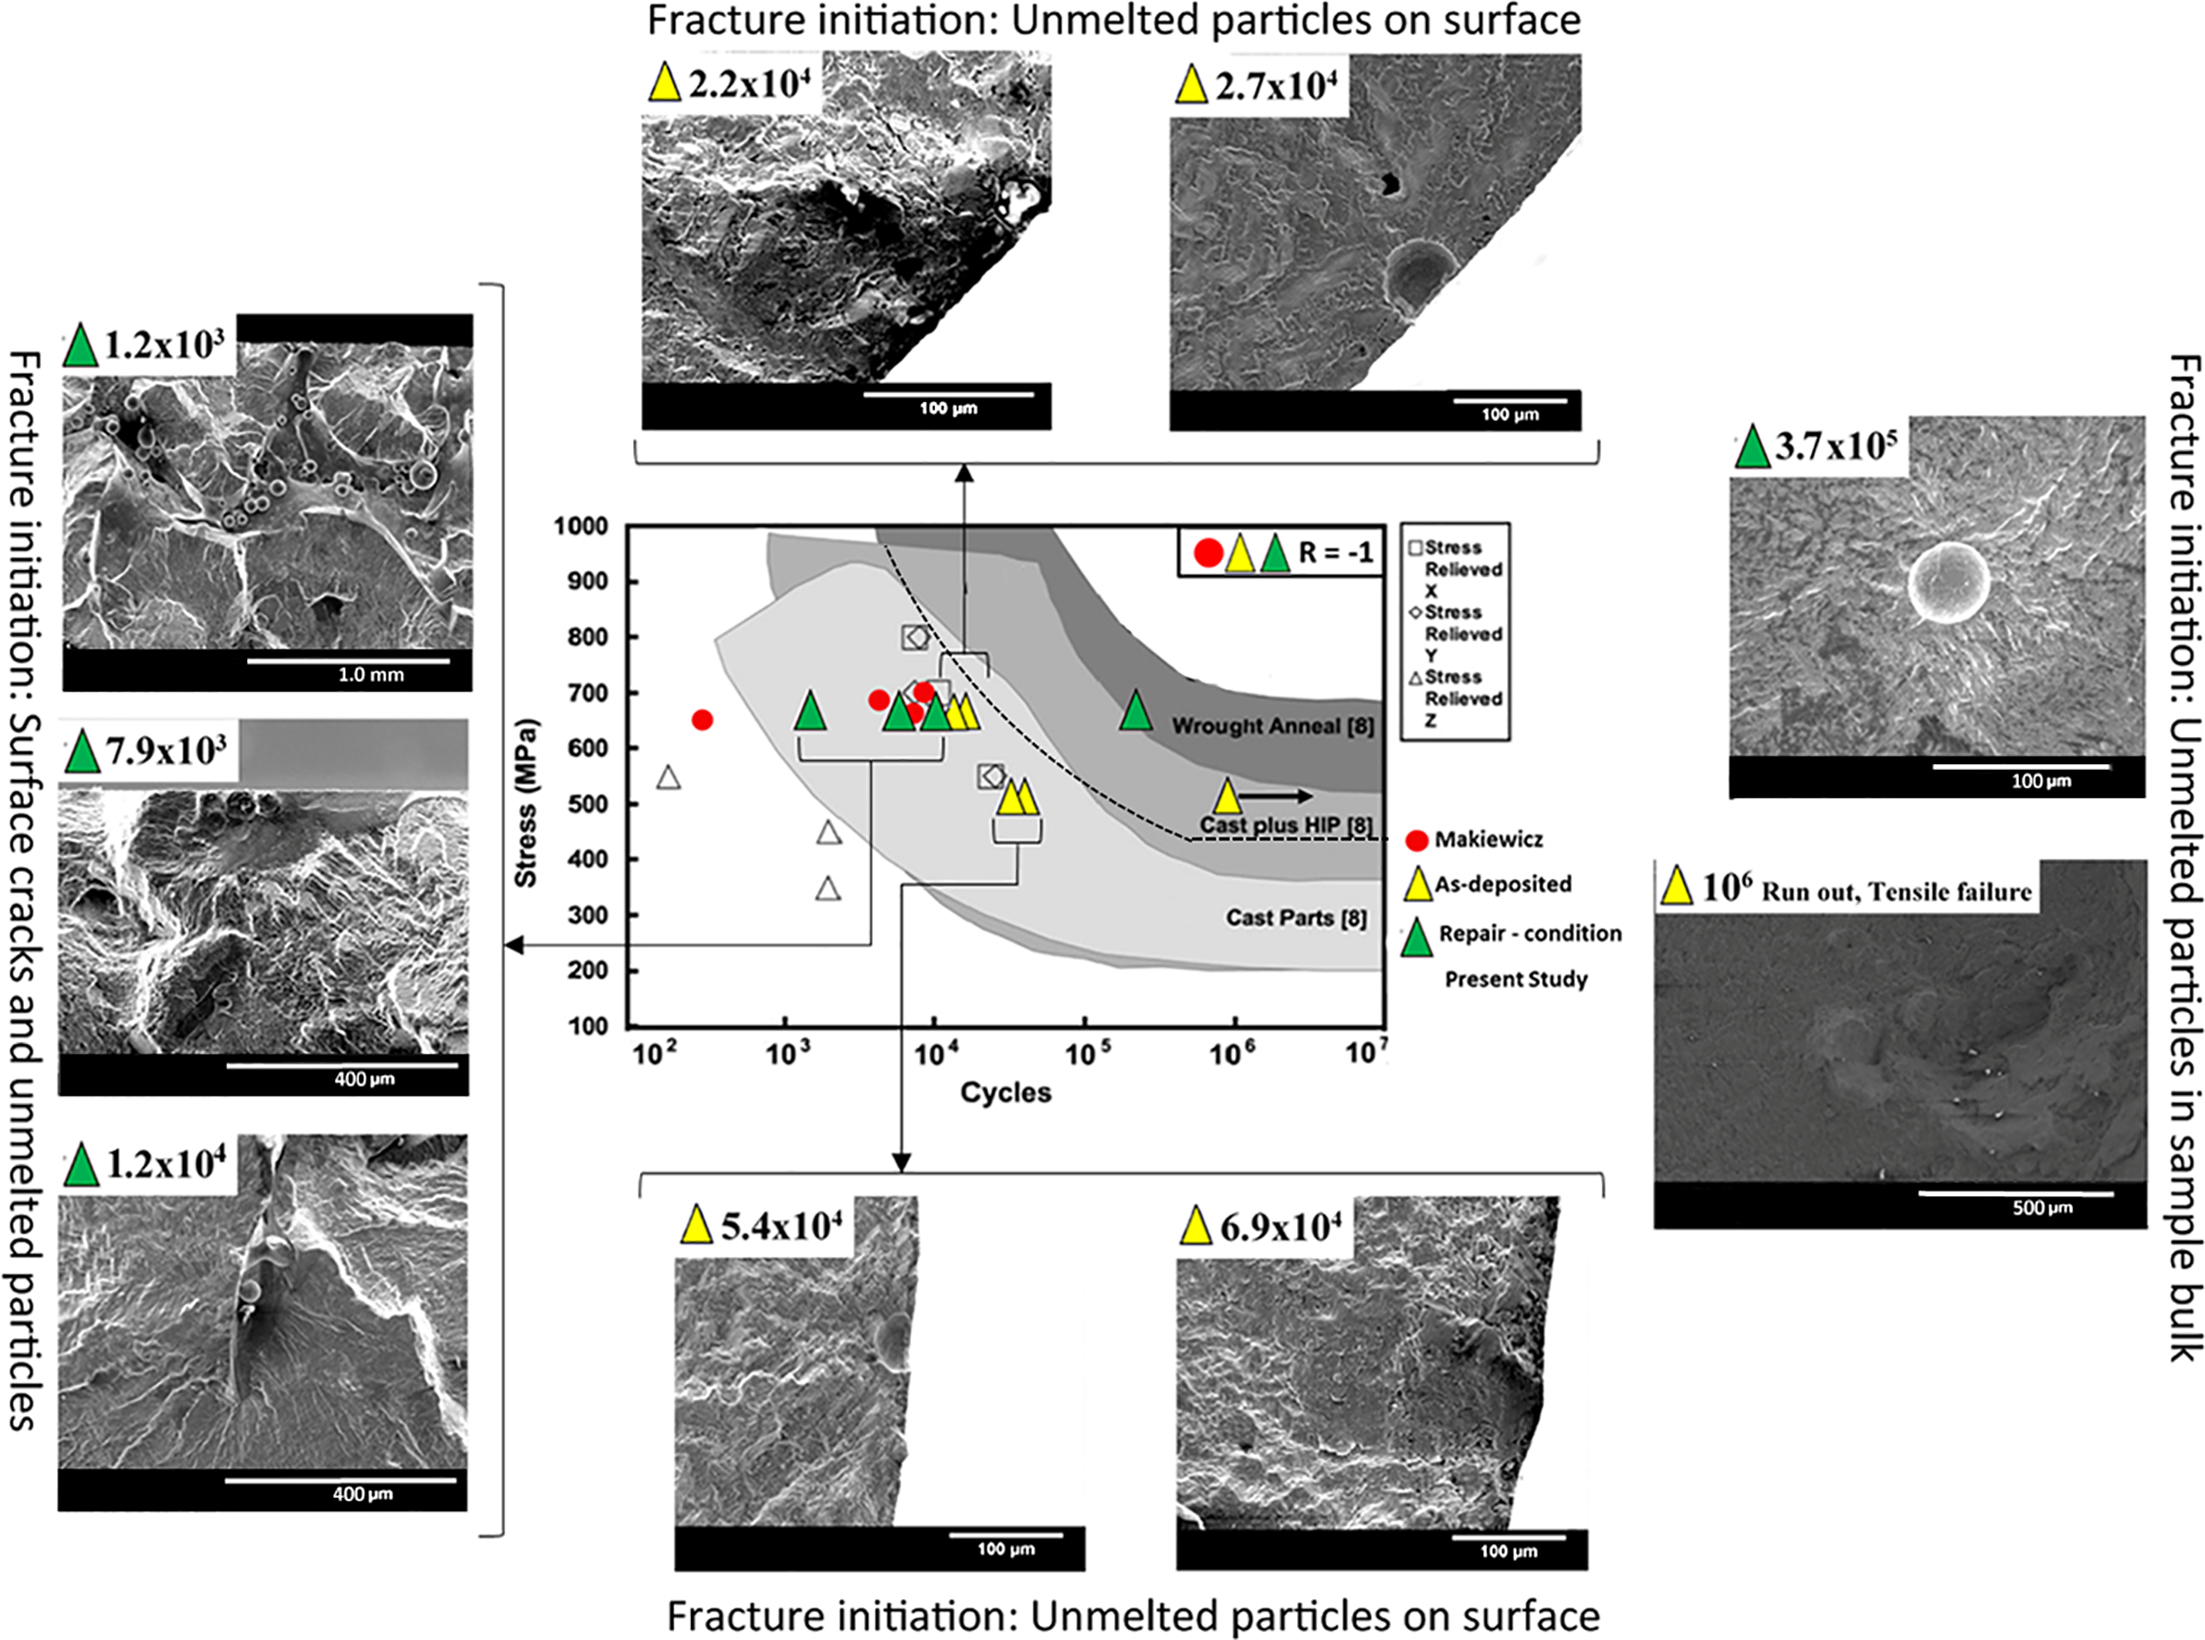
Comparison of fatigue performance of samples fabricated by different processes; baseline plot is adapted from Kobryn et al. 18 ; dotted line marks lower bound of fatigue properties in wrought anneal condition; cast+HIP region also overlaps with cast property range; Ti–6Al–4V builds deposited using new parameter set had properties comparable to cast+HIP and lower bound of wrought anneal condition
The fatigue life of the samples strongly depends on the applied stress. The ‘defect free’ as deposited samples (marked by yellow triangles) built in the present study consistently outperform those in the previous study by Makiewicz. 11 Among the samples tested at 500 MPa, one sample reached run out at 1 million cycles, and the test was stopped. Other samples tested at this stress level showed a fatigue life of 5.4 × 10⁴ and 6.9 × 10⁴ cycles. The as deposited samples tested at 650 MPa showed lower life in comparison to the samples tested at 500 MPa and are observed to fail at 2.2 × 10⁴ and 2.7 × 10⁴ cycles.
The fatigue life of the repair condition samples is plotted (green triangles) for comparison (Fig. 10). Owing to limited samples, the tests were done only at 650 MPa. The properties are lower than the samples created solely using the LENS process. The typical fatigue life is observed to lie from 1200 and 12,000 cycles. However, one of the samples is observed to have significantly better properties in comparison and displayed a fatigue life of 374,000 cycles before failure.
The fracture surface of the fatigue failed samples is also plotted in Fig. 10. The fracture originates at the surface of each of the as deposited tested sample. Note that the surface of the tested sample is not that of the original build, since the sample has been machined to the shape required for testing. A circular empty feature or the presence of an unmelted particle is invariably observed at the location of fracture initiation for all as deposited samples irrespective of the stress applied for testing. The size of the circular features and particles lies within the range of powder size utilised for deposition.
The fracture surface of as deposited samples has a flaky appearance close to the point of initiation and shows the presence of fatigue striations. In subsequent regions of crack propagation, the surface is blockier in nature until the shear lip is reached. The shear lip shows a dimpled surface characteristic of a ductile failure by void coalescence. These features are shown in Fig. 11a and b.
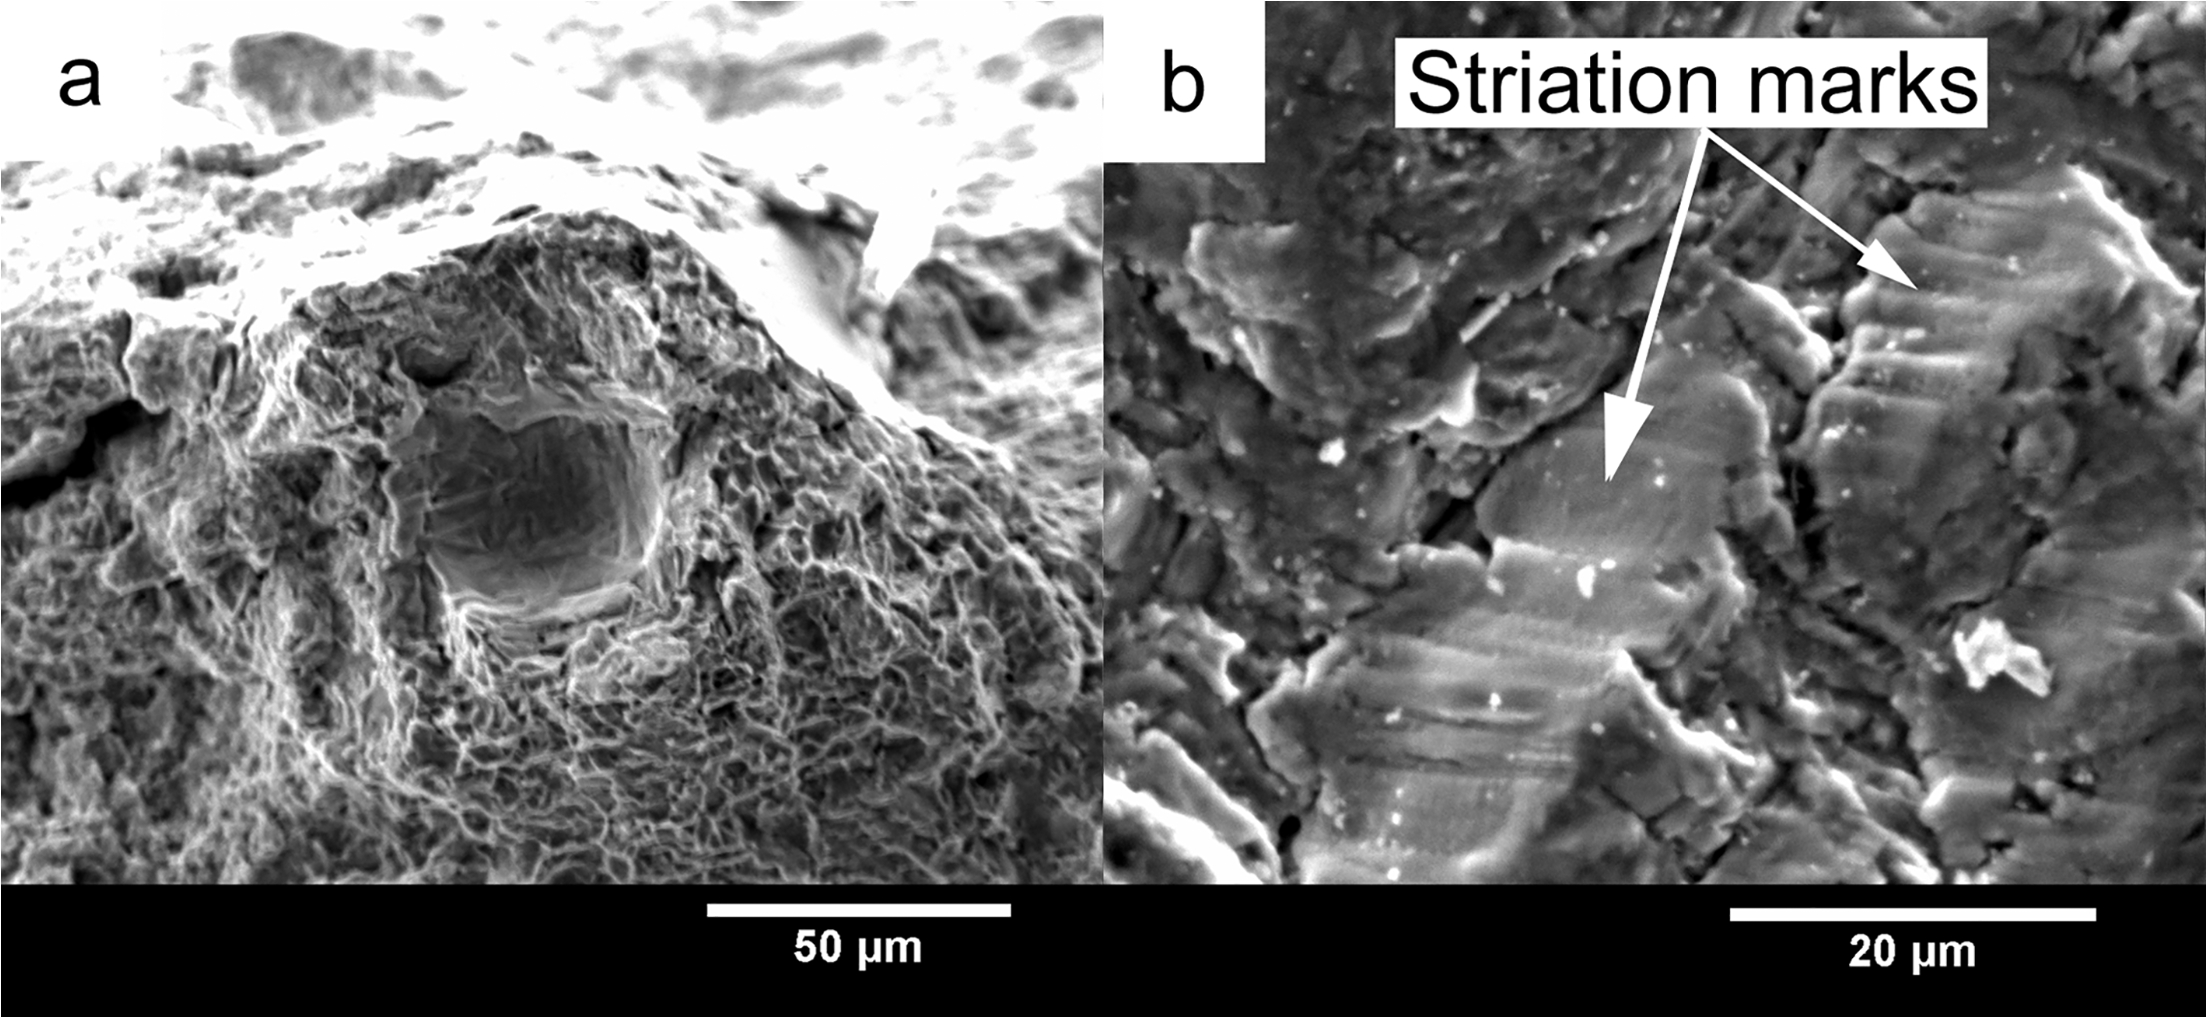
a unmelted particle embedded in bulk of sample failed after 2.7 × 10⁴ cycles; b flaky structure close to crack initiation point seen in sample failed after 2.2 × 10⁴ cycles; fatigue striations spaced ∼0.9 μm apart are indicated by red arrows
In contrast, the fracture in the repair condition samples (green triangles) with low cycles to failure do not show a clear crack propagation area followed by a shear lip as seen in the case of the as deposited samples. The surface of these samples shows multiple defect regions. As seen in Fig. 10, the failure is initiated from unmelted particles or from surface cracks found to encase unmelted particles. Grooves containing unmelted particles are also seen in the sample bulk as shown in Fig. 12a. Certain regions of the sample show peculiar stepped shaped features of the order of size of the original powder particles used for deposition (Fig. 12b).
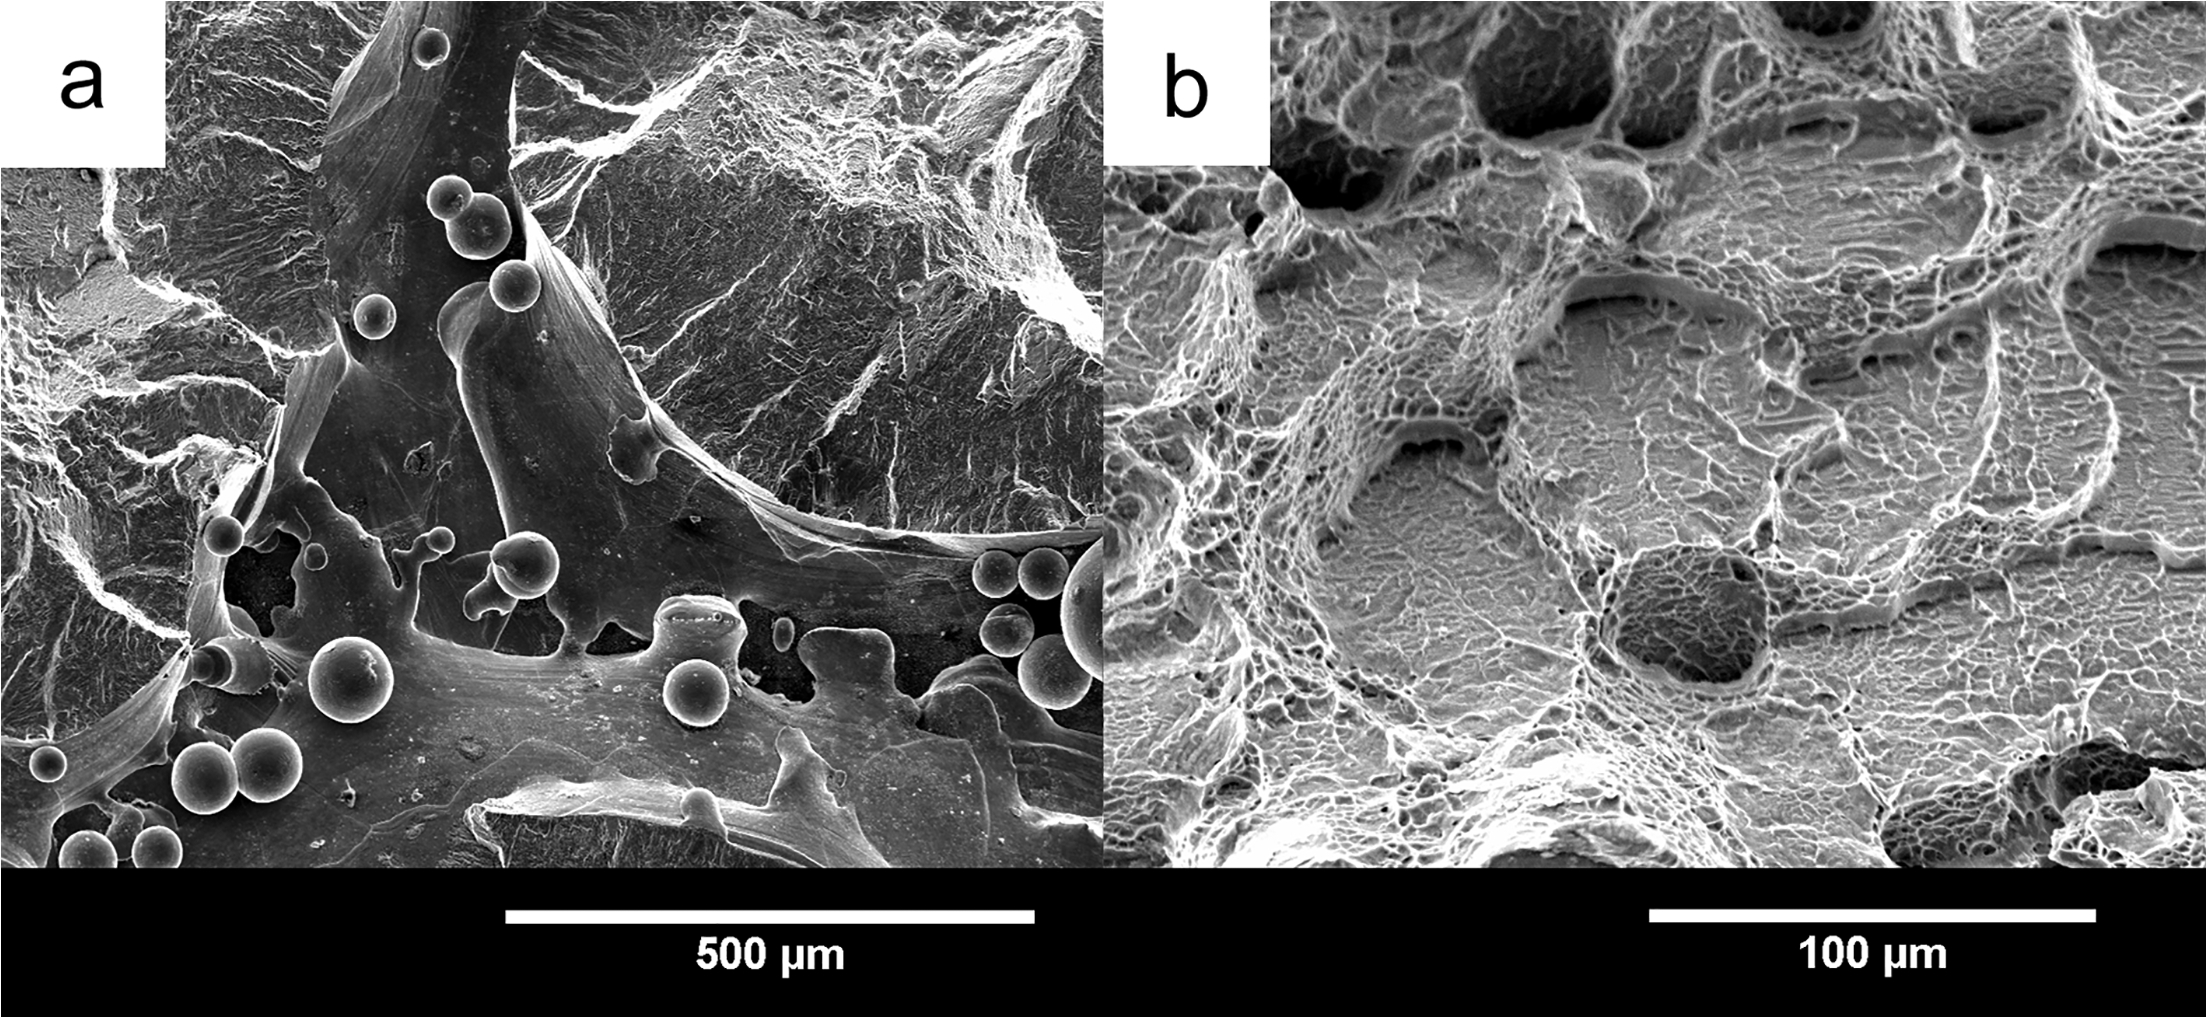
a cavities holding unmelted particles at arm/deposit interface (1.2 × 10³ cycles); b stepped regions observed on fracture surface (7.9 × 10³ cycles)
The process parameters in the build process were optimised to minimise gross porosity in the sample based on trial and error examination of limited sections in optical microscope. In other words, some defects could escape notice with the limited, random sampling during process development. On the other hand, the fatigue testing and failure preferentially puts a spotlight on defective regions, which are then prominently observed on the fracture surface of tested samples under SEM.
The repair condition sample (green triangle, 3.7 × 10⁵ cycles) with high fatigue life shows crack initiation at the centre of the sample in the bulk region. A higher magnification view of this sample seen in Fig. 10 shows an unmelted particle present at the centre of the sample. However, no unmelted particles are seen at any other location on the fracture surface. The fracture structure of the surface progressively moving away from the particle displays a similar change as the as deposited samples. A flaky region is followed by a blocky region in the crack propagation area. A shear lip with dimpled surface is also observed towards the edges of the sample.
The as deposited sample with fatigue life >106 cycles was tensile tested to failure following run-out in the fatigue test. The fractograph of the fracture surface is seen in Fig. 10 (yellow triangle) and shows that the location of crack initiation lies in the sample bulk. In the tensile test, the sample reached a maximum tensile stress of 970 MPa at a strain of 7%.
Discussion
Microstructure evolution
The as deposited samples show a nearly complete basketweave microstructure known to be beneficial to fatigue life in comparison to colony microstructure. Interlayer ‘lack of fusion’ porosity is absent. Colony alpha occasionally presents in the middle and top portions of the build. The width of alpha laths is consistently ∼1 μm throughout the height of the build. This is in contrast to the microstructure observed by Makiewicz 11 on two counts. First, the alpha laths are finer (∼0.9 μm in width as against 2–3 μm), and second, lower regions do not exhibit any measureable colony microstructure in the current build. To achieve a higher fraction of basketweave alpha microstructure, Makiewicz 11 processed the samples above the beta transus during deposition and allowed them to cool below the transus only at the end of the LENS process. Possibly, a lower cooling rate in the set-up may be responsible for the larger lath width. However, the microstructure of the ‘repair condition’ sample shows a transition from a colony to basketweave along the height of the build, similar to that observed by Makiewicz. 11
The evolution of the grain structure as seen in Fig. 4 depends on the pattern of heat flow in the deposit. The cross-section of this LENS deposit shows a central region of thin, long columnar prior-beta grains oriented parallel to the build direction and surrounded by coarser prior-beta grains growing inwards. A similar grain structure has also been observed by other researchers in related AM processes.25, 26 Antonysamy 25 studied a similar grain structure in thin walled structures in the selective laser melting process and concluded the dependence of the peripheral grain structure on nucleation behaviour during the contour melting pass. Nucleation from the surrounding powder and the elongated shape of the melt pool during the contour pass were observed to contribute to the formation of the peripheral structure. 25 However, in the present case, the same structure develops without the presence of surrounding powder nucleation sites. Therefore, it is mainly the direction of heat flow and the melt pool shape that is responsible for this grain structure.
Fatigue life and role of defects
The lower bound of fatigue properties (Fig. 10) in both sets of tests in the present study exceeds the properties reported for stress relieved samples by Kobryn and Semiatin 18 and the upper limit of properties reported by Makiewicz. 11 This may be due to a better control of porosity defects in the present work. The number of cycles to failure of both sets of samples lies in the range of fatigue life seen for cast+HIP samples and close to the lower bound for the fatigue life in the wrought anneal condition, except for one sample from each set lying in the middle of wrought anneal. The lower bound of wrought anneal condition is marked by a dotted line in Fig. 10. It should be noted that the as deposited samples have been tested along the weaker z direction, while the repair condition samples have been tested along the x direction. Since the samples are tested at an R ratio of − 1, the properties are potentially the best case scenario for the respective loading direction.
The fractography results reveal that the location of crack initiation is the important determinant of fatigue life in the LENS deposits. In the absence of major crack or lack of fusion defects, the crack is initiated from unmelted particles present either on the exposed surface of the sample or in the bulk. This is valid for both the as deposited and the ‘repair condition’ samples. The size of these particles is larger than any gas porosity observed in the sample through SEM or optical micrographs. The samples with cracks initiating in the bulk display orders of magnitude higher fatigue life than those with cracks initiating at the surface. For samples with a similar location of failure initiation, the as deposited samples show lower scatter compared to the repair condition samples. This may be due to greater uniformity in the microstructure and lower defects in these samples.
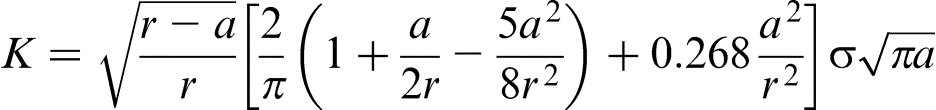
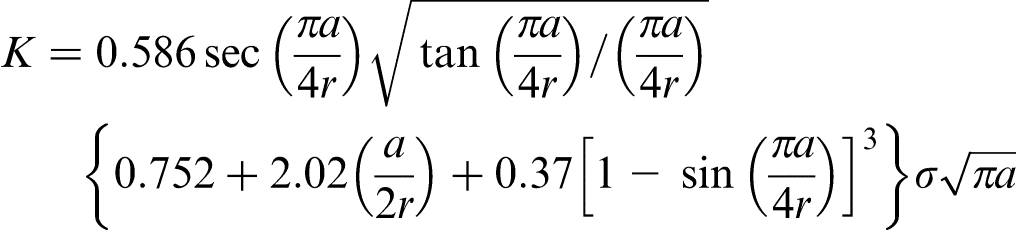
The unmelted particles lead to stress concentration and can act as preexisting defects. Thus, crack initiation is expected to occur easily at the applied stresses and crack propagation controls the extent of fatigue life. The SIF (KI) is an indicator of the ‘driving force’ for the crack propagation. The correlation between KI and the crack growth per cycle has been experimentally characterised by Ritchie et al. 9 and Yuen et al. 27 In the present work, the SIF is calculated by approximating the geometry of the as deposited samples to a cylindrical bar and that of the repair condition samples to a two-dimensional plate with surface and centre cracks. The SIF for the repair condition is calculated using equations summarised by Liu. 28 The published formulae used for as deposited samples are as shown below:
K (MPa m1/2) for round bar, centre defect
29
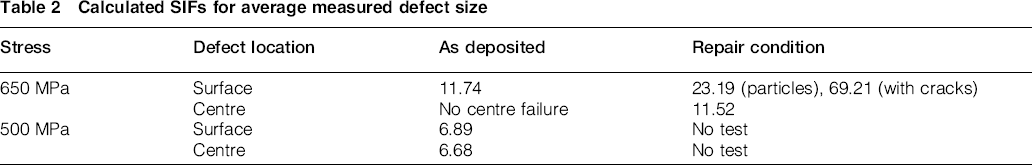
Calculated SIFs for average measured defect size
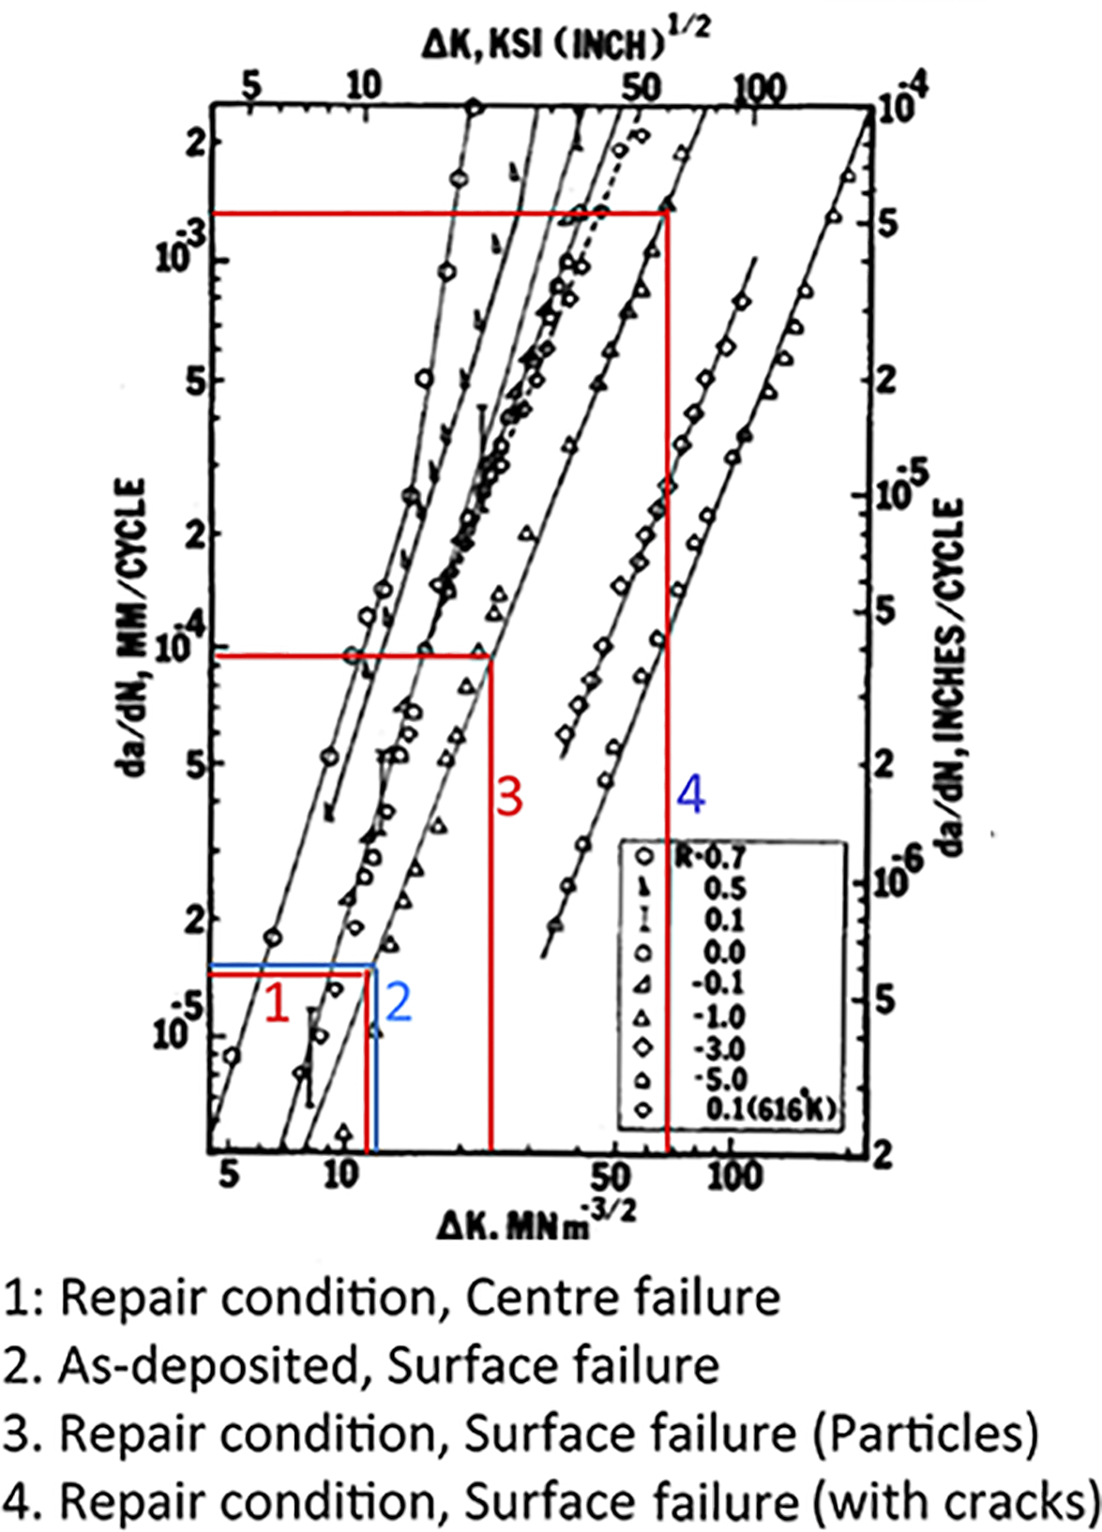
Growth rates expected at calculated SIFs for average defect size in as deposited samples (blue lines) and repair condition samples (red lines) when tested at 650 MPa (R = − 1)
The repair condition samples with surface cracks are calculated to have order of magnitude higher crack growth rate as compared to other samples in this study. This is borne out by experimental observations with the fatigue life of these samples averaging only ∼7000 cycles before failure. In comparison, the growth rate in the repair condition sample for cracks emanating from the sample bulk is lower by an order of magnitude, correlating with the significantly higher experimentally observed fatigue life of 3.7 × 10⁵. In the as deposited samples, SIF is expectedly higher at a stress of 650 MPa, which correlates with the lower experimentally observed fatigue life compared to the testing at 500 MPa.
Although one of the fatigue samples achieved run-out at 106 cycles, in a subsequent tensile test, the failure originated from the bulk of the sample. In a round bar for the present case, the calculated SIFs for defect located in the bulk versus surface show a very small difference, inadequate to explain the large jump in fatigue life observed in the experiment (Table 2). It is therefore possible that additional phenomena exist leading to higher fatigue life in case of crack initiation from the sample bulk. Creation of the fatigue sample requires machining of the material. The machining process may dislodge the incompletely melted particle at the surface. In contrast, the unmelted particles in the bulk are not affected by machining and may retain some degree of existing continuity with the bulk in the machined state. In such a condition, the particle at the surface may become more prone to crack initiation at an earlier stage in the loading as compared to a sample in the bulk. Second, unlike unmelted particles in the bulk, the surface particles are exposed to an atmospheric environment. Crack propagation rates in Ti–6Al–4V are higher when exposed to the atmosphere as compared to a vacuum environment.9, 16 The crack propagation from surface defects in the present samples is prone to this effect and can contribute an additional reason for quicker failure of samples with surface defects.
In the present analysis, preexisting residual surface stresses from machining have been ignored. A second assumption in this calculation is the neglect of influence of other randomly distributed internal defects on the ‘actual’ stress intensity in the bulk or surface. In the repair condition, the builds exhibit failure at the weld interface between the wrought arm and the LENS deposit in each tested sample. With the exception of the outlier sample, severe defects such as cracking and lack of fusion are easily observed on the fracture surface as shown in Fig. 12a. The higher severity of defects in these samples leads to a shorter fatigue life in comparison to as deposited samples. Such features are not observed in the sample with good fatigue life, although the macroscopic location of failure is unchanged. Therefore, while interface defects were present in this sample, a significant improvement in fatigue life is obtained once severe lack of fusion or surface unmelted particle defect is avoided.
The set of repair condition samples tested at 650 MPa and the set of as built samples tested at 500 MPa show a large scatter in the number of cycles to failure. In both cases of the as deposited and repair condition samples, one sample demonstrates an order of magnitude longer fatigue life comparable to wrought material properties. Since the processing conditions are identical, this large difference indicates that physical defects are the predominant factor as compared to the microstructure in determining the fatigue life of the samples.
In summary, since AM processes are prone to crack initiating porosity defects, control of the subsequent crack growth rate may offer a possible solution to improvement of fatigue life. In this work, a microstructure desirable for retarding crack growth is successfully achieved and a potential direction to improve fatigue lifetimes by minimising the porosity at surface or subsurface regions through the control of processing parameters is seen to emerge.
Conclusions
LENS deposited Ti–6Al–4V was investigated for high cycle fatigue life in the as built and simulated repair conditions. Through the examination of microstructure, defects and fracture surfaces, the following conclusions can be drawn:
A nearly complete basketweave alpha microstructure can be obtained by depositing on a cast substrate with large grain size due to epitaxial growth of grains. On the other hand, the microstructure is composed of colony and basketweave alpha when depositing on a wrought substrate with fine grain size. For either case, the alpha lath is relatively fine. The fatigue life in the LENS deposit is predominately controlled by the presence of physical defects, in particular the unmelted particles at the surface. The presence of defects further causes a large scattering in the test data for samples made using identical processing conditions. Favourable microstructure still exhibits a poor fatigue life unless defects are eliminated. In the absence of surface defects, the LENS deposit for both as deposit and simulated repair conditions without HIP can achieve a fatigue life that exceeds the lower bound of properties reported for wrought anneal condition and lies in the upper bound regions of cast+HIP condition. Crack initiation is caused by the presence of unmelted particles in the sample, especially at the surface. The location of the crack initiating particle at the surface causes an order of magnitude difference in the fatigue life of the part as compared to crack initiating particles located in the bulk. Such effect is potentially due to the higher stress intensity at the surface defects especially for repair condition. Higher rate of crack propagation from surface defect and its exposure to atmosphere can provide additional reasons for early failure.
Despite considerable effort in process optimisation to eliminate defects, a small amount of unmelted particles still remained in the deposits fabricated in the LENS system available to the present study. Although deposits with two distinct microstructures were obtained on the cast and wrought substrates, the presence of defects prevented a conclusive study on the effect of microstructure on the fatigue life. Nevertheless, the results obtained demonstrated the potential of LENS deposits to achieve a fatigue life comparable to wrought material for both as deposit and repair conditions without the requirement of HIP.
Acknowledgements
This research work was supported financially in part by Applied Optimization, Inc. through the Center for Integrative Materials Joining Science for Energy Applications (CIMJSEA), a National Science Foundation's Industry & University Cooperative Research Center (NSF I/UCRC).