
Abstract
This study examined the effects of alloying elements, which are normally used to modify the composition of advanced high strength steels, on the expulsion phenomenon during resistance spot welding as well as the effects of alloying elements on the expulsion limit current (ELC). An equation for the ELC prediction was derived from the correlation between the ELC and alloying element: ELC (kA) = 9.85–0.74Si–0.67Al–0.28C–0.20Mn–0.18Cr. The coefficient of determination between the calculated and measured values was sufficiently high (R2 = 0.94). The extent of the effects of the alloying elements on the ELC was in the order of Si, Al, C, Mn and Cr. From the correlations among the ELC and resistivity R, the coefficient of thermal expansion α and yield strength (YS1200°C), the ELC was calculated to be ELC (kA) = 9.3 − 0.057R − 0.035α+0.22YS1200°C, and the coefficient of determination was sufficiently high (R2 = 0.96).
Keywords
Introduction
Expulsion, which is the ejection of molten metal from a nugget during welding, is a common phenomenon in electric resistance spot welding (RSW). This results in the generation of voids at the centre of the nugget, which causes rapid deterioration in the strength and collision stability of the weld due to a decrease in weld thickness. 1
Several studies reported the expulsion phenomenon in the RSW of advanced high strength steels (AHSSs). Ma et al. 2 introduced a real time monitoring technique to follow the occurrence of expulsion by detecting the signals of the dynamic resistance, electrode force and electrode displacement continuously in the RSW process of a hot dipped galvanised DP600 sheet. Hwang et al. 3 reduced the expulsion and expanded the acceptable welding current range through pulse type welding current waveform control in the RSW of an Al–Si hot dipped boron steel sheet for hot stamping. As the strength of the steel plates used for autobody frames is increased, a gap is generated between plates due to a spring back phenomenon, where the plates return to their original state during forming. Shen et al. 4 reported that this gap resulted in expulsion during RSW, and Zhang et al. 5 reported a similar result. When two galvanised DP600 steel plates with a 0.8 mm thickness were welded by RSW, the gap between them decreased the contact area as the pressure of the electrode was decreased. This induced a rapid increase in current density, which made expulsion easier to occur. Previous studies examined the correlation between the expulsion and welding process parameters, but there are few reports on the correlations between the expulsion phenomenon and alloying element in steel and the resulting mechanical–thermal properties.
According to the strengthened safety regulations for passengers and pedestrians in the automobile industry, AHSSs with a base metal strength of more than 1 GPa are required. Alloying elements, such as Cr, Si, Mn, Al and B, are added to improve the formability of these steels.6, 7 As the quantity of alloying elements added is increased, the mechanical properties of the welded and base metals are affected. In particular, the amount of alloying element has an effect on the lobe curve, which is an indicator of the weldability of the RSW. 8 The weldability is affected significantly by the addition of alloying elements because of an increase in the lower limit current to obtain the minimum nugget diameter (critical nugget diameter where pullout failure occurred), the rapid decrease in the expulsion limit current (ELC) where expulsion occurs, and the appropriate welding current range is narrowed significantly. On the other hand, there are few reports on this topic. Therefore, the optimal modification of the alloying elements is needed to improve the mechanical properties of the weld and have a wider acceptable welding current range by altering the ELC to a higher current and reducing the lower limit current.
To achieve this, this study examined the effects of alloying elements, such as Cr, Si, Al, C and Mn, which are normally used to modify the composition of the AHSSs, on the expulsion phenomenon during RSW and the effects of the alloying elements on the ELC. Moreover, this study also examined the effects of the alloying element on the steel properties, such as the resistivity, melting point, coefficient of thermal expansion, high temperature yield strength and viscosity, which are related to expulsion, as well as the correlation between the expulsion phenomenon and ELC.
Materials and experimental procedures
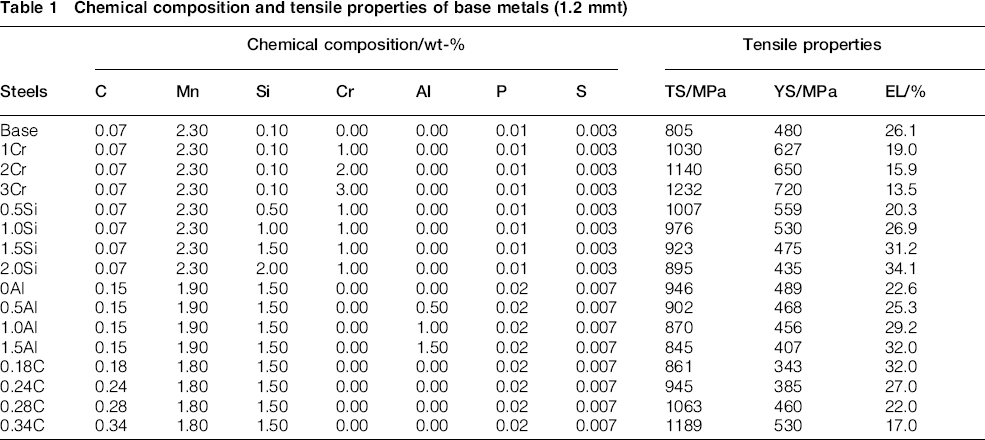
Table 1 lists the chemical composition and tensile properties of the alloys used; the base means the basic composition (0.07C–2.3Mn–0.2Si–0.01P–0.003S) of the AHSS sheets used in this study. Modified steel sheets, where Cr, Si, Al, C and Mn were added at different amounts, were produced using the following process. Vacuum melted ingots, 25 kg in weight, were austenitised at 1200°C for 1 h followed by hot rolling to a 45 mm in thickness with a finishing rolling temperature >950°C. The hot rolled sheets were cold rolled to 1.2 mm. The specimen designations were x%Si (x = 0.5, 1.0, 1.5 and 2.0), x%Cr (x = 1, 2 and 3), x%Al (x = 0.003, 0.5, 1.0, 2.0) and x%C (x = 0.18, 0.24, 0.28, 0.34) steels.
Chemical composition and tensile properties of base metals (1.2 mmt)
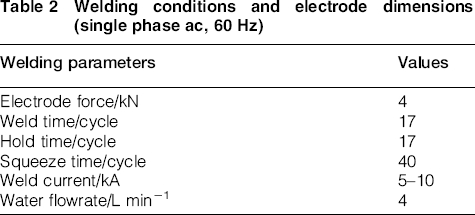
Zhang et al. 8 reported that the effect of welding parameters on the expulsion was in the order of the welding current, electrode force and holding time due to statistical analysis of the effect of welding current, electrode force and holding time on the expulsion phenomenon of low carbon steel. Because the production of large amounts of several steels with different alloying contents is difficult, some parameters, such as the electrode force, welding time and holding time, were fixed, as listed in the Table 2, in accordance with the ISO 18278-2 regulations, 9 and only the welding current was changed in the range of 5–10 kA at 0.2 kA intervals. Table 2 lists the welding parameters used in this study.
Welding conditions and electrode dimensions (single phase ac, 60 Hz)
Results and discussion
Effect of alloying elements on ELC
The process parameters of the RSW have two limitations: no expulsion during welding and no interfacial failure after a tensile shear test. The former is defined by the ELC, where expulsion begins to occur during welding, and the latter is the welding current that formed the minimum nugget diameter (4t1/2, where t is the thickness of the plate), where no interfacial failure occurs.
Figure 1 shows the change in the ELC with the addition of the alloying element. Over the given composition range, all the added elements resulted in a linear decrease in the ELC. In addition, the value ( = a) shown in Fig. 1 is the slope of each element (kA/wt-%), which means the reduction rate of the ELC per wt-%. This increased in the order of Si, Al, C and Cr, which means that expulsion occurred easily in this order.
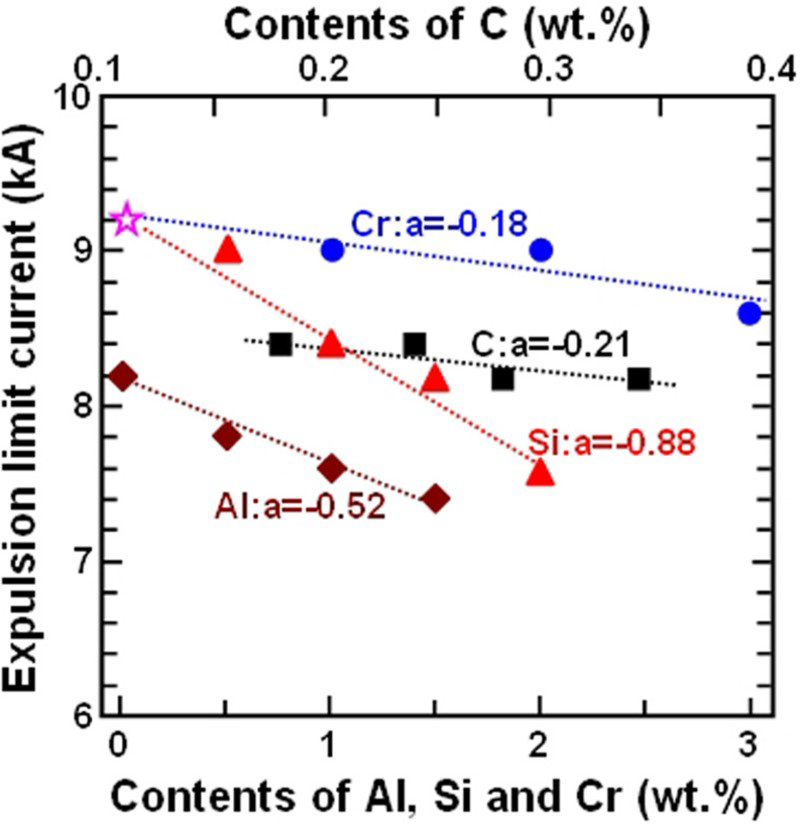
Change in expulsion limit current with contents of alloying elements (a: slope; ?: base composition)
Based on the results shown in Fig. 1, the equation was used to predict the ELC during RSW of AHSS sheets, which had a different quantity of alloying elements, i.e. Si, Al, C, Cr and Mn. Equation (1) was obtained from the correlation between the ELC and alloy composition using multiple regression analysis
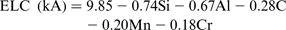
Figure 2 shows the correlation between the calculated ELC predicted using equation (1); the measured value and coefficient of determination R2 was 0.94. On the other hand, the symbols ⊙ and
 in Fig. 2 denote the correlations obtained using the data reported by Miura et al.
10
and Jung et al.
11
The calculated value correlated well with the measured value. Therefore, equation (1) can be used to predict the ELC during the RSW of the AHSSs as a function of the alloying element.
in Fig. 2 denote the correlations obtained using the data reported by Miura et al.
10
and Jung et al.
11
The calculated value correlated well with the measured value. Therefore, equation (1) can be used to predict the ELC during the RSW of the AHSSs as a function of the alloying element.
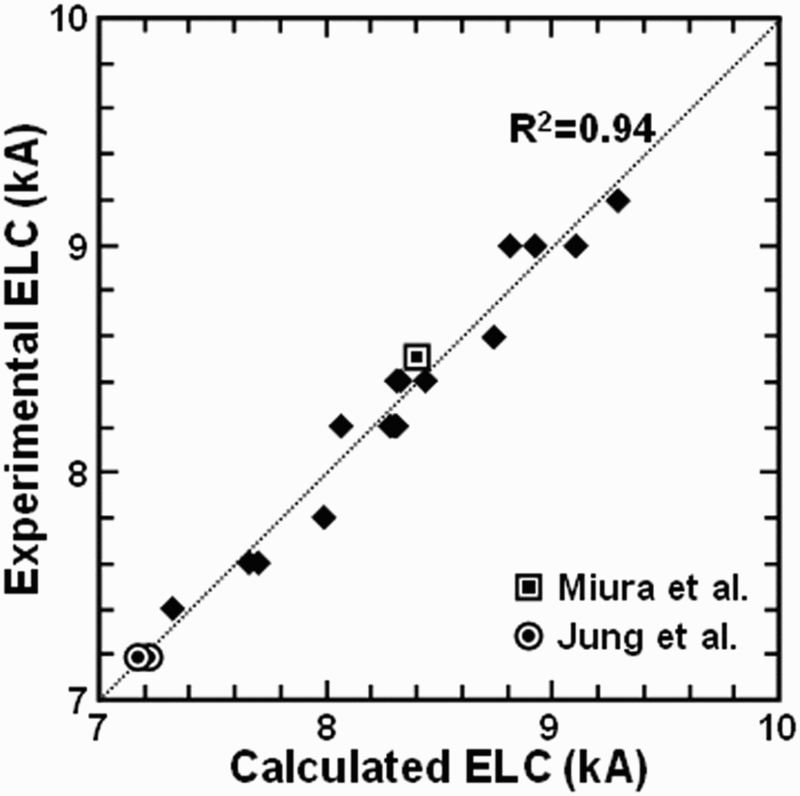
Correlation between expulsion limit current (ELC) calculated using equation (1) and measured value
Relation between expulsion shape and nugget shape with alloying elements
Section microstructures of the weld nugget before and after expulsion were traced to investigate the expulsion process and the change in the nugget shape due to alloy modification.
Figure 3 shows the shapes of the expulsion and nugget immediately before (Fig. 3a, c and e) and after expulsion (Fig. 3b, d and f) after the addition of Cr and Si. Figure 3a and b shows the steels with the basic composition (Fe–2.3Mn–0.07C–0.1Si), Fig. 3c and d presents the steels where 1%Cr was added (1Cr steel) to the basic composition steel to determine the effects of the Cr and Fig. 3e and f show the steels where the Si concentration was increased from 0.1 to 0.5% (0.5Si steel) in the 1Cr steel to examine the effects of Si. The results showed that the nugget section area was decreased slightly, the depth of the indentation was slightly deeper and the width was slightly wider after expulsion than before in the unmodified steel (Fig. 3a and b) and 1Cr steel (Fig. 3c and d), whereas those changes were more significant in the 0.5Si steel (Fig. 3e and f).
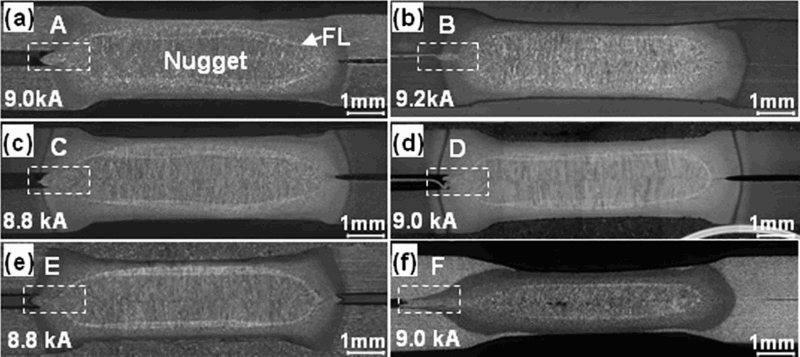
a, b base steel (0.07C–2.30Mn–0.1Si); c, d 1Cr steel (0.07C–1Cr–2.30Mn–0.1Si); e, f 0.5Si steel (0.07C–1Cr–2.30Mn–0.5Si)
Figure 4 shows enlarged micrographs and a schematic diagram of the area marked ▪ in Fig. 3 (A–F) to examine the occurrence and shape of expulsion as Cr and Si are added. In the welding current immediately before expulsion, the melt within the nugget was extruded to the corona bond, and it blocked the expulsion of the melt (Fig. 4a1–a3 and b1–b3). This suggests that the high temperature strength of the corona bond was sufficient to block the squeezing force of the melt. Therefore, the high temperature strength of the corona bond is one of the important parameters for controlling the expulsion phenomenon.
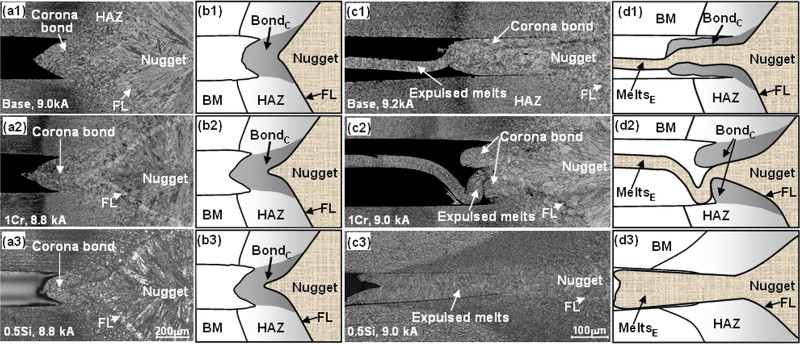
a1–a3, c1–c3 enlarged micrographs of area denoted by A–F in Fig. 3 respectively and b1–b3, d1–d3 schematic diagrams of expulsion and nugget immediately before and after expulsion respectively (1: base steel; 2: 1Cr steel; 3: 0.5Si steel)
When the nugget and expulsion shapes at the welding current where expulsion occurred (Fig. 4c1–c3 and d1–d3) were compared, the expulsed melt was squeezed out through the corona bond in a colloid state like toothpaste in the basic composition steel (Fig. 4c1 and d1) and 1Cr steel (Fig. 4c2 and d2). This shape is designated as the ‘toothpaste type (TP type)’. On the other hand, in the 0.5Si steel (Fig. 4c3 and d3), the corona bond almost disappeared; the expulsed melt was sprayed around and directly connected to the nugget. This shape is designated as ‘spray type (ST type)’.
Figure 5 shows the shape changes of the nugget and expulsed melt immediately before (Fig. 5a, c and e) and after (Fig. 5b, d and f) expulsion when different amounts of Al were added to the steel with the basic composition (0.15C–1.9Mn–1.5Si). Figure 5a and b shows the expulsion shape and nugget in 0Al steel, which contained 0.03%Al in the basic composition steel. Figure 5c and d presents those for 0.5Al steel with 0.5%Al, and Fig. 5e and f shows the data for 1.5Al steel with 1.5%Al. The section area of the nugget was decreased slightly, the depth of the indentation was slightly deeper, and the width was slightly wider after expulsion than before in the 0Al (Fig. 5a and b) and 0.5Al (Fig. 5c and d) steels, whereas they were more significant in the 1.5Al steel (Fig. 5e and f).
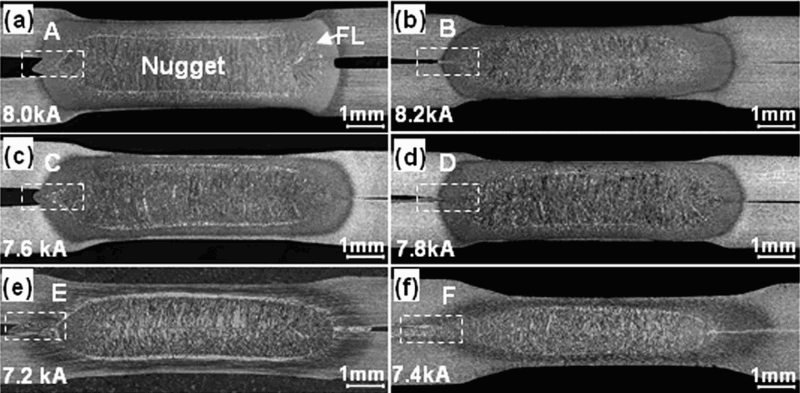
a, b 0Al steel (0.15C–1.9Mn–1.5Si–0.03Al); c, d 0.5Al steel (0.15C–1.9Mn–1.5Si–0.5Al); e, f 1.5Al steel (0.15C–1.9Mn–1.5Si–1.5Al)
Figure 6 shows enlarged micrographs and their schematic diagram of the area marked ▪ in Fig. 5 (A–F) to investigate more carefully the occurrence and shape of expulsion according to the Al contents. When the nugget shapes immediately before expulsion (Fig. 6a1–a3 and b1–b3) were compared, melt flow in the heat affected zone (HAZ) and corona bond was obvious, and the corona bond was longer as the Al contents was increased despite the lower welding current. This was attributed to the enhanced high temperature ductility with the Al contents. As shown in Fig. 6c1–c3) and d1–d3, which were the expulsion shape after expulsion, the expulsion was the same as the spray type regardless of the Al contents, whereas the amount of the expulsed melt out of the nugget increased with increasing Al contents.
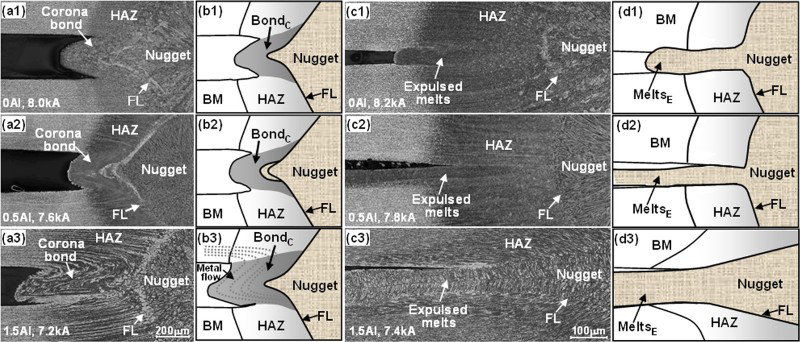
a1–a3, c1–c3 enlarged micrographs of area denoted by A–F in Fig. 5 respectively and b1–b3, d1–d3 schematic diagram of expulsion and nugget immediately before and after expulsion respectively (1: 0Al steel; 2: 0.5Al steel; 3: 1.5Al steel)
Figure 7 shows the shape of the nugget and expulsed melt immediately before (Fig. 7a and c) and after (Fig. 7b and d) expulsion in the steel with the basic composition of 1.8Mn–1.5Si–0.03Al with different C contents. Figure 7a and b indicates the 0.18%C steel, and Fig. 7c and d indicates the 0.34%C steel. The changes in the nugget section area, and depth and width of the indentation were small, and there were voids within the nugget after expulsion (Fig. 7b and d) regardless of the C contents.
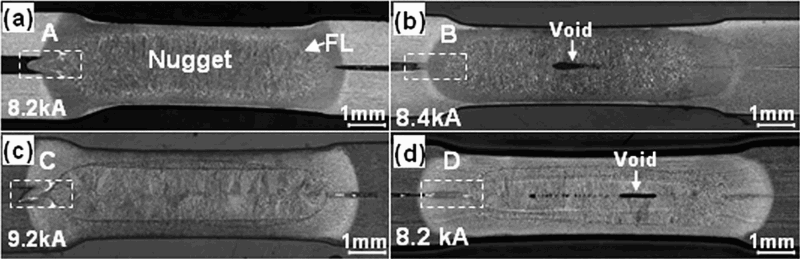
a, b 0.18C steel (0.18C–1.8Mn–1.5Si–0.02Al); c, d 0.34C steel (0.34C–1.8Mn–1.5Si–0.02Al)
Figure 8 shows enlarged micrographs and their schematic diagrams of the area marked ▪ in the Fig. 7 (A–D) to investigate more carefully the occurrence and shape of expulsion according to the C contents. As shown in Fig. 8a1 and a2 and b1 and b2, cracks formed at the interface between the corona bond and HAZ in the 0.34C steel (Fig. 8a2) with higher C contents, and all the expulsion shapes (Fig. 8c1 and c2 and d1 and d2) were spray type regardless of the C contents.
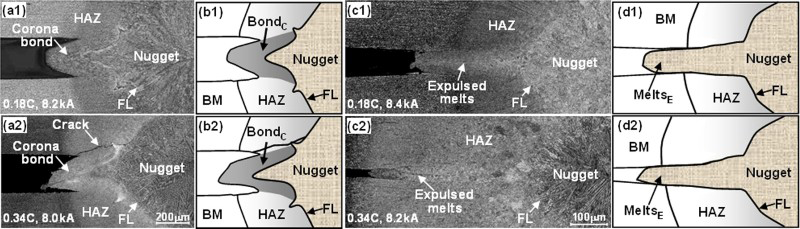
a1, a2, c1, c2 enlarged micrographs of area denoted by A–D in Fig. 8 respectively and b1, b2, d1, d2 schematic diagram of expulsion and nugget immediately before and after expulsion respectively (1: 0.18C steel; 2: 0.34C steel)
The expulsion shapes were classified as spray type when the Si contents were more than 0.5% (Table 1) and toothpaste type when the Si contents was lower than 0.1%. In particular, the 1Cr steel (1Cr–0.1Si) and 0.5Si steel (1Cr–0.5Si) had the same Cr contents, but 1Cr steel with a 0.1%Si showed the toothpaste type, whereas that with 0.5%Si was the spray type. Therefore, the Si contents are an important parameter affecting the expulsion shape.
Figure 9 shows typical SEM images of the base metal (Fig. 9a), HAZ (Fig. 9b) and fusion zone (Fig. 9c) in 1Cr steel (1), 0.5Si steel (2) and 0.18C steel (3) welds. The microstructures of the fusion zone were full martensite regardless of the Cr, Si and C contents. Because the fusion zone has full martensite microstructures due to the rapid cooling (>3000 K s− 1) characteristics of the RSW within a given composition range of Cr, Si and C.
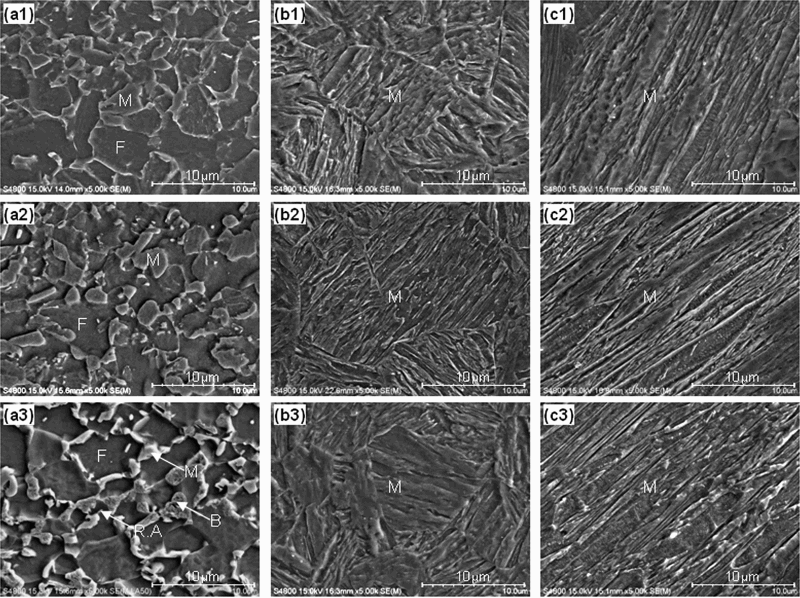
Typical SEM images of a base metal, b HAZ and c fusion zone (or weld nugget) in 1Cr steel, 0.5Si steel and 0.18C steel welds (1: 1Cr steel; 2: 0.5Al steel; 3: 0.18C steel) (M: martensite; F: ferrite; B: bainite; R.A: retained austenite)
Figure 10 shows typical SEM images of the base metal (Fig. 10a), HAZ (Fig. 10b) and fusion zone (Fig. 10c) in 0.5Al steel (1), 1.0Al steel (2) and 1.5Al steel (3) welds. In case of 0.5Al Steel, there was full martensite in HAZ and fusion zone. However, there were martensite and δ-ferrite in HAZ and fusion zone of 1.0Al and 1.5Al steel welds. Volume fraction of δ-ferrite has lots of 1.5Al steel than 1.0Al steel. The results in this study are in good agreement with fusion zone microstructure of Al bearing transformation induced plasticity assisted steel (Fe–0.12C–2.13Mn–0.08Si–1.27Al) and δ-transformation induced plasticity steel [Fe–0.4C–0.51Mn–0.19Si–(3–6)Al] welds.11–13
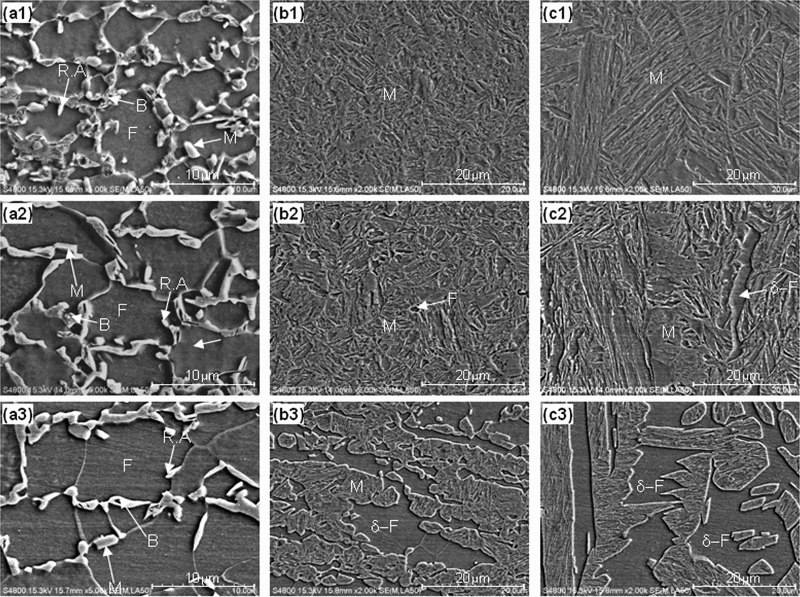
Typical SEM images of a base metal, b HAZ and c fusion zone (or weld nugget) in Al steel welds (1: 0.5Al steel; 2: 1.0Al 0.5Al steel; 3: 1.5Al steel) (M: martensite; F: ferrite; B: bainite; R.A: retained austenite)
Relationship between ELC and properties of steel
Figure 11 shows the balance of forces in spot welding. Expulsion occurred when the expansion force of the melt within the nugget FN was larger than the resisting force of the corona bond FC. FN within the nugget was dependent on the amount of melt and the coefficient of thermal expansion of the melt. 14 If welding was carried out under the same conditions, the amount of melt will be controlled by the electrical resistivity and melting point of the base metal. The resisting force of the corona bond can be expressed as the high temperature yield strength of the material beside the melt. Therefore, the resistivity, melting point, high temperature yield strength of the base metal and the coefficient of thermal expansion of the melt were measured, and the correlations among these properties and the ELC were investigated.
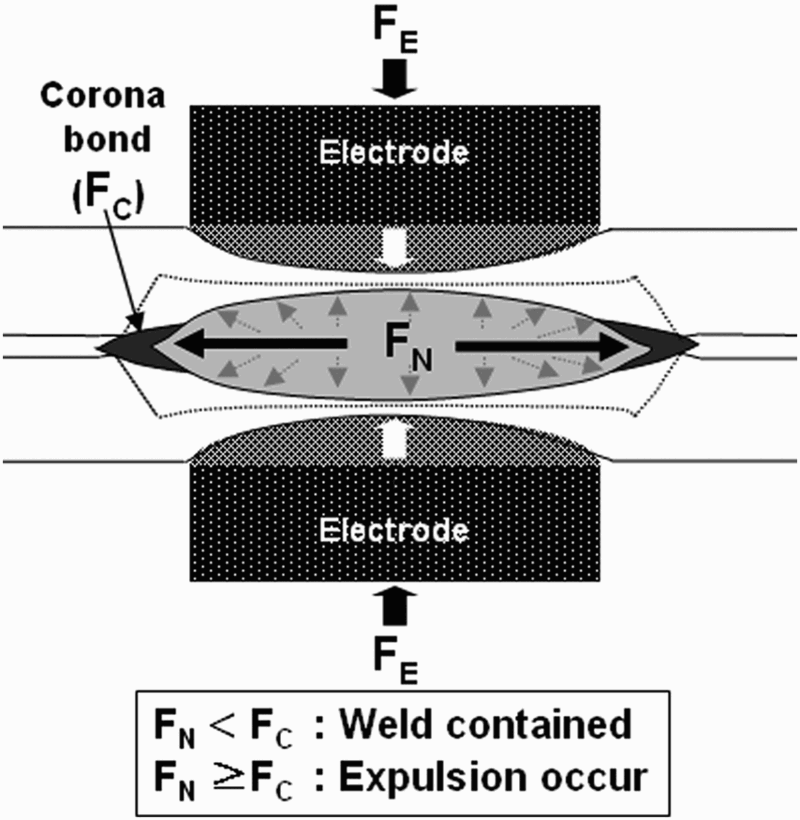
Schematic diagram of balance of forces considered in model; FN is force from nugget due to liquid pressure, and FC is force of corona bond and FE is electrode force
Figure 12 shows the resistivity value of the steels with alloy modification. The resistivity values were measured using a four-point probe method 15 and averaged from 15 measurements. Within the given composition range, resistivity increased linearly with the addition of alloying elements, but the rate of the increase was different. The ‘a’ value for each element was the slope of the line (μΩ cm/wt-%) and indicates the increasing rate of resistivity per wt-% of each element. This was high in the order of C, Si, Al and Cr, which means that the effect on the resistivity was in this order.
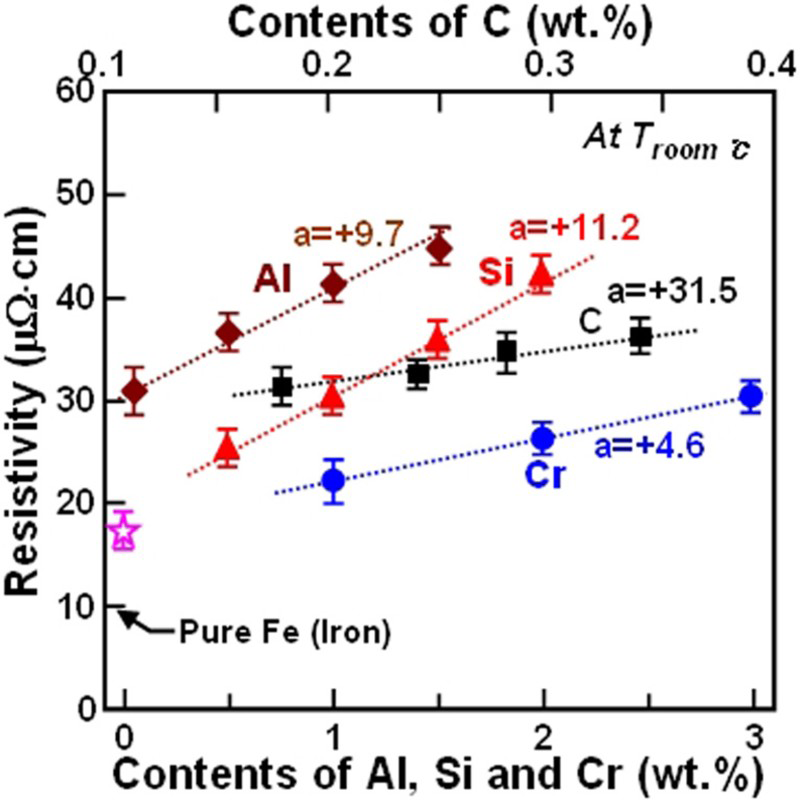
Change in resistivity with contents of alloying elements (a meaning: slope; ?: base composition)
The effect of the alloying element on resistivity quoted from metals handbook 16 was also in the order of C, Si, Al, Mn and Cr and was consistent with the results in this study. In addition, Choi et al. 17 reported that the carbon equivalent (Ceq) of 0.08–0.50 corresponded to the resistivity of 12.5–45 (μΩ cm). When the Ceq was calculated using the equation, Ceq = C + Si/30+Mn/20+2P+3S, within the given composition range, it was approximately 0.18–0.48 and resistivity was 18–48 (μΩ cm). Therefore, the results in this study are in a good agreement with those reported by Choi et al. 17 Accordingly, these results are reliable, and resistivity is expected to affect the ELC and nugget diameter.
The melding point was measured by differential thermal analysis. The coefficient of thermal expansion of the melt, high temperature strength and viscosity were difficult to measure so that they were calculated using JMatPro (version 5) software.18, 19 Both Polakova and Kubina 20 and Guo et al. 21 reported that the high temperature properties of multicomponent steels calculated using JmaPro were well consistent with the experimental results. In addition, the JmatPro was used to calculate the mechanical and thermal properties of multicomponent Al, Ti, Ni alloys, etc.22–24 Therefore, the coefficient of thermal expansion, high temperature strength and viscosity of the steels with alloy modification calculated using the JmatPro could be usable.
On the other hand, the high temperature strength of the corona bond was set as the yield strength of the material at 1200°C. Because the expulsed melt was at the end of the corona bond, the temperature of this area during welding was calculated using Sysweld software, 25 and the result was ∼1200°C.
Figure 13 shows the change in the thermal–physical properties of the steels with alloy modification. Figure 13 shows the melting point TM.P, coefficient of thermal expansion of the melt, yield strength at 1200°C and viscosity of the melt at TM.P+50°C respectively. Table 3 lists the properties of each composition.
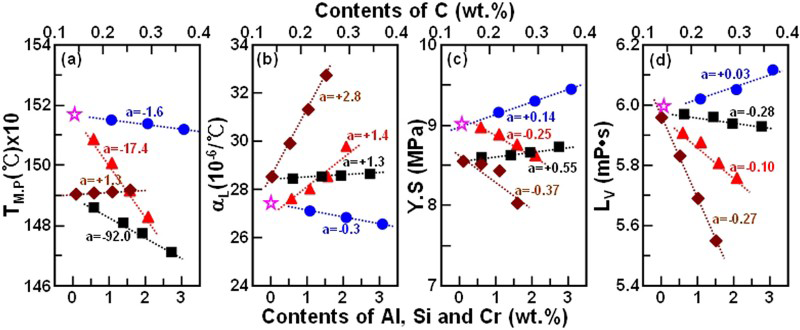
a,melting point (TM.P); b coefficient of expansion of liquid αL; c yield strength (YS) at 1200°C; d viscosity of liquid LV at TM.P+50°C
Expulsion limit current and thermophysical and mechanical properties with alloying element and contents
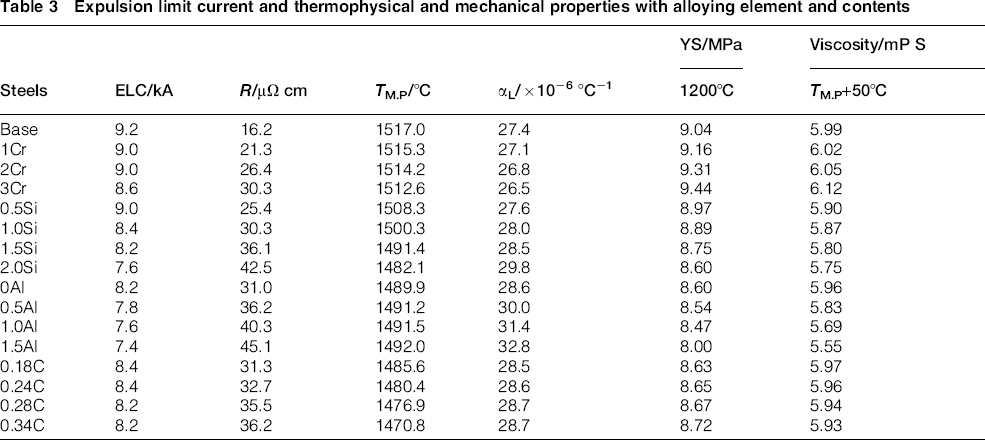
As shown in the Figs. 12 and 13 and Table 3, each property was varied with alloy modification. Because the effect of the alloying element on the steel properties was different from each other, the effect of steel properties on the ELC and nugget diameter was also expected to be different.
Figure 14 shows the correlations between the thermal–mechanical properties of steels and ELC. Figure 14a shows the correlation between the ELC and resistivity of the base metal. Figure 14b presents the melting point. Figure 14c illustrates the coefficient of thermal expansion of the melt. Figure 14d shows the yield strength at 1200°C. Figure 14e presents the viscosity of the melt at 50°C over the melting point. Expulsion limit current decreased linearly with increasing resistivity (Fig. 14a) and coefficient of thermal expansion (Fig. 14c) and decreasing yield strength (Fig. 14d). All the coefficients of determination R2 were higher than 0.75. Therefore, these properties and the ELC appeared to show a systematic correlation. On the other hand, the coefficients of determination R2 with the melting point (Fig. 14b) and viscosity (Fig. 14e) were < 0.64, meaning that there was no close relationship between the ELC and these properties. Therefore, from the correlation between the ELC and each property, the resistivity where the correlation coefficient was the highest (R2 = 0.92) is believed to be the most important factor on the ELC.
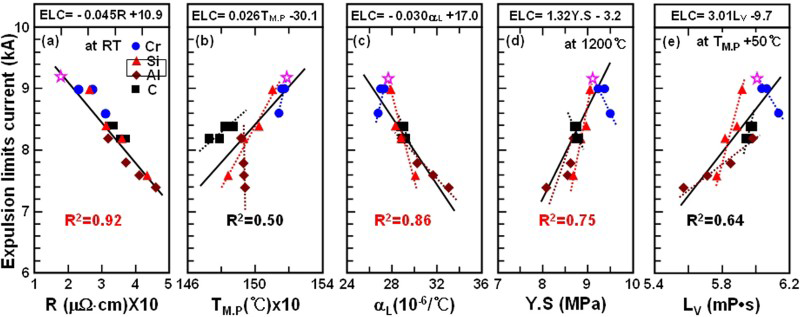
a resistivity R at room temperature; b melting point TM.P; c coefficient of expansion of liquid αL; d yield strength (YS) at the 1200°C; e viscosity of liquid LV at TM.P+50°C
Based on the results shown in the Fig. 13, an attempt was made to derive an equation to predict the ELC in terms of the steel properties using multiple regression analysis with these five parameters, but this was not successful. Therefore, the melting point and viscosity, which showed a relatively low coefficient of determination were removed, and the others, i.e. the resistivity R (μΩ cm), coefficient of thermal expansion αL (10− 6/°C) of the melt and yield strength (YS, MPa) at 1200°C were used for multiple regression analysis to predict the ELC (kA). The result is shown in equation (2)

Figure 15 shows a plot of the measured ELC and ELC calculated using equation (2). Because the coefficient of determination R2 was 0.96, this equation could be used to predict the ELC from the steel properties.
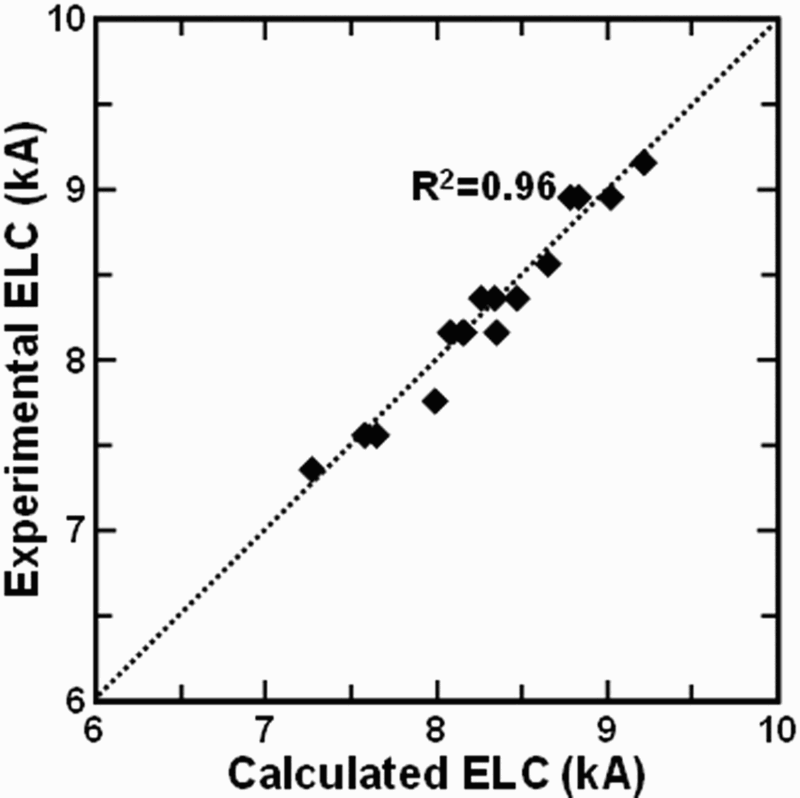
Correlation between expulsion limit current (ELC) calculated using equation (2) and measured value
According to the results in Fig. 1 and equation (1), the type and amount of alloying elements had an effect on the ELC in that the resistivity, coefficient of thermal expansion and high temperature yield strength were changed. The ELC decreased with increasing resistivity and coefficient of thermal expansion, and increased with increasing high temperature yield strength.
From the above results, the correlation between the ELC and the change in each property with each composition can be summarised as follows.
In steels with Si and Al addition, the decreasing rate of the ELC was high, as shown in the Fig. 1, because resistivity increased rapidly with Si addition, resulting in the easy formation of the melt in the low current (low heat input) so that the expulsion force ( = coefficient of thermal expansion) out of the nugget was increased and the yield strength of the corona bond that blocked the expulsion of the melt was decreased. In case of Al addition, the trend was similar, but the rate of change was less than that of Si. On the other hand, in the steel with C addition, resistivity increased with increasing addition, resulting in the easy formation of the melt in the low current (low heat input). The change in coefficient of thermal expansion, however, was small and yield strength increased, resulting in a small decrease in the ELC. In case of the steel with Cr addition, resistivity increased with the addition so that the melt formed easily at low current (low heat input). On the other hand, with element addition, coefficient of thermal expansion was decreased, whereas the yield strength, which blocks the expulsion of the melt, was increased significantly. These phenomena are believed to be the reason for the lowest effect on the ELC within the given composition range.
Effect of alloying elements on expulsion type
Figure 16 shows the relationship between the type of expulsion shape and each property of the steel. Figure 16 shows the type of the expulsion shape related to the resistivity of the base metal, melting point TM.P, coefficient of thermal expansion of the melt, yield strength at 1200°C and LV at the TM.P+50°C respectively. The toothpaste and spray type expulsions were clearly separated with certain property values except the resistivity. Tooth paste type expulsion occurred in the steel with a low coefficient of thermal expansion, and high melting point, yield strength and viscosity, whereas the spray type expulsion was observed at high coefficient of thermal expansion, and low melting point, yield strength and viscosity. Moreover, spray type expulsion could form in steel with high resistivity.
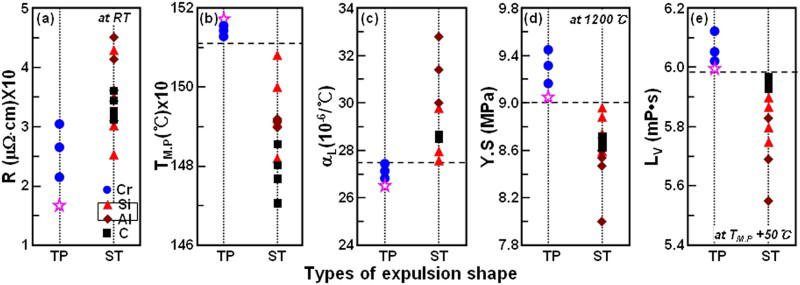
a resistivity R at room temperature; b melting point TM.P; c coefficient of expansion of liquid αL; d yield strength (YS) at 1200°C; e viscosity of liquid LV at TM.P+50°C (?: base composition)
Based on the results in this study, expulsion shape was decided by multiplicative factor such as resistivity, melting point, coefficient of thermal expansion, high temperature yield strength and viscosity of liquid. It was changed by electric resistivity, melting point, coefficient of thermal expansion, high temperature yield strength and viscosity of liquid with alloying element and contents. In particular, spray type was formed with high electric resistivity and coefficient of thermal expansion and low melting point and yield strength and viscosity of liquid. The amount of melt will be controlled by the electrical resistivity and melting point of the base metal. It was increased with high electric resistivity and low melting point. Then, the liquid in the nugget was formed with the force to go outside, and force was large with high coefficient of thermal expansion when there is electrode pressure. The corona bond almost disappeared, the expulsed melt was sprayed around and directly connected to the nugget due to easy to plastic deformation when yield strength is low (Fig. 4c3). Finally, spray type was changed with spread expulsion shape because of increased liquidity and low viscosity.
On the other hand, toothpaste type was formed with low electric resistivity and coefficient of thermal expansion and high melting point and yield strength and viscosity of liquid. In particular, expulsed melt was squeezed out through the corona bond due to few plastic deformation when yield strength is high. Finally, expulsion shape was changed to toothpaste type due to high viscosity because liquidity was low.
Figure 17 shows the correlation between the type of expulsion shape and the ELC. The ELC was generally high in the steel showing the toothpaste type expulsion and low in the spray type expulsion. In addition, it was very low in the steel with high Si and Al contents.
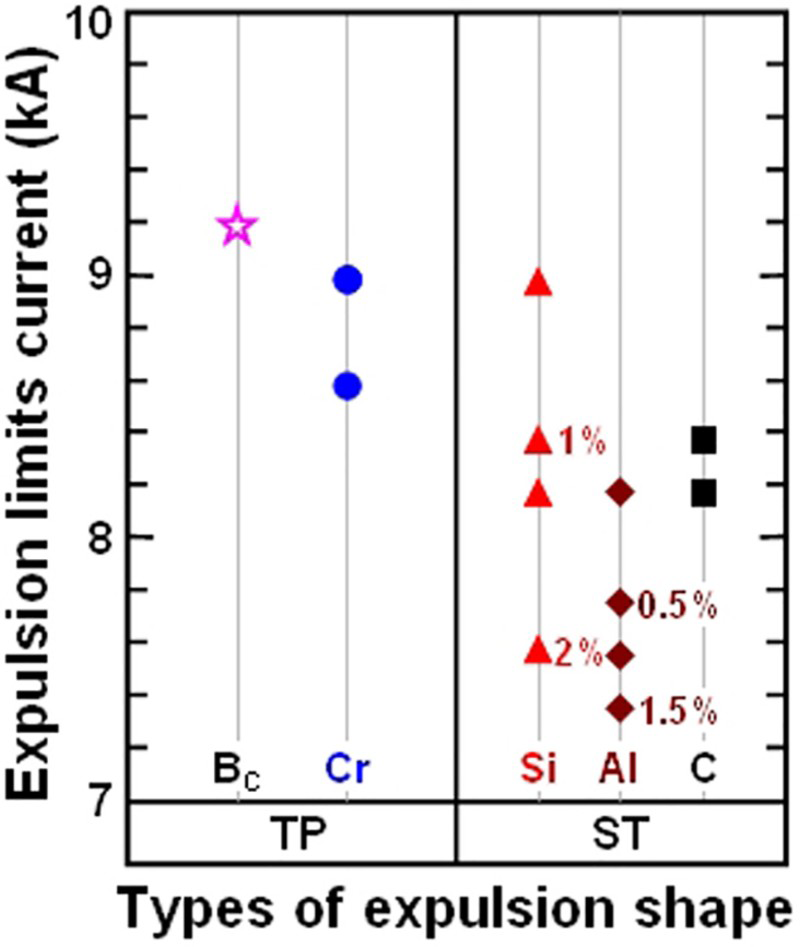
Relationship between types of expulsion shape and expulsion limits current (?: base composition)
Conclusions
An expulsion phenomenon occurred during RSW of AHSSs, and the effects of the alloying element (Cr, Si, Al, C and Mn) on the ELC were investigated. The correlation between the ELC and steel properties, such as the resistivity, melting point, coefficient of thermal expansion, high temperature yield strength and viscosity, and the alloying elements were also evaluated. Based on these results, the following conclusions can be drawn.
Over the given composition range, the ELC decreased linearly with increasing amount of alloying elements added regardless of the type of element. From the correlation between the ELC and alloying element obtained by multiple regression analysis, the equation derived to predict the ELC was ELC (kA) = 9.85–0.74Si–0.67Al–0.28C–0.20Mn–0.18Cr. The coefficient of determination R2 of the correlation between the calculated and measured values was 0.94, meaning that this equation can be used to predict the ELC during the RSW of the AHSSs. In addition, the effect of the alloying element on the ELC was higher in the order of Si, Al, C, Mn and Cr. From the correlation between the ELC and steel properties, the ELC decreased linearly with increasing resistivity R and coefficient of thermal expansion α, and decreasing yield strength (YS1200°C), but there was little association with the melting point TM.P and viscosity Lv. Multiple regression analysis of the ELC with three properties, except the melting point and viscosity, gave the following equation: ELC (kA) = 9.3 − 0.057R − 0.035αL+0.22YS1200°C. As R2 was 0.96, the ELC could be expected using the steel properties. Resistivity increased drastically with increasing amount of Si and Al addition. This resulted in the easy melting at low current (low heat input) so that the expulsion force of the melt out of the nugget became stronger. On the other hand, yield strength, which blocked the expulsion of the melt, decreased simultaneously. Therefore, the ELC decreased rapidly. In the composition range given in this study, the steel where more than 0.5%Si was added showed high resistivity and coefficient of thermal expansion, and low viscosity, melting point and yield strength so that the shape of the expulsed melt was spray type. However, in the steel where < 0.5%Si was added, resistivity and coefficient of thermal expansion were low, and viscosity, melting point and yield strength were high so that the expulsed melt was squeezed out through the corona bond as colloidal state like toothpaste. This means that the important parameter was the Si contents. In addition, the ELC tends to be lower when the expulsion shape was the spray type.
Footnotes
Acknowledgements
This work was supported by the National Research Foundation of Korea (NRF) grant funded by the Korea government (MSIP) (grant no. 2012R1A5A1048294).