
Abstract
Incomplete penetration is a common defect in the welding gap of large size (welding area is over 100 mm2) electrical contact, which leads to an instability of welding quality. Nevertheless, there was limited research dealing with non-destructive quality inspection of electrical contact. In this research, the resistance of CJ400 electrical contact was measured with the device medium frequency inverter resistance spot welding (MFI-RSW) machine. Multipulse measuring method was designed and proved efficient to reach a higher accuracy by restraining the influence of the contact resistance between electrodes and electrical contact. Moreover, the error of resistance caused by temperature rising in the measuring process is also eliminated effectively. Therefore, more accurate resistance of electrical contact could be extracted compared to the method of single pulse measuring. Then, the relationship between resistance and welding quality was studied and a new quality inspection method was proposed.
Introduction
High frequency induction brazing is widely applied to the large size electrical contact production industry because of advantages such as high efficiency, easy to realise mechanisation and automation. However, the heat generated during the induction brazing process transforms from the surface to the centre of the electrical contact. The filler metals near the edge melt much faster than those in the centre. This could cause the defect of incomplete penetration, which leads to low shear strength and unqualified electrical contact. Currently, there are three ways to estimate the welding quality: shear strength, metallographic test and brazing rate (the ratio of the effective welding area and the area of welding gap). The first two ways are destructive testing methods. So, brazing rate measured by ultrasonic C scan is usually adopted to estimate the welding quality of electrical contact. However, it takes ∼1 h to get the brazing rate for one electrical contact. Consequently, this method is only applied for sampling inspection.
In previous studies, the relationship among brazing rate, shear strength and the resistance of electrical contact, which is composed of AgCdO tip and H62 brass contacter, was analysed. 1 The experimental results showed that there was no strong relationship between brazing rate and shear strength due to the limitation of ultrasonic inspection. However, it was found that shear strength of the contact is non-linearly dependent of resistance. This provided a new thought for quality inspection of electrical contact. Nevertheless, the maximum output current of resistance measuring device (digital microhm metre) is no >100 A. Since most electrical contacts are made of silver, copper and their alloy, 2 the resistance is quite small. So, the output voltage signal is no greater than 1 mV, which is too small to be accurately extracted. Moreover, the contact resistance between electrical contact and measuring device could not be effectively eliminated. Therefore, the measuring result contains a large error.
In the industry of resistance spot welding (RSW), measurement technology of electrical parameters such as current, voltage and resistance is becoming increasingly mature.3, 4 Savage et al. 5 studied the typical shape of dynamic resistance curve during the process of RSW. In addition, the effects of electrode force, current and material surface condition on the dynamic resistance are analysed. In later research, the changing rule of contact resistance between workpiece and electrodes, resistance of workpiece during the process of RSW was studied by a three-dimensional finite element method. 6 Moreover, the relationship between dynamic resistance and welding quality was widely studied.7–13 The dynamic resistance and critical expulsion energy were proposed for online quality control during the process of RSW. 14 Gedeon et al. 15 found that the curves of dynamic resistance and electrode displacement could provide important information for nugget quality. Cho et al.16, 17 detected the welding current and voltage in the primary circuit of RSW machine, and four characteristic parameters extracted from the dynamic resistance curve were used to estimate the welding quality. Wang et al.18–20 used a neural network model established based on the dynamic resistance to realise online monitoring of welding quality in small scale RSW. The root mean square (RMS) of current and voltage during every half cycle was detected and the dynamic resistance was used to realise online monitoring for electrode invalidation during RSW of zinc coated steel. 21 Wei et al. systematically investigates the changing rule and influence factors of dynamic resistance during RSW, and the effects of local electrical contact resistance on welding quality were realistically studied.22, 23
Compared to digital microhm metre, RSW machine could provide an electrode pressure over 103 N and current over 104 A, which could effectively restrain the contact resistance between electrode and electrical contact. Moreover, voltage signal could be over hundreds of millivolts even for the electrical contact made of silver or copper. Therefore, in this research, the resistance of CJ400 electrical contact (welding area is ∼280 mm2) was measured with the device medium frequency inverter RSW (MFI-RSW) machine. In addition, based on the research of the dynamic resistance curve under different measuring processes, an optimum method for resistance extraction was analysed. A quality estimation method based on the resistance was tested.
Measuring method
In this research, CJ400 electrical contact was taken as an experimental sample. The resistance of welding zone was measured. The electrical contact is composed of tip (made of AgCdO15) and contacter (made of T3 copper), as shown in Fig. 1a. The tip is approximately 20 mm × 14 mm. The thicknesses of tip and contacter are 2 and 4 mm respectively. Ultrasound scan picture of welding interface is shown in Fig. 1b. Red areas are the defects of incomplete penetration.
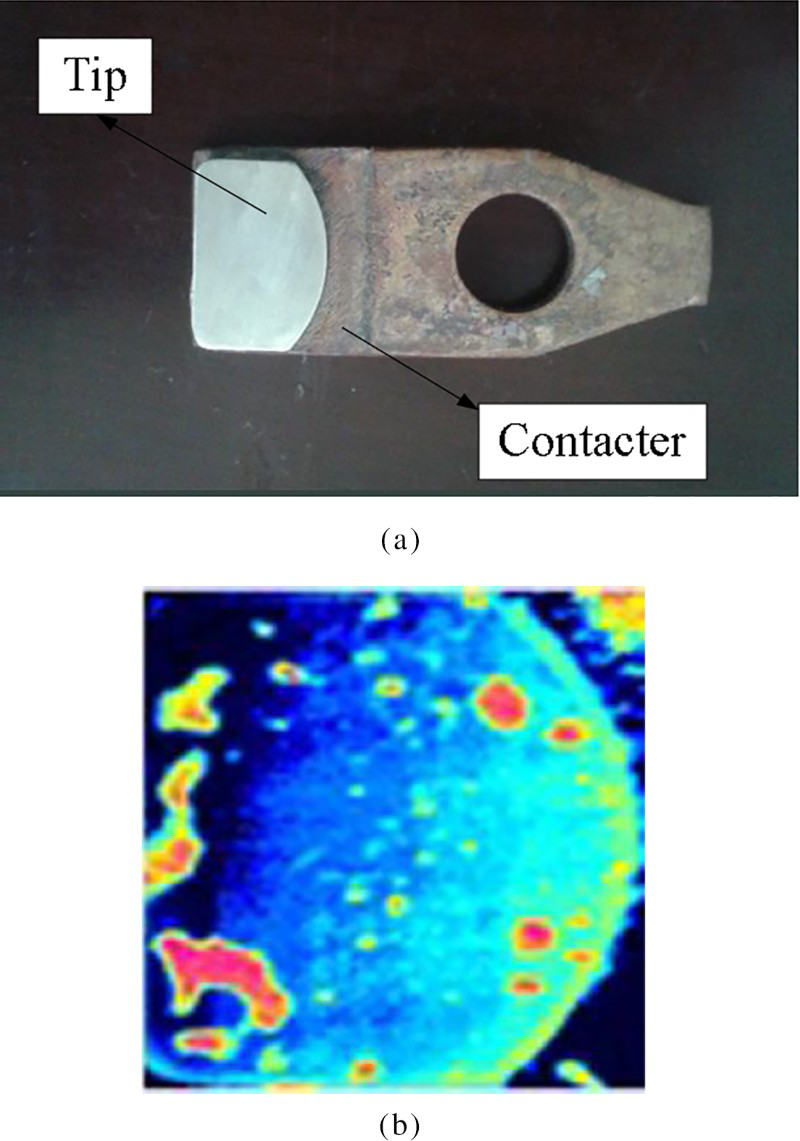
a CJ400 electrical contact after high frequency induction brazing; b ultrasound scan picture of welding interface
The device for resistance measurement is DB-350 MFI-RSW machine with a power of 350 kVA. Schematic diagram of resistance measurement is shown in Fig. 2. The current signal is extracted from Rogowski coil. The dynamic resistance could be obtained by dividing the welding voltage by the welding current. The voltage is measured between the electrodes, and the current is detected in the secondary circuit of MFI-RSW machine. As shown in equation (1), the resistance R is composed of Rup-contact, Rw and Rdown-contact. Rup-contact and Rdown-contact correspond to contact resistance in the two contacts surface, Rw is the resistance of electrical contact itself. In order to make R infinitely close to Rw, Rup-contact and Rdown-contact should be restrained by current and electrode pressure.

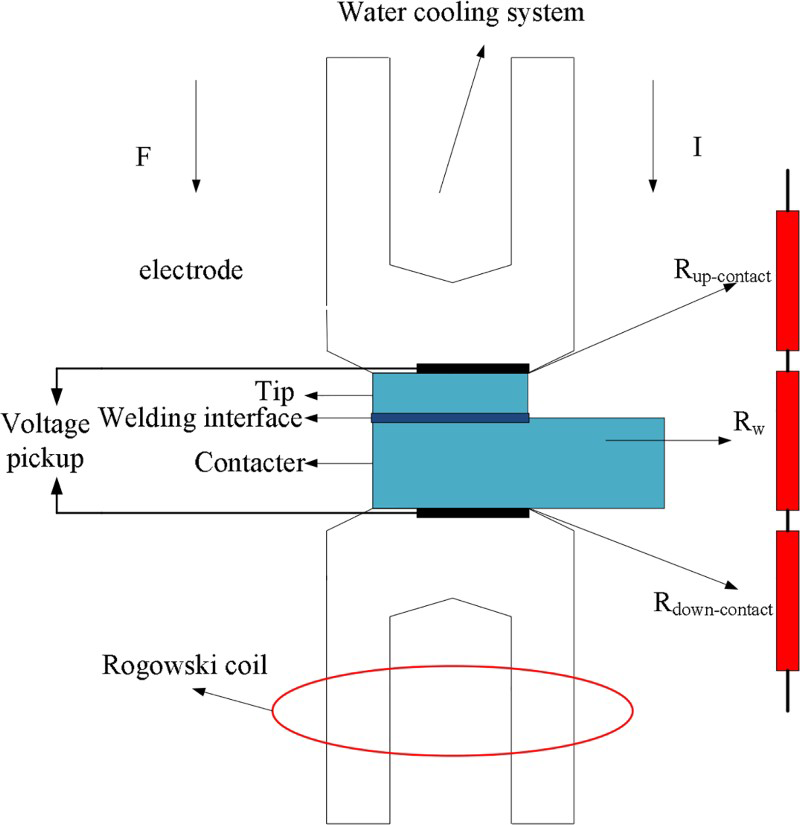
Schematic diagram of resistance measurement
Process of resistance measurement
Platform for resistance measurement
The hardware architecture platform, which consists of three parts: circuit for voltage signal processing, circuit for current differential signal processing and data collection system, is shown in Fig. 4.
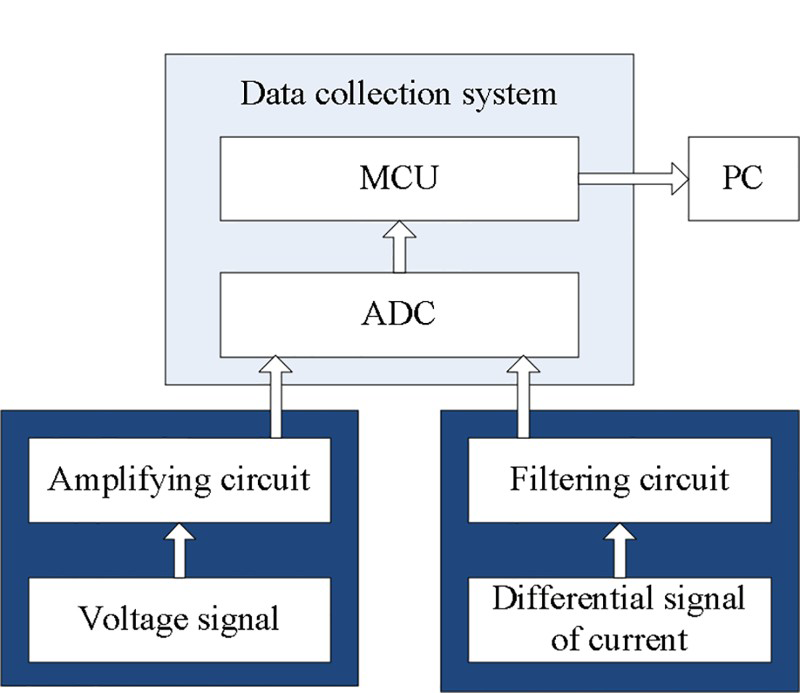
Hardware architecture platform for resistance measurement
Circuit for voltage signal processing
Because the resistance of electrical contact is quite small, the voltage signal is still < 200 mV even if the current reaches to 30 000 A. So, the signal still needs to be smoothed and amplified.
Circuit for current differential signal processing
Since the output signal of Rogowski coil is the differential signal of the current, it needs to be integrated. In order to avoid the error caused by integral drift and integral capacitor leakage, the integration is mainly realised by software programming in 32 bit microcontroller unit.
Data collecting system
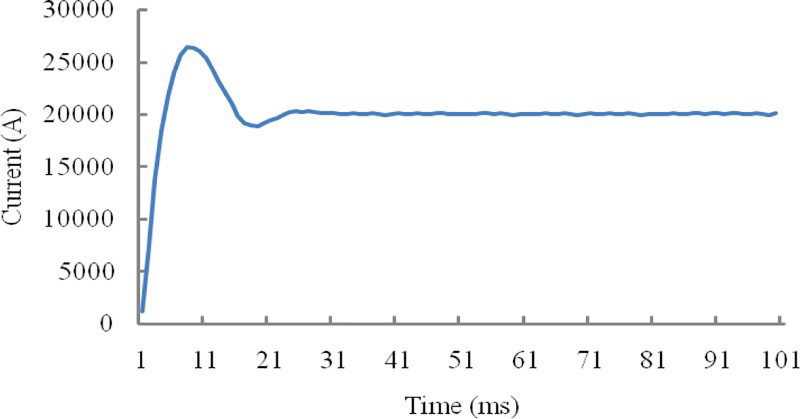
The data collecting system is mainly composed of 16 bit analogue to digital converter and 32 bit microcontroller unit. Because the frequency of the MFI-RSW machine is 1 kHz, current and voltage in each period (1 ms) are respectively processed by equations (2) and (3). Where n is number of collecting times in 1 ms, and I and U are the average values of current and voltage in 1 ms respectively. The curves of I and U measured in the experiment are shown in Figs. 5 and 6. The electrode size is φ28 mm, electrode pressure is 2500 N, current is 20 000 A and time of power on stage is 100 ms.
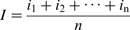
Curve of I measured in secondary circuit
Curve of U measured across electrodes
Extraction of resistance of CJ400 electrical contact
During the measuring process, electrode size determines the conducting area of the current. Electrode pressure and current directly determine the decreasing speed of Rup-contact and Rdown-contact. Therefore, in order to extract the resistance of electrical contact Rw from the dynamic resistance R, a suitable electrode size and measuring method are necessary.
Influence of electrode size on dynamic resistance R
Figure 7 shows the curve of R under different sizes of electrode. Electrode pressure is 3000 N, current is 30 000A and time of power on stage is 100 ms. From Fig. 7, it could be seen that the changing trend of two curves, which could be divided into three stages: rapidly declining stage, slowly increasing stage and stable stage, is basically consistent.
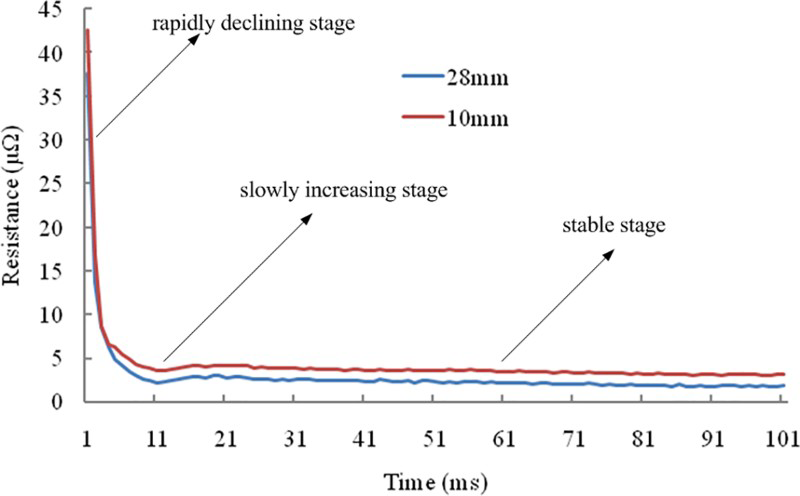
Curve of R under different electrode sizes
At the start of power on stage, the contact interface between electrical contact and electrode is still uneven under the action of preloading pressure. In addition, there is some poor conductor layer such as oxide film in the interface. So Rup-contact and Rdown-contact, which could reach ∼40 μΩ, are much bigger than Rw. During the next 10 ms, temperature is rising due to a large amount of resistance heat. Moreover, intense soften deformation occurs between contacting interface. The contacting status between the electrodes and electrical contact is largely improved. Then, Rup-contact and Rdown-contact decrease sharply, so does the dynamic resistance R. This is rapidly declining stage.
After a certain time, the contact resistance Rup-contact and Rdown-contact fell down and remained stable. However, heat accumulation during the rapidly declining stage leads to the temperature rise of electrical contact. In addition, the resistivity increases, so does Rw. Then, the dynamic resistance R increases. Since the thermal conductivity of electrical contact material is very large, coupled with the effect of the water cooling system, temperature rise is very small. So, there is a little increase in R. This is the slowly increasing stage. This stage may not be detected if the resistance heat is too small.
Finally, the speed of heat generation becomes smaller due to the declining of Rup-contact and Rdown-contact. Then, the temperature field tends to be relatively stable. R is falling in a low speed under the action of electrode pressure and resistance heat. This is the stable stage.
From Fig. 7, it is found that the dynamic resistances R under different sizes of electrode are both basically stable in the last 20 ms. So, the average value of R in the last 20 ms is regarded as stable resistance. Three characteristic parameters of each curve are listed in Table 1, where R0 is the initial resistance, which could reflect the initial contacting status between electrodes and electrical contact, Rt is the stable resistance and Re is the standard deviation of resistance in the last 20 ms, which could reflect the stability of Rt.
Characteristic parameters of R under different electrode sizes
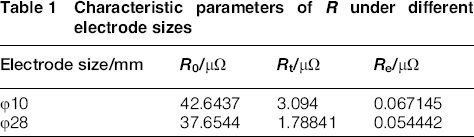
From Table 1, it could be found that the stable resistance of electrode size φ28 mm is much smaller than that of electrode size φ10 mm. For R0 and Re, there are no significant differences. When the electrode of φ10 mm is adopted, the area of electrode would be too small to cover the welding interface of electrical contact. Most current only passes through the access, which is right under the electrode, as shown in Fig. 8a. The conductive channel becomes smaller compared to the electrode of φ28 mm as shown in Fig. 8b. According to equation (4), where R is the resistance, ρ is the resistivity, l is the length of conductor and S is the cross-sectional area of conductive channel, it is known that resistance would increase if the area of conductive channel decreased. So, the measured resistance under φ10 mm electrode is much bigger than the actual resistance of electrical contact. Therefore, in order to precisely extract the resistance of electrical contact, the size of electrode should not be smaller than the welding area. So, electrode φ28 mm is adopted in the following measuring process.

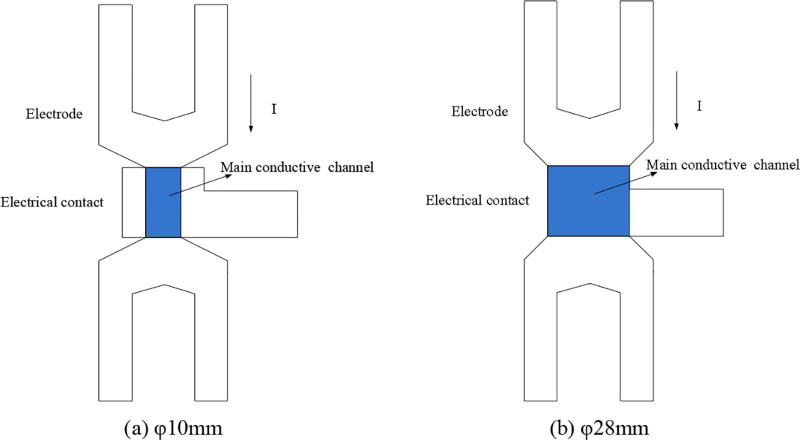
a φ10mm; b φ28mm
Influence of electrode pressure and current on dynamic resistance R
Figure 9 shows the curve of R under different current. Time of power on stage is 100 ms, electrode force is 3000 N and currents are 30 000, 25 000, 20 000, 15 000, 10 000 and 5000 A. R0, Rt and Re of each measuring process are listed in Table 2. From the results, it is found that with the increase in current, Rt decreases continuously. In addition, the highest Re is only 0.075048 μΩ. A bigger current could lead to a greater heat production. This would speed up the soften deformation in the ragged contact interface. The declining speed of Rup-contact and Rdown-contact grows faster. Then, Rt becomes smaller. However, R0 has no obvious change. This is because R0 is only related to the initial contacting status between electrodes and electrical contact.
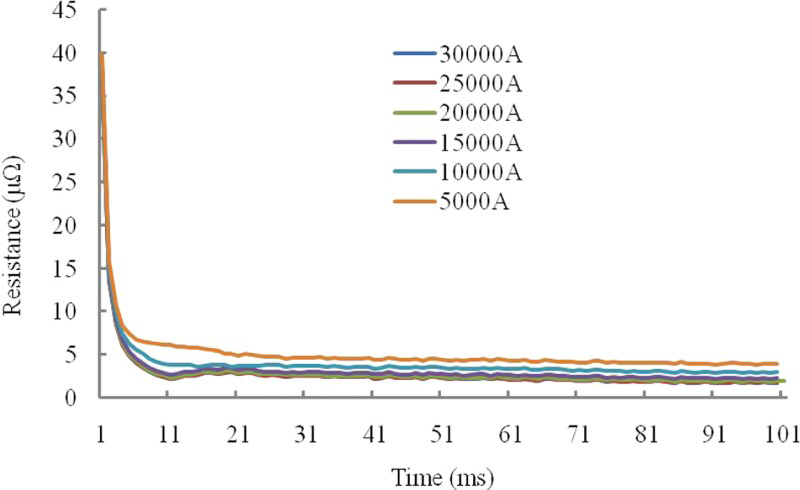
Curves of R under different current
Characteristic parameters of R under different current
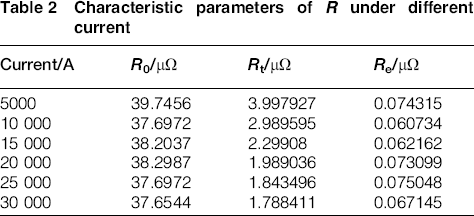
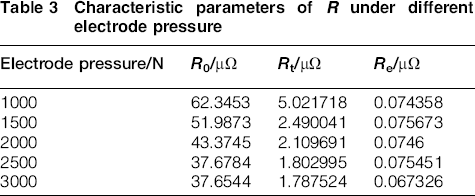
Figure 10 shows the curve of R under different electrode pressure. Time of power on stage is 100 ms, current is 30 000 A and electrode force are 3000, 2500, 2000, 1500 and 1000 N. R0, Rt and Re of each measuring process are listed in Table 3. From the results, it is found that with the increase in electrode pressure, R0 and Rt decrease continuously. In addition, the biggest Re is only 0.075673 μΩ.When the electrode pressure is over 2000 N, R0 and Rt are approximately stable at 37.7 and 1.8 μΩ respectively. Therefore, the electrode pressure should not be < 2500 N in order to extract an accurate resistance of electrical contact.
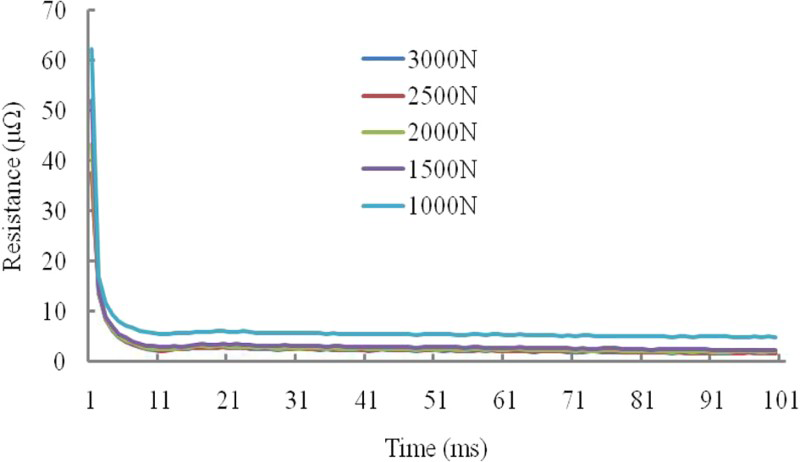
Curves of R under different electrode pressure
Characteristic parameters of R under different electrode pressure
From the above experiment, it could be known that electrode pressure has a great influence on R0. Rt is directly related to the loading current and electrode pressure. Therefore, a large current and a big electrode pressure are beneficial for eliminating Rup-contact and Rdown-contact. However, large current would lead to the increase in temperature and resistivity. Then, the extracted resistance from the dynamic resistance curve would be bigger than the actual resistance of electrical contact.
Method of multipulse measuring
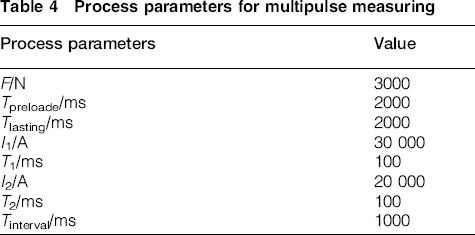
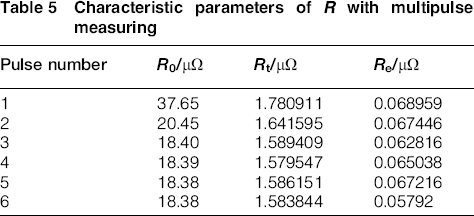
In the section on ‘Influence of electrode pressure and current on dynamic resistance R’, power on stage of the resistance measuring process is only of single pulse. In order to eliminate the error of resistance caused by temperature rising, method of multipulse measuring is adopted in this research. The first pulse with large current is mainly used to eliminate Rup-contact and Rdown-contact. The rest pulse with small current is mainly used for resistance measurement. Six pulses are loaded in this experiment; the measuring process is shown in Fig. 11. The measuring process parameters are listed in Table 4. Where F is electrode pressure, Tpreloade is time of pressure preloading, Tlasting is time of pressure keeping, I1 is current of the first pulse, T1 is time of the first pulse, I2 is current of the second pulse, T2 is time of the second pulse and Tinterval is the internal time of each pulse. The current and loading time of the rest four pulses are the same as those of the second pulse. The measuring result is shown in Fig. 12. R0, Rt and Re of each pulse is listed in Table 5.
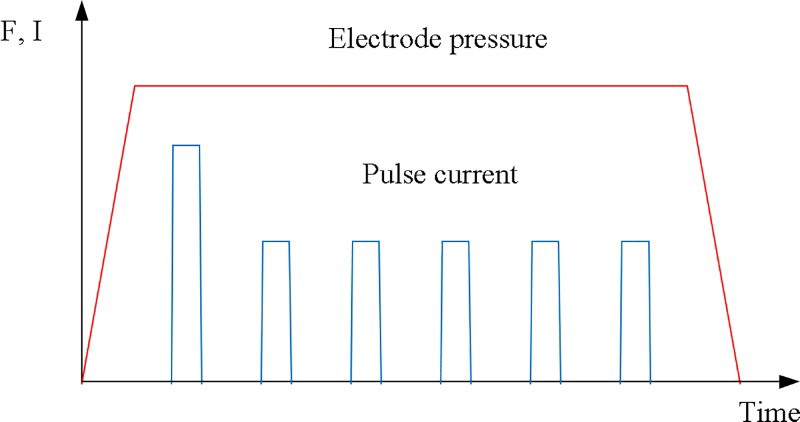
Process of multipulse measuring
Process parameters for multipulse measuring
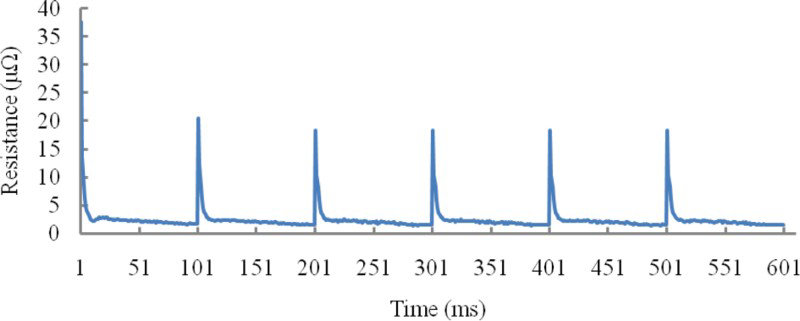
Curve of R with multipulse measuring
Characteristic parameters of R with multipulse measuring
Ultrasound scan pictures of welding interface before and after the multipulse measuring are displayed in Fig. 13. It could be found that there are almost no differences between the two pictures. Defects of incomplete penetration did not disappear after the measuring process. The measuring process did not have any influence on the welding interface.

a before measurement (brazing rate 93.7%); b after measurement (brazing rate 93.7%)
From Table 5, it is found that R0 and Rt decrease continuously in the process of the first three pulses. During the first pulse, the yield strength becomes smaller with the rising of temperature. Large material soften deformation occurs between the contacting interface. In addition, the contacting status is improved. Rup-contact and Rdown-contact could be eliminated to a great extent. During the internal time between the first and second pulse, the temperature is decreased. The yield strength becomes bigger. So, part of the deformation is restored. Rup-contact and Rdown-contact are increased again. Then, the dynamic resistance peak appears after the first pulse in Fig. 12. For there are still part of the deformation that could not be restored, R0 of the second pulse is less than that of the first pulse. From the analysis of dynamic resistance curve in the section on ‘Influence of electrode size on dynamic resistance R’, it could be known that a large amount of resistance heat caused by the big current during the first pulse would lead to the increase in Rw. However, during the subsequent interval time, temperature of electrical contact would decrease because of water cooling system. Since the current of second measuring pulse is smaller than that of first pulse, the initial resistance temperature also decreases. The heat generation of the second pulse and the error of resistance become smaller. So, Rt decreases.
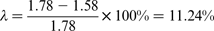
The percentage difference of Rt between pulse number 1 (1.78 μΩ) and pulse number 6 (1.58 μΩ) could be calculated as 11.24% by equation (5). It is concluded that with the method of multipulse measuring, Rup-contact, Rdown-contact and the error of resistance caused by temperature rising in the measuring process could be eliminated to a great extent. Moreover, by the method of multipulse measuring, the stability of measured results is more guaranteed compared to the method of single pulse measuring. So, the method of multipulse measuring was adopted in this research. Since R0 and Rt are approximately stable at 18.4 and 1.6 μΩ respectively after the third pulse, Re of each pulse is no greater than 0.07 μΩ, which is only ∼4.4% of Rt. So, the average value of Rt in the last four pulse is approximately regarded as Rw.
Relationship between resistance and welding quality
Currently, brazing rate and shear strength are regarded as welding quality inspection standards for electrical contact. In this research, the resistances of 20 electrical contacts are extracted with method of multipulse measuring. The relationship among brazing rate, shear strength and resistance is shown in Figs. 14 and 15.
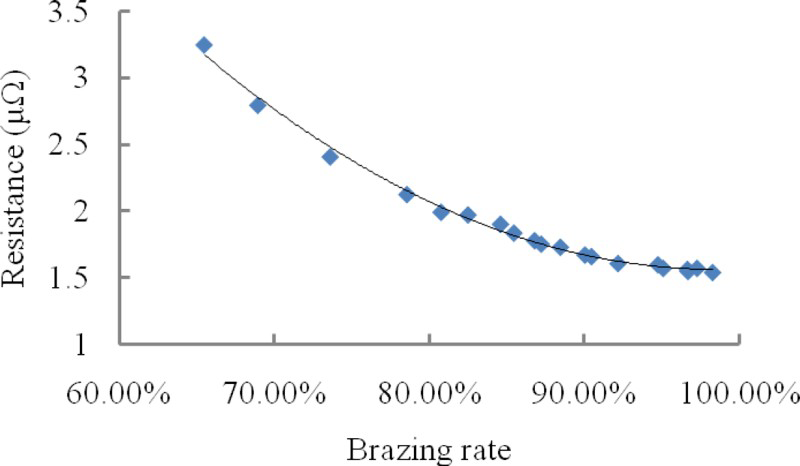
Relationship between brazing rate and resistance
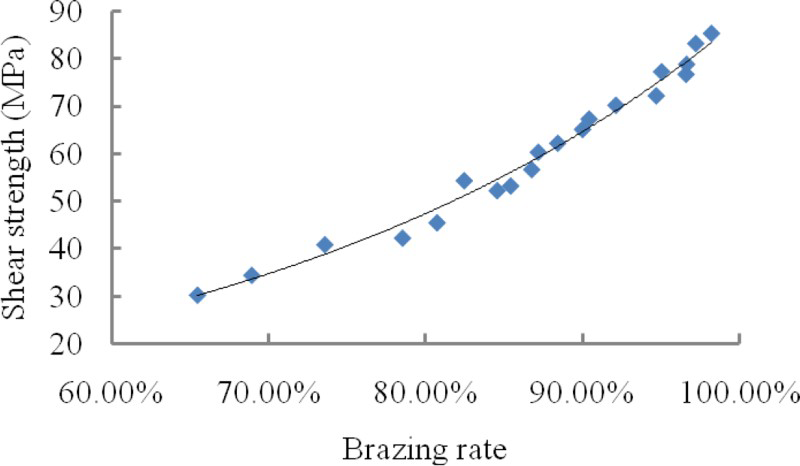
Relationship between brazing rate and shear strength
The equipment for ultrasonic C scanning is JTUIS-II produced by Xi'an Jiaotong University. Focused mode is adopted in the measuring process. The frequency of probe is 10 MHz. The step length is 0.2 mm. Electronic universal testing machine is adopted in the shear strength test. The shear rate is 2 mm min− 1. The shear strength could be obtained by dividing the shear force by the area of welding interface.
Figure 14 indicates that with the increase in brazing rate, resistance becomes smaller. Because the current could not directly flow through the defect of incomplete penetration, the defect of incomplete penetration would narrow down the cross-sectional area of conductive channel. This would lead to the increase in resistance. So, with the increase in brazing rate, the defect of incomplete penetration decreases and the resistance becomes smaller. Figure 15 shows that with the increase in brazing rate, shear strength increases. Since brazing rate directly reflects the effective welding area, the shear strength would become bigger with the increase in effective welding area.
The purpose of this research is to realise the accurate prediction of welding quality based on the resistance. Therefore, in order to study the specific relationship among brazing rate, resistance and shear strength, the data in Figs. 14 and 15 need be fitted with the standard that the difference between the fitting results and actual value is very small. So, the fitting formula should not be limited to a particular equation.
The fitting results are shown in equations (6) and (7) respectively, where x is brazing rate, y is resistance and z is shear strength. With the two equations, the welding quality could be estimated by brazing rate and shear strength calculated based on the resistance, which could be easily extracted. In order to verify the feasibility of quality inspection, the experimental results of 12 electrical contacts are shown in Figs. 16 and 17. For brazing rate, the RMS error and maximum absolute error are 3.92 and 5.87%. For shear strength, the RMS error and maximum absolute error are 1.63 and 6.73 MPa. So, it proves that the resistance is very effective at estimating the welding quality of CJ400 electrical contact.

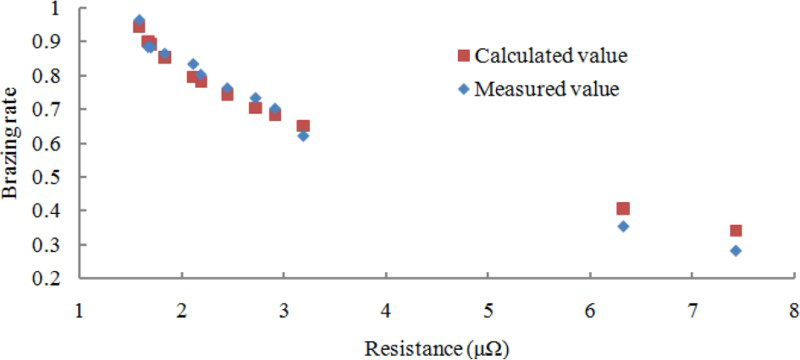
Compared results of brazing rate
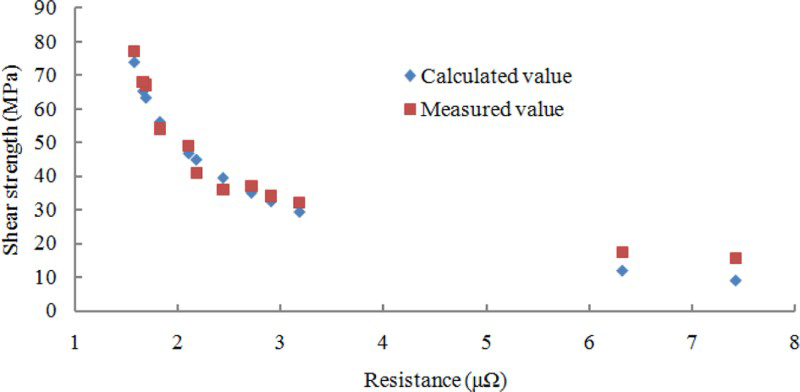
Compared results of shear strength
Conclusions
In this research, the resistance of CJ400 electrical contact was measured with the device MFI-RSW machine. Through the comparative study of different measuring methods, it is found that a relatively accurate resistance of CJ400 electrical contact could be extracted by multipulse measuring. Then, the relationship among the resistance, brazing rate and shear strength was realistically studied. By the comparing experiment between the calculated value and measured value, it is concluded that it is reliable to inspect welding quality by the resistance of electrical contact.