
Abstract
This paper aims at the experimental investigation of time dependent non-linear relationship between critical carbonation depth and corrosion rate of steel in carbonated concrete by laboratory controlled experimentation under severe environmental condition. In this research, three-dimensional experimental observations are taken consecutively involving carbonation depth, half-cell potential and elapsed time as well as the gravimetric corrosion mass loss. The experimental observations revealed an interesting non-linear relationship between the above said measurements due to the varying resistivity of carbonated concrete. It is also found that the carbonation induced corrosion does not start until the carbonation depth reaches a certain critical level from the steel rebar and the half-cell potential values become constant after carbonation reaches the critical depth and then start rising again after carbonation reaches the rebar level.
Introduction
The corrosion of steel in carbonated concrete is typically defined as the chemical reaction between atmospheric carbon dioxide and the products of hydration, mainly calcium hydroxide reducing the pH of concrete and destroying the passive layer on steel rebars embedded in concrete which gives start to corrosion. In the past, several researchers have investigated the phenomenon of carbonation and its effect on corrosion of reinforced concrete structures. Several studies have evaluated the carbonation process and associated corrosion rates at macro and micro levels.1–5 Dangla and Dridi6 investigated rebar corrosion in carbonated concrete exposed to varaible humidity conditions. Law and cairns7 investigated that carbonation induced corrosion is much less in magnitude than chloride induced corrosion. However, Pakwat and Uomoto8 (2004) showed that carbonation causes conversion of fixed chloride to free chloride which increases the rate of corrosion and has a conflicting opinion. There are several more researchers who studied carbonation process and associated corrosion in concrete.9–13 Uomoto and Takada14 reported factors increasing rate of carbonation of concrete and successive corrosion as increasing exposed time, increasing water/cement ratio, increasing concentration of CO2 and increasing temperature. Huet et al.15 investigated the variation in pH induced by carbonation of the concrete cover. The experiments performed by Tuutti16 on carbonated concrete exposed to different humidity levels have shown that the corrosion rate exhibits a maximum value in the high range of humidity more than 80% and a discontinuity in the low range of humidity. Gjørv17 reported that the maximum carbonation of concrete is at 50% RH. However, Suryavanshi et al.18 reported that carbonation rate was maximum at 55% relative humidity (RH) and has a difference of opinion.
From the literature review, it was revealed that significant research on the actual time dependent experimental relationship between carbonation depth contour and the rate of corrosion progress under air dry humidity conditions is limited. This leads to the objectives of this paper which include experimental investigation of time dependent relationship between carbonation depth and corrosion rate of steel in carbonated concrete. The paper also discusses the extent of possible corrosion damage that can occur due to carbonation under severe environmental conditions for maximum carbonation rate and determination of critical depth of carbonation which also has conflicting opinion and limited research data in the past.
Experimental
Experiment was conducted to investigate the relationship between critical carbonation depth and corrosion rate of steel in carbonated concrete as a function of time and to determine the extent of maximum corrosion rate in fully carbonated reinforced concrete.
Materials
Deformed round carbon steel bars 13 mm in diameter were used as reinforcing material in the experiment specimens. Ordinary Portland cement (OPC) as per JIS R5210 specifications was used. Natural river sand passed through JIS A1102 sieve no. 4 (4·75 mm openings), was used as fine aggregate for all concrete mixes. Its density and water absorption were 2·65 g cm−3 and 2·21% respectively. Crushed sandstone with a maximum size of 20 mm was used as coarse aggregate with density of 2·70 g cm−3 and water absorption 0·59%. Trial concrete mixing was firstly conducted as per JCI mix design to achieve 5-8 cm of slump value and 3·5±1% of air content (Table 1).
Mix proportions

Specimen preparation
In this experiment, two prismatic specimens of 200×100×100 mm (L×W×H) size were made in duplicate. Thin concrete cover of 13 mm was used to enable faster carbonation access from the surface of concrete to the rebar. Schematic and actual diagram of the prismatic concrete specimen is shown in Fig. 1. The reinforced specimen had two 13 mm diameter steel bars, one emerging out from two side for half-cell potential measurement and the other completely submerged into the concrete for gravimetric mass loss determination. Concrete was poured in four layers and each layer was compacted by standard tamping method. The specimens were cured for 28 days under sealed conditions at 20°C.
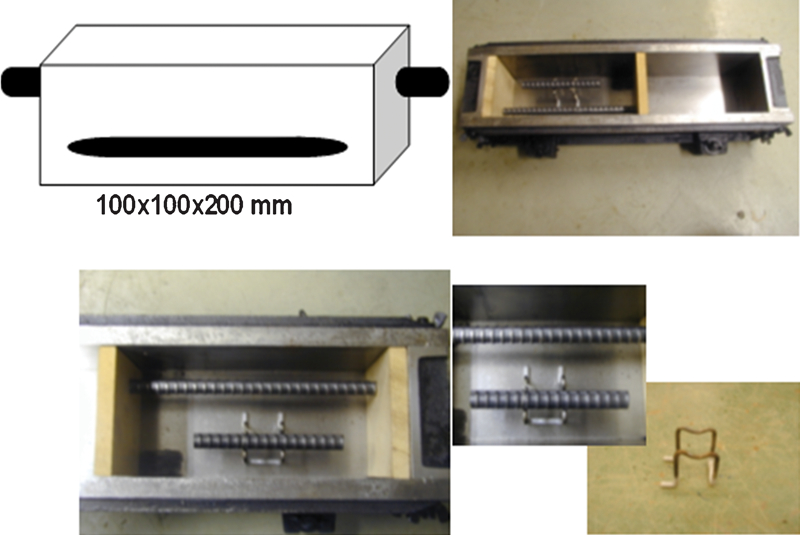
Schematic and actual diagram of test specimen
Experimental methodology and environmental conditions
Reinforced concrete (RC) specimens were carbonated in environment control carbonation chamber at 10% carbon dioxide concentration, 30°C and 55%RH which are considered to be the most severe conditions for maximum carbonation rate.14,18 Please note that the actual concentrations of carbon dioxide are ∼0·03% in an outdoor atmosphere and 0·07% in an indoor atmosphere. Since carbonation is a slow process, the experiment was accelerated by adoption of high level of carbon dioxide concentration and low concrete cover. Therefore, conclusions drawn relate only to the experiment as described. After complete carbonation and completion of one year post-carbonation exposure duration, the specimens were split along the position of steel in concrete and steel bars completely embedded in concrete for gravimetric mass loss calculation were removed. Following the photographic documentation of bar condition, the specimens were subjected to aggressive cleaning in accordance with ASTM G1-03, method C.3·1 (2002)19 and weighed to the nearest 0·0001 g immediately after drying using standard systematic step by step cleaning method.22
Results and discussion
Carbonation depth and half-cell corrosion potential
Carbonation depth of specimen was measured by spraying phenolphthalein solution on freshly cut surface of specimen as shown in Fig. 2. It should be noted that one per cent phenolphthalein solution (in ethanol) has been used in this experimentation which shows purple red colouration for all pH values of concrete greater than pH 11. The unchanged colour zone shows carbonated portion of concrete, while the portion changed to purple red shows non-carbonated zone. Because two surfaces were not coated by epoxy, carbonation depths were measured at four different points from both exposed surfaces. Their average values have been determined and presented in this paper. The results of experimental measurements for two prototype specimens (specimen no. 1 and 2) are shown in Fig. 3.
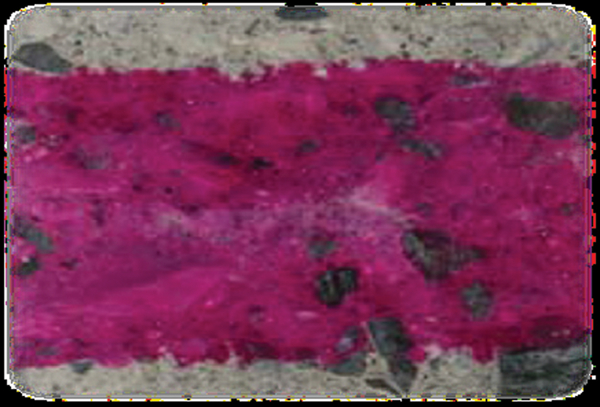
Carbonation depth measurement in experiment
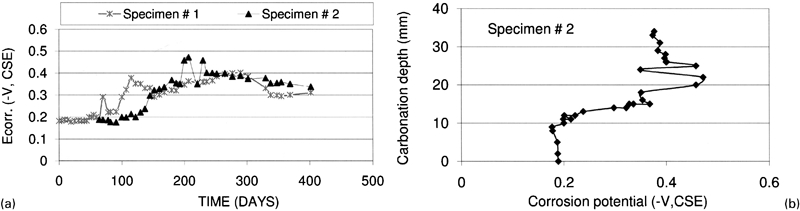
Carbonation depth and corrosion potential measurements as function of time
It can be seen from Fig. 3 that the half-cell potential values vary with time duration and depth of carbonation. The half-cell potential values are roughly above −200 mV(CSE) until the carbonation reaches near steel bar which has 13 mm concrete cover. It can be seen that when carbonation reaches just before the level of rebar, i.e. at 10 mm the half-cell potential becomes more negative from about −200 to −400 mV(CSE) until it reaches the surface of reinforcement bar. Before that the half-cell potential seems almost constant throughout the 10 mm concrete cover. It means that 10 mm is the critical carbonation depth at which the corrosion level becomes more negative. Therefore, it can be said that the carbonation induced corrosion does not start until the carbonation depth reaches a certain critical level of depth from the steel rebar. As rough approximation, it can be said that this critical carbonation depth is 80% (10 mm/13 mm×100 = 77%) of the total depth of concrete cover.
Another interesting fact that was seen from the experiment results shown in Fig. 3 is that the half-cell potential values after the carbonation reaches the rebar level become more positive again. It can be seen from the Fig. 3 that the half-cell potential after reaching the peak negative value of −475 mV(CSE) becomes more positive to −320 mV(CSE). The reason is sought to lie in the varying resistivity of carbonated concrete. As the carbonation reaction proceeds, the resistivity of concrete increases which reduces the electrolytic conductivity of the pore solution resulting in reduction of the corrosion rate. Therefore, it can be said that the carbonation induced corrosion has a falling trend with the passage of time.
Carbonation induced corrosion mass loss and corrosion rate
The two identical specimens were broken and embedded steel bars were taken out for gravimetric corrosion mass loss determination. This mass loss was converted to corrosion rate by using Faraday's law.2020 The results are shown in Fig. 4. The average corrosion rate of the two specimens lies ∼3·25×10−3 g/cm2 year which corresponds to 0·325 μA cm−2 of corrosion current. Compared with chloride induced corrosion in general, this value is not very high and can be pronounced as a low rate of corrosion. However, it should be mentioned over here that in the case of carbonation induced corrosion high relative humidity plays a decisive role. The increased resistivity is due to reduction of pores in the range of 20-1000 nm diameter as a result of voluminous carbonation products.21 Due to the increased resistivity and reduced electrolytic conductivity of carbonated concrete, it needs high relative humidity to maintain high rates of corrosion. Since the specimen were exposed to 55%RH during carbonation and 60%RH after full carbonation until the end of experiment, the corrosion rates obtained by carbonation induced corrosion are in the low range. It is believed9 that 80%RH is ideal for producing high corrosion rates due to carbonation. However, there is a possibility that high relative humidity may clog the concrete pores resulting in reduced connectivity of porous media causing reduction in the diffusion of gaseous oxygen from the environment to the rebar surface and ultimately reducing the rate of steel corrosion in concrete. Therefore, in the future research carbonation induced corrosion rate should be investigated for high relative humidity conditions more than 80%RH.
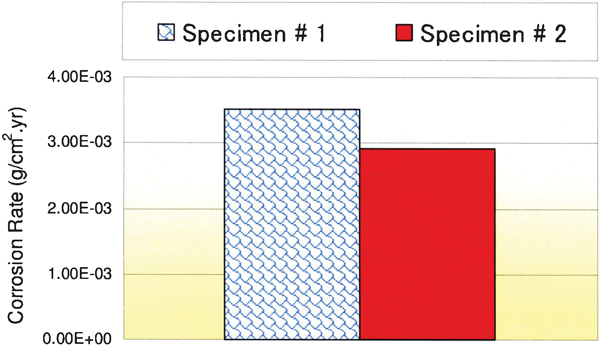
Carbonation induced corrosion rates
Conclusions and scope for future research
From the experiments results, it is found that the half-cell potential values of corroding rebars fluctuate non-linearly with the time and depth of carbonation. The half-cell potential of rebar in non-carbonated and fully carbonated concretes varies between −180 and −475 mV(CSE). The carbonation induced corrosion cannot start until the carbonation depth reaches a certain critical level of depth from the steel rebar. This critical carbonation depth has been calculated as 80% of the total depth of concrete cover in this research. As the carbonation reaction proceeds, the resistivity of concrete increases, which reduces the electrolytic conductivity of the pore solution resulting in reduction of the corrosion rate. Therefore, it can be said that the carbonation induced corrosion has a falling trend with the passage of time. The corrosion rate due to carbonation under air dry humidity condition (55-60% RH) is calculated as 0·325 μA cm−2 (3·25×10−3 g/cm2 year) on average basis which is much lower than chloride induced corrosion in general and can be pronounced as a low rate of corrosion. As a scope for future research, carbonation induced corrosion rate should be calculated experimentally for high relative humidity conditions more than 80% RH.