
Abstract
Corrosion behaviour of nanocrystalline Zn–Ni alloy coatings (with 3 to 18 at-%Ni) electrodeposited on steel substrate from additive free chloride baths by DC plating has been investigated by measurement of open circuit potential with time and neutral salt spray test. The alloy coatings containing up to 16 at-%Ni exhibited an increase in resistance to the appearance of white and red rust with increasing Ni content. The resistance to the appearance of white rust and ability to protect the underlying steel substrate decreased with further increasing Ni content. This has been considered to be due to reduced passivating ability of the alloy coating with a significant rise in the grain size above 50 nm.
Introduction
For many years, Zn has been the most widely used corrosion resistant coating for steel. This is because of its ability to provide efficient and reliable corrosion protection at a relatively low cost. However Zn coating must be thick enough to endure attack of a corrosive environment,1 because Zn is consumed sacrificially at a relatively high rate while under exposure to corrosive conditions. The major drawback of thick coatings is poor weldability and formability and difficulty to achieve specular finish after painting.2
Numerous studies have concluded that alloying with elements of the eighth group (Fe, Ni, Co) can improve the corrosion performance of electrodeposited Zn significantly along with improvement in mechanical properties.3 – 5 Among the Zn alloys, Zn–Ni alloys with different Ni contents have been the most successful.6
It is known that corrosion resistance of nanocrystalline alloys is comparable to that of extremely homogenous amorphous alloys.7 – 10 In the case of two phase nanocrystalline alloys, a corrosion resistant matrix phase predominantly determines the corrosion behaviour as long as the size of less corrosion resistant heterogeneity areas or the precipitates remains less than a critical limit of 15-20 nm, depending upon the alloy system.7 This is due to the fact that the passive film formed by the more corrosion resistant matrix phase covers the less corrosion resistant precipitates completely. When the size of the precipitates exceeds the critical limit, the protective passive film does not cover the precipitates completely causing deterioration in corrosion resistance.
The passivating ability of single phase nanocrystalline alloys has been shown to be comparable to their amorphous8 and superior to their conventional crystalline11 counterparts. In single phase crystalline alloys, the compositional heterogeneity is minute, although the grain boundaries constitute a defect structure which is less densely packed as compared to that of grain interiors.11 The structure of the grain boundaries is known to vary with grain size within the nanocrystalline range due to structural relaxations.12 It is not surprising that the grain boundaries in the nanocrystalline alloys are less damaging to their passivating ability. However, there must be some critical limits in grain size above which deterioration in corrosion resistance may occur.
Previously, the authors have prepared nanocrystalline Zn–Ni alloys by DC plating in additive free chloride baths.13 A wide range of grain sizes have been achieved in the form of γ phase. It may be interesting to study the effect of grain size on corrosion behaviour of these Zn–Ni alloy coatings and their ability to protect underlying steel substrate.
Open circuit potential measurements have been performed along with salt spray tests. Salt spray tests have been more useful to compare the corrosion resistance of coatings and thereby their ability to protect the underlying steel substrate. Some emphases have also been laid on the nature of the corrosion products.
Experimental
Electrodeposition
Electrodeposition of Zn–Ni alloys was carried out under galvanostatic conditions at a current density of 700 A m−2 using potentiostat/galvanostat AMEL model 2051. A platinum foil (exposed area of 1 cm2) served as the anode while cold rolled mild steel specimen with an exposed area of ∼3·3 cm2 was used as substrate (cathode). The substrate surface was cleaned by mechanically polishing using SiC paper up to a fine grit of 1500, followed by ultrasonic cleaning in ethanol. Reproducible surface was thus attained with scratches of mechanical polishing. For good adhesion of the coating with the substrate, the substrate was also microetched in 10% HCl solution for ∼30 s, followed by rinsing with distilled water. The surface appearance remained intact after microetching, as examined by optical microscopy. The anode and the cathode were separated by about 3-4 cm and immersed vertically in the plating bath. The analytical grade chemicals were used along with doubly distilled water to prepare the solutions. They contained different composition of ZnCl2 and NiCl2.H2O (Table 1) while H3BO3 was used as buffer. Agitation was not performed. The temperature was maintained at 45±0·5°C in a hot water bath.
Composition of plating baths employed for electrodeposition of Zn–Ni alloy coatings

Corrosion tests
NaCl solution of 3·5% with pH of about 6·9±0·1 was used for electrochemical measurements. Electrochemical experiment was performed in a three-electrode glass cell. A saturated calomel electrode and a platinum foil served as a reference and a counter electrode respectively. Changes in the open circuit potentials (corrosion potential) of the coatings with time were recorded at 298 K using potentiostat/galvanostat AMEL model 2051 and Junior Assist software. The open circuit potentials or corrosion potentials of the coatings were measured continuously for a period of 48 h. Salt spray test was performed in 5% NaCl fog for 75 h in accordance with the ASTM B117 specifications. The temperature in the chamber was set at 25°C. The appearance of the white and the red rust was monitored and recorded at intervals of about 1-2 h. After a maximum exposure of about 7-8 h during one day, the spray was stopped and the samples were removed to examine in clear atmosphere before and after washing. The samples were then dried and placed in dry atmosphere for overnight, before they were again placed in the spray chamber for further exposure to the corrosive environment.
Characterisation of coatings
The surface morphology of the deposits before and after the corrosion tests was observed using scanning electron microscope (SEM, JEOL JSM-5910). Chemical composition of the deposits was determined by energy dispersive X-ray spectroscopy (EDX) and X-ray fluorescence spectroscopy (XRF). The analysis was performed at two or three locations on the surface of deposits and average values have been reported in results. An X-ray diffractometer (Bruker D8 Discover) equipped with Cu Kα radiation (λ = 0·15418 nm) was used to obtain the XRD patterns of the deposits before and after corrosion tests. The crystallite size was estimated by applying the Scherrer's formula.14 The most intense peak was used, and the full width at half maximum (FWHM) was determined using EVA software of Bruker (Karlsruhe, Germany). The error in fitting was less than 5%. Before fitting Kα 2 subtraction was also performed, using the same software. The measured FWHM was also corrected for machine broadening, as follows

Results and discussion
Alloy deposits
Table 2 shows the composition of the alloy coatings, obtained by EDX and XRF, which are in close agreement.
Chemical composition of coatings determined by XRF and EDX, at-%
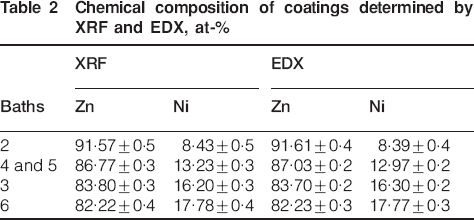
Figure 1 shows typical XRD patterns of the Zn and Zn–Ni alloys deposited on steel substrate in various additive free baths by DC plating at 700 A m−2. As previously noted,13 the structure of Zn–Ni alloy coatings depends mainly on Ni content of the alloy. Electrodeposits with 8 at-%Ni exhibit both the η (hcp Zn) and γ (Ni5Zn21) phases, while those with 13% and above have only single γ phase. It may be noticed that relative intensities of (330) and (600) reflections of γ phase vary with the alloy composition obtained in different electrolytic baths. It has been shown earlier13 that texture of the alloy deposits varies with the solution chemistry. Hence, the γ phase with a relatively lower Ni content formed in comparatively Ni deficient baths grows with preferred orientation of (110) or (330); on the other hand, (100)/(600) texture is favoured in the deposits with a relatively increased Ni content (formed in the baths with a comparatively higher Ni content).
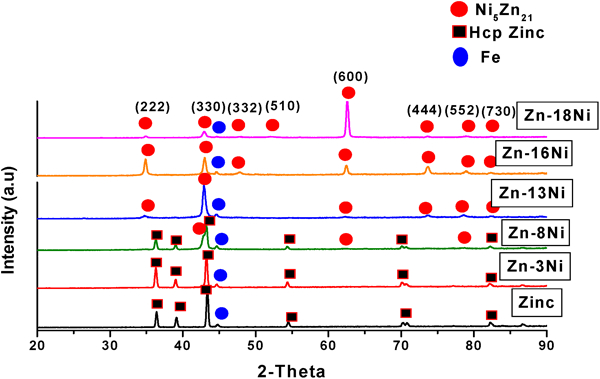
X-ray diffraction patterns of Zn–Ni alloy coatings electrodeposited in additive free chloride baths at 700 A m−2
The grain size of the deposits estimated from X-ray peak broadening with the help of Scherrer's formula is shown in Fig. 2. It is clear that grain size varies with Ni content, and with more than 16 at-%Ni, grain size rises rapidly and Zn–18Ni has the largest grain size of ∼50 nm. The small grain size of the alloys with less than 16 at-%Ni may be due to non-stoichiometry, the excess Zn may possibly be residing at grain boundaries.13

Estimated grain size of electrodeposits as function of alloy composition
Growth morphology affects the surface features and roughness of electrodeposited coatings. Figure 3 shows typical SEM micrographs of Zn–Ni alloy deposits. No cracks are observed on the surface. The surface morphology of the deposits varies with the Ni content of the alloy deposits. For instance, rounded nodules are formed in pure Zn. Flower-like nodules are seen in the Zn–8Ni alloy coating. Nodules appear to be composed of tiny grains with increasing Ni content to ∼13 at-%. The size of the nodules at the surface decreases with improved smoothness as the Ni content of the deposits increases. It may be worth mentioning here that SEM images reveal the surface/growth morphology at the interface of the deposit and the electrolyte, while the grain size that is a bulk property can be more accurately determined from X-ray peak broadening (Fig. 2). Hence, the protuberances seen by the SEM images may be composed of a large number of tiny (nano-) crystallites that could not be revealed by the SEM images at the magnification employed in the present work.
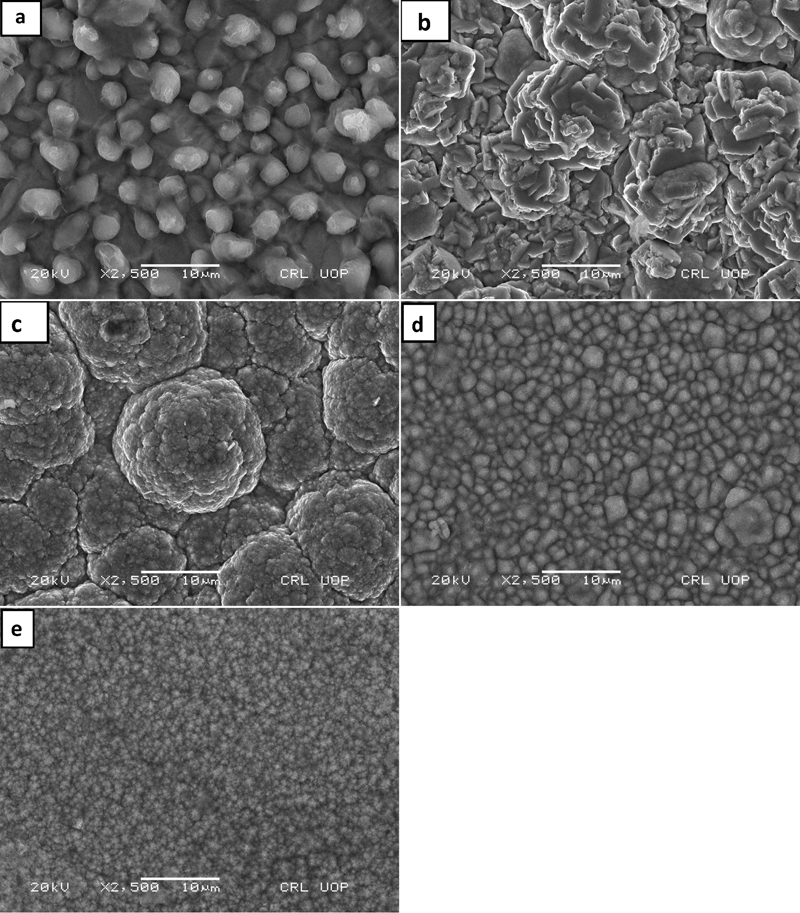
Images (SEM) of electrodeposited alloys
Corrosion studies
Open circuit potential measurement
The plots of variation of open circuit potential with time for various Zn–Ni alloys are shown in Fig. 4. It is observed that as the Ni content in the alloy increases, corrosion potential shifts towards relatively nobler values. The corrosion potential of Zn–3Ni is close to that of pure Zn. It may be noticed that only hcp Zn phase is formed in the Zn–3Ni alloy coating (Fig. 1). The alloy Zn–8Ni is composed of two phases, i.e. hcp Zn and γ phase (Fig. 1). Initially the potential stays close to that of Zn. After ∼40 h, the potential shows a substantial rise, which may possibly be due to preferential dissolution of η-Zn from the top most surface. It may be noted that the potential of this alloy coating after an open circuit immersion for ∼48 h is close to that of Zn–13Ni and Zn–16Ni alloy coatings, which comprises only single γ phase (Fig. 1). The gradual increase in corrosion potential of Zn–13Ni and Zn–16Ni alloy coatings may suggest continued dezincification without any major phase change at the surface. Nevertheless, Zn–18Ni alloy coating appears to undergo a phase change (due to dezincification) at the surface as indicated by a significant rise in corrosion potential between 10 and 25 h of immersion time.
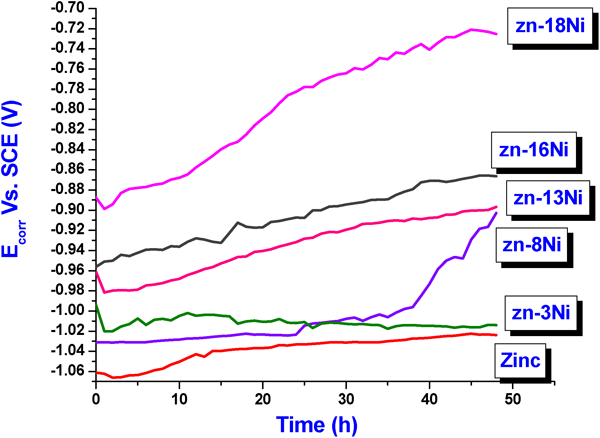
Variation of corrosion potential E corr with immersion time for various Zn–Ni alloy coatings in 3·5 wt-% NaCl solution
It has often been considered that open circuit potential is a key parameter in determining the corrosion resistance of Zn–Ni alloy coatings and their ability to protect that underlying steel substrate. For instance, it is believed that increasing Ni content improves the corrosion resistance of the Zn–Ni alloy coatings, which is advantageous upto a certain extent beyond which sacrificial character of the coating is impaired. It we completely rely on this, we may consider that protectiveness of Zn–8Ni alloy should be similar to that of Zn–13Ni and Zi–16Ni alloys as their open circuit potentials are close to each other after ∼48 h (Fig. 4). Furthermore, the Zi–18Ni alloy coating itself should exhibit the highest corrosion resistance, irrespective of its ability to protect the underlying substrate.
Some other contrary aspects regarding the corrosion resistance of Zn–Ni alloy coatings and their associated ability to protect the underlying steel substrate have been noticed by salt spray tests.
Salt spray studies
Salt spray test was performed on the Zn–Ni alloy coatings using 5% salt fog according to ASTM B117 specification. The exposure time for the appearance of red rust and white rust was recorded. The former being related with the formation of Fe hydroxide may be used as a measure of the ability of sacrificial coating to protect the underlying steel substrate, and the later may be used as a measure of ability of the coating to resist the formation of thick Zn (hydro-) oxides by corrosion.
Figure 5 shows the elapsed time before the appearance of white rust and red rust. The results show that the white and red rust resistance of Zn–Ni alloy coatings is superior to that of pure Zn, and it increases with increasing Ni content up to 16 at-% and then decreases with the addition of 18 at-%Ni in Zn. Zn–16Ni provides the best protection; the time for the appearance of white rust of this alloy is almost two times that of pure Zn. The test was performed for ∼75 h and it is interesting to note that Zn–13Ni alloy just showed onset of red rust formation, while Zn–16Ni did not yet loose its ability to protect the underlying steel. It may be noted that the resistance to the red and the white rust was lower for the Zn–18Ni alloy coating in comparison with Zn–13Ni and Zn–16Ni alloy coatings.
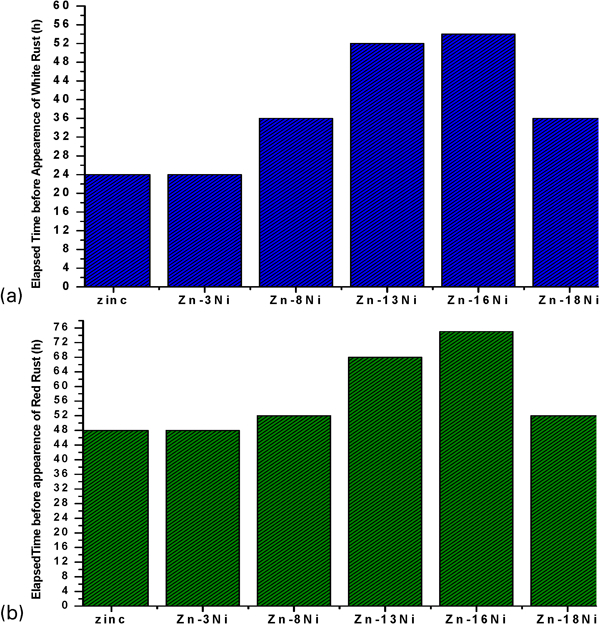
Time of formation of rust with alloy composition
Figure 6 shows typical SEM images of Zn–13Ni, Zn–16Ni and Zn–18Ni, after 75 h exposure to salt spray. The surface appearance is completely different from the as deposited morphology and the cracks are numerously seen, due to corrosion damage and the formation of corrosion products. The underlying substrate is seen to expose at a number of places in the alloy coatings with 13 at-%Ni (Fig. 6a and b) and 18 at-%Ni (Fig. 6e and f). Although cracks were seen but sufficient damage to expose the underlying steel substrate was not revealed by SEM images in the Zn–16Ni alloy sample, as typically shown in Fig. 6c and d. This observation is in agreement with the fact the fact that red rust was not seen in the Zn–16Ni alloy sample. Figure 7a shows EDX spectrum obtained from region A in Fig. 6f, along with the results of composition analysis in the inset, showing excess amount of Fe with little amount of Zn, confirming that this is the steel substrate exposed after dissolution of overlying coating. Analysis of region B from the coating (Zn–16Ni) in Fig. 6d using EDX is shown in Fig. 7b, along with results of the composition analysis in the inset. The relative ratio of Zn/Ni is 40·12∶1·56, which is much larger than that in the alloy coating. Furthermore, large amount of chlorine and oxygen is also seen. Hence, it may be suggested that the coating is covered by thick corrosion products.
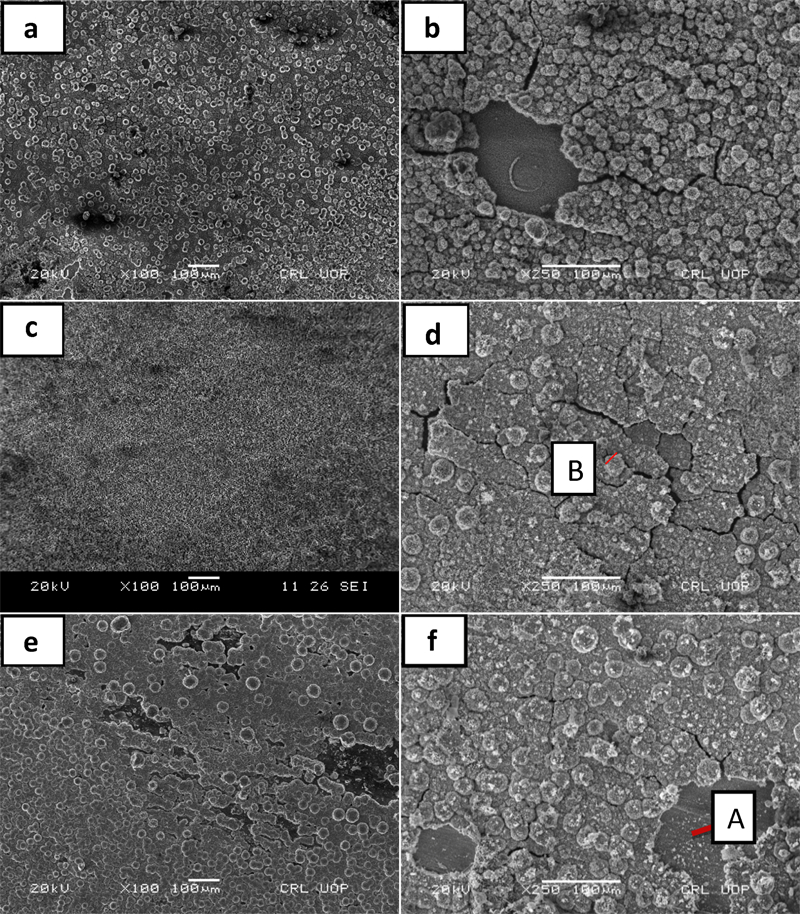
Images (SEM) of electrodeposited alloys after salt spray test for 75 h
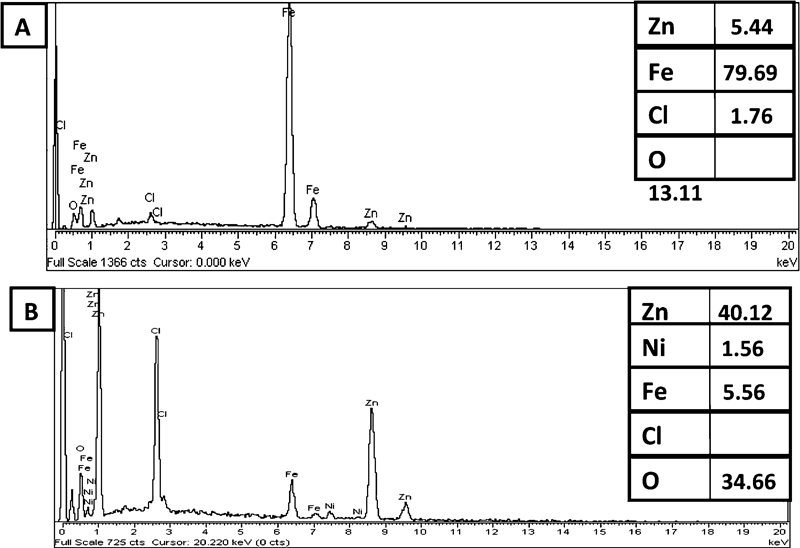
Analysis of a region A in Fig. 6f and b region B in Fig. 6d using EDX
X-ray diffraction was performed in order to identify the corrosion products formed on the Zn–Ni alloys in the salt spray test for 75 h. The XRD patterns of the samples before and after exposure to salt spray tests are shown in Fig. 8. It is observed that surfaces of the Zn–Ni alloys are covered by ZnO and Zn5(OH)8Cl2.H2O, although the X-ray reflections of alloy phases are still seen in respective XRD patterns. Poor X-ray reflections of crystalline oxide in the Zn–18Ni sample may be due to poor crystallinity of corrosion products, possibly due to hydration.
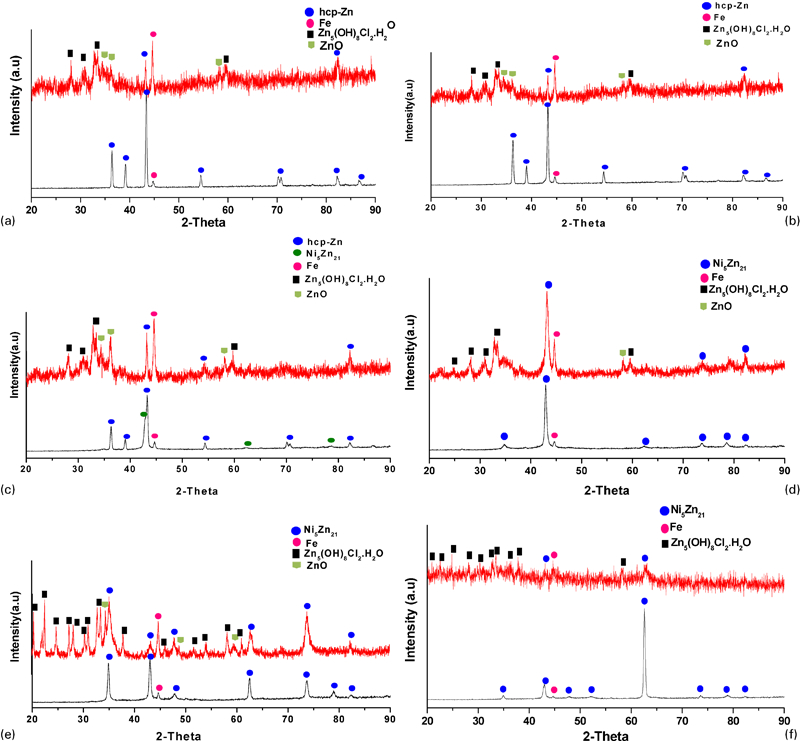
X-ray diffraction patterns of electrodeposited Zn–Ni alloy coatings after salt spray test for 75 h
The comparatively shorter time for the formation of white rust (Zn hydroxychloride) in the Zn–18Ni alloy coating in comparison with Zn–16Ni and Zn–13Ni alloy coatings indicates that the Zn–18Ni alloy itself is less corrosion resistant in spite of improved compactness and a higher Ni content (Fig. 5).
It has been shown by Mehmood et al.7 – 10 that corrosion resistance of the alloys depends on the size of the alloy heterogeneity. The present work on the single γ phase nanocrystalline alloys may suggest that the grain size of the single phase alloys also plays a significant role in determining the corrosion resistance, although the critical limit may be much larger (e.g. ∼40 nm in the present work) for the critical size of less corrosion resistant heterogeneity. The passive film formed on the nanocrystalline alloys may experience localised defects along the grain boundary regions. It has been known that atomic arrangement of the grain boundaries varies with the grain size.12 This is due to lattice relaxation of small crystallites offering less stringent three-dimensional constraints on the grain boundary regions. Accordingly the grain boundaries may be more relaxed, adopting a relatively compact form and other lower energy configurations.12 A comparatively compact grain boundary in the underlying alloy may be responsible for an improved overlying passive film, comparable to the film formed on the grain interiors. This may be reason for better corrosion resistance of nanocrystalline alloys. The corrosion resistance may deteriorate above a critical grain size due to lower passivating ability of defective grain boundary regions. It has been shown in Fig. 3 that the grain size shows significant rise with the addition of 18%Ni in the alloy deposits. Hence, decrease in corrosion resistance of Zn–18Ni alloy in comparison with the coatings with a relatively lower Ni content seems, at least, partly to be related with a significant rise in its grain size.
Conclusions
Corrosion behaviour of nanocrystalline Zn–Ni alloys with 3-18 at-%Ni was studied in NaCl corrosive environment. In salt spray test, alloy coatings with 16 at-%Ni exhibited the highest ability to protect the underlying steel substrate, as the red rust (Fe hydroxide) was not seen even after a period of 75 h. Open circuit measurements showed that the corrosion potential of the alloys shifted towards positive values with the Ni content, with a very pronounced rise with the addition of 18 at-%Ni. The decrease in corrosion resistance of the alloy coating with 18%Ni seems primarily be due to a significant rise in its grain size.