
Abstract
High nugget effect gold veins are generally considered to be one of the most challenging of deposit types to evaluate and exploit. To potential investors and mining companies, they are viewed as high risk because of the associated uncertainties in the grade estimate and general paucity of reserves at production start-up. Despite the well-known risks, these deposits are often high grade and have a grade upside which makes them potentially attractive. The reporting of resource grade is of importance and perhaps even more so is the reporting of the associated uncertainty attached to the grade estimate. The quoting of the estimated grade within a grade range is recommended to achieve more complete and useful disclosure. The definition of the grade range can be somewhat subjective, ranging from opinion-based through to data-based estimates and geostatistical conditional simulation. Whichever approach is used, the over-riding issue must be the provision of enough data of appropriate quality and full disclosure to the public of relevant uncertainties.
Introduction
High nugget effect gold vein deposits are generally characterised by the presence of localised and erratic high grades intermixed with low grades (Dominy et al., 2000a, 2000b, 2003a). They typically possess a nugget effect of greater than 50% (Dominy et al., 2010). In addition, deposits are often characterised by the presence of coarse gold which leads to sampling challenges (Dominy et al., 2000a; Dominy and Petersen, 2005; Dominy and Platten, 2007; Dominy and Minnitt, 2012). High nugget gold veins are one of the most difficult of mineralisation types to evaluate. The higher the nugget effect, the higher the potential error during estimation. The randomness introduced makes prediction of un-sampled locations more difficult, with global estimates more reliable than local estimates (Dominy et al., 2010). During mining, discrimination between ore and waste will be challenging (i.e. mining to a cut-off; Dominy et al., 2010).
In most cases the preparation of a bankable feasibility study is extremely difficult, unless substantial underground development and associated close-spaced sample data are in place. As a result, it can often be challenging to raise funding. Funding may have to be based on an exploration target with forward looking economic models. Most projects require substantial capital investment as part of the pre-feasibility/feasibility process to develop underground and define the first few years of reserves. In other instances, bulk sampling or trial mining programmes will commence with very small or no reserves in the hope that development and diamond drilling will define more ore (Dominy et al., 2000; Dominy et al., 2008b).
To potential investors and larger mining companies, these deposits are viewed as high risk because of the associated low confidence in the grade estimate and general lack of reserves at start-up (Yuill, 1985; Pelham, 1991, 1992; Dominy et al., 2000b, 2003c). Such projects are usually owned by junior companies who do not have internal funding, and they need to raise capital to develop projects and ultimately to achieve a steady sustainable state. Despite the risks, these deposits often have a grade upside which makes them attractive. There is a need to match technically knowledgeable high risk profile investors with high reward potential projects requiring significant capital start-up risk. Globally there have been a number of such projects that have raised substantial capital, only to falter and/or fail. Whilst the reasons for the failures are multiple, the common thread is often related to poor resource estimation.
The inherent risk associated with the definition of Mineral Resources and Ore Reserves can be reduced by a strong understanding of geology and grade continuity (Pelham, 1991, 1992; Carras, 2001; Dominy et al., 1997, 2000b, 2003b; Dominy and Platten, 2008a; Platten and Dominy, 2009). Though this may come at a relatively high price in relation to the quantity of diamond drilling and potential underground development required. Many projects are brownfield-based, where there are particular challenges in the evaluation and integration of historical and modern data (Dominy et al., 2009a; Dominy and Platten, 2012a, 2012b).
This contribution summarises the challenges inherent in the grade estimation specifically of high nugget gold veins. It presents case studies that exemplify the use of an estimated grade supported by a grade range to provide better disclosure. The discussion does not include tonnage uncertainty, though this requires appropriate consideration.
Defining the nugget effect
The nugget effect is a quantitative geostatistical term describing the inherent variability between samples at very small separation distances; although in reality has a wider remit than just differences between contiguous samples. It is effectively a random component of variability that is superimposed on the regionalised variable, and is defined in a variogram as the percentage ratio of nugget variance to total variance (the sill). Deposits that possess nugget effect values above 50% and particularly above 75% are the most challenging to evaluate. The magnitude of the nugget effect relates to (Dominy et al., 2010):
geological or in-situ heterogeneity of the mineralisation
sample support (sample size – ‘volume-variance’)
sample density (number of samples at a given spacing – ‘information effect’)
sample procedures and quality
assay procedures and quality.
The nugget effect has two principal components (Pitard, 2007; Dominy et al., 2010); the geological or in-situ nugget effect and the sampling nugget effect. It should be noted that nugget effect is strictly nugget variance, where the geological/in-situ and sampling total variances sum to give the total nugget variance.
The geological nugget effect component relates to the microscopic differences in composition throughout the mineralised zone/domain (Dominy et al., 2003b; Dominy and Platten, 2008a; Platten and Dominy, 2003). This principally refers to the distribution of single grains or clusters of gold particles distributed through the ore to larger continuous zones (Dominy and Platten, 2007). Variability is most serious where there are small-scale, low continuity structures such as high-grade gold carriers within the main structure or vein-lets within wall rocks (Dominy et al., 2003b; Platten and Dominy, 2003). A clear indication of the geological nugget effect is where two halves of a drill core (e.g. on the centimetre-scale) are assayed and show order of magnitude or more differences in assay grades.
The sampling nugget effect component is related to errors induced by inadequate sample size, sample collection, preparation methods and analytical procedures. In some instances, the sampling nugget effect is the dominant part of the total nugget effect and reflects a high fundamental sampling error and non-optimal protocols (Dominy, 2007; Pitard, 2007; Dominy et al., 2010).
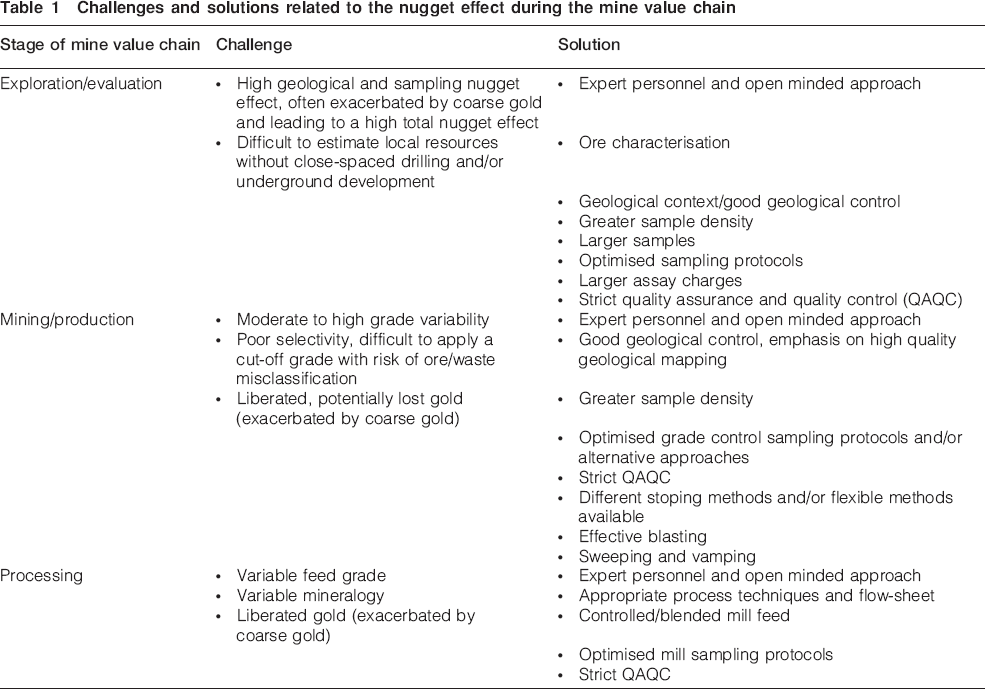
Some vein-gold deposits naturally have an inherently high nugget effect, which can be enhanced through poor quality sampling. The contribution of geological nugget effect and sampling nugget effect to the total nugget effect provides an intimate link between sampling and geostatistics (François–Bongarçon, 2004). Further discussion of the nugget effect is given in Platten and Dominy (2003), François–Bongarçon (2004), Pitard (2007), Dominy et al. (2010) and Table 1.
Challenges and solutions related to the nugget effect during the mine value chain
Nature of high nugget gold veins
Gold mineralisation style
High nugget gold veins are often narrow structures up to 4 m wide (Dominy et al., 1997; Sandy and Albrecht, 2012), though they may reach 10 m or more. Structures may comprise an individual vein or be made up of numerous individual veins forming a larger composite structure (Fig. 1). Additionally, high nugget veins may comprise bulk vein systems such as networks of cross-cutting veins (e.g. stockworks) or sub-parallel vein (e.g. sheeted vein complexes) systems. These are usually wider more complex structures ranging from 20 to 100 m in width.
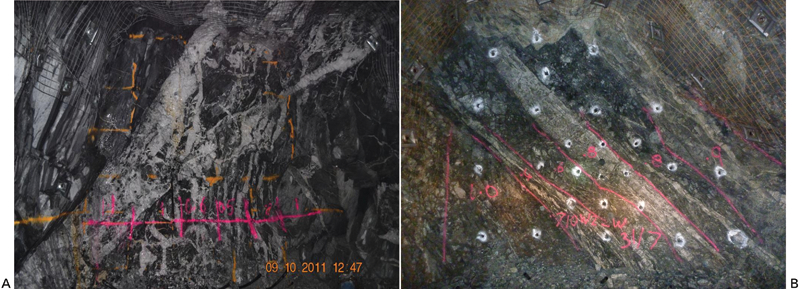
(A) West-dipping fault related lode at the Ballarat East Gold Project, Victoria, Australia. Photograph of the Sovereign Mako Lode system north-ore drive on the 549 m level. (B) Imperial Gold Mine, Charters Towers, Australia. Photograph of west ore drive on the 710 m level
Vein systems typically contain both barren and productive segments with gold grade varying laterally, vertically and across the body (Dominy et al., 2003b; Platten and Dominy, 2003). Vein formation generally has a complex and extended history, related to the emplacement of relatively barren and gold-rich vein elements at different stages. Although it is a comparatively easy matter to establish the geological continuity of the global structure by diamond drilling, the tracing of individual gold-rich veins or domains (e.g. local geological continuity) and determining their extent within the main structure (e.g. lode) is more difficult without underground exposure. This is accentuated when the gold distribution in the vein is erratic (showing a high nugget effect), as it may not be present in cores where the gold-carrying structure is intersected in a barren area.
Gold grade and distribution
Many high nugget veins are characterised by coarse gold in the size range >100 to 5000 μm hosted in quartz or sulphide minerals. In this case, they will be prone to both a high geological nugget effect and sampling nugget effect. Other deposits are typified by finer grained gold (<10 to 50 and up to 250 μm) that can be either quartz or sulphide-locked and which may possess a pod-like distribution leading to a high geological nugget effect.
Gold grade generally shows a strong positive skew with an excess of high values (i.e. extreme grades), though this is somewhat dependent upon sample support and density. Many datasets show evidence of multi-modal distributions, i.e. two or more superimposed populations which represent distinct populations of gold particles and/or phases of mineralisation (Dominy et al., 2008b).
Economic grades generally occur in discrete high grade ore shoots or vein arrays (Peters, 1993; Dominy and Platten, 2012a, 2012b). The highest gold inventory is often restricted to a specific period(s) of structural activity. This often results in the emplacement of discrete high grade vein domains and as noted previously exacerbates the geological nugget effect (Platten and Dominy, 2003; Dominy and Platten, 2008a, 2012a).
Challenges and resource risk
Resource risk comprises grade, geological and estimation risk. Significant risk relates to tonnage (geological risk) and grade (grade risk). Both geological and grade continuity (and variability) impact on both.
Grade risk is often greater than geological risk in high nugget systems, though the effect of the latter should not be understated. Grade risk is related to information that should be based on quality sampling and assaying data from drilling and/or underground development. In coarse gold systems, this may be difficult without specialised protocols. In many cases, bulk sampling or trial mining programmes are the best way verify grades by overcoming the nugget effect through the collection and processing of large (e.g. 100s to 10 000s t) samples (Dominy and Petersen, 2005; Dominy et al., 2008a).
Geological risk is related to the identification of economic volumes from both geological and grade data (i.e. drilling and/or underground development) and must consider continuity of both geology and grade at various scales. Challenges relate to the presence of the host structure with no mineralisation through to barren zones within mineralisation.
Estimation risk includes additional factors such as database quality, survey data, data density, bulk density and estimation methods.
In high nugget gold vein systems, the following resource evaluation characteristics are often observed:
relatively long geostatistical range and low-moderate nugget effect for the background gold mineralisation population
short geostatistical range and high-extreme nugget effect for the high-grade (coarse-gold) mineralisation population
relatively wide-spaced drilling (>30 m) likely to understate grade whereas dense close-spaced sample data (<15 m) may approximate grade
grade estimates are highly sensitive to grade distribution, sample support and type (e.g. volume-variance effect); data density (e.g. information effect) and estimation approach (e.g. sensitivity to top-cuts)
it may only be possible to define a global grade for each zone of mineralisation dependent upon data spacing
confidence in the tonnage is usually higher than confidence in the grade estimate.
These lead to challenges such as:
a vein and/or ore shoot may not have the contained gold in the mineable bodies with the shapes, sizes, grades and distributions expected
the boundaries and internal grade distribution of the defined bodies may not be correctly assigned ahead of mining, resulting in either/or excessive dilution and/or misclassification of ore as waste.
RESOURCE ESTIMATION AND REPORTING
Resource estimation
Initial consideration must focus on the appointment of an appropriate Competent Person as defined by the 2004 JORC Code (JORC, 2004). High nugget systems are a special style of mineralisation and it is critical that estimation is undertaken by a person or team with practical expertise.
Many gold veins are relatively tabular, narrow structures amenable to two-dimensional (2D) estimation approaches (Dominy and Annels, 2001; Dominy et al., 2006; Marcotte and Boucher, 2003). Others have larger dimensions, which makes the use of three-dimensional (3D) block modelling techniques more appropriate. The key considerations that must drive grade estimation are: data type, density and quality, grade and geological continuity, domaining, extreme grades, highly skewed grade population, and multiple grade populations (Dominy et al., 2003a). Further details of estimation methodologies are given in Annels (1991), Sinclair and Blackwell (2002), Dominy et al. (2003a) and Dominy and Annels (2001).
Wherever possible, geostatistical block modelling methods should be used to estimate grade (Dominy and Annels, 2001). Geostatistics is a powerful method for estimation, provided that it is applied correctly and in the light of strong geological understanding. The excuse given by many engaged in the evaluation of high nugget gold veins is that they are characterised by complex geology and grade distribution. Such deposits require careful geological interpretation, grade domaining and statistical study. It is true that variography in such conditions can sometimes be meaningless, particularly where drill spacing is wide rendering kriging difficult. If data are sparse or historical production based, geology discontinuous, and/or a high nugget effect is present then geostatistics may be less reliable than conventional methods or other approaches in some cases (Carras, 2001; Dominy et al., 2009a; Dominy and Platten, 2012b).
At the commencement of an evaluation programme, it is critical that the project team investigates the nature of the deposit. A holistic knowledge of mineralisation characteristics relevant to evaluation, mining, processing and environmental issues is required (orebody knowledge). If orebody knowledge is strong, then realistic expectations and likely risks can be defined and appropriate management strategies put into place.
Resource reporting
Approaches to resource classification are often based on the density and distribution of data (Annels, 1991; Sinclair and Blackwell, 2002; Snowden, 2001; Stephenson and Stoker, 2001). This is appropriate since the more data available in a deposit, the greater should be the confidence in the estimate. However, it is important that classification is not based solely on such parameters without due consideration of other factors such as data quality/integrity, geological and grade continuity (by inference deposit type), estimation methodology, mining method and reporting period (Snowden, 2001; Dominy et al., 2004). In some cases, estimation will be based on historical data which require careful consideration during estimation and classification (Dominy et al., 2009a; Dominy and Platten, 2012b).
Within a high nugget environment, surface diamond drilling alone is generally only able to define global Inferred Mineral Resources unless drill spacing is unrealistically tight (potentially <15 m). Underground development, closely spaced in-fill drilling and/or bulk sampling are needed to define local Indicated Mineral Resources and Probable Ore Reserves (Dominy et al., 2000b, 2003c). The definition of Measured Mineral Resources and Proven Ore Reserves is less likely, though is dependent upon the nature of the deposit, and data quality and density.
Reporting grade uncertainty
Background
The reliable estimation of grade in high nugget systems is often more problematic than for tonnage. Production costs can be between 40 and 70% of the mine site revenue, thus even a 15% decrease in grade can translate to a decrease in operating surplus. That translates to the bottom line in a cash flow sense and can generate an accounting loss depending on the proportionate level of amortisation and depreciation charges. It could also render a financially stretched project non-viable. Therefore the timely understanding and reporting of grade uncertainty through the mine development chain is clearly a key issue for any gold project.
Geological uncertainty
It must be remembered that there is an inherent geological uncertainty that will impinge on the tonnage estimate. The issues with tonnage estimation are founded in the definition of deposit geometry. A planar quartz vein with hard grade boundaries at its margins will be less prone to tonnage uncertainty than an irregular stockwork-style or en-echelon vein system.
Simulation of geology may be appropriate to account for lithological controls on mineralisation. For example, the distribution of gold grades is often controlled by quartz vein sets. Simulated models should incorporate all sources of uncertainty rather than simply grade uncertainty. In some cases, geological uncertainty may have significant economic significance. In vein gold deposits, accurate quantification of uncertainty relies on the ability to locate and define spatially the individual veins. In the absence of precise knowledge of vein geometry, the degree of uncertainty in the simulated gold grades may be significantly over-estimated or under-estimated if a deterministic geological interpretation is used to constrain the simulated grades (Richmond, 2012).
Resource estimation accuracy
Various workers have attempted to provide guidelines for the classification of resources and reserves based upon the accuracy of the grade and tonnage estimates. These are generally intended to be qualitative or intuitive by nature based on consideration of all the factors that might impact on confidence and uncertainty.
Snowden et al. (2002) provide an example of resource classification based on a quarterly basis (90% confidence) at ±10%; annually (70% confidence) to ±20%; and globally (50% confidence) at ±30% for the Measured, Indicated and Inferred categories respectively. Yeates and Hodson (2003) propose a scheme based on the 95% confidence level of ±25% (global deposit scale), ±15% (annual) and ±10% (annual) for the Inferred, Indicated and Measured categories respectively. Such schemes may well suit large bulk tonnage deposits, but are likely too strict for high nugget systems.
The boundary of the Inferred and Indicated categories is a foremost issue. If there is reasonable confidence in the geological model and of grade continuity, then the resource should potentially be in the Indicated category (Dominy et al., 2003b, 2003c; Dominy and Platten, 2008a).
The separation of the Indicated and Measured categories must consider two key factors, namely the quality of the estimate and the scale at which this quality needs to be defined. For example, a precision of 10% on a parcel of 5000 t does not represent the same precision as on 2 000 000 t. It is important to define the correct scale, which should be linked to production. As noted previously, a Measured tonnage is often quoted at a quarterly scale of precision ±10% (with 70% confidence), whereas an Indicated tonnage corresponds to one year production at a precision ±20% (with 70% confidence).
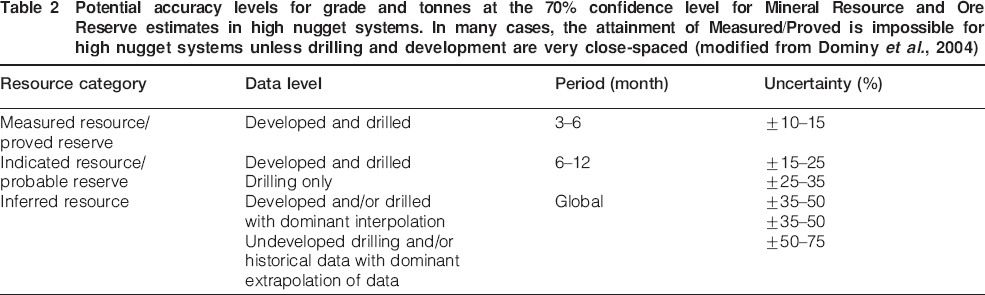
Accuracy ranges which may give appropriate levels of uncertainty for classification of high nugget mineralisation are presented in Table 2. Limits may be symmetrical, for example up to ±20% though are more likely to be asymmetrical (e.g. −20 to +5%) for gold deposits with extremely skewed grade distributions. The levels of accuracy can change depending upon the type of estimate and hence data density. Deposit type and variability (e.g. nugget effect and geological complexity) will have a very clear influence on attainable resource and accuracy levels.
Potential accuracy levels for grade and tonnes at the 70% confidence level for Mineral Resource and Ore Reserve estimates in high nugget systems. In many cases, the attainment of Measured/Proved is impossible for high nugget systems unless drilling and development are very close-spaced (modified from Dominy et al., 2004)
It should be noted that many projects go into production based on just an Inferred Resource and no Ore Reserves. In such a case, any economic assessment is necessarily preliminary.
The 2004 JORC Code reads: ‘Competent Persons are encouraged, where appropriate, to discuss the relative accuracy and/or confidence of the Mineral Resource estimates. The statement should specify whether it relates to global or local estimates, and, if local, state the relevant tonnage or volume. Where a statement of the relative accuracy and/or confidence is not possible, discussion of associated risk should be provided’. The Competent Person should give consideration to uncertainty in both the grade and tonnage estimates. There has long been criticism that resources and reserves are taken as fact and are used as such by some mining professionals, accountants and directors (Goldsmith, 2002). A resource and reserve estimate is just that – an estimate.
Reconciliation examples
Grade uncertainty is clearly a major concern with high nugget gold operations. In many cases the general pattern is for grade to be overestimated during a 12-month production period (Table 3). Global grades are generally estimated, which is an inherent issue of estimating within a high nugget environment and typical for relatively sparse drill data. Once underground development is present, it should be possible to estimate grade on a stope-by-stope basis (local estimate) to the Indicated/Probable categories.
Reconciliation data between actual production and reserve grade over a 12-month period for selected high nugget vein-gold underground operations. Scales of annual production range from 30 000 to 250 000 t. In all cases, problems with the initial resource estimate were identified as being the principal cause of poor reconciliation. In all cases, tonnage reconciliation was within ±20% of estimated tonnes
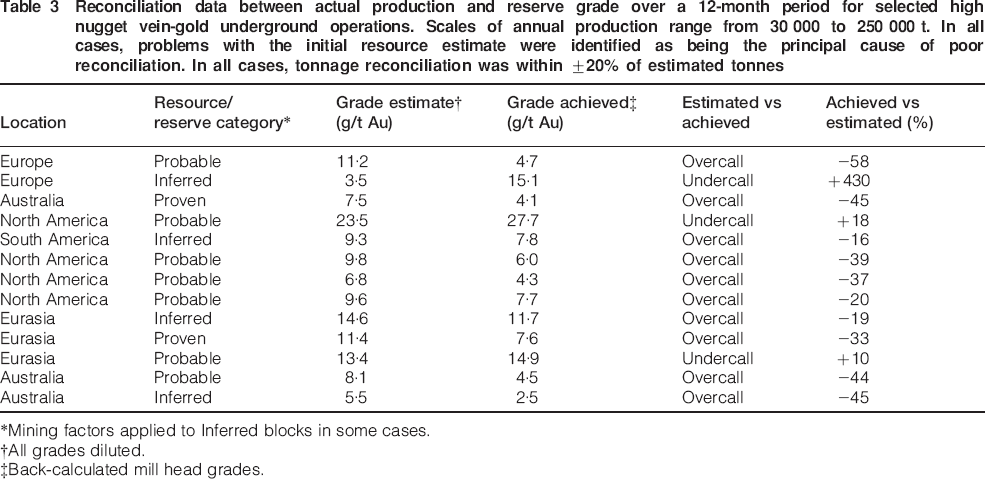
Mining factors applied to Inferred blocks in some cases.
All grades diluted.
Back-calculated mill head grades.
The key issues on which grade estimation is dependent upon are: data type, density and quality; data characteristics (e.g. skewness, extreme grades and nugget effect); and the estimation strategy used (including methodology, top-cut and search strategy). The poor reconciliations shown in Table 3 indicate that these issues are often inappropriately addressed.
As noted previously, reconciliation (or scale) period is an important factor. In high nugget system grades (and tonnages) over a 12-month period may reconcile reasonably well (±15%), whereas on a stope-by-stope basis (shorter reporting period of may be one month) can be highly variable (±50% or more). Reconciliation success is dependent upon data and resource quality, and the quality of data from the mill (Schofield, 2001). High quality grade control data are paramount for success (Dominy et al., 2009c; Dominy and Platten, 2012c).
Some operations considered that they had the confidence to define Proved Reserves (with reference to Table 3), yet their reconciliation could be as poor as −45%; an Inferred Resource quality. This is a typical problem seen by the primary author where reconciliation results are not being fed back into the estimation process. There are many deposits where reconciliation will always be challenging; in this case operators must learn to manage uncertainty. In some of the cases above, poor grade performance can be related to dilution, though estimation issues always existed. Where grade is overestimated, this usually reflects issues related to domaining, top-cutting and the search parameters applied (Dominy and Annels, 2001; Dominy et al., 2003a). In other cases, incorrect geological assumptions are made with respect to continuity (Dominy et al., 2003b; Dominy and Platten, 2008a).
Reporting grade uncertainty using grade ranges
In an attempt to be more open about grade uncertainty, a number of practitioners have suggested the use of the grade estimate quoted within a grade range to achieve more complete and useful disclosure (Johansen and Stephenson, 1999; Dominy et al., 2000b, 2006; Dominy et al., 2003c; Dominy, 2004; Edgar et al., 2008; Cahill and Cipriano, 2011; Edgar, 2011; CGT, 2011b). This practice should be applied more widely in the mining industry, not just for high nugget gold veins (Vallée, 2004).
The key issues are clearly the definition of the grade estimate and associated grade range. As noted previously, grade can be estimated by various techniques ranging from simple weighted averages to advanced geostatistical methods (Dominy and Annels, 2001; Jackson et al., 2003; Dusci et al., 2005). The definition of the grade range can be somewhat subjective depending upon the data available.
In this discussion, the grade range is applied globally to a given resource category, usually the Inferred category. However, ranges can be applied to the Indicated and Measured categories if appropriate. For the Inferred category the application is global, but for the Indicated and Measured categories where data density will be higher, a local application is likely. In the successful mining of high nugget vein systems, it is often the case that less tonnes are produced at a higher grade particularly where geologically-controlled selective mining (i.e. to a cut-off) is practiced.
Case studies
Ballarat East gold project, Victoria, Australia
Geology and gold grade distribution
The Ballarat East Goldfield is located in central Victoria, Australia. The project is operated by ASX listed entity, Castlemaine Goldfields Ltd (CGT). The goldfield extends over a strike length of 3 km and has produced 42·5 t of gold from underground sources during 1858–1918 at a mean head grade of approximately 9 g/t Au. Recent mining recommenced in late 2011, with the operation planning to produce between 40 000 and 50 000 oz Au annually.
Mineralisation occurs within Lower Ordovician sandstones, siltstones and mudstones that have been weakly metamorphosed and tightly folded about north-trending axes. The western limbs of the known anticlines dip approximately 70°W, eastern limbs 85°W to 85°E and fold axial planes dip approximately 80°W. The regional strike of the bedding is northerly.
The quartz veins are located predominantly within fold limbs in structurally controlled bodies (Edgar, 2012). Lodes are the prominent style (Fig. 1a) and are hosted in west dipping fault zones (e.g. the Llanberris Mako Fault Zone). Gold distribution at Ballarat is classic coarse-gold (often >1 mm in size) style with a high nugget effect, where grades over a few metres may reach 100 g/t Au or higher, but reduce to a few g/t Au out of the high grade.
Sampling type and density
The Llanberris Mako Fault Zone has been diamond core drilled (BQ and predominantly NQ2) on an approximate 20 to 25 m by 30 m pattern. Core was logged, cut in half and submitted for 2 kg LeachWELL analysis with the exception of pre-2010 assays, which were a mixture of fire assay, screen fire assay and LeachWELL. Recent production in-fill drilling is being full core sampled.
For the initial estimate, 52 holes were available and for the most recent update some 87 holes plus underground development were used. Underground face samples grades were not included in the estimate, but the experience gained from mapping was used to constrain the estimate.
Grade and grade range determination
A block model was constructed for the Llanberris Mako Fault Zone. The constraining mineralised zone wireframe was constructed from drill sections. Vulcan was used to estimate grade based in the inverse distance squared interpolator (IDW2) using 0·75 m composites. The footwall lode and makes (sub-horizontal stockworks) were estimated separately in order to honour vein geometry and drilling/sample data. A top-cut of 55 g/t Au is applied based on statistical analysis. Estimation was undertaken via a two pass ellipsoidal search.
The initial resource was reported in November 2011 (CGT, 2011b; Edgar, 2011; Dominy, 2011). The latest up-date was reported in July 2012. The resource is reported in accordance with the 2004 JORC Code ( Table 4 Tables 4 and 5).
Mineral Resources for the Llanberris Mako Fault Zone January 2012 (CGT, 2012a)
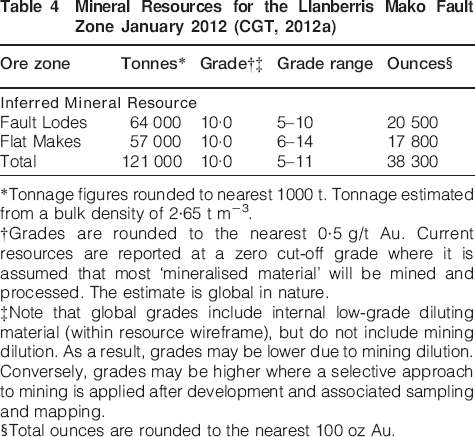
Tonnage figures rounded to nearest 1000 t. Tonnage estimated from a bulk density of 2·65 t m−3.
Grades are rounded to the nearest 0·5 g/t Au. Current resources are reported at a zero cut-off grade where it is assumed that most ‘mineralised material’ will be mined and processed. The estimate is global in nature.
Note that global grades include internal low-grade diluting material (within resource wireframe), but do not include mining dilution. As a result, grades may be lower due to mining dilution. Conversely, grades may be higher where a selective approach to mining is applied after development and associated sampling and mapping.
Total ounces are rounded to the nearest 100 oz Au.
Revised Mineral Resources for the Llanberris Mako Fault Zone July 2012 (CGT, 2012g)
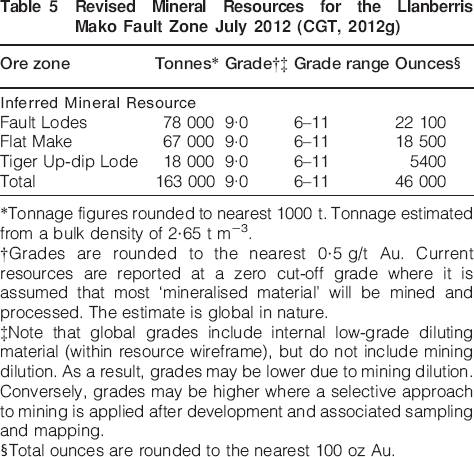
Tonnage figures rounded to nearest 1000 t. Tonnage estimated from a bulk density of 2·65 t m−3.
Grades are rounded to the nearest 0·5 g/t Au. Current resources are reported at a zero cut-off grade where it is assumed that most ‘mineralised material’ will be mined and processed. The estimate is global in nature.
Note that global grades include internal low-grade diluting material (within resource wireframe), but do not include mining dilution. As a result, grades may be lower due to mining dilution. Conversely, grades may be higher where a selective approach to mining is applied after development and associated sampling and mapping.
Total ounces are rounded to the nearest 100 oz Au.
A previous operator recognised a potential grade upside at Ballarat East, a feature typical of high nugget deposits in Central Victoria. They applied a global +25% factor to resource grades (Carnie and Cox, 2007). Their basis for the uplift related to relatively limited bulk sampling that identified fine and coarse gold populations in the reefs. The rarer coarse gold (>1 mm) was understated by sampling giving an upgrade potential. A grade range was effectively reported based on no factoring and 25% factor. Recent work indicated that an upside may exist, but could not be supported in the 2011 estimate where a more conservative approach was taken until production confirms any upside. Reconciliation of production ramp-up during July–October 2011 failed to reach predicted grades, thus conservatism was warranted (CGT, 2011a; Dominy, 2011).
A range was defined for each ore zone based on an opinion of likely expectation. A range of −50 to +15% has been applied. The low case of −50% is based on experience and the general expectation for the Inferred category. The up-side of +15% was based on recognition that high grade pockets may locally increase grade. Range grades were rounded to the nearest whole g/t Au.
Resource categorisation
Given the inherent geological and grade variability and data spacing, the resource was classified as an Inferred Mineral Resource (CGT, 2011b; Dominy, 2011; Edgar, 2011). CGT stated that it expects 70% of the resource to be mineable (e.g. payability), thus the upper grade range takes the likely upside into account (CGT, 2011b). Given that latter estimates have been supported by development and mining, detailed reconciliation is in progress to establish performance of the estimate on a more local scale.
Comment
The initial Llanberris Mako Fault Zone grade range was based on an experience-based view of likely variability. Since the release of the resource estimate in November 2011 (CGT, 2011b), further drilling confirmed mineralisation, often with visible gold (CGT, 2011c) leading to revised estimates in January (CGT, 2012a), April (CGT, 2012c) and July 2012 (CGT, 2012g).
CGT accessed the Llanberris Mako Fault Zone in late January 2012, subsequently extracting a 6640 t ore parcel at a back-calculated head grade of 7·7 g/t Au (CGT, 2012b). The grade from the first parcel was in line with the expected long-term average from the mine of between 7·5 and 8·5 g/t Au. The results achieved were above the block model, which predicted a grade of 4·1 g/t in the area mined (CGT, 2012b).
Additional resource updates were reported in April and July 2012 (CGT, 2012c and 2012g; Table 4 Tables 4 and 5), based on further drilling and experience of developing and stoping in Mako. The estimates were constrained by a revised geological model. Given the positive results of mining, a more conservative grade range of −40 to +15% was applied. This saw the lifting of the lower grade range from −50 to −40%.
During January–March 2012, 18 300 t at 9 g/t Au was produced and for April–June 2012, 46 520 t gave 9·2 g/t Au, yielding a total of 64 820 t at 9·1 g/t Au. This figure included 19 585 t from outside of the Mako structures (CGT, 2012d, 2012e, 2012f, 2012g).
In July 2012, CGT released a maiden Inferred Mineral Resource of 100 000 t at 8 g/t Au (for 25 700 oz Au) at a grade range of 4 to 9 g/t Au for the Mako lodes within the Britannia compartment north of Llanberris (CGT, 2012h). This estimate was based on drill holes only and a grade range of −50 to +15% was applied.
Cononish gold project, Scotland, UK
Geology and gold grade distribution
The Cononish gold–silver deposit is located in the Grampian Highlands of Scotland (UK), approximately 70 km north-northwest of the City of Glasgow. The vein was identified in 1985 and by 1990 had been defined by surface trenches, 14 km of diamond drilling and a 1·2 km exploration adit. The project was acquired by Scotgold Resources Ltd in May 2007. Full planning permission for an underground mine was granted in May 2012, with mine construction likely to commence in late 2012.
The Cononish gold-silver deposit is a steep, relatively narrow (up to 6 m in width and generally around 2 m) quartz-vein system. The northeast–southwest trending system was emplaced into late Proterozoic meta-sedimentary rocks, and postdates metamorphism and associated Caledonian Orogenic foliations.
Assay and mineralogical data show that gold and silver is spatially associated with sulphides in quartz. The main sulphide is pyrite, but galena, chalcopyrite and sphalerite also occur. Gold occurs as electrum, with minor native gold, and silver occurs additionally as tellurides and native metal. The gold-electrum is fine-grained, generally less than 100 μm in size.
The main ore shoots plunge 45° southwest, have a 40 to 80 m intersection with the existing underground development and extend between 40 and 260 m down plunge. Small-scale sulphide-bearing domains within the vein carry the highest gold grades. They collectively define the ore shoots, where one or two, and rarely three domains are present at an individual site in the vein (Dominy et al., 2009b). Discontinuity of individual domains, variation in domain thickness and internal heterogeneity results in short scale variation in grade across the structure (Dominy et al., 2009b).
The Cononish Main vein is not a coarse-gold dominated system, though is known to contain around 10–15% of 100 to 500 μm gold (Dominy et al., 2008c). It displays a nugget effect of around 75% based on variography along the exploration drive. Two structures are observed, one at 10 m and the other around 50 m. The short range accords with smaller high-gold grade sulphide-rich zones and the larger range with global vein continuity and a background gold grade (Dominy et al., 2009b).
Geological mapping along the 1·2 km exploration adit has provided critical conditioning data to support resource evaluation (Dominy and Platten, 2008b, 2010). In addition, it has provided an indication of potential challenges that could be encountered during production.
Sampling type and density
Evaluation is based on surface trench, diamond drill hole and adit face sample assays and logs, and underground and surface trench mapping data collected during the 1980s and 1990s. Data verification was undertaken as part of the 2008 resource estimate, including check sampling and review of core logs and mapping. Historical assays were via a wet chemical method, more recent assays via fire assay.
All drilling is surface diamond core (NQ), except for a few underground holes. During 1985 to 1990 and 2009 to 2010, a total of over 14 km of drilling intersected the vein. The average drill hole separation is around 50 by 50 m. Geological mapping and sampling (face channel samples at a 2 m spacing) was undertaken along the exploration adit.
Grade and grade range determination
The drilled areas of the vein were estimated using a polygonal method, and grades along the adit were estimated using a weighted averaging process in blocks projected up and down dip based on pay-runs above a cut-off. The estimate was undertaken via 2D projection of the drill holes and block outlines onto a vertical longitudinal projection. Blocks were constructed to honour interpreted ore shoot geometry.
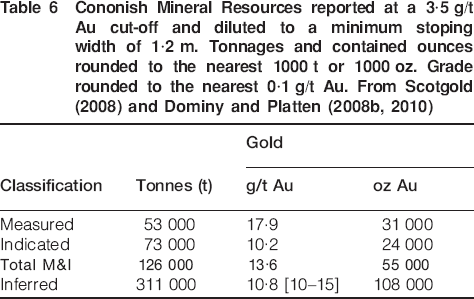
The resource was defined on the basis of a manually defined boundary defining the limit of drilling and development. Outside this limit the drilling grid is too sparse or absent to allow the definition of vein continuity. The 2010 estimate is given in Table 6.
Review of data led the Competent Person to consider that there is potential for increased local gold grade. This relates to areas of wide-spaced drilling where the drill spacing is insufficient to resolve small-scale geological and grade continuity, and where a historical wet chemical method (gold loss) has been used instead of fire assays (total gold) with a small under-call (<5%) of grade seen (Dominy and Platten, 2008b, 2010; Dominy et al., 2009b).
The primary indication of possible grade upside at Cononish was through the difference between the mean declustered sample grade from development (13 g/t Au) versus the mean declustered drill sample grade (9 g/t Au). Additionally, review of pay-runs (minimum of 10 m continuously above a 4·2 m.g/t Au cut-off) along the drive indicated local high-grade zones to 55% above the mean development grade. Mapping confirmed that high-grades were generally related to a gold-sulphide domain (Dominy et al., 2009b). Three 0·5 t metallurgical samples collected in 1995 also confirm a grade upside of 20% (ranging from 10 to 50%) compared with local face sample grades. These differences relate to the information effect, where development grades are derived from close-spaced samples (every 2 m) compared with the drilling on a 50 by 50 m spacing.
Comparison between drive and drill hole geology confirmed the identical nature and specific niche high gold-grade sulphide-rich zones (Dominy et al., 2009b). The Inferred Mineral Resource grades were reported with a conservative upper grade range of +40%. A payability factor of 80% was applied to each Inferred resource block as a conservative measure. The payability factor was defined from the close-spaced adit sample data. The global resource was reported at a 3·5 g/t Au cut-off.
Resource categorisation
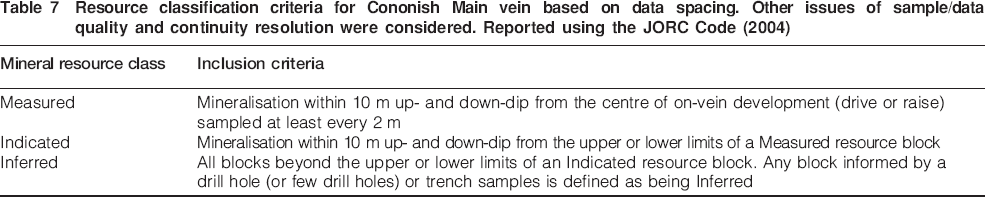
The resource was classified into the Measured, Indicated and Inferred Mineral Resource categories on the basis of the manually defined boundary defining the limit of the drilled and developed area. The classification criteria applied are given in Table 7.
Resource classification criteria for Cononish Main vein based on data spacing. Other issues of sample/data quality and continuity resolution were considered. Reported using the JORC Code (2004)
Comment
The grade range at Cononish is based on comparison between drill hole and development data. Geological interpretation showed that both datasets represented the same mineralisation, where the close-spaced development samples better resolved grade variability. The presence of the exploration adit was critical in allowing the comparison. The grade range was only applied to the drill-based Inferred resource.
Eurasian case study
Geology and gold grade distribution
The deposit is a mesothermal system comprising a series of sub-parallel, moderate to steeply dipping 1·5 to 6·0 m wide (average 2·5 m) gold-quartz-sulphide reefs. The host fault structures are continuous over 2 to 4 km, with quartz-mineralised segments continuous for up to 500 m along strike. Annual production is about 200 000 t from an underground operation utilising shrinkage and longhole stoping methods.
Mineable grades are localised within structurally controlled high-grade ore shoots that are continuous along strike for between 50 and 100 m, and over 300 m down-dip. These shoot zones are related to bends and/or splays within the hosting structure. Mineralisation is dominated by coarse gold (>60% +150 μm), with some 80% being gravity recoverable. Gold grade within the ore shoots is erratic, with closely spaced samples potentially returning grades that are different by 100s g/t Au.
At the time of estimation (mid-2006), three quartz reefs contain the metal inventory hosted in four oreshoot zones. This case study covers the largest oreshoot (the A Zone), which contained an Inferred Mineral Resource of 585 000 t at 27·5 g/t and an Indicated Mineral Resource of 225 000 t at 24·4 g/t Au.
Sampling type and density
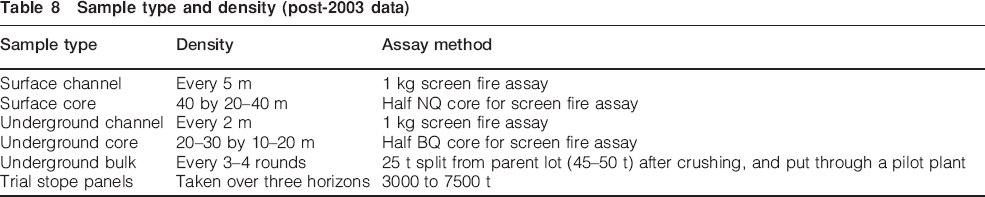
Various sample types were collected during the project feasibility study ( Table 8 Tables 8 and 9). Early data (pre-2003) associated with the project were of variable quality (e.g. poor core recovery and no QA/QC system in place) and were clearly likely to increase sampling and thus estimation error through a high nugget effect. During more recent activities (post-2003), full QA/QC programmes were put into place to ensure a quality database. Some earlier data were used in the resource estimate, having been validated by check sampling.
Sample type and density (post-2003 data)
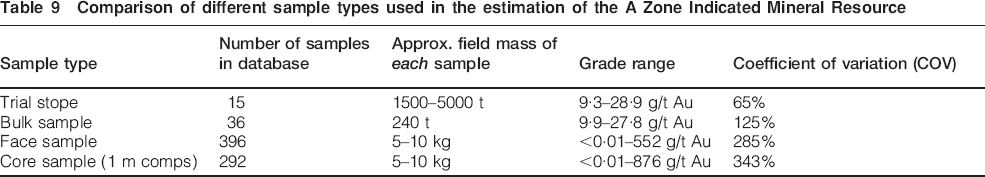
Comparison of different sample types used in the estimation of the A Zone Indicated Mineral Resource
Grade and grade range determination
The grade and grade range estimates were based on a combination of diamond drilling, face sampling and blocking-out by underground development accompanied by bulk sampling (Table 9).
Bulk sampling and trial mining, supported by limited close-spaced diamond drilling was used to estimate Indicated Resource blocks. The stope block grade estimate was determined by bulk sampling. The bulk-samples were based on composites of individual drive rounds developed peripherally to the block. Each stope grade was estimated from the composite bulk samples representing the two bounding drives.
All development was geologically mapped and chip-channel sampled on a face-by-face basis. Preliminary variography using the face samples along strike revealed a nugget effect of 79% and a short-scale geostatistical range of 11 m. In the strike direction, the current drill spacing is not close enough to resolve gold grade.
Where diamond drill holes pierced the block under assessment, their grades were used to support grade estimation, providing confidence that the structure was present in the block core and away from peripheral development. Even if core samples did not record anomalous gold grades (e.g. above 1 g/t Au), the data still provided confidence in grade potential, providing the quartz was well-mineralised (e.g. contained sulphides) and showed laminations.
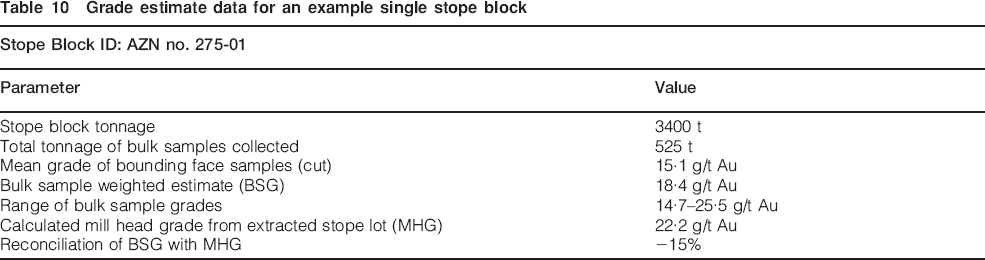
An example trial stope comparison is given in Table 10. The initial stope estimate allowed for planned and intentional mining dilution, so figures were comparable to the final mill head grade figure. In this case, the estimated grade from bulk samples was −15% of that from mining. In most cases (75%) the bulk sample estimated grades were within ±20% of the reconciled trial stope grades and all reconciliations (e.g. 100%) were within ±45%. Reconciled tonnages ranged from 1500 to 6000 t.
Grade estimate data for an example single stope block
The Inferred Mineral Resource grade was based on a 2D top-cut inverse distance squared block model using 15 by 15 m blocks. The dominant data type used was drilling, with some face samples where proximal development was present.
The grade range for the Inferred Mineral Resource was based on the mean range of bulk sample grades for a series of drilled and bulk sample blocks (Table 11). This recognised that the grade variability is likely to be asymmetrical, with a negative bias. The Inferred Resource was based on widely spaced data that did not effectively resolve grade continuity (Table 12). Continuity of grade in the lowest development horizon (i.e. Indicated Resource) provided some confidence in the upper section of the Inferred Resource.
Mineral Resource and Ore Reserve grade estimate. Reported at a 5 g/t Au cut-off for underground mining. Block model diluted to an underground minimum stoping width of 1·5 m
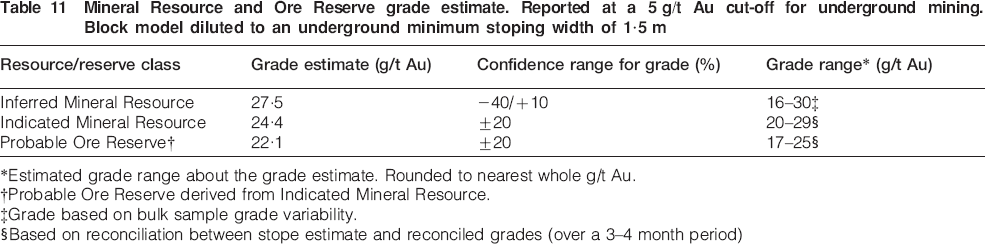
Estimated grade range about the grade estimate. Rounded to nearest whole g/t Au.
Probable Ore Reserve derived from Indicated Mineral Resource.
Grade based on bulk sample grade variability.
Based on reconciliation between stope estimate and reconciled grades (over a 3–4 month period)
Mineral Resource and Ore Reserve categorisation criteria
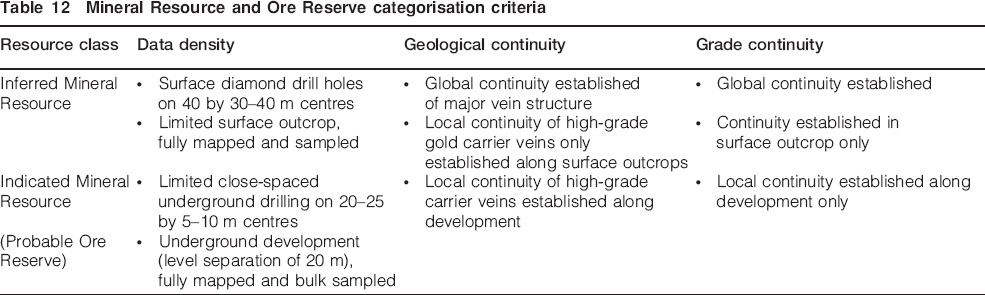
Resource categorisation
The definition of the resource categories was dependent upon the data density and how well grade and geological continuity are resolved (Table 12). As a result of the risk attached to the grade estimate, Measured Resources (and hence Proved Ore Reserves) were not defined even when underground development was present. This approach was in line with many high nugget systems where, even with underground development there is still substantial uncertainty attached to the grade estimate (Dominy et al., 2000b; Dominy et al., 2003c). The critical issue is in the resolution of grade continuity within the quartz reefs, because gold is erratically distributed and cannot be effectively predicted between levels.
Comment
The project grade range was based on bulk sample and trial mining data. The Inferred range used the variability shown by a series of bulk samples, whereas the Indicated range utilised bulk sample and trial mining reconciliation data. Production since 2006 has confirmed the grade range estimates, with Probable Ore Reserves generally (∼85%) reconciling to within ±20% over a 3-month period (50 000 t production). The approach has continued, but no longer includes routine bulk sampling. Some 75% of the Inferred Resources are upgraded to Indicated Resources on development.
Australian case study
Geology and gold grade distribution
The deposit is a vein-gold style shear-zone system displaying a strong structural control on grade distribution. Mineralisation is related to a regionally continuous shear zone hosted in mafic rocks. The steeply dipping high-grade zones are characterised by a core of massive mineralised silicified host rock (0·5 to 3 m wide), surrounded by a mineralised alteration halo up to 10 m in width. Grades are located within steeply-plunging ore shoots that coincide with the massive quartz zones. The ore shoot domain contains a quantity of coarse gold (∼25 to 35% >100 μm to a 1500 μm maximum).
An open pit extracted ore from the oxide zone and exposed the upper part of the primary zone. Pit mapping revealed that the highest grade mineralisation was often hosted within narrow en-echelon vein pods that were continuous for no more than 15 m in any direction.
Sampling type and density
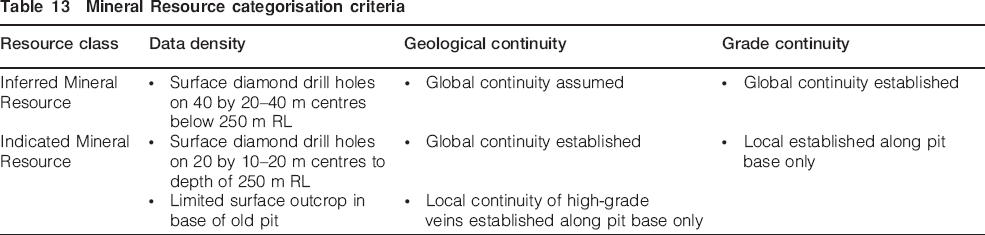
Diamond and a few RC drill holes form the database below the pit base (Table 13). The data density reduces with depth by about half. The upper section of the Indicated Resource is partly exposed in the base of the open pit. Along this zone, grade and geological continuity are resolved through mapping and grade control drilling.
Mineral Resource categorisation criteria
Grade and grade range determination
Block modelling consistently estimated a grade below the reconciled grade for the primary zone at the base of the open pit (typically −20 to 30%). This reflected the fact that the high-grade pods were not being resolved by drilling. The lower-grade background mineralisation associated with strong alteration was being resolved effectively.
Background
As a result, it was decided to undertake conditional simulation to investigate grade variability. It was hoped that by using a combined data set of resource definition and grade control drilling, it would be possible to gain results that would reflect the grade of the data whilst honouring the deep resource drilling. This aim could be achieved by using a histogram of the combined data to condition the simulation. Since the resource below the pit base was relatively poorly informed by drillholes, conditional simulation would permit the quantification of resource risk through the application of confidence levels around the expected mean grade.
The issue with the pre-existing resource estimation was that top-cutting lead to a reduction in the metal inventory, and if no top cutting was undertaken, then smearing resulted in a metal inventory that was too high and spatially dislocated.
Conditional simulation
Variograms were computed for the composite Gaussian transformed values. The data indicated that a small-scale structure is present. This reflects the presence of the higher-grade quartz-rich core zone with en-echelon vein pods. A second structure is some 3·5 times the range in the principal direction to that observed in the short structure. This indicates a geometric anisotropy with greater continuity of oreshoot along the direction of the mineral lineation and less continuity perpendicular to it. This structure represents the more continuous lower-grade mineralised alteration zone.
The nugget effect was determined from the down-hole Gaussian variogram, with back transformation into non-Gaussian space giving a nugget value of 70%.
Spatial analysis of gold grade revealed that a border effects model existed. This is effectively a situation where the highest grades are towards the centre of the system, and decreasing grade towards the edges. This is wholly consistent with the presence of high-grade ore shoots with the core zone containing the en-echelon pods. The Gaussian-based Turning Bands Method of simulation was chosen (Chilès and Delfiner, 1999). The Turning Bands Method technique requires that data be transformed into Gaussian space and that variograms of these values be defined. Conditional simulation was then performed and the resulting values back-transformed into original non-Gaussian space producing original values.
A 2 by 2 by 2 m grid was selected for the simulation, which would provide a good reflection of grade variability after regrouping into selective mining units. Each grid node within the orebody wireframe was simulated 100 times using 300 turning bands. The simulated points (nodes) were regrouped into 4 by 2 by 8 m blocks, i.e. a maximum of 8 points were used to define a selective mining unit average grade.
The orezone was divided into two domains representing the upper denser drilled region, versus the lower lesser-drilled region. The results from averaging the 100 simulations were used to define the global grade and tonnage for each domain. In this instance, the results are better than the original estimate since there has been no top cutting of grade. The Gaussian transform effectively reduces the effects of the extreme grades.
Grade uncertainty
The average of 100 simulations was taken as the mean grade and the global resource grade ranges were determined from the mean ±1·28 standard deviations, the 80% confidence level for each resource domain (Table 14).
Mineral Resource grade estimate and variability. Categorisation criteria are given in Table 13. Reported at a 4 g/t Au cut-off and diluted to an underground minimum stoping width of 2 m
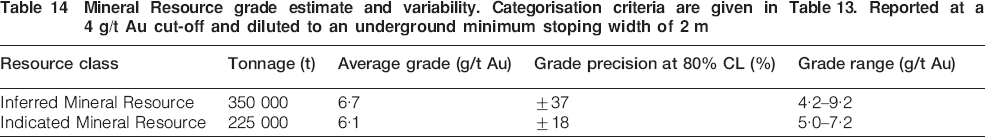
The Inferred zone is insufficiently drilled, resulting in high grade-variability (Table 14). In the case of the Indicated Resource, whilst the variability is relatively high, resolution is clearly improved and to potentially within the precision expectation for an undeveloped drill Indicated Resource (Table 2).
Comment
This case study included data on a spacing of less than 40 m and down to 10 to 20 m. Conditional simulation was used to estimate a grade range for Inferred and Indicated resources. The presence of a previous open pit operation provided important information. Geological reinterpretation, based on core re-logging and review of former grade control data and mapping, affirmed that high-grades were hosted within en-echelon pods, thus validating the simulation results.
Discussion
This contribution discusses approaches to quantify grade uncertainty principally for Inferred Mineral Resources. Such resources are usually global in nature and suffer from high uncertainty when cut-off grades are applied, unless geostatistical recoverable resource methods are applied.
The challenges of estimating grade in these high-grade deposits are well-defined; however, the issues related to raising capital for development are also important. If operators and owners devote effort into understanding the deposit, particularly continuity and sampling issues then uncertainty may be better understood. Fuller and more transparent disclosure of all the relevant issues can only be positive. This may position the company concerned to raise capital, particularly if an upside can be clearly demonstrated. Understanding and potentially lowering resource risk and uncertainty must be based on a holistic approach, where all aspects of the orebody are included.
Four case studies at different stages of mine development are presented that use three approaches to define a grade range (Table 15). These include experienced based; conditioned by development data (e.g. face sampling and/or bulk samples); and via conditional simulation from drilling data.
Summary of case study project Inferred Mineral Resources
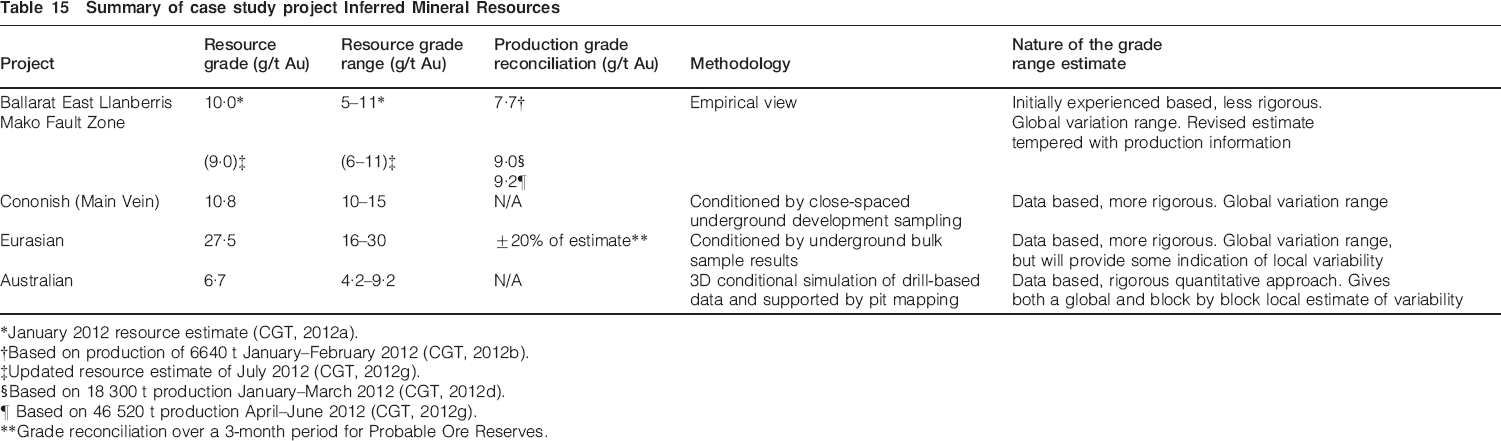
January 2012 resource estimate (CGT, 2012a).
Based on production of 6640 t January–February 2012 (CGT, 2012b).
Updated resource estimate of July 2012 (CGT, 2012g).
Based on 18 300 t production January–March 2012 (CGT, 2012d).
¶ Based on 46 520 t production April–June 2012 (CGT, 2012g).
*Grade reconciliation over a 3-month period for Probable Ore Reserves.
Where conditional simulation is used, the grade range has some rigour. In addition, the simulation approach allows the spatial and local distribution of variability to be investigated. It is possible that higher grade variability may related to a specific zone(s) of mineralisation that, for example may have a higher grade and bear more small-scale variation and/or bonanza gold grades. As always, the data density will control the resolution of variability.
The other methods suggested in this contribution show less rigour mathematically, being based more on Competent Person opinion tempered by orebody data. It is however the view of the authors that any defendable grade range is better than none. The Competent Person signing-off on a high nugget estimate should have expertise to define a range, if not, then perhaps they are not competent to report.
Footnotes
Acknowledgements
The operating companies of the Australian and Eurasian case studies are thanked for their permission to publish within the restriction of confidentiality agreements. Thanks are due to the AES reviewers and Editor, Professor Neil Phillips for helpful reviews of the manuscript. An early version of this paper was presented at the Project Evaluation Conference 2012, and is published in its revised format with permission of The AusIMM. The opinions expressed in this paper are those solely of the authors and not necessarily those of the named organisations.